
Abstract
Pulse compression methods improve the quality of ultrasonic medical images. In comparison with standard broadband pulse techniques, these methods enhance the contrast-to-noise ratio (CNR) and increase the probing depth without any perceptible loss of spatial resolution. The Golay compression technique is analyzed here in the context of ultrasonic computed tomography, first on a one-dimensional target and second on a very low-contrast phantom probed using a half-ring array tomograph. The imaging performances were assessed based on the image CNR. The improvement obtained (up to 40%) depends, however, on the number of coherently associated diffraction projections. Beyond a certain number, few advantages were observed. Advances in ultrasound computed tomography suggest that pulse compression methods should provide a useful means of optimizing the trade-off between the image quality and the probing sampling density.
Introduction
Ultrasound methods of examination provide a useful complement to standard X-ray mammography for detecting and characterizing millimetric abnormality in breast. The principle of ultrasonic computed tomography (UCT) using a circular ring array1,2 makes it possible to probe a slice of the object under all possible incidences and diffraction angles. UCT can be used to determine parameters such as the reflectivity in the reflection mode 3 and the wave velocity and attenuation in the transmission mode. 4 With UCT methods, which focus solely on the field backscattered by the constitutive tissues, the information restituted by the wave during its propagation is used to detect any spatial changes in tissue composition. It therefore integrates more redundant information about the spatial distribution, that is, about the morphology of the breast under investigation and about the possible presence of very weak fluctuations in the acoustical parameters. Diffraction tomography therefore lends itself particularly well to early breast cancer detection.5-10
The more the frequency of the wave increases, the more its propagation will be adversely affected. The use of lower frequencies than usual (down to 3 MHz in the case of clinical examinations) therefore provides an effective alternative approach, especially when large organs have to be imaged. The wave propagation process generates complex signals which are often difficult to interpret. This decreases the separating power and hence the quality of the tomographic images (their contrast and resolution). Previous studies have focused on the pre-processing of the signals with a view to improving the quality of the tomograms obtained. Several approaches have been used for this purpose, such as filtering, spectrum analysis, and deconvolution techniques. 11 The main drawback of all these rather sophisticated and unstable methods is their heavy computational cost, which is liable to be incompatible with automatic real-time processes where a large number of data have to be processed. Although there exist optimized, 12 fast,13,14 and adaptive 15 methods, the algorithms involved are often far too noise dependent and unstable when dealing with redundant measurements.
The alternative method presented here consists in using large time-bandwidth-transmitted signals to assess the potential of the Pulse Compression Technique (PCT). The coded waveforms initially used in radar and sonar have been applied to ultrasonic imaging and in other non-destructive frameworks since the 1990s. PCT enables an ultrasonic system to operate with long transmitted pulses in a larger detection range without any loss of lateral resolution, while the axial resolution is still comparable with that of standard broadband pulse techniques. 16 The main advantage of this approach in the medical field is that it improves the signal-to-noise ratio (SNR) and the dynamics of the images without increasing the transmitted intensity according to medical index threshold.
In short, PCT uses codes (dedicated sequences of numbers) that, after filtering and combining, yield another sequence with higher mainlobe-to-sidelobe ratio. These codes are named compression codes if the code energy is squeezed into a short time interval with little or no sidelobes by appropriate filtering. In single-transmit codes, a single-code sequence has the desired compression property; but in multiple-transmit codes, two or more sequences are combined to achieve compression.
The decoding filter which serves to compress the code energy is often a matched filter as it optimizes the detection SNR (defined as ratio of the received pulse energy and the noise variance). Given the code waveform, the matched decoded filter (under white noise assumption) has the conjugated time-reversal waveform as time response, which results in an autocorrelation at the filter output. The SNR improvement achieved by coded excitation is given by the time-bandwidth product, which is the product of pulse duration and its bandwidth. Although single-transmit codes always will have range sidelobes, Golay codes with two transmits are designed to cancel sidelobes totally.
Pulse compression is obtained first by transmitting suitable waveforms. Random or pseudorandom codes such as the Barker code, m-sequences, and pseudo-chirps are often used for this purpose. With pseudo-chirps, for example, the SNR increased by about 15 dB in soft tissues, as reported by O’Donnell, 17 and by about 12 to 17 dB down a depth of to 25 cm depth, as determined in a simulated experiment. 16 Backscattering measurements performed on thread phantoms (attenuation: 1 dB/MHz/cm) at a frequency of 4 MHz improve the penetration depth by 7 to 10 cm. 16 However, problems inherent to excitations of this kind, called self-noise or range sidelobes, tend to arise when finite integration times are used to approximate the signal correlations. To reduce the self-noise level, a set of complementary binary codes known as Complementary Golay Sequences 18 (CGS) was tested in the present study.
When applied to highly energy-absorbent materials in the context of non-destructive testing 19 in their original binary forms (chip or bit elements), CGS improve the SNR by 30 dB on average. In the ultrasonic imaging framework, the simulated transmission of two chips per sequence yielded SNR values, which were twice as high as those obtained with a single-chip transmission having an equivalent spectral band and energy. 20 When chips were replaced by cycle-sines, the sonographic images obtained by Nowicki et al. showed a threefold improvement in the SNR. 21 Under experimental conditions, the theoretical compression power decreased as reported by Nowicki et al. 22 as the result of the narrow transducer bandwidth. 20 Based on the comparisons between various excitation sequences in the case of several applications (trabecular bone attenuation, 23 transmission through soft tissue 24 ), CGS was given a favorable rating. However, the use of CGS requires the transmission of two distinct sequences, 25 which increases the complexity and the cost of the electronics as compared with traditional pulse systems. The specifications of our imaging system 26 made it possible to implement PCT using CGS based on a one-cycle sine per element in each sequence. In this paper, the compression is performed after the data recording stage as a pre-processing procedure, before the tomographic reconstruction.
The aim of this study was to investigate the potential of CGS-based PCT for tomographic imaging purposes. In addition, the fact that the redundancy of the information is greater in the central region implicitly compensates for the dissipative phenomena occurring during the ultrasound propagation and therefore provides amplification equivalent to Time Gain Compensation (TGC). To satisfy the theoretical constraints imposed by the near-field reconstruction procedure,
27
the use of isotropic point sources is required. In practice, this means that the pitch has to be smaller than the half-wavelength (e.g.,
CGS show up some quite interesting properties, which can be assessed throughout the tomographic process implemented on the device of the Laboratory of Mechanics and Acoustics (LMA). In the first section, the electrical response of the transducer is presented and integrated into the overall electroacoustic transfer function. “Materials and Method” section consists first in the temporal properties determination of the compressed signal from the PCT with CGS and with a conventional pulse and second in the determination of the transmitted energy with the respective excitations. Next, a linear target is employed to evaluate the practical temporal resolution and the SNR of the projections. Finally, a very low-contrast phantom with a weak attenuation has been manufactured for the tomographic reconstruction. A typical acquisition procedure was done 26 giving a high number of projections spread on the 190-degree transducer array. Then results show up the enhancement of the image contrast when the PCT is employed to a variable redundancy of the coherent information. More precisely, the numbers of backprojections is voluntarily degraded to evaluate the interest in the use of the PCT in the case of a sparse transducer array or in the case of a rapid reconstruction with a small number of data. In that purpose, a comparison relying on the contrast-to-noise ratio (CNR) calculation is done between a conventional pulse and PCT-based tomograms.
Materials and Method
Formalism of the Complementary Golay Codes
In this study, the complementary codes are 16 elements long and both are defined in Table 1. The employed element of sequences was not a chip but a one-cycle sine at 3 MHz. The phase of the sine was π for the −1 value, and in the case of +1 value, the sine phase is 0. The complete formalism was carefully presented in Nowicki et al.
29
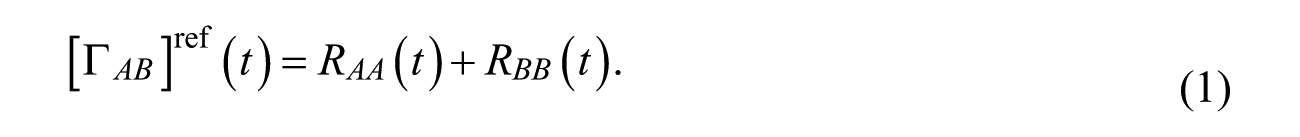
Here, the length of the Golay’s sequences is n = 4; subsequently each resulting sequence has 16 elements consisting in 16 sine periods giving two 5.38-µs continuous excitations (432 samples per code when sampling at 80 MHz). Table 1 presents the binary sequences defining the described alternation in one-cycle sine phase. When no object is immersed, without taking the electroacoustical filtering into account, the output reference signal can be written as the sum of the two autocorrelations in terms of sequences

Complementary Golay Sequences with
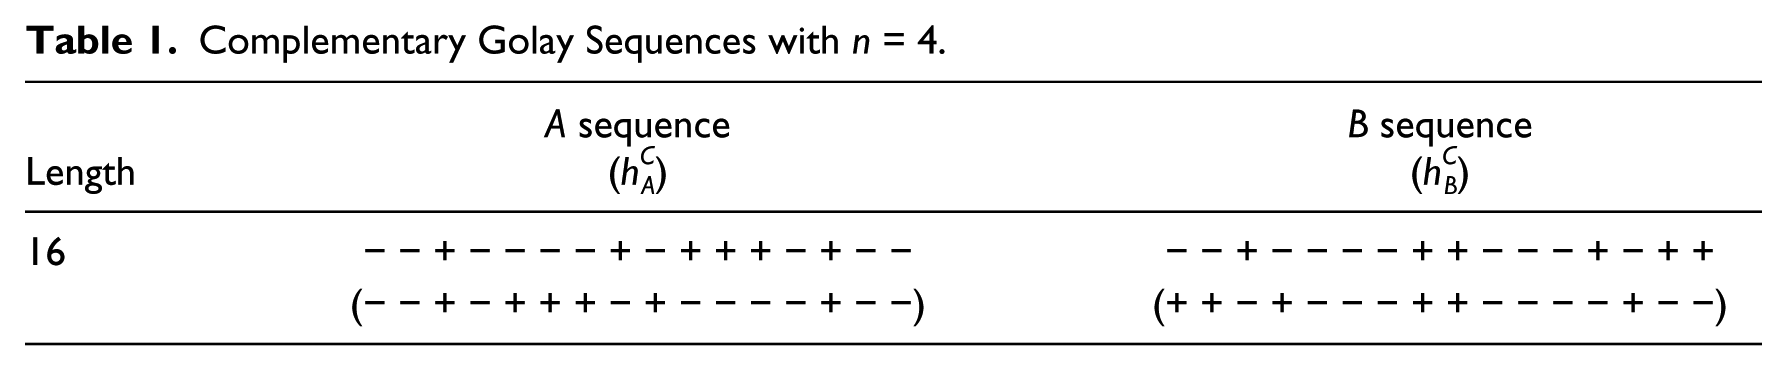
Figure 1 shows the procedure used to obtain the output signal.
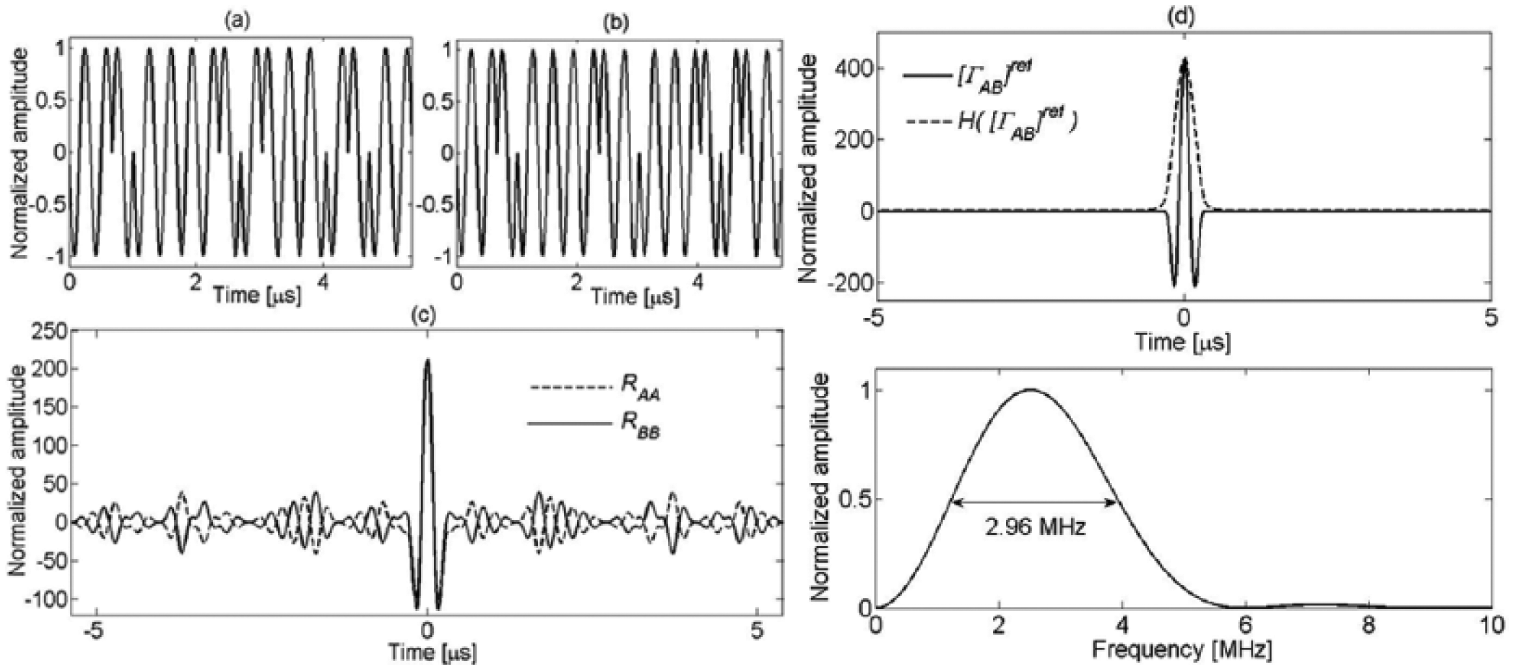
Procedure used to obtain Golay sequences. A(t) and B(t) sequences are presented in (a) and (b), respectively. The corresponding autocorrelations
The Ultrasonic Electronic Scanner
The main working assumptions adopted in this study were that the object and the coupling medium (water) are homogeneous fluids, and that only pressure waves are transmitted through water and through the object (no shear waves are taken into account). The ultrasonic sound speed is taken to be constant and independent of the frequency, so that these non-dispersive waves travel along straight paths. The acoustic attenuation is neglected in the derivation (TGC) and only propagation processes are taken into consideration. The main topics addressed in this paragraph focus on the time resolution and the dynamics of the compressed signals. It has been established that diffraction tomography is relevant in the case of weakly inhomogeneous media. 30 The algorithm used in the tomography method was based on the filtered elliptic backprojection algorithm and is detailed in Mensah and Franceschini. 27 The data used for tomography are the corrected radio-frequency (RF) sequences (time and gain) corresponding either to the pulse echograms or to the compressed sequences of the scattered waves measured in diffraction. The image obtained was a qualitative map where the gray level was not related to a well-defined physical parameter; it corresponds to the reflectivity of the scatterer, which is a band-pass and spatially (transducer directivity function) filtered version of the local impedance. Its use requires a sufficiently high density of point sources, each of which must be able to transmit an isotropic inspection field. The basic procedure used to reconstruct the image consists in summing the elliptical backprojections acquired from pairs of elements (i.e., a transmitter and a receiver) in the tomographic array. Experimental measurements were performed using the tomographic imaging system. A complete description of the device having the properties summarized below can be found in Rouyer et al. 26 The imaging system includes a half-ring array (radius: 100 mm) comprising 1024 active elements (nominal frequency: 3 MHz). The transducer elements, which are 20-mm high and 0.32-mm wide, are equally spaced with a pitch of 0.34 mm. Acquisition configurations are driven using Field Programmable Gate Arrays (FPGAs). Thirty-two channels work in parallel and each channel is allocated electronically using a 32 to 1024 multiplexer; each channel includes an arbitrary-function generator with a 1- to 10-MHz bandwidth. The receiving and transmitting circuitries operate at a sampling frequency of 80 MHz on 12 bits.
The following acquisition procedure described in Rouyer et al. 26 is summarized here. A single-transmitter element is activated to produce a cylindrical wave front. In the reception mode, a set of 32 adjacent elements forms a 5.94-degree finite-aperture receiver. The transmitting element is placed in the central position of the element set - the number 16 - and the synthetic receive aperture is carried out by both the transmitter and the adjacent elements: on the left side from positions number 1 to 15, and on the right side from positions number 17 to 32. To make full use of the array, the transmit/receive procedure is repeated along the array with a 0.186-degree step (corresponding to an element pitch) from the 16th to the 1008th element of the array, and a collection of 31,776 projections is recorded.
It is commonly admitted that increases in the number of the backprojection in the reconstruction algorithm increases the general quality in the resulting images. However, there is a lack of information in literature about it and this could be due to the large variation in apparatus and in signal signature (transducer bandwidth, media attenuation, electronic noise). To evaluate this point with the employed system, the width of the backscattering aperture (i.e., number of projections) is decreased. Four sets of projections were selected: [i] the pure reflection of the same transducer element acting in transmission and in reception (993 signals), [ii] 4 adjacent elements including and around the transmitter (3972 signals), [iii] 16 adjacent elements including and around the transmitter (15,888 signals), and [iv] the 32 adjacent elements as described above (31,776 signals). The interest of limiting the element density in the tomographic framework is developed in the final discussion; it is especially valuable when three-dimensional (3D) volume reconstruction is desired.
Operational Bandwidth Limitations
As the electroacoustic apparatus and the propagation medium act as continuous linear stationary causal filters, the electric input

where
Let us take the case of an object corresponding to an infinite plane such as a water/air interface, where ultrasonic echoes resulting from pure reflection on this interface can serve as the reference acquisition. The response of this interface

In addition, under the assumption that the transduction is reciprocal, if the electric input signal is a pulse, equivalent to a Dirac distribution in first approximation (

To define
The electroacoustic response
Results
This section presents the distortions occurring in the PCT results when this method was used under operational imaging conditions. Outputs of the electroacoustic filter are illustrated in the case of both a broadband pulse excitation and CGS. The field backscattered by a centered thread was recorded to analyze the time–frequency responses. The impact of the number of backprojections on the image contrast was also assessed.
Influence of the Electroacoustic Transfer Function
The generator delivered 100 V peak-to-peak (Vpp). The pulse function is the product of a 3-MHz sine and a Gaussian function giving the largest possible spectral bandwidth without any distortions being induced by the transducer. The pulse extremum generated equaled −42.98 V. The CGS voltages generated were 95.69 Vpp in the case of sequence A and 95.73 Vpp in that of sequence B. The setup included an arbitrary-function generator to transmit specific functions with a high-fidelity digital-to-analog converter even when discontinuities occurred in the phase alternations. Figure 3 presents superimposed digital and analog signals
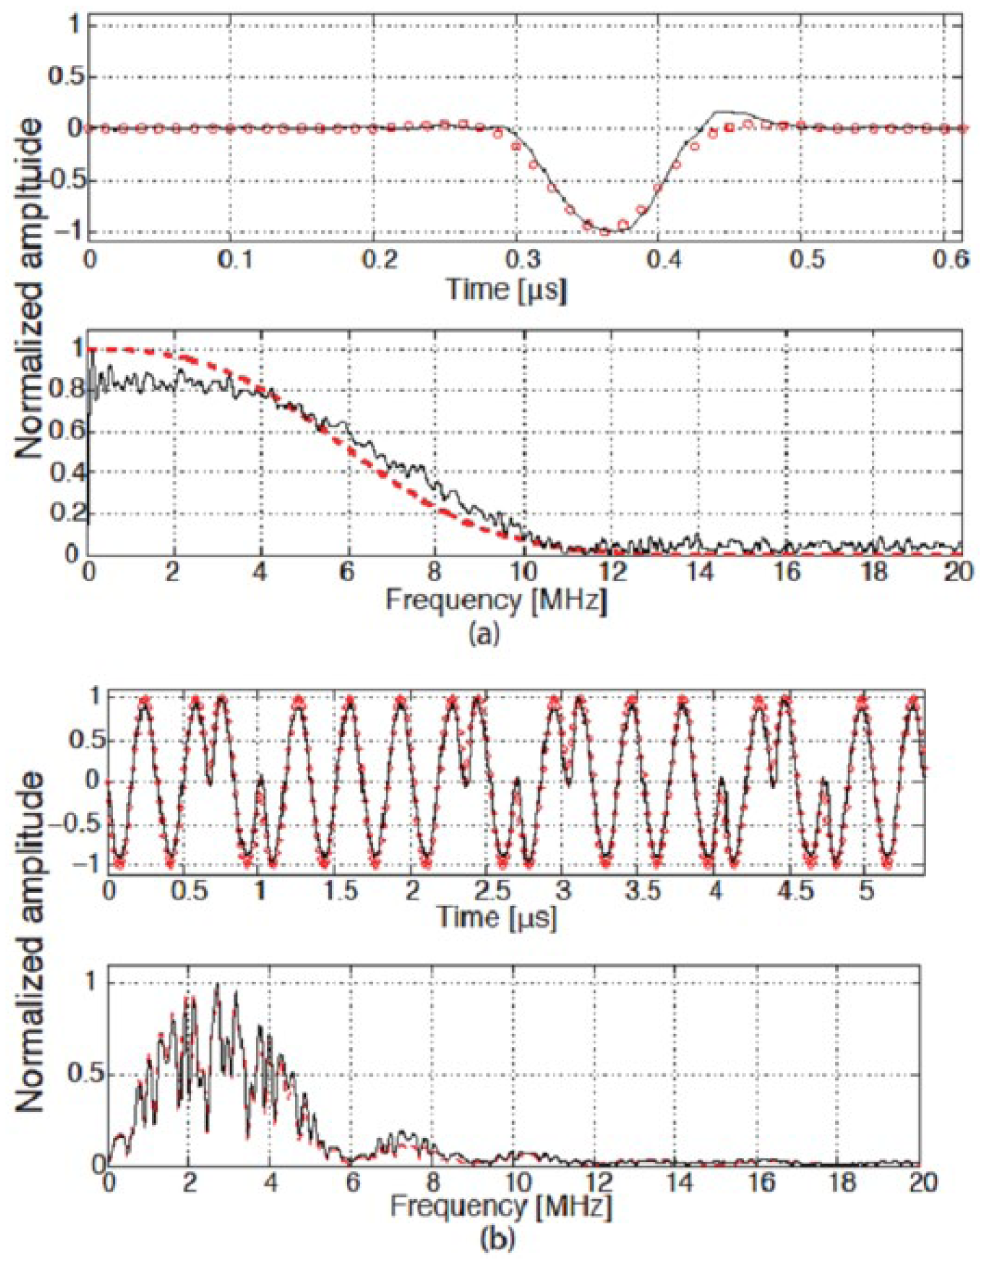
The digital excitation sampled at 80 MHz (circles) and the analog signals (lines) generated with the setup in the case of the pulse (a) and that of the code
The axial pressure distribution was measured by moving a hydrophone (HPM05/3, Precision Acoustics®, Dorchester, United Kingdom) along the propagation axis. The acoustic pressure value is determined using a dedicated chart provided by the constructer based on the integration of the spectral energy. As shown in Figure 4, the pressure increased significantly in comparison with that obtained with the standard pulse; for instance, in the case of sequence A, this level increased by 9.83 dB at 65 mm and by 8.95 dB at 135 mm.
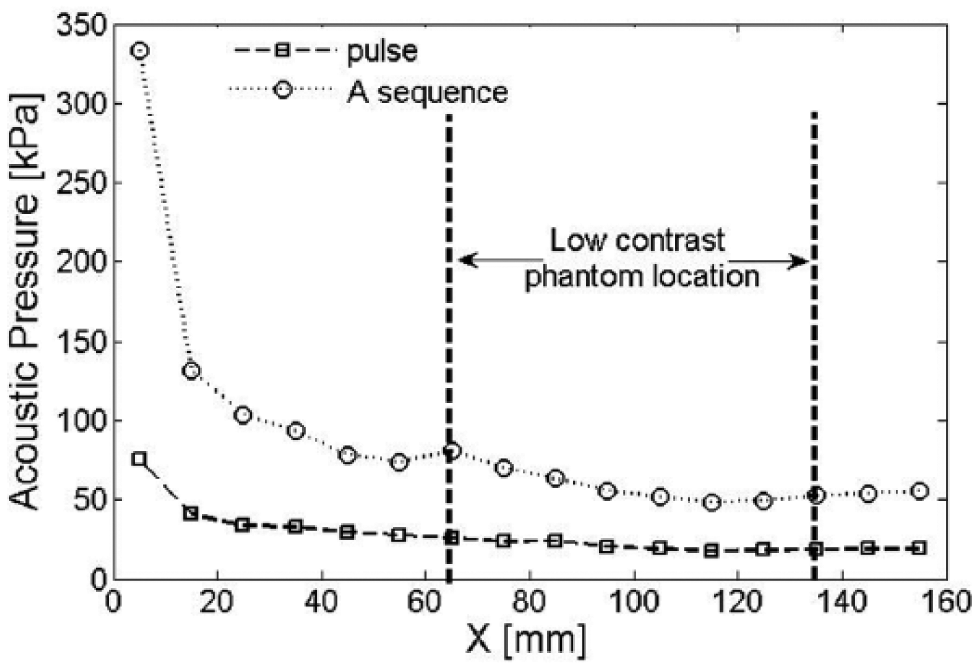
Pressure levels transmitted along the propagation axis. The plot shows the evolution of the pressure with the distance from the point source. Vertical dashed lines indicate the location of the phantom.
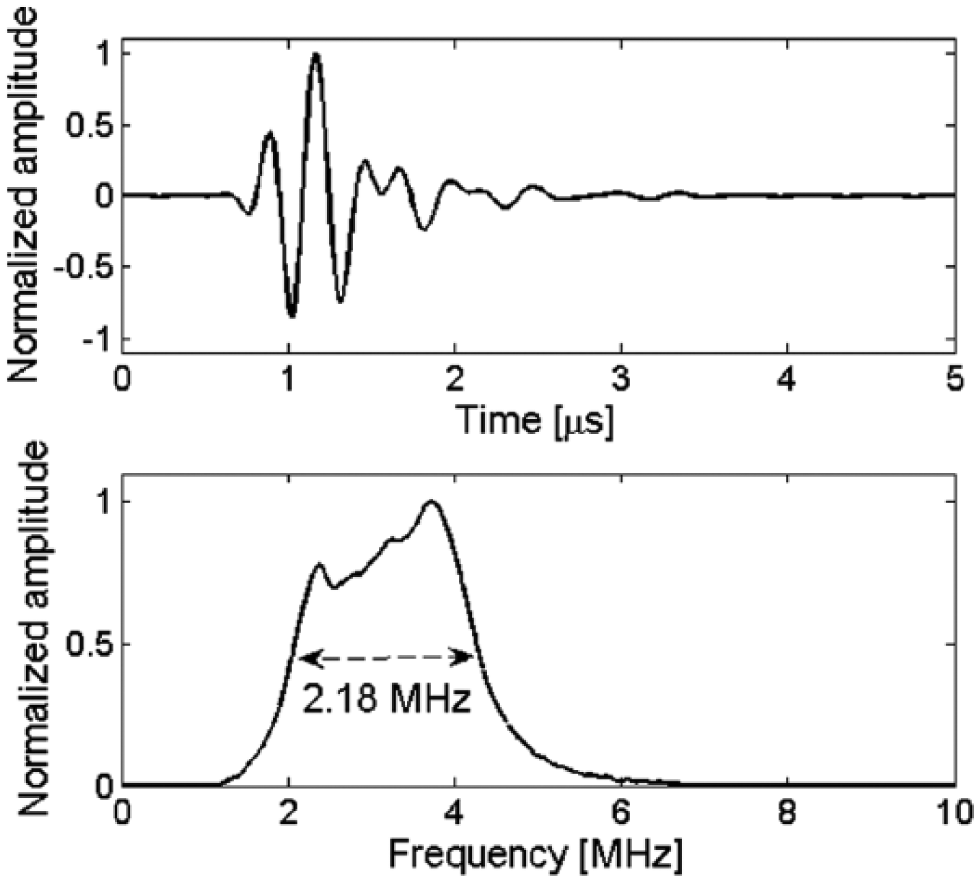
With the aim to estimate the temporal properties of these reflected excitations, a centered steel thread with a diameter of 0.08 mm is employed as a 2D punctual scatterer, which is placed perpendicularly to the image plane. The response

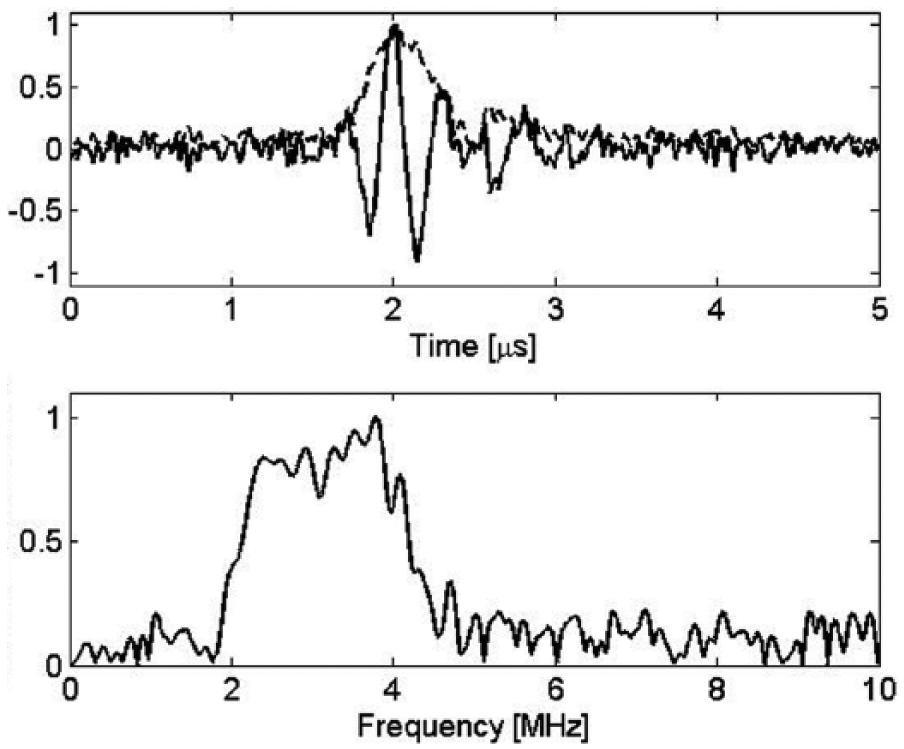
The backscattered broadband pulse (top) and its spectrum (bottom) from a 0.08-mm thread placed at the center of the transducer array. The dash line is the Hilbert transform (envelop) of the radio-frequency (RF) signal.
The time-dependent and spectral graphs of the output signal
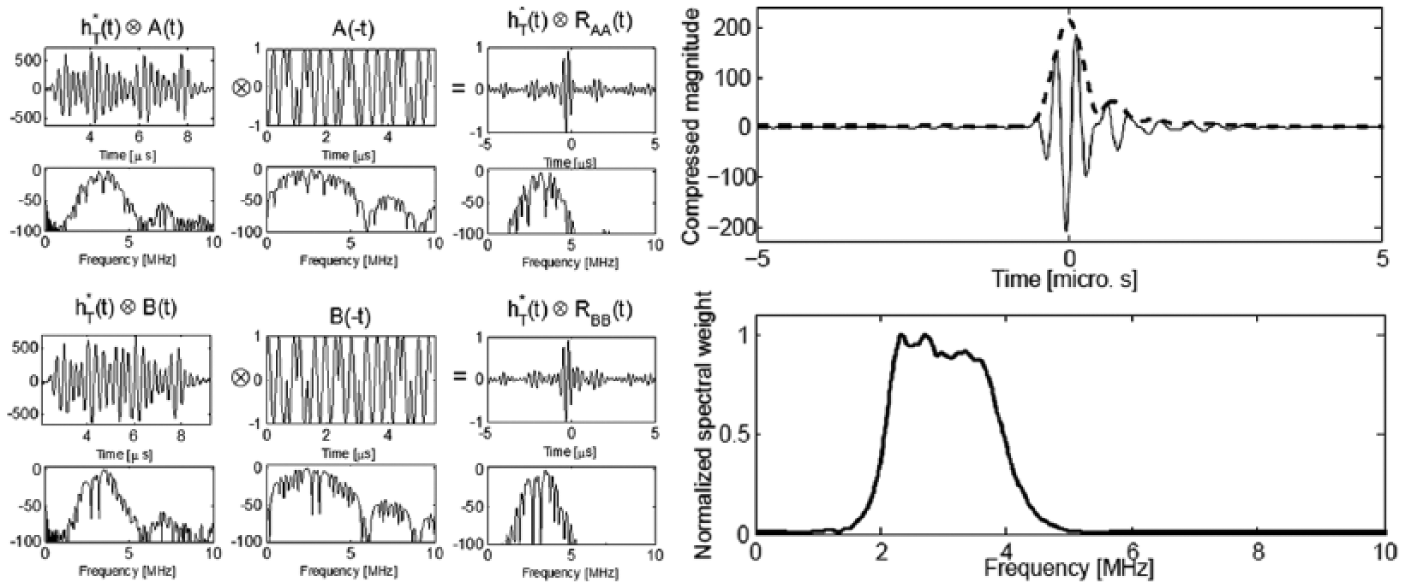
Calculation procedure for the compression of the Complementary Golay Sequences with the electroacoustic filter. The reflected codes
Objective criteria calculated using the Hilbert transform
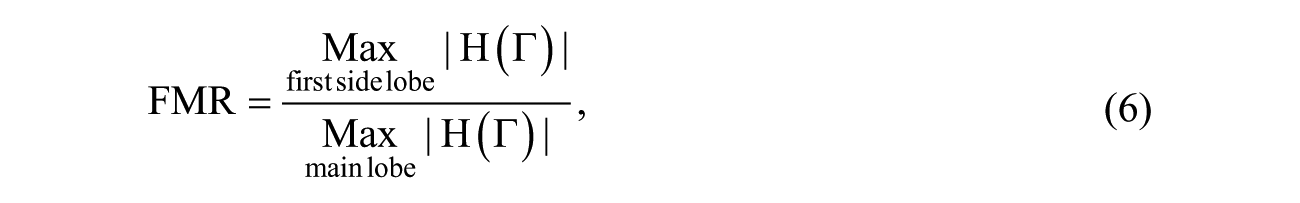
where
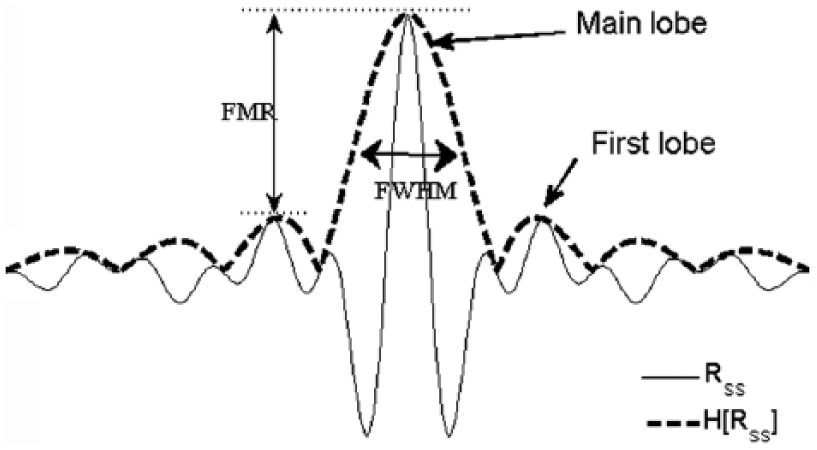
Schematic representation of the analyzed signals (solid line): criteria employed to qualify the temporal properties are depicted (FWHM and FMR). The dash line is the Hilbert transform (envelop). FWHM = full width at the half maximum; FMR = First sidelobe to Mainlobe Ratio.
It is worth noting that the reconstruction algorithm used here involved either RF pulse-excitation signals or raw compressed outputs

where µ denotes the maximum value of the informational part of the signal and σ0 is the standard deviation of the noisy part of the signal. These indicators contribute to argue about the possible use of PCT in the UCT framework; Table 2 presents the average values for the data set [i] with both the pulse
Averages of FWHM, FMR, SNR, and −6 dB bandwidth criteria are calculated for the pulse and the compressed golay sequences in the case of the data set [i].
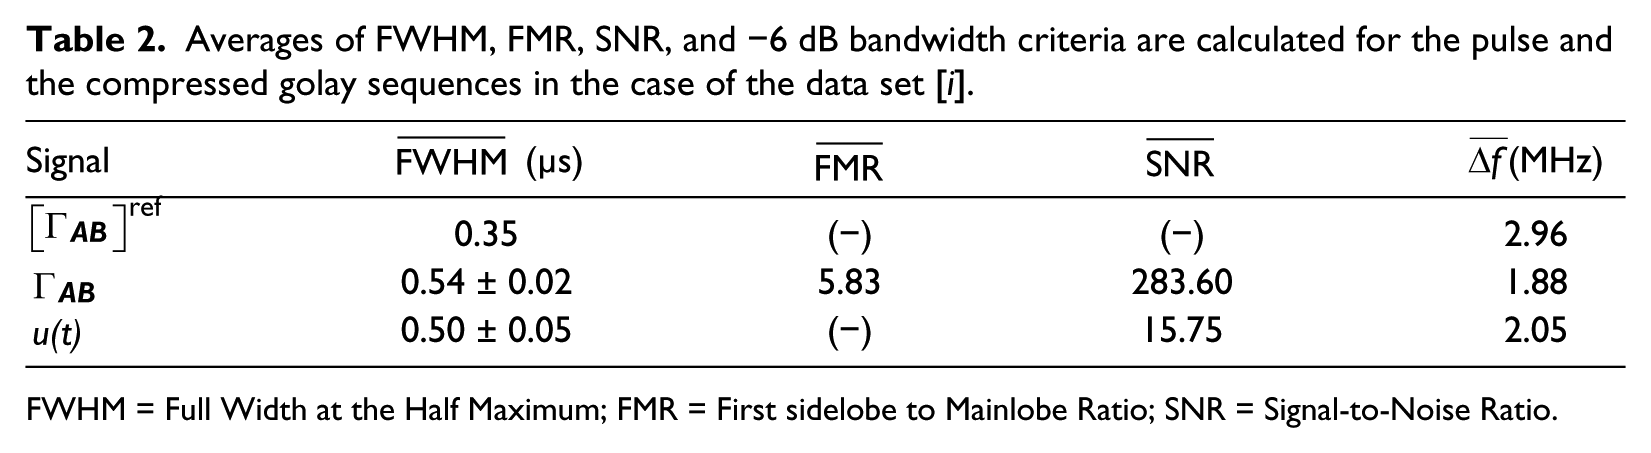
FWHM = Full Width at the Half Maximum; FMR = First sidelobe to Mainlobe Ratio; SNR = Signal-to-Noise Ratio.
Tomographic Imaging Using Golay Sequences
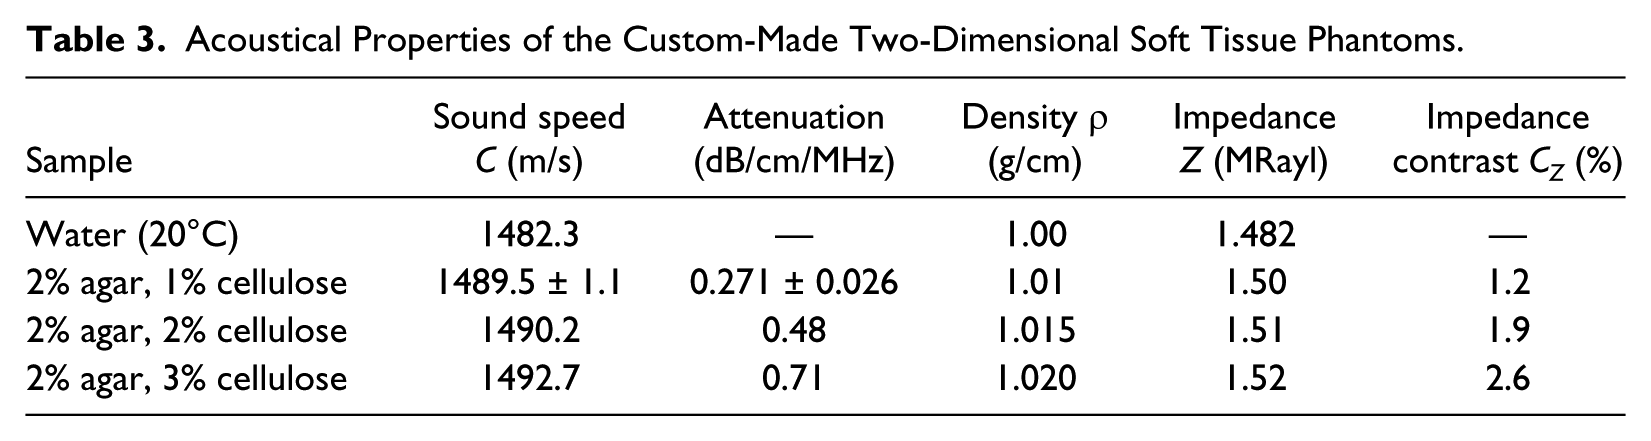
A low-contrast phantom was constructed consisting of a 140-mm high cylinder with an external diameter of 73 mm (146λ), including two holes with a diameter of 12.5 mm (25λ). The matrix of the phantom consisted of a mixture of distilled water, 2% agar powder (A9799, Sigma Chemical®, Saint Louis, Missouri), and 1% cellulose powder (S5504, Sigma Chemical®, Saint Louis, Missouri) with an average particle size of 50 µm. The two cylindrical inclusions used consisted of a mixture of distilled water, 2% agar powder, and 2% cellulose powder. The tissue-mimicking materials were characterized separately, using the protocol described in Rouyer et al. 26 Table 3 summarizes the acoustical properties of the materials: the sound speed, the acoustic attenuation, the density, the impedance Z, and the impedance contrast relative to the impedance (Z0) of water, denoted CZ.

Acoustical Properties of the Custom-Made Two-Dimensional Soft Tissue Phantoms.
The phantom to be imaged was positioned in the center of the array as illustrated in Figure 8, and the scan was performed at half height. The acquisition procedure is repeated three times to record the backscattered field for the transmission of the pulse, the sequence A and the sequence B. During these acquisitions, the thermal conditions were assumed to be constant (23°C in the water tank). Raw pulse data and compressed data were processed to reconstruct images in the four cases of variable backscattering aperture ([i], [ii], [iii], and [iv]) defined above. In Figure 9, the reconstructed region of interest is a centered square with 100-mm sides and a resolution of 1024 × 1024 pixels. Another parameter commonly adopted to determine the quality of ultrasound images31,32 is the CNR, which was also used in the ultrasonic tomographic reconstructions. 10 This criterion defines the contrast between two adjacent media as
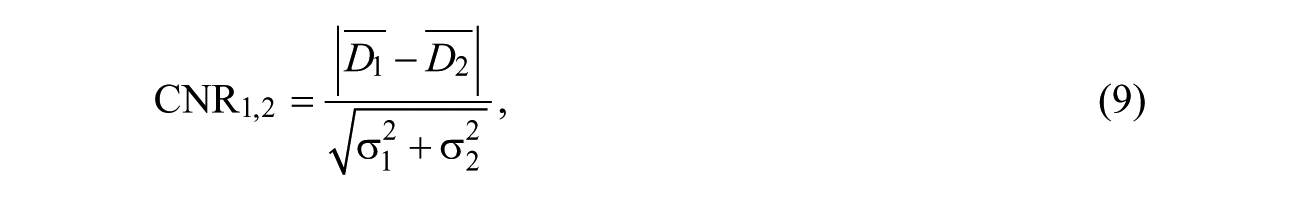
where
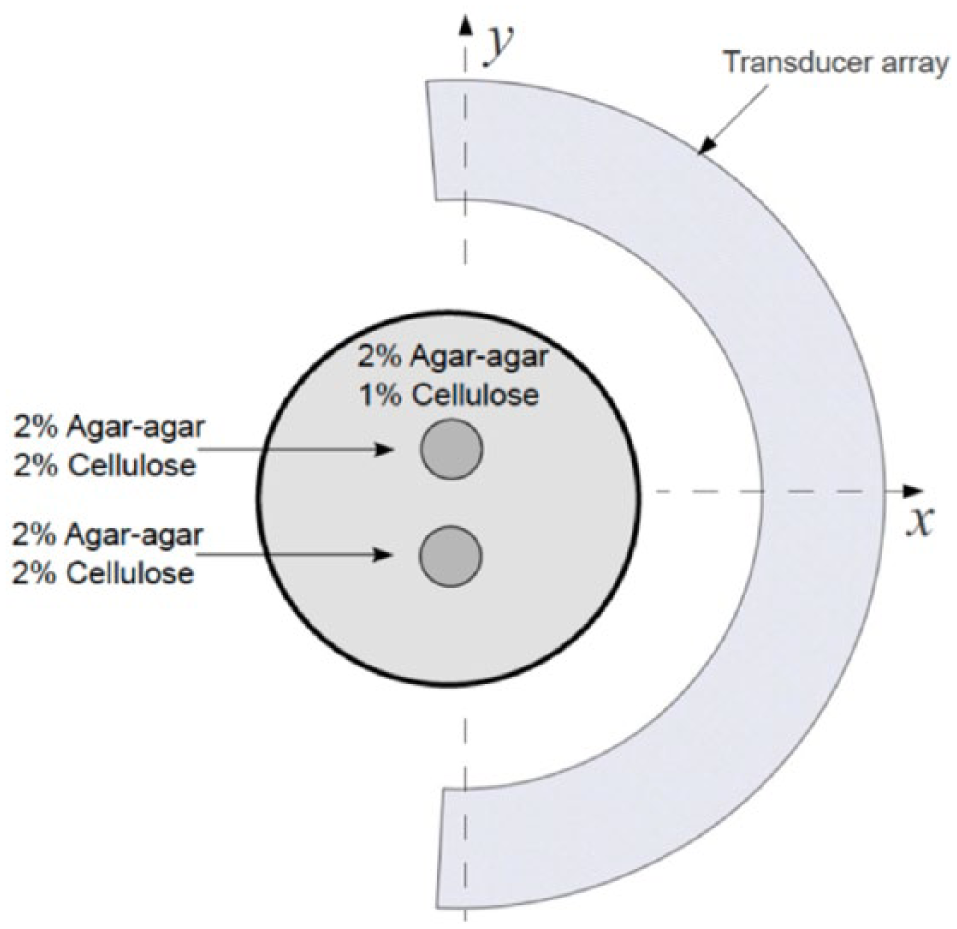
Scheme of the cylindrical phantom and its location in relation with the transducer array.
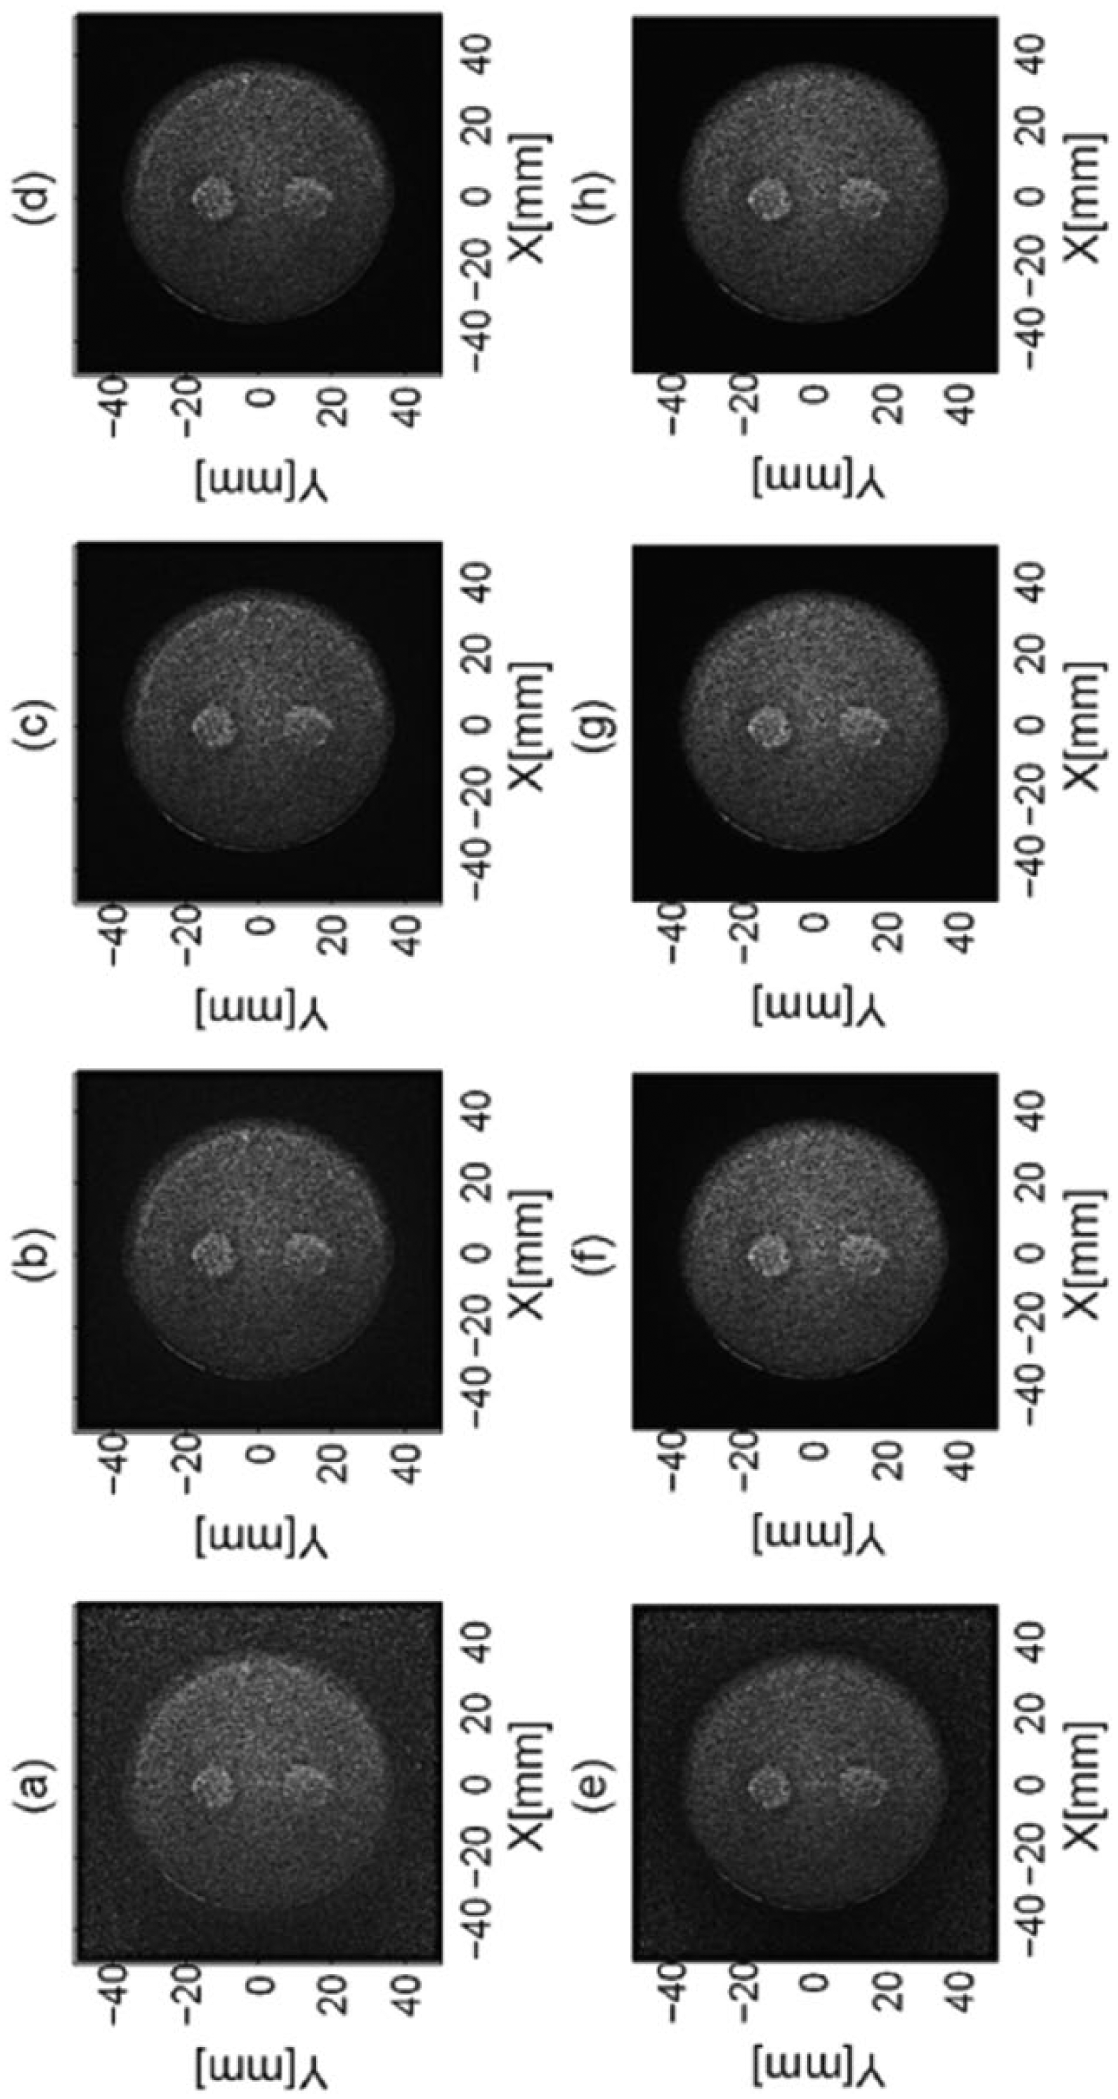
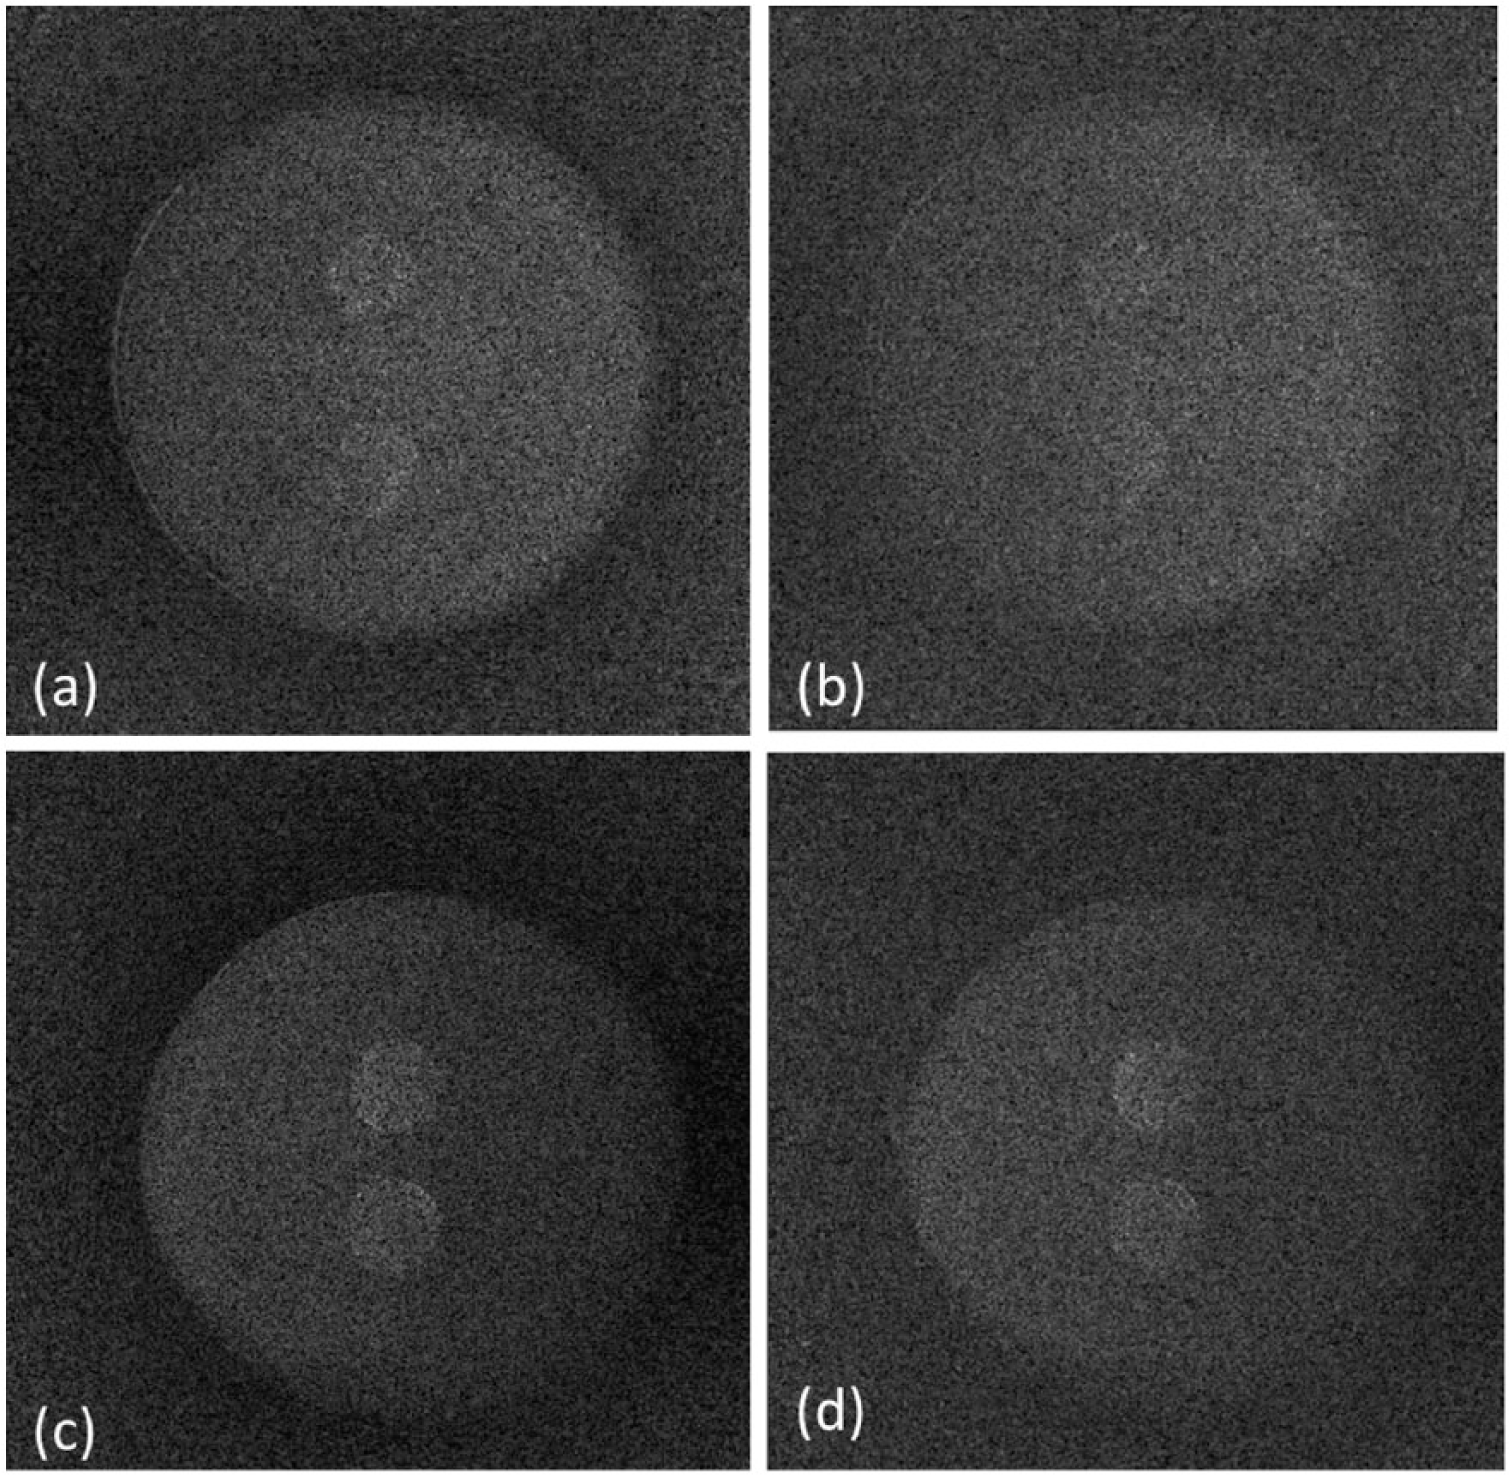
Low-contrast phantom reconstructions in the pulse transmission (a-d) and Golay codes transmissions (e and f). The number of backprojections employed in the reconstruction algorithm is variable following four projections set. Images (a, e) correspond to the pure reflection using one element (data set [i]), images (b, f) correspond to a 4-element backscattering aperture (data set [ii]), images (c, g) correspond to a 16-element backscattering aperture (data set [iii]), and images (d, h) correspond to a 32-element backscattering aperture (data set [iv]).
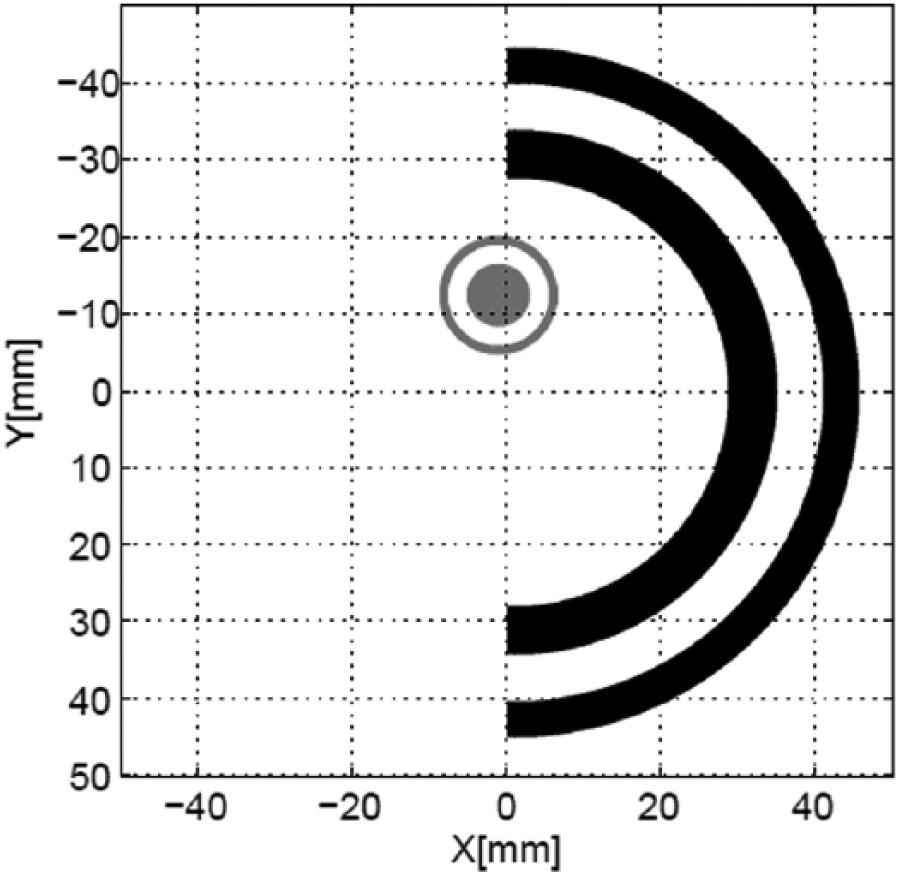
Representation of the regions involved in CNR calculation. Gray-colored zone concerns the upper inclusion versus matrix contrast. Black-colored zone concerns the matrix versus water background contrast. Compared zones contain the same number of pixels. CNR = contrast-to-noise ratio.
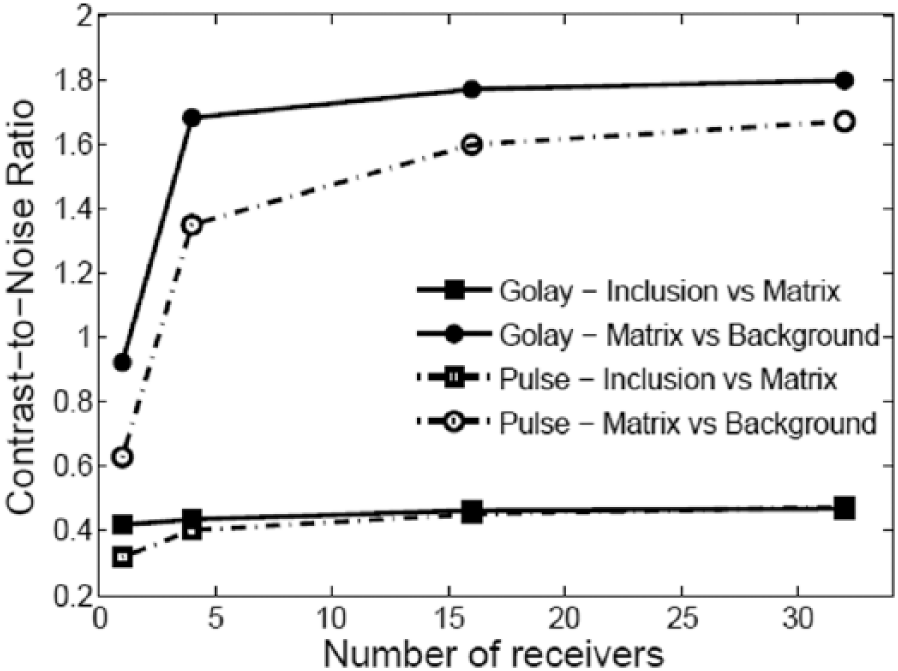
Representation of the inclusion versus matrix and matrix versus background contrast-to-noise ratio obtained from pulse and CGS compression reconstruction (Figure 10) in function of the number of receivers involved in the backscattering aperture. CGS = Complementary Golay Sequences.
Reconstructions of the data set [i] in the cases of the compressed Golay sequences (a, c) and pulse excitations (b, d). The previous reconstructions (Figure 9a and e) of the low-contrast phantom (a, b) are compared with another low-contrast phantom with a slightly higher impedance (c, d): in both cases, the matrix is identical, only the inclusion composition has changed from 2% to 3% in cellulose. Thus, the acoustic impedance of inclusions is 1.51 in (a, b) and 1.52 in (c, d) as referred in Table 3.
On the outer interface (water background/matrix) of the phantom emphasized in Figure 13 (zoom ×8), especially in the water homogeneous region, the CNR is improved on one hand by the use of CGS and on the other hand by the effect of the coherent summation (when the number of receiver elements increases).
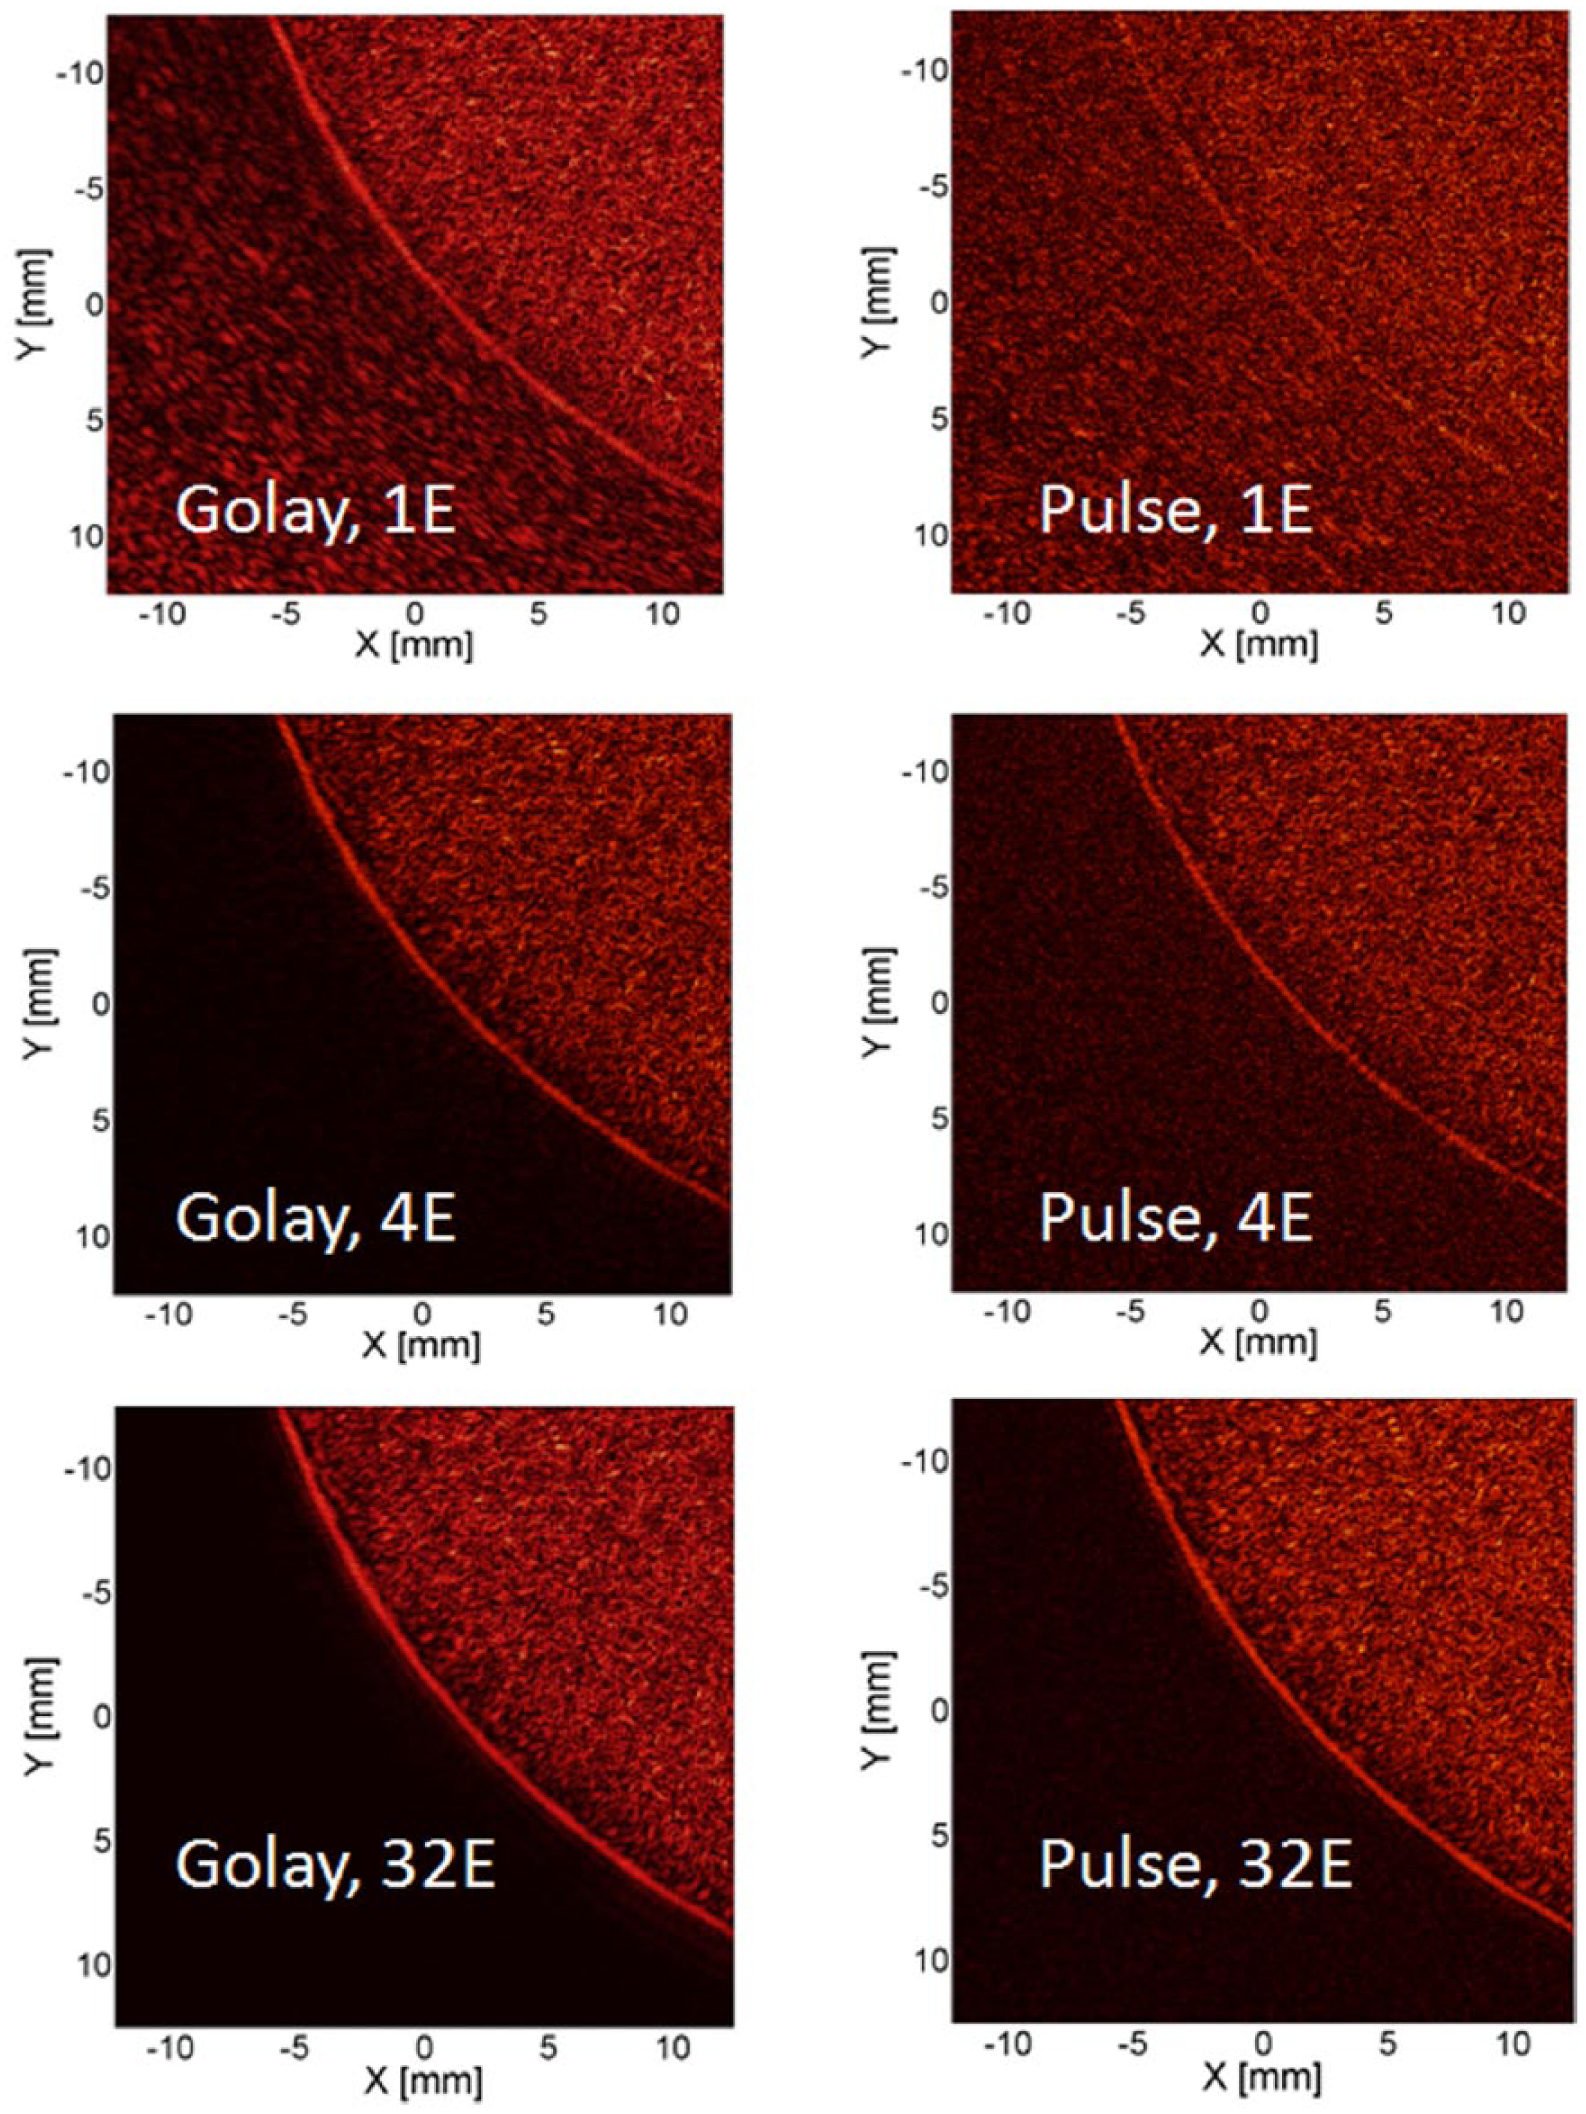
Magnified (×8) reconstructions of the outer surface of the phantom (water/matrix interface) in pure backscattering (1E) and in diffraction (×E = × adjacent elements of the active aperture). The conjunction of CGS technique and diffraction tomography sharply enhances the contrast-to-noise ratio at low number (less than 5) of projections coherently associated; beyond 32 involved projections, no enhancement is visible. CGS = Complementary Golay Sequences.
Discussion
Golay sequences (Figure 1) provide a useful tool for eliminating self-noise due to near and range sidelobes (no sidelobes occur). In real-life contexts, because of the filtering induced by the electroacoustic response (in the transmission, propagation, and acquisition modes), 22 these properties are degraded, resulting in an increase in the FWHM of about 35% and the generation of low-amplitude sidelobes (FMR = 5.83). As established by many authors,16,17,21,24,28,33,34 increasing the pulse length increases the acoustic pressure along the wave path and thus makes it possible to probe more deeply into the medium. The acoustic pressure was always found to be about 20 dB higher here.
One of the main limitations of using Golay pairs in the medical framework is the fact that two sequential waveforms have to be transmitted: during the inter-transmission interval, the tissues are liable to move. However, the possibility of emitting pairs of sequences simultaneously was recently tested to overcome this tissue motion problem; 25 this kind of procedure can avoid extra duration of the scan. In this work, the simultaneous emission of both Golay sequences was not used. Because of our electronic device, sequences were sent separately one after the other.
In practice, to obtain a wide field covering the whole imaging section of interest, the active area of the transducers has to be smaller than the wavelength. At relatively large inspection depths (around 10 cm), these small active surfaces cannot transmit a sufficiently high acoustic pressure to obtain contrasted images when dealing with soft tissues (ultrasonic attenuation can be higher than 0.5 dB/MHz/cm). To increase image contrast while continuing to use low-yield transducers, the use of PCT was tested. For this purpose, a custom-made low-contrast phantom was constructed and characterized (Table 3). The impedance contrast relative to the surrounding water was found to be equal to 1.2% in the case of the matrix and 1.9% in that of the inclusions. The matrix relative to the inclusion material gave a 0.6% impedance contrast.
The images presented in Figure 9 are the rough solution produced by the filtered elliptic backprojection algorithm. 27 Depicted reconstructions of the 2D low-contrast phantom illustrate the case of several configurations of acquisition where the number of backprojections is 993, 3972, 15,888, and 31,776, respectively, from the left to the right columns. The top (a, b, c, d) and below (e, f, g, h) rows refer, respectively, to the RF data when using a pulse and the compressed signal from Golay codes transmission. To keep to the facts, in line with computer-aided diagnosis (CAD), no image processing was applied to these figures and no dynamic compression was applied to the sinograms. The global dynamics are therefore rather poor. The intent was to determine how the sensitivity of the imaging system can be enhanced by including redundant data in the case of very low-contrast objects. First, the greater the number of backprojections used, the higher the contrast level will be as it clearly visible in Figure 9. The contrast enhancement due to the gradual increase of the backscattering aperture is distinguishable in Figure 9: from (a) to (d) in the case of the pulse and from (e) to (h) in the case of the compressed sequences. The overall quality of the image obtained in the set [i] was in fact lower (Figure 9a and e): for instance, the reconstruction noise was relatively high in the water background. Nevertheless, Figure 11 shows the positive effects of the PCT on the CNR. When two adjacent domains are associated—such as one inclusion and the matrix, or the matrix and the background (Figure 10)—the CNR of the PCT-based reconstructions was higher in all data sets images. However, although the contribution of the PCT was positive, the gap tends to decrease with the rise of the backprojections. On one hand, the inclusion/matrix contrast increased by 30.5% for the set [i], by 8.93% for the set [ii], and by 1.81% for the set [iii], and it decreased by 0.54% for the set [iv]. On the other hand, the matrix/background contrast increased by 46.1% for the set [i], by 24.7% for the set [ii], by 10.8% for the set [iii], and by 7.55% for the set [iv]. The main contribution of the PCT was observed in the narrowest backscattering aperture (i.e., [i] and [ii]). On the images, the PCT increased the magnitude of coherent echoes while reducing the relative level of the reconstruction noise. The improvement of the image quality is easily perceptible in Figure 12 where the tomographic reconstructions (CGS–PCT vs. Pulse transmission) of a less-weakly contrast phantom are compared. In fact, part of the image reconstruction noise results from the electroacoustic noise and was partly eliminated using the two CGS (time averaging). In a similar way, as observed in Figure 13, enlarging the receiving aperture has also contributed, via a summation of the involved projections, to a coherent summation of the instrument noise. For reconstructions involving more than 32 projections (scattering angle larger than ±3 degrees), the results are unfavorable to Golay implementation as there is no significant differences between the tomographic reconstructions.
The first 3D UCT prototypes based on a half-sphere array are beginning to emerge at research laboratories.5,24 The latest approaches used also involve the use of point sources to transmit spherical incident waves, and the transducers used therefore have to be small. In addition, in the case of 3D systems, because of the time constraints imposed at clinical examinations and the need to reduce the cost of the equipment, the spatial density of the transducers lining the surface of the inner half-sphere surface has to be as low as possible. Processing a large amount of diffraction acquisition data would be both resource- and time-consuming. The present study shows that PCT makes it possible to maintain a good quality of the reconstruction while keeping the number of projections relatively low.
The results of this study also suggest that when it is proposed to search for very low-contrast lesions, once the number of projections has been set for a given tomographic setup, the image contrast, that is, the probability of detection, can been enhanced by using low-power, high-energy Golay sequences. It is worth to note that in vivo conditions are harsher than those of the phantom used. The attenuation may be much higher due to internal damping and 3D scattering, and significant signal distortion may occur; the resulting SNR in backprojection will be lower, but PCT will certainly optimize the reconstruction noise level compared with conventional pulse approach. Furthermore, soft tissue attenuation, which could be higher than 0.5 dB/MHz/cm, will act as a low-pass filter and will degrade the pulse compressing performances. Ongoing work will consist in the inspection of ex vivo tissues to evaluate the benefits of the PCT with CGS in operational-like conditions.
Conclusion
The evaluation of the PCT with CGS was realized in the framework of an ultrasonic mammograph. The temporal properties of the projections and the contrast in the low-contrast phantom reconstruction were determined. On the signal-processing point of view, first it was demonstrated that electroacoustic filtering degrades the resolution power by a factor 1.5 when it compared with the reference theoretical compression process. Second, the SNR of compressed projections increases by 18 compared with a conventional pulse for the backscattered field recorded from a sub-wavelength diameter thread; this improvement operates without a significant decrease in the temporal properties. On the image contrast point of view, the PCT is a useful mean to increase the CNR when dealing with a low redundancy of the coherent information. The advantage of PCT is lessened with the increase of backprojections used. This approach could be suitably implemented in a 3D UCT device including a limited number of transducers. It could also be used to accelerate both the acquisition and the reconstruction processes during the examination of patients which is valuable for refining the inspection of a specific volume of interest.
Footnotes
Declaration of Conflicting Interests
The author(s) declared no potential conflicts of interest with respect to the research, authorship, and/or publication of this article.
Funding
The author(s) received no financial support for the research, authorship, and/or publication of this article.