






Abstract
A wavefront reconstruction method for a continuous shear wave is proposed. The method uses ultrasound color flow imaging (CFI) to detect the shear wave’s wavefront. When the shear wave vibration frequency satisfies the required frequency condition and the displacement amplitude satisfies the displacement amplitude condition, zero and maximum flow velocities appear at the shear wave vibration phases of zero and π rad, respectively. These specific flow velocities produce the shear wave’s wavefront map in CFI. An important feature of this method is that the shear wave propagation is observed in real time without addition of extra functions to the ultrasound imaging system. The experiments are performed using a 6.5 MHz CFI system. The shear wave is excited by a multilayer piezoelectric actuator. In a phantom experiment, the shear wave velocities estimated using the proposed method and those estimated using a system based on displacement measurement show good agreement.
Introduction
Shear wave elasticity imaging, which enables measurement of the viscoelastic properties of tissue, has been applied to various tissues, including liver, breast, and prostate tissues. Several imaging methods have been proposed that differ in terms of their shear wave excitation and detection methods.1-4 A shear wave is excited by a mechanical vibrator that is attached to the tissue surface, and the small displacement of the tissue that is caused by shear wave propagation is detected by ultrasonic wave Doppler techniques.5,6 The shear wave velocities for liver tissue have been measured by this method.
A method that uses a shear wave interference pattern to estimate the shear wave velocity has been proposed.7,8 When two shear waves of almost the same frequency are excited by two vibrators placed at different positions on the tissue surface, they produce an interference pattern in the region where the waves cross. Because the displacement amplitude is modulated spatially inside the interference pattern, the shear wave velocity is estimated from the spatial distribution of the displacement amplitude. This is an interesting method for tissue elasticity measurement because the shear wave velocity is derived from the spectral characteristics of the ultrasonic Doppler signal. However, two vibrators are required to produce the interference pattern.
The acoustic radiation force that is produced by the relatively high-intensity ultrasonic wave irradiated by an ultrasonic wave transducer has been used to excite a shear wave inside tissue.9-11 The shear wave velocity is then estimated using the same ultrasonic wave transducer. This system has been applied to measure the shear elasticity of various tissues; however, an ultrasonic imaging system with a high frame rate is needed for the Doppler frequency shift signals because the shear wave frequency is usually higher than the pulse repetition frequency of a general-purpose ultrasound imaging system. This method has also been applied to shear wave dispersion measurement to estimate the viscoelastic properties of the medium. 12
Nuclear magnetic resonance imaging (MRI) is an alternative method for the measurement of shear waves excited by a mechanical vibrator. 13 The shear waves are excited using a specially designed air pressure-type vibrator that does not disturb the magnetic field.
In this paper, a detection method for a continuous shear wave is proposed. The wavefront of a shear wave that propagates inside a medium is directly reconstructed by a signal processing unit and is used for color flow imaging (CFI) in an ultrasound imaging system. In a CFI system, the flow velocity is estimated based on a complex digital filter followed by an arctangent operation. When this signal processing method is applied to an object that is subject to vibration by the shear wave, the flow velocity becomes either zero or a maximum at the shear wave vibration phases of zero and π rad, respectively. These specific flow velocities appear in CFI and are used to form the shear wave’s wavefront map. To obtain the shear wave’s wavefront, two conditions must be satisfied. The first is a frequency condition, which defines the shear wave vibration frequency. The vibration frequency is chosen from several frequencies that satisfy this condition. The second condition is a displacement amplitude condition, which defines the minimum displacement amplitude of the shear wave. An important feature of the proposed method is that it is not necessary to add any functions to the ultrasound CFI system to produce the wavefront map. This feature means that a shear wave imaging system can be provided using a general-purpose ultrasound CFI system. In addition, shear wave propagation inside the tissue is observed as a motion picture. This feature improves the shear wave velocity estimation accuracy because the velocity must be measured along the shear wave propagation direction.
Method
In the proposed method, it is assumed that a continuous shear wave is excited in a medium, and this medium is then observed by CFI using an ultrasonic imaging instrument. The wavefront of the shear wave that propagates inside the medium is directly reconstructed as a binary pattern consisting of the zero and maximum flow velocities of CFI without adding any image processing functionality to the CFI. This is because the high-frequency Doppler signal that is produced by shear wave propagation changes into a low frequency signal via the aliasing process from sampling theory. Also, complex-valued flow velocity estimation processing produces either the zero or maximum flow velocities, depending on the shear wave phase.
In CFI, the flow velocity is estimated from the quadrature detector output signals, which are acquired for N + 1 successive ultrasonic waves as 14 :

where


When a continuous shear wave is excited, the displacement

where
To reconstruct the shear wave’s wavefront in CFI, the following two conditions must be satisfied. Derivation is shown in Appendix A. The first condition is a shear wave frequency condition, which defines the shear wave vibration frequency

where Δt is the time duration between successive ultrasonic pulses that radiate in the same direction for color flow velocity estimation, and m is zero or an integer value.
The second condition is a shear wave displacement amplitude condition, which defines the shear wave displacement amplitude

where
Then, the estimated flow velocity becomes the maximum or zero depending on the shear wave vibration phase. The binary pattern, which consists of the maximum and zero of the flow velocity, makes a shear wave’s wavefront map on CFI. A theoretical discussion of this image reconstruction algorithm is provided in Appendix A. This method could be extended to all CFI systems by relying on the assumption that all CFI systems operate in the same manner as that presented here.
As mentioned in the “Introduction,” this method allows the proposed imaging system to be constructed without the addition of any functions to the ultrasonic CFI system. Also, if the vibration frequency shifts slightly from an integral multiple of the CFI frame rate in the region around the frequency condition, then the shear wave propagation can be observed in real time as a motion picture.
To estimate both the shear wave velocity and the shear wave propagation direction, the Fourier analysis method is used, and this method is also discussed in Appendix A. In this method, CFI is performed during a specific time period, and the shear wave phase is estimated by application of the Fourier analysis in the direction of the time axis.
Experimental
Figure 1 shows the experimental set-up. An ultrasound CFI system (Hitachi, EUB-8500, Tokyo, Japan) with a 6.5 MHz linear probe was used. The pulse repetition frequency (PRF) of ultrasound pulses that radiate in the same direction varies, depending on the imaging parameters. We set the PRF to 365 Hz, and a packet size to estimate flow velocity N, which is introduced in Equations (A1) to (A10) in Appendix A, is 8. The data acquisition time required for flow velocity estimation was 22 ms. The shear wave was excited using a large-amplitude multilayer piezoelectric actuator (NEC-Tokin, AHB800, Tokyo, Japan). This small actuator (11.5 mm in diameter with length of 65 mm) produced a vibration amplitude of 80 µm under an applied voltage of 150 V. This vibration amplitude is a nominal value for DC; however, it is expected that the actuator will produce almost the same vibration amplitude in the frequency range used in the experiments, because the resonance frequency is 8 kHz. The actuator was driven by a power amplifier (NF Corp, EC750S, Yokohama, Japan). The video output signal of the ultrasound CFI system was then fed into a personal computer (PC) by a video capture device and the shear wave’s wavefront was observed.
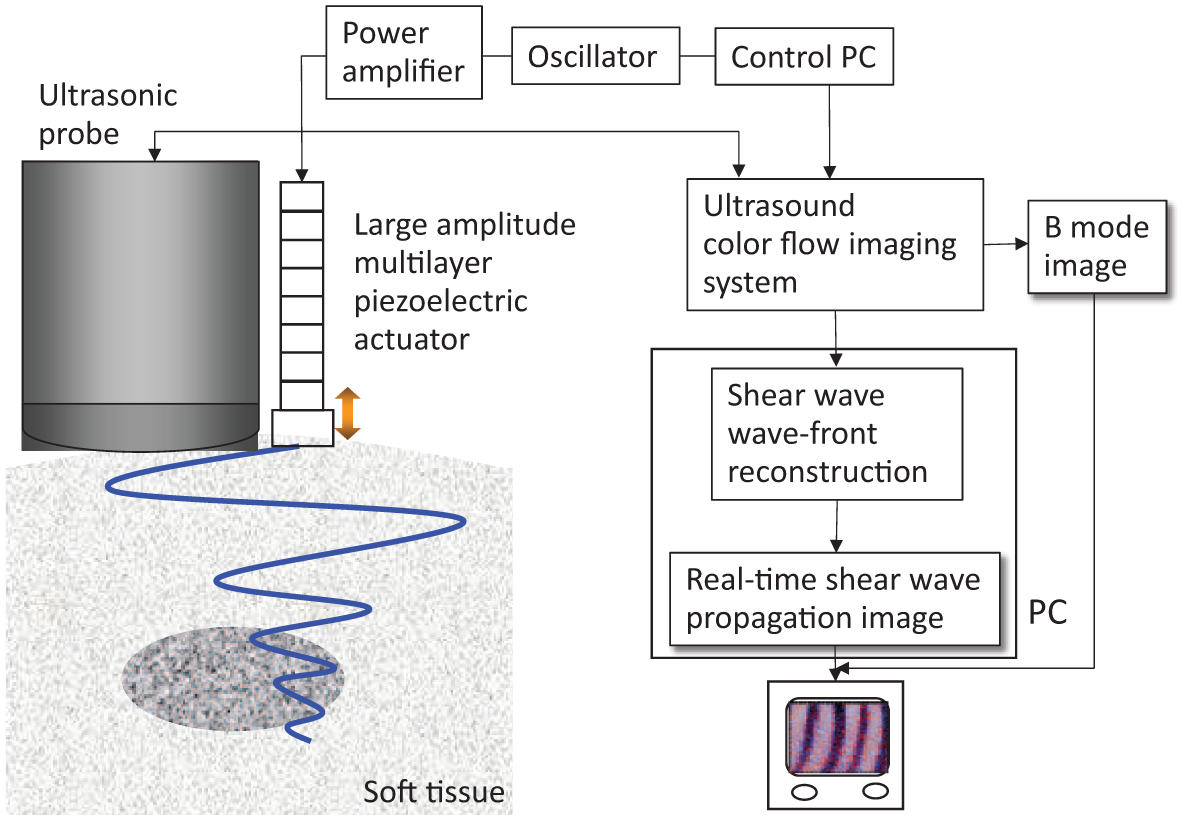
Experimental set-up. A shear wave is excited by a large-amplitude multilayer piezoelectric actuator. The Doppler frequency shift caused by shear wave propagation is detected by the ultrasound CFI system. The CFI image is fed into the PC and the shear wave’s wavefront is reconstructed. CFI = color flow imaging; PC = personal computer.
Figure 2 shows a photograph of the experiment for an agar gel phantom (graphite powder: 1.5 weight % [w%]). The ultrasonic probe was attached to the surface of the phantom. The actuator head size is 10 mm × 20 mm. The actuator head and the ultrasonic probe are arranged on the same line to enable observation of the shear wave’s wavefront perpendicular to the wave propagation direction.
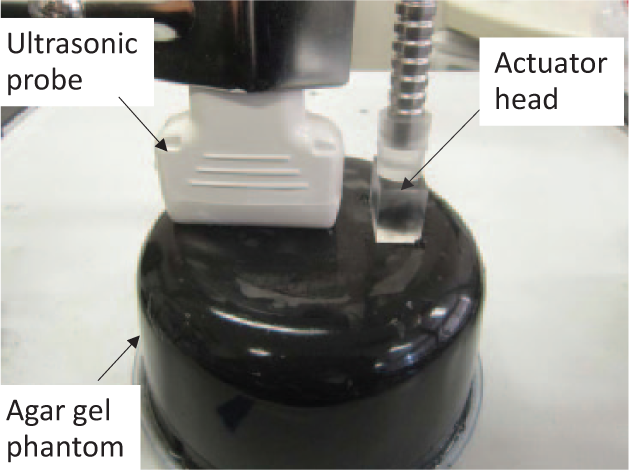
Experimental set-up for the agar gel phantom. Graphite powder (1.5 w%) is mixed into the agar phantom as an ultrasonic wave scatterer. The actuator head and the ultrasonic probe are arranged on the same line to enable observation of the shear wave’s wavefront perpendicular to the wave propagation direction.
Figure 3 shows a comparison between the shear wave’s wavefront observed using a shear wave imaging system based on small displacement measurement 15 and that observed using the proposed method. The shear wave’s wavefront reconstruction method based on small displacement measurement is described in Appendix B. In the small displacement measurement method, because the shear wave’s wavefront and the shear wave phase are derived using the measurement of displacement, which is produced by shear wave propagation from quadrature detector output signal acquired using different hardware, the validity of the proposed method can be evaluated by comparison with the small displacement measurement method. As both methods reconstruct two-dimensional maps, vibrator was set to the same point on the surface of phantom, and the comparison was done for the same region inside the phantom. Figure 3(a) and (b) show the real part of the Fourier spectrum and the shear wave phase, respectively, which were estimated using the small displacement measurement method. The vibration frequency was 273.6 Hz. In contrast, Figure 3(c) shows a CFI image produced by the proposed method that was observed at the same vibration frequency. The vibration frequency of 273.6 Hz corresponds to m = 1 of the frequency condition (Equation 1). The CFI was expanded in the lateral direction to compensate for the time delay of the ultrasonic wave radiation in the lateral direction. It was confirmed that a stripe-like pattern appeared every π [rad] of the shear wave phase in the proposed method when Figure 3(c) is compared with Figure 3(b). Figure 3(d) shows the shear wave phase, which is estimated by taking the fact that the shear wave’s wavefront pattern appears every π [rad] in CFI into account.
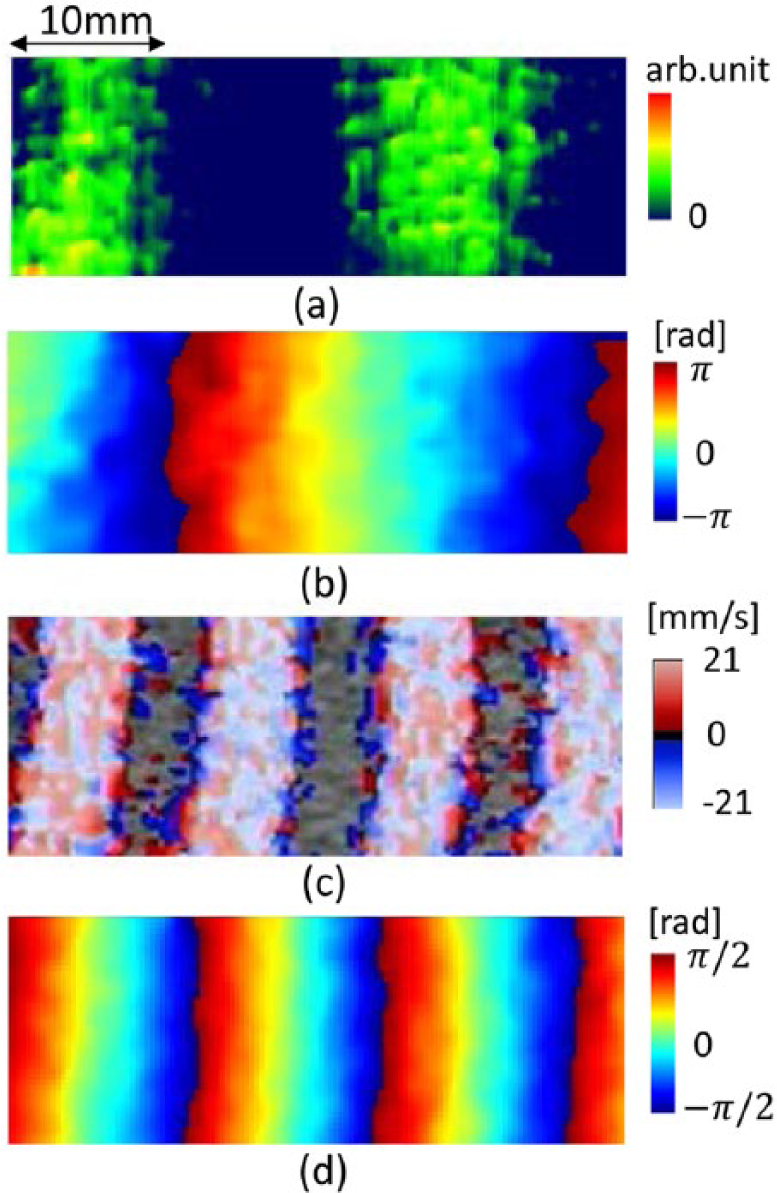
Comparison between the shear wave’s wavefront observed using a shear wave imaging system based on small displacement measurement and that observed by the proposed method. The vibration frequency is 273.6 Hz. The agar gel powder concentration is 1.5 w%. (a) and (b) show the real part of the Fourier spectrum and the shear wave phase that were estimated using the small displacement measurement method, respectively. The CFI of the same phantom under the same shear wave frequency observed using the proposed method is shown in (c). The separation between the neighboring peaks corresponds to the wavelength of the shear wave; (d) shows the shear wave phase that was estimated by the proposed method. CFI = color flow imaging.
Figure 4 shows CFI results for three different agar gel phantoms. Figure 4(a-1), (b-1), and (c-1) show the CFI results for phantoms containing 1.75 w%, 1.5 w%, and 1.0 w% agar powders, respectively. Their shear wave phases, which are derived by the Fourier analysis method, are shown in Figure 3(a-2), (b-2), and (c-2), respectively, and Figure 3(a-3), (b-3), and (c-3) show the estimated shear wave velocities, respectively. The time duration of the Fourier analysis,
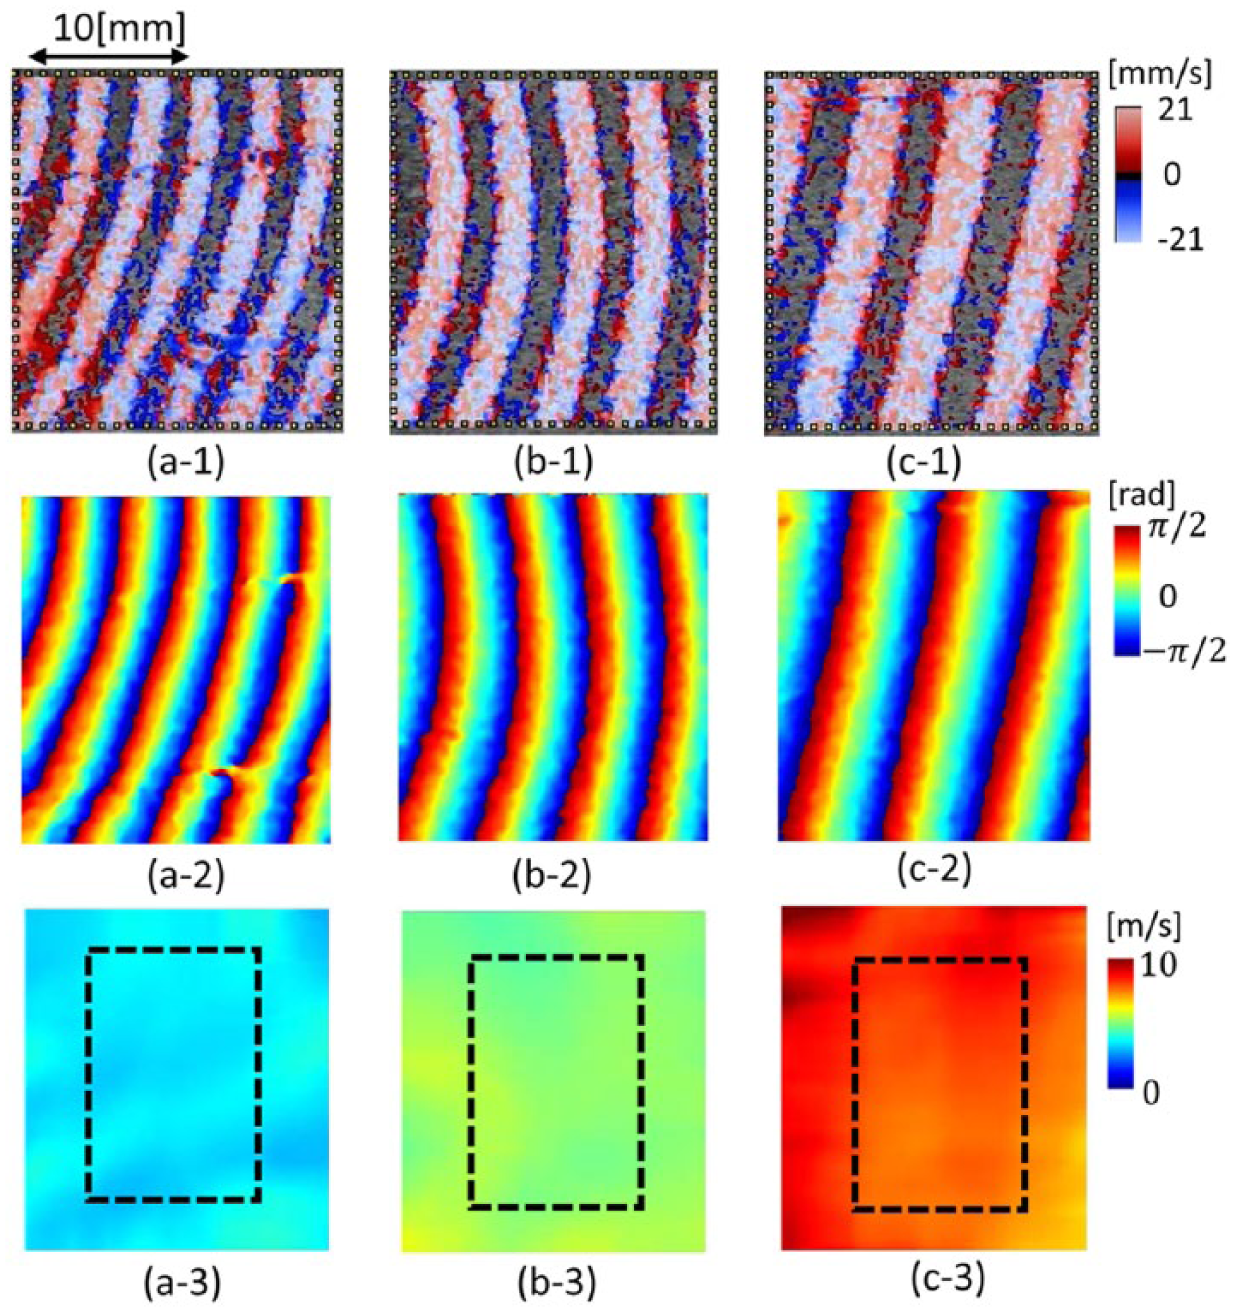
Color flow images for the agar gel phantom. (a-1), (b-1), and (c-1) show the CFI images obtained for the phantoms with agar gel powder concentrations of 1.75 w%, 1.5 w%, and 1.0 w%, respectively. The vibration frequency is 273.6 Hz. The phases of the corresponding shear waves are shown in (a-2), (b-2), and (c-2), respectively, and the corresponding shear wave velocities are shown in (a-3), (b-3), and (c-3), respectively. The rectangular areas denoted by the dashed lines show the ROI for the shear wave velocity measurement in each case. ROI = region of interest.
Figure 5 shows the shear wave velocities for the agar gel phantoms. The shear wave velocity was evaluated in each region of interest (ROI) denoted by a rectangle formed by the dashed lines in Figure 4(a-3), (b-3), and (c-3). The horizontal axis gives the velocity measured by a shear wave imaging system based on small displacement measurements, which is shown in Appendix B. The vertical axis shows the shear wave velocity that was estimated by the proposed method. The estimated shear wave velocities are listed in Table 1. The values measured by the two methods showed close agreement.
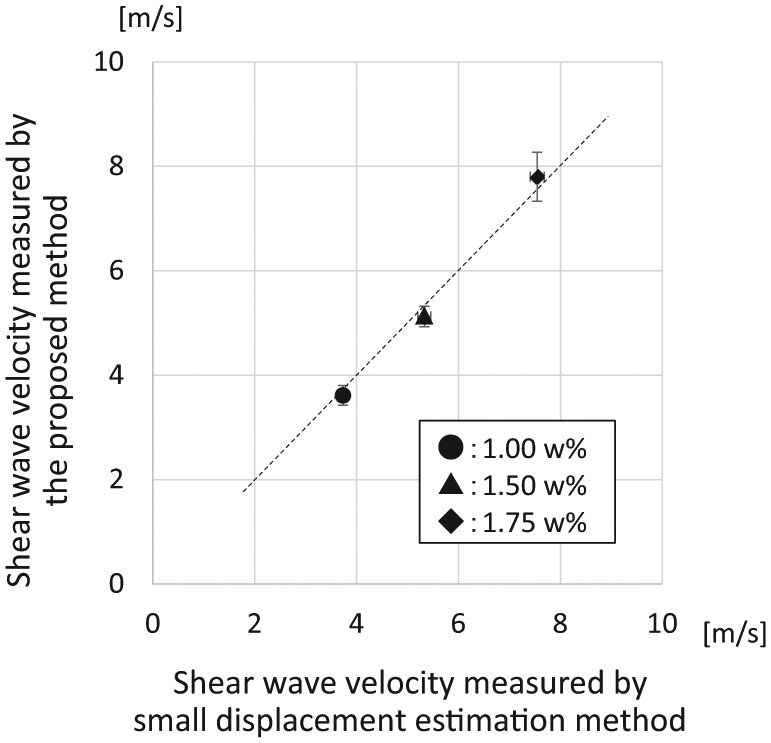
Shear wave velocity characteristics for three agar gel phantoms. The horizontal axis is the shear wave velocity measured by the shear wave imaging system based on small displacement estimation. The vertical axis is the shear wave velocity measured by the proposed method. The vibration frequency was 273.6 Hz.
Shear Wave Velocities for Three Agar Gel Phantoms with Different Agar Gel Powder Concentrations. Unit is m/s.
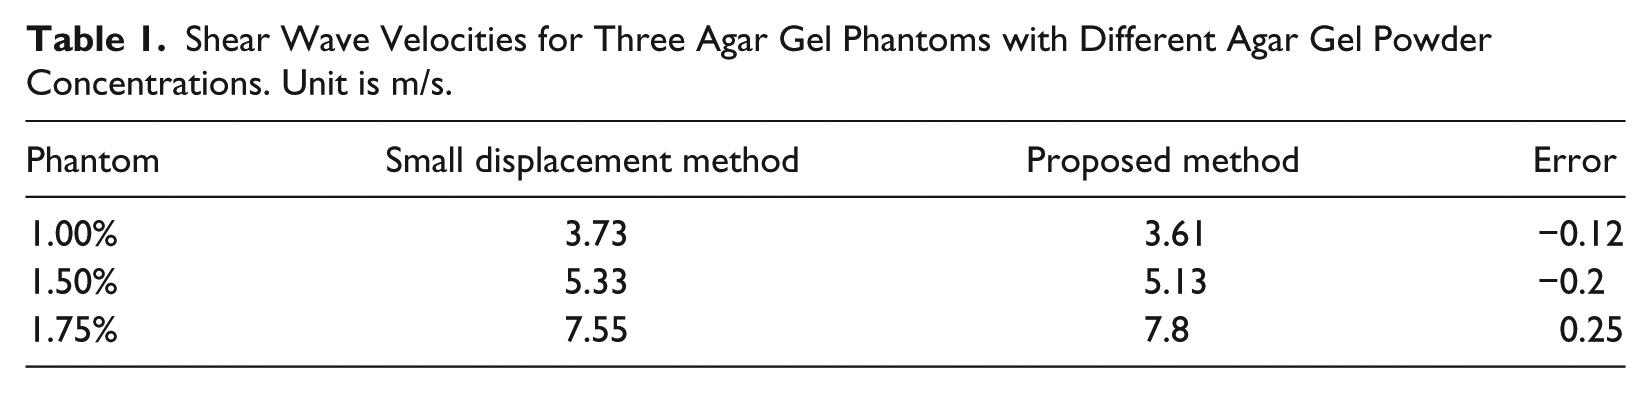
Figure 6 shows the results obtained for the different shear wave excitation frequencies. Figure 6(a-1), (a-2), and (a-3) show the CFI, shear wave phase, and shear wave velocity results for the shear wave frequency of 273.6 Hz (in the case where m = 1 in Equation (4). Figure 6(b-1), (b-2), and (b-3) show the CFI, shear wave phase, and shear wave velocity results for a shear wave frequency of 457.8 Hz (in the case where m = 2 in Equation (4). The agar gel phantom with agar powder concentration of 1.75 w% is adopted as the phantom. It was found that the separation of the neighboring shear wave’s wavefronts in Figure 6(a-1) is wider than that in Figure 6(b-1); however, the shear wave velocity has almost the same value for the two different frequencies. The shear wave velocities that are estimated based on the ROIs shown as dashed rectangular areas in Figure 6(a-3) and (b-3) are 7.8 m/s (SD: 0.47 m/s) for 273.6 Hz and 7.6 m/s (SD: 0.32 m/s) for 457.8 Hz, respectively. In general, the shear wave attenuation increases with increasing shear wave frequency because of the viscosity of materials; however, the displacement amplitude at 457.8 Hz is at a satisfactory level to obtain the shear wave’s wavefront map in this experiment.
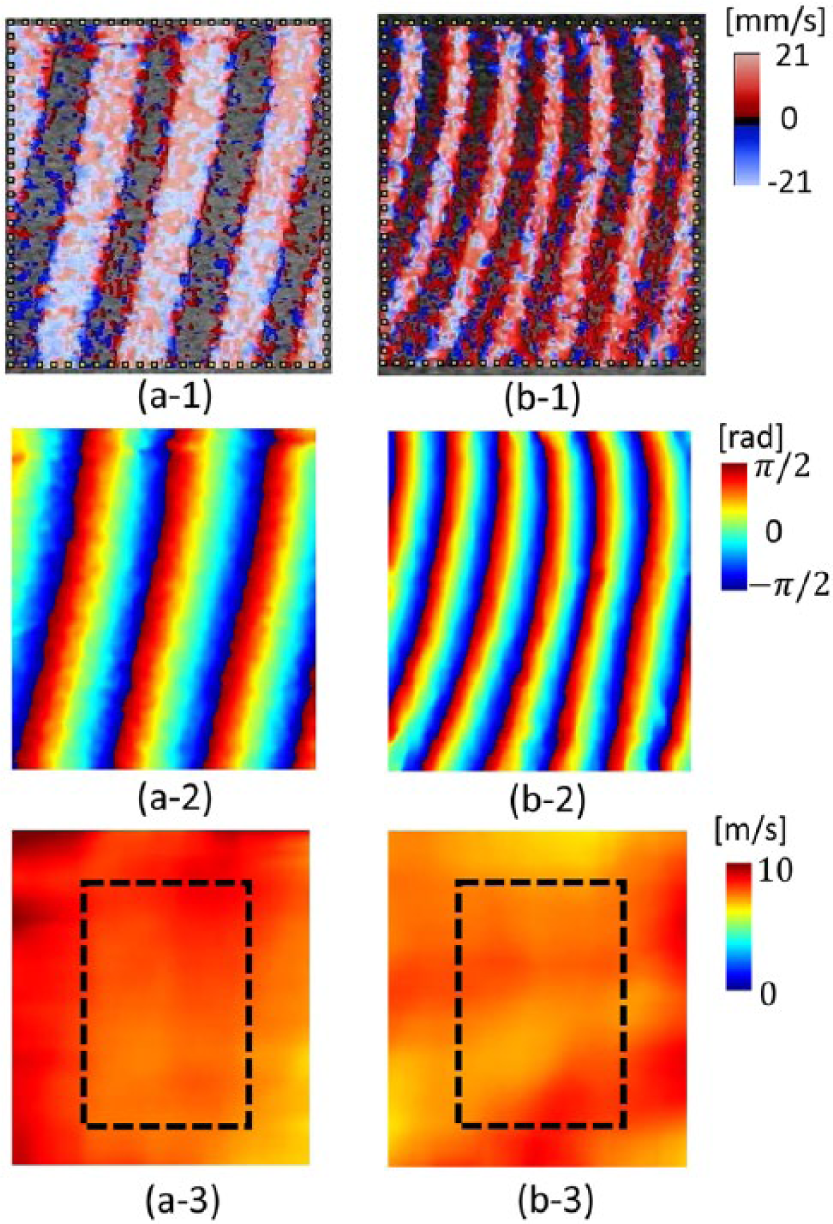
Results for the different shear wave excitation frequencies. (a-1), (a-2), and (a-3) show the CFI, shear wave phase, and shear wave velocity that were obtained for a shear wave frequency of 273.6 Hz (the case where m = 1 in Equation (4), respectively. (b-1), (b-2), and (b-3) show the CFI, shear wave phase, and shear wave velocity that were obtained for a shear wave frequency of 457.8 Hz (the case where m = 2 in Equation (4), respectively. An agar gel phantom with agar powder concentration of 1.75 w% was adopted as a phantom. The rectangular areas marked by dashed lines in (a-3) and (b-3) are the ROIs for shear wave velocity estimation. CFI = color flow imaging; ROI = region of interest.
Experiments were carried out using agar phantoms, which have different agar gel powder concentration. The results are shown in Figure 7. The agar gel powder concentration to the left of the white dotted line in Figure 7(a) was 1.5 w%. To produce a relatively soft agar gel, the right section of the gel was made using mashed agar gel (approximately 50 w%) mixed with glycerin solution (approximately 50 w%). The shear wave vibration frequency was 273.6 Hz. Figure 7(a) and (b) show the CFI results and the phase of the shear wave, respectively. Figure 7(c) and (d) show the shear wave velocity and shear wave propagation maps, respectively. The color indicates the propagation direction, as shown in the color circle. The mean shear wave velocity value on the left side of the gel is 5.3 m/s, which is consistent with the results shown in Figure 5. The mean shear wave velocity value on the right side of the gel is 2.2 m/s. The structure of the phantom can be observed clearly in both the shear wave’s wavefront and the shear wave velocity maps.
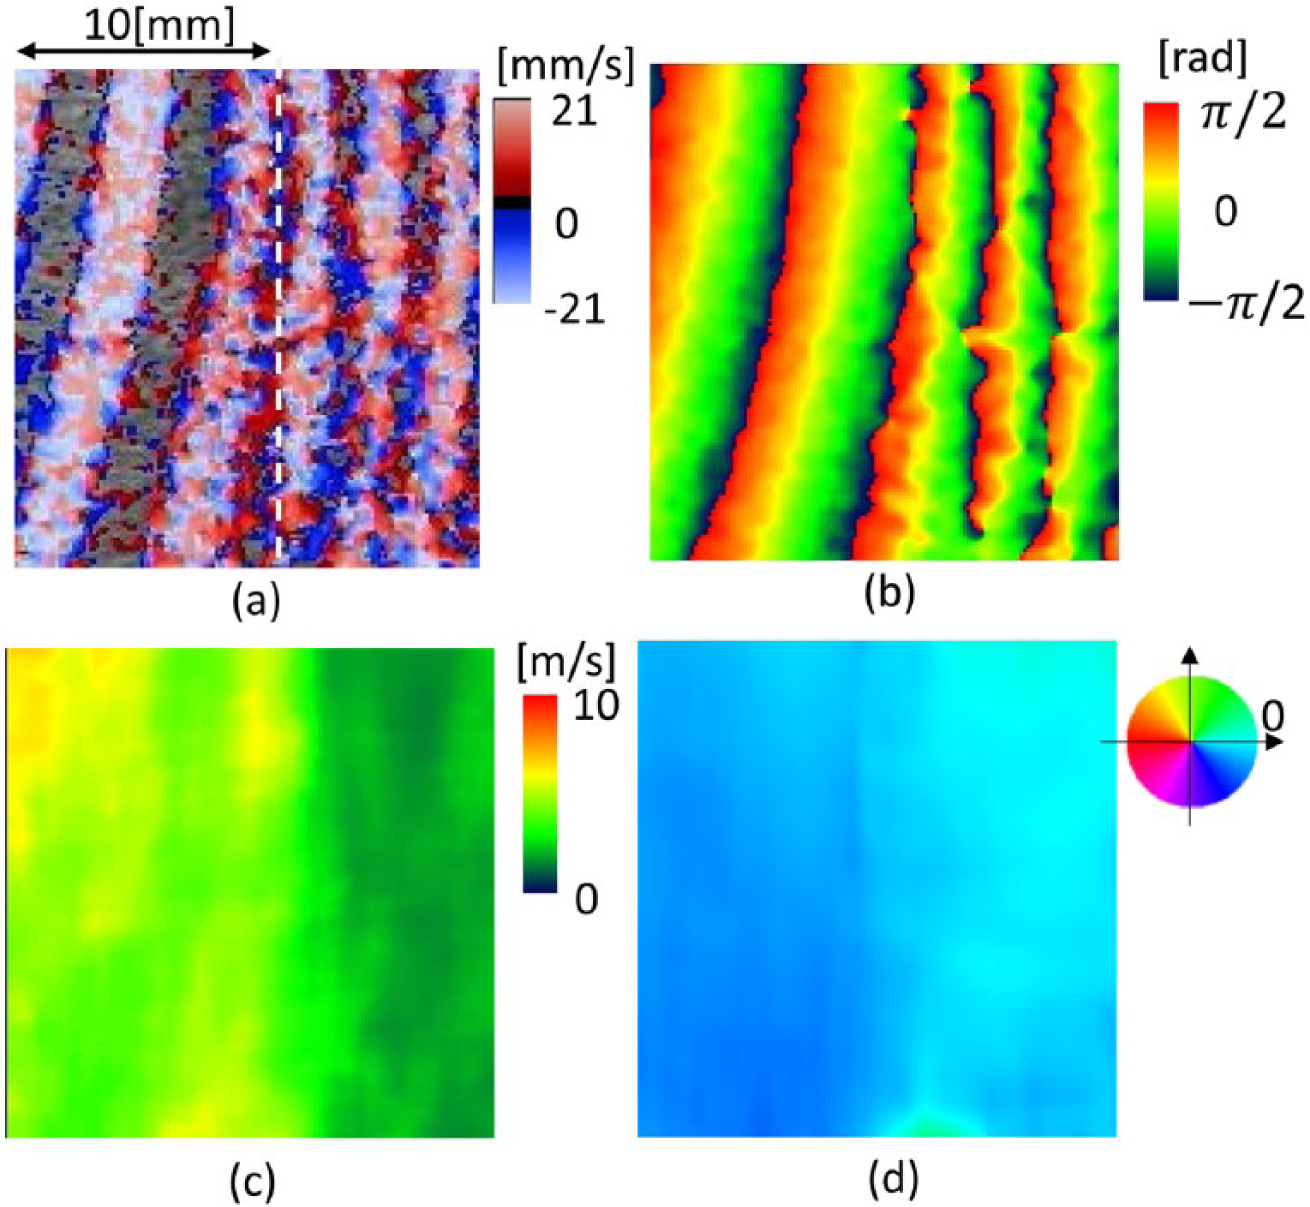
Experimental result for an agar phantom with an internal structure. The left half is a relatively hard gel, and the right half is a relatively soft gel. (a) and (b) show the CFI and the phase of the shear wave, respectively. The border between the two gels is shown as a white dashed line in (a); (c) and (d) show the shear wave velocity and the shear wave propagation direction, respectively. In (d), the color indicates the propagation direction as shown in the color circle. The vibration frequency was 273.6 Hz. CFI = color flow imaging.
Discussion
A shear wave’s wavefront reconstruction method based on ultrasound CFI is proposed. In CFI, the flow velocity is estimated using a complex-valued digital filter followed by an arctangent operation. When this algorithm is applied to the object in which the shear wave is excited, then the shear wave’s wavefront appears in CFI as a flow velocity difference when the shear wave vibration frequency and the shear wave vibration amplitude satisfy the required frequency and displacement amplitude conditions, respectively. The shear wave’s wavefront can be observed in real time without the addition of any functions to the ultrasonic CFI system. Only video capture equipment to acquire the color flow image, a vibrator to excite the shear wave, a power amplifier for the vibrator, and a PC for image processing are required. If a large-amplitude multilayer piezoelectric actuator is used as the vibrator, then the mass of the vibrator is approximately 100 g, which is easy to hold and is thus suitable for handheld clinical applications. In the acoustic radiation force impulse (ARFI) imaging method, a high-frame-rate ultrasonic imaging system was usually required to obtain the shear elastic wave image because the Doppler frequency shift signal was higher than the Nyquist frequency, which is defined as half of the ultrasonic wave repetition frequency. However, in the proposed method, the shear wave’s wavefront map is obtained directly using a general-purpose CFI system, because the Doppler signal frequency that is caused by sinusoidal displacement of the shear wave shifts to a lower frequency via an aliasing effect. Also, the complex-valued signal processing method that is used for CFI produces a binary pattern when the vibration amplitude satisfies the required displacement amplitude condition. This binary pattern means that the image processing requirements for shear velocity estimation are simpler than those required to process a gray scale pattern.
One problem with the proposed method is the low signal-to-noise ratio of the image, because the CFI algorithm is optimized for blood flow velocity measurement. However, the image quality can be improved effectively by applying a Fourier analysis method, as demonstrated in Figure 4. A second problem with the method is that two conditions must be satisfied to obtain the maps. The shear wave frequency must satisfy the frequency condition shown in Equation (4). However, while this condition depends on the pulse repetition frequency, the shear wave frequency is chosen from several frequencies. For example, the possible shear wave frequencies for the pulse repetition frequency of 365 Hz are 91.25 Hz, 273.75 Hz, and 456.25 Hz. The shear wave displacement amplitude must satisfy the displacement amplitude condition of Equation (5). For example, the wavelength of 6.5 MHz ultrasonic wave is 231 µm for the sound velocity of 1500 m/s. Then, the minimum displacement amplitude, which is given by
In the proposed method, a continuous shear wave is adopted for imaging of the shear wave velocity. Parker’s group used two continuous shear waves, which were excited using two vibrators.7,8 In this paper, a method for imaging of a traveling shear wave excited by a single vibrator is proposed. Traveling shear wave imaging is useful, for example, when the shear wave from one of two vibrators does not reach the imaging area through the bone.
One problem with traveling shear wave imaging is that the shear wave velocity estimation accuracy is reduced when the shear wave is a standing wave. If the shear wave is reflected at the tissue boundary, then the reflected wave produces a standing shear wave. In the experiments, though a continuous shear wave is generated to the relatively small phantom (140 mm in diameter and 100 mm in height), we did not see any standing wave. However, the generation of the standing wave is easily visualized from the phase shift of the wavefront to within one wavelength because the shear wave’s wavefront can be observed directly in the proposed method. In this case, the standing wave is suppressed by increasing the shear wave frequency or by changing the shear wave excitation position, and the results of trial measurements are easily understood from the images.
Out-of-imaging plane propagation of the shear wave also reduces the shear wave velocity estimation accuracy. In this case, the optimum shear wave excitation point is the point at which the shear wave’s wavelength reaches its shortest length on the shear wave’s wavefront map. Real-time observation of the shear wave’s wavefront makes it easy to set the vibrator at the optimum position.
We compared the proposed method with a shear wave imaging method based on small displacement measurements. The small displacement measurement method evaluates the shear wave phase at all points on the ROI by applying a Fourier analysis to the estimated small displacement caused by shear wave propagation. While this method is used here as a reference shear wave imaging method, it is not suitable for real-time applications because high CPU power is required to obtain the final image.
Conclusion
We propose a shear wave’s wavefront reconstruction method for continuous shear wave excitation. This method uses the signal processing unit that is used in ultrasound CFI systems. This signal processing unit consists of a complex-valued digital filter for the quadrature detector output signals and an arctangent operation, which is used to improve the flow velocity estimation accuracy. When this signal processing method is applied to an object that is vibrated by the shear wave, zero and maximum flow velocities appear at the shear wave vibration phases of zero and π rad, respectively. Both the frequency condition that defines the vibration frequency of the shear wave and the displacement amplitude condition that defines the amplitude displacement of the shear wave must be satisfied for observation of the shear wave’s wavefront. However, the shear wave’s wavefront can be reconstructed without the addition of any extra functions to a general-purpose ultrasonic CFI system. This method provides a simple technique for shear wave image reconstruction. The proposed method is evaluated by comparison with shear wave’s wavefront imaging based on the small displacement measurement method, which uses completely different data acquisition hardware and algorithms to reconstruct the shear wave’s wavefront. The good agreement between the shear wave velocity measured by the proposed method and that measured by the shear wave imaging system based on small displacement estimation demonstrated the effectiveness of the proposed method.
Footnotes
Appendix A
Appendix B
Declaration of Conflicting Interests
The author(s) declared no potential conflicts of interest with respect to the research, authorship, and/or publication of this article.
Funding
The author(s) received no financial support for the research, authorship, and/or publication of this article.