






Abstract
This work is presented with the objective to assess quantitatively the impact of modified anisotropic diffusion–based enhancement method of Mittal et al. in computer-aided classification of focal liver lesions. This assessment was made before and after enhancement of clinically acquired ultrasound images with the comparison of (a) discrimination capability of radiologically important texture contrast feature using box plot and p-value statistics and (b) test results of designed computer-aided classification schemes to detect/classify focal liver tissues using receiver operating characteristic curves. The results reveal that the application of enhancement method on clinically acquired ultrasound image may effectively improve the confidence of clinicians/radiologists in computer-aided diagnostic solutions to detect and classify focal liver lesions.
Keywords
Introduction
Worldwide, medical imaging modalities such as ultrasound, computed tomography (CT), and magnetic resonance imaging (MRI) are used by the radiologists in diagnosis of focal liver lesions.1,2 Among them, ultrasound is recognized as the most risk-free imaging modality to identify a disease in soft tissues of human body. Usually, focal liver lesions are found incidentally in asymptomatic patients on routine ultrasound and in patients having acute abdominal pain or cirrhotic liver on surveillance ultrasound. Ultrasound can detect morphological changes in the liver and characterize cystic versus solid focal lesions with high accuracy. However, it can be found to be limited in the detection and further characterization of focal liver lesions in comparison with CT and MRI. The huge cost of CT/MRI is a major constraint to patients, especially in developing countries where most of the patients generally come from low socioeconomic status. Also, it is not possible for patients to afford the sequence of expensive radiological examinations very often during radiological workups. B-mode ultrasound is an imaging available at low cost; therefore, it has widespread availability and a first preference among imaging modalities to screen focal liver lesions during routine clinical practice. 3 This capability of ultrasound can be improved and expanded at lower costs than CT and MRI in two ways. One way is the use of contrast agents.4-8 Another way is the use of an appropriate image processing method for contrast enhancement of ultrasound images. However, the issues associated with ultrasound contrast agents are the cost, hypersensitivity, technical difficulty, operator dependence, and availability of contrast agents. Therefore, the use of an image processing method remains a better and safer alternative to improve the visibility of liver lesions and their diagnosis in comparison with that of contrast agents. Mittal et al. have developed a modified anisotropic diffusion method for enhancement of ultrasound images. 9 Modified anisotropic diffusion–based enhancement method was designed under the guidance of expert radiologists according to their requirements. Radiologists preferred enhancement of ultrasound images in terms of contrast to achieve a better visualization of ultrasound image texture and so better visual lesion detection/tissue classification. The method was evaluated by both objective and subjective criteria to show the improvement in visual quality of ultrasound images. Furthermore, few works have applied the same enhancement method on ultrasound images to design a computer-aided diagnostic solution for identification of local liver lesions.10-11 These works used the enhancement method by getting support of the fact that image visual quality improvement may lead to better tissue classification and so clinical diagnosis. However, a question arises here: “How much is the improvement in diagnostic yield of ultrasound imaging in focal lesion identification with the application of this enhancement method?” The factual answer can be found out only (a) by making a quantitative assessment of increment in discrimination capability of texture contrast feature after applying enhancement method and (b) by designing various computer-aided detection/classification schemes using enhanced ultrasound images and comparing their diagnostic performances with that of the corresponding detection/classification schemes designed using unenhanced ultrasound images.
Therefore, in this work, an assessment was made to show an improvement in enhanced images in detection/classification of focal tissues with texture contrast feature to support quantitatively an improvement in visual diagnosis of radiologists. It was done by comparing box plot and p-value statistics of texture contrast with both unenhanced and enhanced ultrasound images. Subsequently, 32 different computer-assisted diagnostic schemes were designed: 16 with unenhanced ultrasound images and 16 with enhanced ultrasound images. Ultrasound images were related to focal lesions, such as cyst, hepatocellular carcinomas (HCC), hemangiomas (HEM), metastases (MET), and normal (NOR) liver. Designed computer-aided diagnostic schemes to perform various binary detection/classification tasks were named as cyst/HCC, cyst/HEM, cyst/MET, cyst/NOR, HCC/HEM, HCC/MET, HCC/NOR, HEM/MET, HEM/NOR, MET/NOR, cyst/rest of the other classes, HCC/rest of the other classes, HEM/rest of the other classes, MET/rest of the other classes, NOR/rest of the other classes, and benign/malignant. Test performances of computer-aided diagnostic schemes with enhanced and unenhanced images are compared in terms of area under the receiver operating characteristic (ROC) curves.
Materials
Subjects
B-mode ultrasound images of focal lesion and normal liver were acquired from the patients who underwent a medical examination at the Department of Radiodiagnosis, Postgraduate Institute of Medical Education & Research (PGIMER), Chandigarh, India in the duration of March 2008 to May 2009. The study was approved by the medical research ethics committee of the institute. A total of 88 patients were enrolled for ultrasound examinations in this period. There were 52 men (age range = 23-85 years, Mage = 52 years), 35 women (age range = 24-75 years, Mage = 44 years), and one child (age = 8 years). The consents of patients were taken prior to image recording. Philips ATL HDI 5000 ultrasound scanner and a multifrequency transducer of 2 to 5 MHz range were used to acquire images. Histological characteristics of ultrasound images were confirmed by the two radiologists with 23 and 13 years of experience in abdominal ultrasound imaging. Liver image assessment criteria of radiologists were based on (a) the characteristic findings of liver lesions, (b) clinical history of the patient, and (c) disease confirmation by the biopsy/dynamic helical CT/MRI/pathological examinations. The acquired image database contains a total number of 111 B-mode ultrasound images; out of which, 95 images are of focal lesion, and 16 images belong to normal liver. The 95 images of focal liver lesion include 17 images of cyst, 15 images of HCC, 18 images of HEM, and 45 images of MET.
Data Sets
Two data sets were prepared in this study: one is from clinically acquired 111 ultrasound images and termed as unenhanced data set; the other is from 111 ultrasound images obtained after enhancement and termed as enhanced data set.
Ultrasound images were enhanced by applying the regularized template 9 scheme of modified anisotropic diffusion method. 9 This enhancement method was designed as per the needs of radiologists in diagnosing focal liver lesions on ultrasound. These needs are (a) the removal of speckle up to an extent that the information hidden in texture of ultrasound images should not be distorted, (b) the reduction of blurring associated with ultrasound images to get better visibility of texture of these images, (c) the improvement in discrimination of focal lesions from its surrounding liver tissues, and (d) the improvement in contrast of ultrasound images to reduce visual fatigue in identification of small lesions hidden in dark background of liver images. Figure 1 shows some example images before and after enhancement of ultrasound images. Figure 1 A1, B1, C1, D1, and E1 are clinically acquired images (without enhancement) of five liver tissue categories, that is, cyst, HCC, HEM, MET, and NOR, respectively, and Figure 1 A2, B2, C2, D2, and E2 are the corresponding enhanced images after being processed with regularized template 9 scheme of modified anisotropic diffusion method. Areas of cyst, HCC, HEM, and MET lesions are marked by arrows. It can be clearly seen that boundary definitions of liver lesions are improved, specifically with cyst and HEM images, having higher contrast for lesions from the surrounding liver tissues in enhanced images in comparison with corresponding original images. Texture of HCC, HEM, and MET lesions with enhanced images have better visibility in comparison with that of corresponding unenhanced images. Furthermore, texture appearance and contrast of normal liver are better in enhanced image in comparison with corresponding original image.
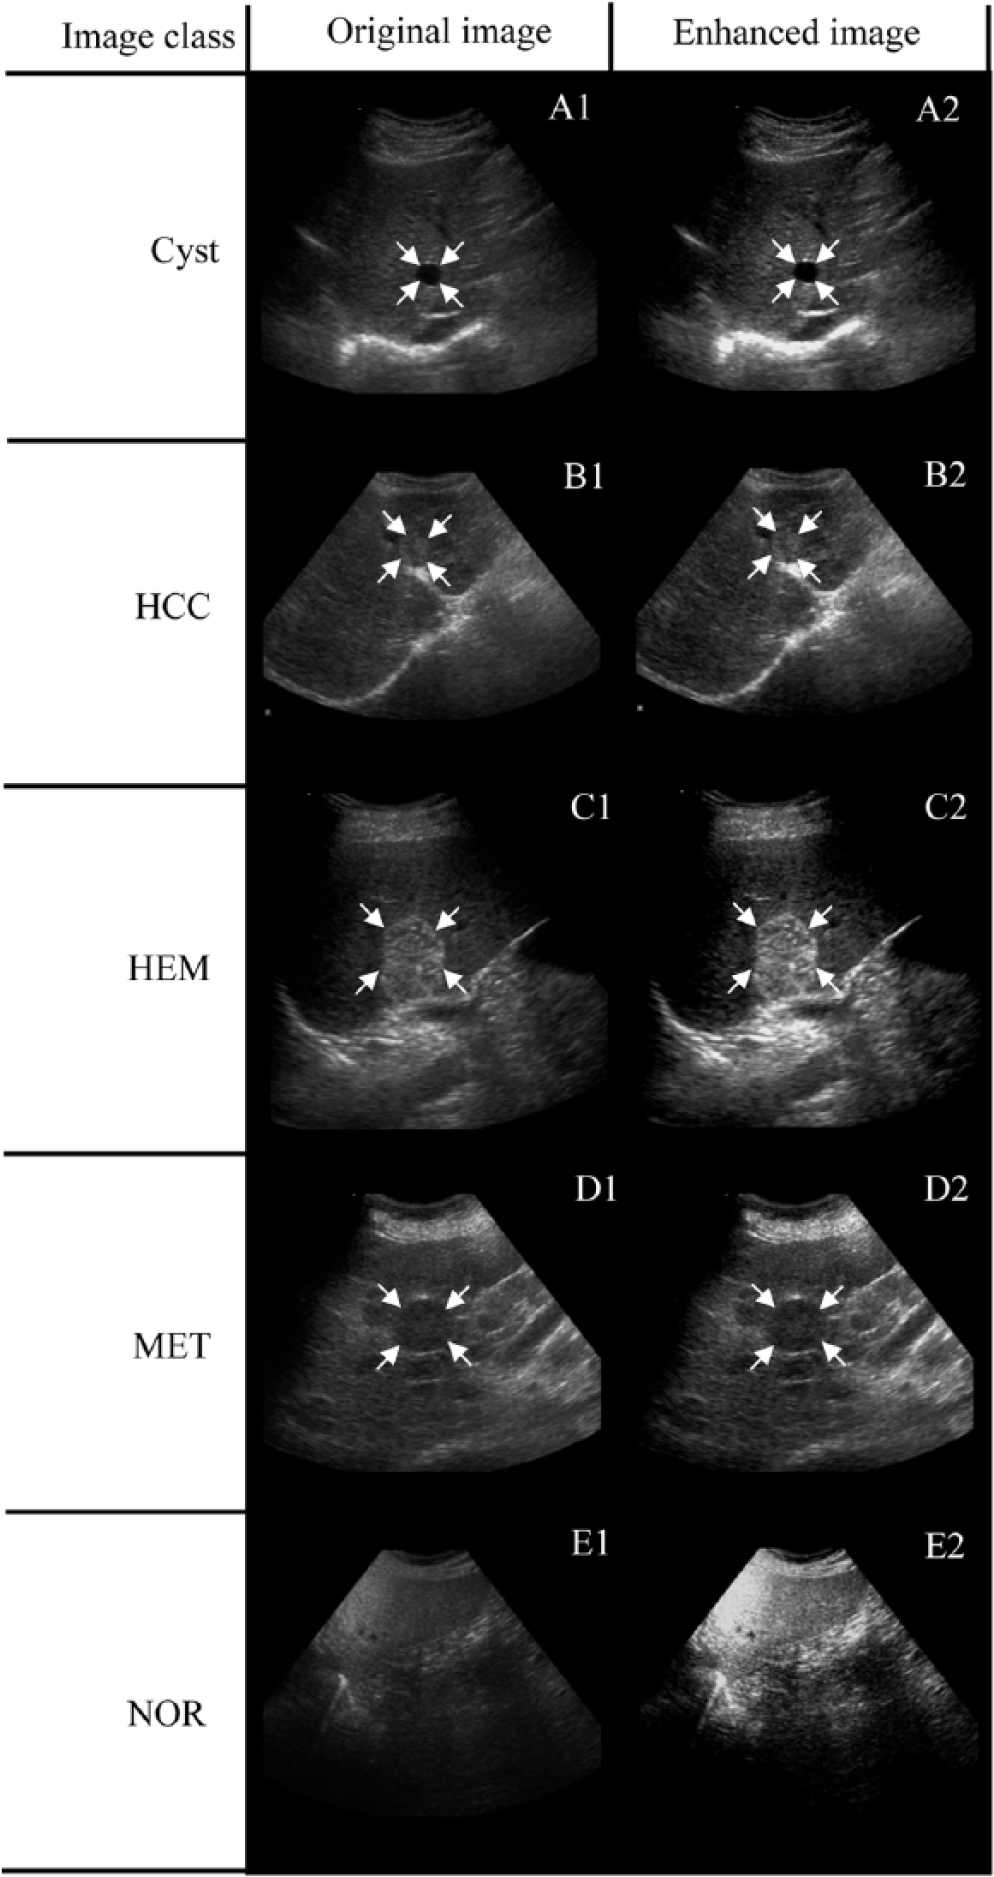
Original and enhanced ultrasound images of five liver tissue categories. HCC = hepatocellular carcinomas; HEM = hemangiomas; MET = metastases; NOR = normal.
Liver lesion areas in ultrasound images are the regions of interest (ROIs) that are marked by an expert radiologist. These ROIs are segmented into the maximum possible number of nonoverlapping segments of fixed size and shape, and termed as segmented regions of interest (SROIs). The shape of each SROI is a square with the size of 25 × 25 pixel area, and 800 is the maximum possible number of SROIs that is extracted within the database of 111 ultrasound images. The first set, that is, unenhanced data set, has 800 SROIs segmented from clinically acquired 111 ultrasound images. The second set, that is, enhanced data set, also has 800 SROIs, but they are segmented on enhanced ultrasound images from the corresponding locations. Each data set is further divided into two disjoint subsets. One subset contains 250 SROIs (50 cyst, 50 HCC, 50 HEM, 50 MET, 50 NOR) and served as training data set. Another subset contains the remaining 550 SROIs (16 cyst, 177 HCC, 40 HEM, 135 MET, 182 NOR) and served as the test data set.
Method
The present work has complied with two different perspectives to demonstrate the effectiveness of enhancement method in diagnosis of focal liver lesions. These are briefed in the following sections.
Texture Contrast Feature
The first perspective is to provide quantitative description and comparison of capabilities of texture contrast feature with unenhanced and enhanced training data sets to discriminate among five liver tissue categories. Texture contrast feature is chosen here because it possesses high radiological interest. Radiologists are utmost interested in better texture contrast of ultrasound images after enhancement than that of originals during overall visual quality improvement of ultrasound images. Therefore, there is a keen interest to assess quantitatively the improvement in discriminating strength of texture contrast feature in identification of focal liver tissues.
Mathematically, the contrast feature is a measure of the amount of pixel intensity variations between a pixel and its specified neighbor over an SROI image, which can be expressed by the difference (|i − j| = n) between intensity values i and j of the neighboring pixels at the specified positions relative to each other. An SROI image with a large amount of intensity variations will have a higher value for the contrast feature compared with the SROI image with a small amount of intensity variations. Contrast feature is measured quantitatively as follows:

where Ng represents the total number of gray levels in an image and p(i, j) represents the probability or relative frequency of gray-level transitions in the set of pairs of pixels, one with intensity i and the other with intensity j, separated by a specified pixel distance.
Discrimination strength of contrast feature is measured using box plot and p-value statistics on both the data sets. Box plot provides the distribution of a feature value in liver tissue classes using five descriptive statistics: the median, the upper and lower quartiles, and the minimum and maximum data values. The “box” in the box plot, also termed as the interquartile range (IQR), represents the middle 50% of feature value in a liver image class and provides an useful indication of the “spread” of the middle 50% of the feature values in a data set for a liver tissue class. This is a more robust range for interpretation because the middle 50% is not affected by outliers or extreme values and gives a less-biased visualization of the data spread. Furthermore, student’s t-test was also used to compare the discrimination of contrast feature between any two liver tissue classes. A p value of <0.05 is considered to indicate statistical significance. The positive results of this study provide the basis for further study, which is the second perspective.
Computer-Aided Diagnostic Schemes
The second perspective is to evaluate the effectiveness of enhancement method by comparing the discriminating capability of computer-aided diagnostic scheme designed to detect/classify focal liver tissue classes with unenhanced data sets with that of diagnostic schemes designed with enhanced data sets. Computer-aided diagnostic schemes can assist radiologists in finding focal lesions during radiological examination of patients. A success of such type of diagnostic schemes depends on (a) the set of features and (b) automated decision algorithm. A set of features decides the correct detection and precise discrimination of abnormalities, whereas automated decision algorithm provide potential to produce accurate classification. Radiologists rely on textural appearances to detect and describe focal liver lesions on ultrasound images; therefore, texture features are used for the quantification of physiological properties of liver tissues. Mittal et al. have applied a set of 208 texture features, sensitive in providing discrimination among mentioned liver tissue classes, extracted from first-, second-, and higher order statistics; spatial filtering; and multiresolution approaches. 10 In another work, Mittal et al. have shown that the same set of 208 features will provide better discrimination among liver tissue categories using support vector machine (SVM) in comparison with neural network. 11 Therefore, SVM is chosen as an automated decision algorithm in present work to perform different focal lesion detection and classification tasks. SVM also has the potential to produce accurate classifications from high dimensional feature set with limited number of training samples. 12
Thirty-two binary computer-assisted diagnostic schemes are designed in this work to judge the impact of enhancement method in different diagnostic tasks. Among them, 16 are designed using unenhanced training data sets, and corresponding other 16 are designed using enhanced training data sets. The test performances of these designed diagnostic schemes are analyzed and compared in terms of ROC curves. A ROC curve is a plot that is drawn in between the true positive rate (sensitivity) and the false positive rate (1 − Specificity) by varying the discrimination threshold of a binary detection/classification scheme. Each point on the ROC curve represents a sensitivity/specificity pair corresponding to a particular discrimination threshold. A diagnostic test with perfect discrimination has an ROC curve that passes through the upper left corner (100% sensitivity, 100% specificity). Therefore, the closer the ROC curve is to the upper left corner, the higher the overall test accuracy of the detection/classification scheme. Area under the ROC curve illustrates the summary statistics of a binary detection/classification scheme.
Results
Figure 2 shows the discrimination capabilities of texture contrast feature among liver tissue classes in terms of box plots and p-value statistics, with unenhanced data set in Figure 2(a) and enhanced data set in Figure 2(b). The p-value statistics in Figure 2(a) and Figure 2(b) clearly show that the discrimination of cyst with any other class is statistically significant (p < 0.0001) on student’s t-test with both unenhanced and enhanced data sets. In addition, it is found that IQR in box plot of cyst on unenhanced data set overlaps with that of other tissue classes, whereas the same is clearly separated on enhanced data set. Furthermore, the IQR of HCC is sufficiently overlapped with that of other classes on both unenhanced and enhanced data sets, showing limited capability of contrast feature to discriminate between HCC and rest of the other classes. The comparison of Figure 2(a) and (b) shows that the cluster separation of HCC from NOR is increased after enhancement; however, the improvements in cluster separations of HCC from HEM and MET are not confirmed only by visualization of their box plots. The p values show that HCC is differed significantly from HEM on enhanced data set (p < 0.0001), whereas it has not differed significantly on unenhanced data set (p = 0.0246). HCC is not statistically different from MET on both unenhanced and enhanced data sets, having p values of 0.3517 and 0.2466, respectively. Even separation of clusters of HCC and MET has increased on enhanced data set, having lesser p value in comparison with that of unenhanced data set. The visual comparison of Figure 2(a) and (b) shows that the discriminations of HEM from MET and NOR are improved on enhanced data set. HEM/MET is statistically significant on both unenhanced data set (p = 0.0035) and enhanced data set (p = 0.0002). HEM/NOR has no significant difference (p = 0.8336) on unenhanced data set, but it has significant difference (p < 0.0045) on enhanced data set. Separation between IQRs of MET and NOR is increased on enhanced data set. MET/NOR is not statistically significant on unenhanced data set (p = 0.0958), but it is statistically significant on enhanced data set (p < 0.0001). IQR of NOR is reduced, and its discrimination from rest of the other classes is improved on enhanced data set. Finally, the study of box plots and p-value statistics shows that the discriminating power of texture contrast feature is improved after enhancement with modified anisotropic diffusion method.
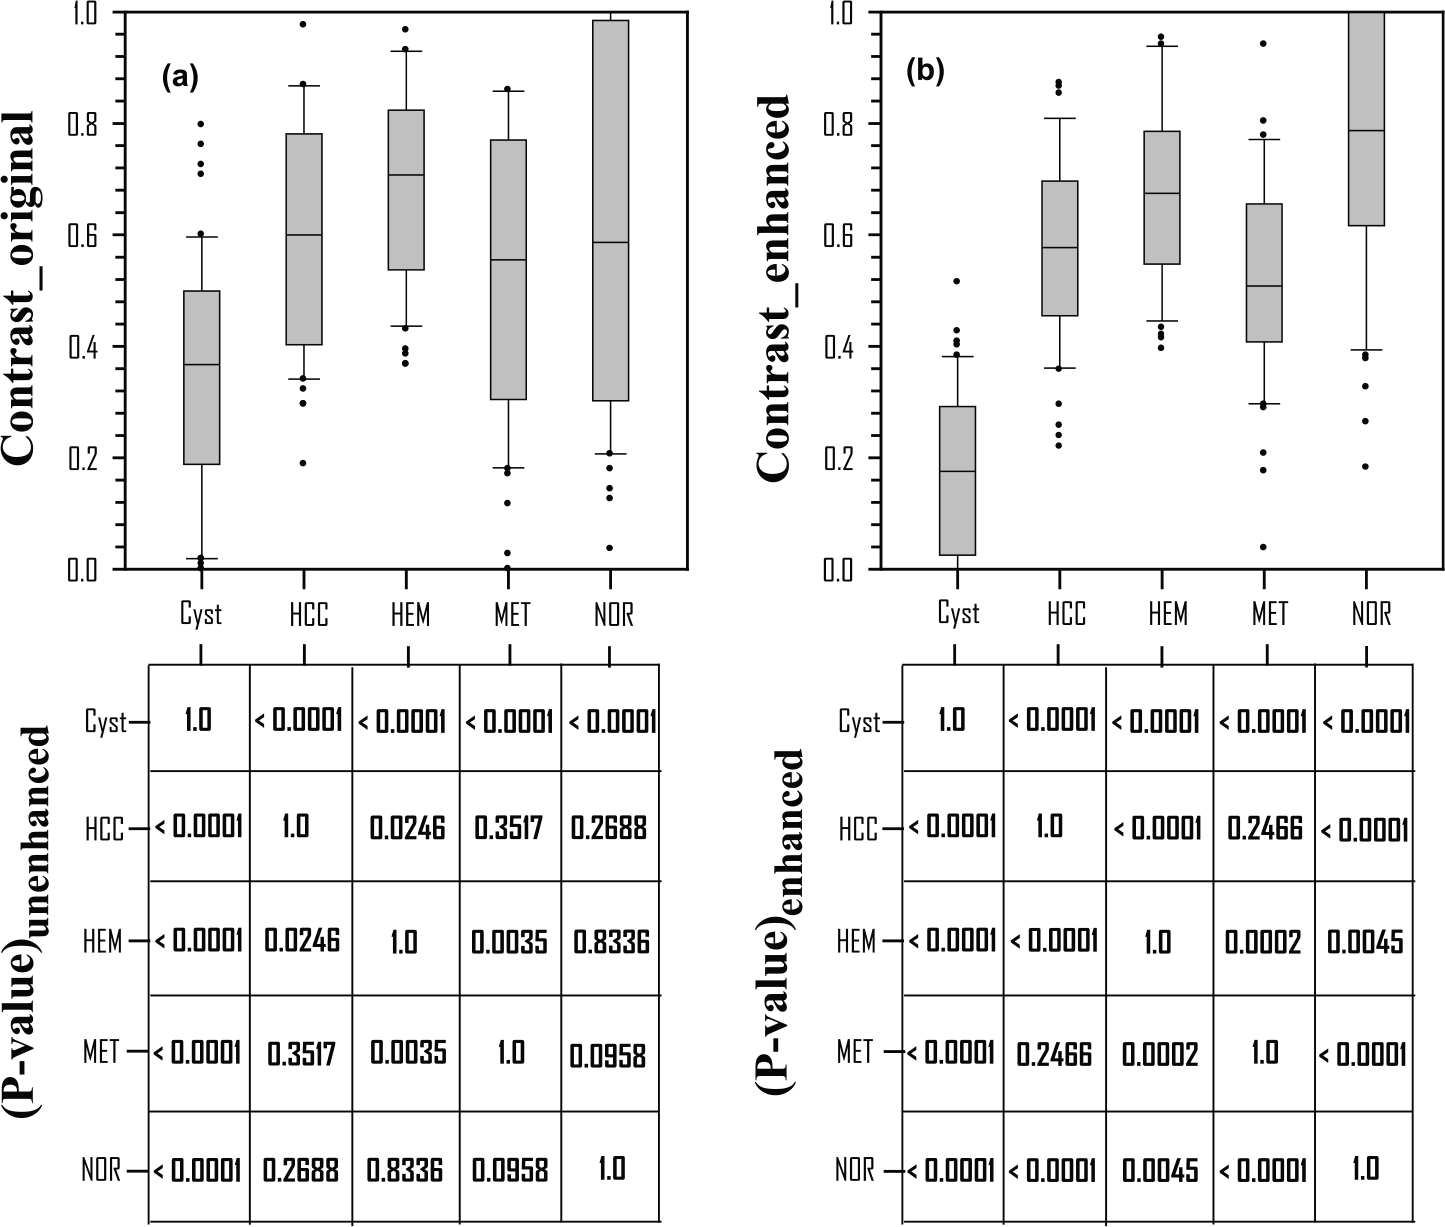
Strength to discriminate among five liver tissue classes of contrast feature in terms of box plot and p-value statistics using unenhanced (left side) and enhanced data sets (right side). HCC = hepatocellular carcinomas; HEM = hemangiomas; MET = metastases; NOR = normal.
ROC analysis is carried out to visualize the test performances of computer-aided classification schemes designed separately with unenhanced and enhanced data sets to perform a binary classification task. First, in Figure 3, the comparison of ROC areas (Az)O with unenhanced data set and (Az)E with enhanced data set has shown for 10 possible binary classification tasks considering any two liver image categories at a time. The values of (Az)O and (Az)E for the discrimination of the Cyst from rest of the other tissue classes, namely, HCC, HEM, MET, and NOR, are shown in Figure 3(a), (b), (c), and (d), respectively. These values are 1.00, 0.99, 0.98, and 0.98, respectively, with unenhanced data set, and 1.00, 1.00, 1.00, and 1.00, respectively, with enhanced data set. The values with unenhanced data set are sufficiently high for classifications of cyst from rest of the other classes, but the 100% separation of cyst from rest of the other classes is acquired with enhanced data set. The ROC areas in Figure 3(e), (f), and (g) for the discrimination of HCC/HEM, HCC/MET, and HCC/NOR are 0.79, 0.78, and 0.81, respectively, with unenhanced data set, and 0.89, 1.00, and 1.00, respectively, with enhanced data set. The values of (Az)E are much higher in these cases in comparison with the values of (Az)O. Similarly, the (Az)O and (Az)E values are 0.79 and 0.81, respectively, in Figure 3(h) for HEM/MET, and 0.93 and 0.98, respectively, in Figure 3(i) for HEM/NOR. The classifications of HEM/MET and HEM/NOR are improved slightly with 2% and 5% increase, respectively, in ROC areas with enhanced data sets. The (Az)O and (Az)E values are 0.85 and 1.00, respectively, in Figure 3(j) for HEM/NOR, which shows 15% improvement in ROC area after enhancement. Second, in Figure 4(a), (b), (c), (d), and (e), binary classification tasks for the discrimination of one image class from rest of the other classes are presented. Figure 4(a) shows the test performances, (Az)O and (Az)E, of cyst/rest of the other classes; (Az)O is sufficiently high (0.99) with unenhanced data set, and (Az)E is clear discrimination (1.00) with enhanced data set. Figure 4(b) shows that the test performance of HCC/rest of the other classes has improved greatly, with enhanced data set having 33% increase in ROC area. ROC curves for HEM/rest of the other classes are shown in Figure 2(c), and there is a small increment of 4% in ROC area with enhanced data set. Figure 2(d) and (e) shows the improvement after enhancement with increase in Az value by 15% and 25% for MET/rest of the other classes and NOR/rest of the other classes, respectively. Figure 2(f) shows the ROC curves for solid tumors, that is, benign/malignant for unenhanced and enhanced data sets, and it is improved with enhanced data set by 7%.
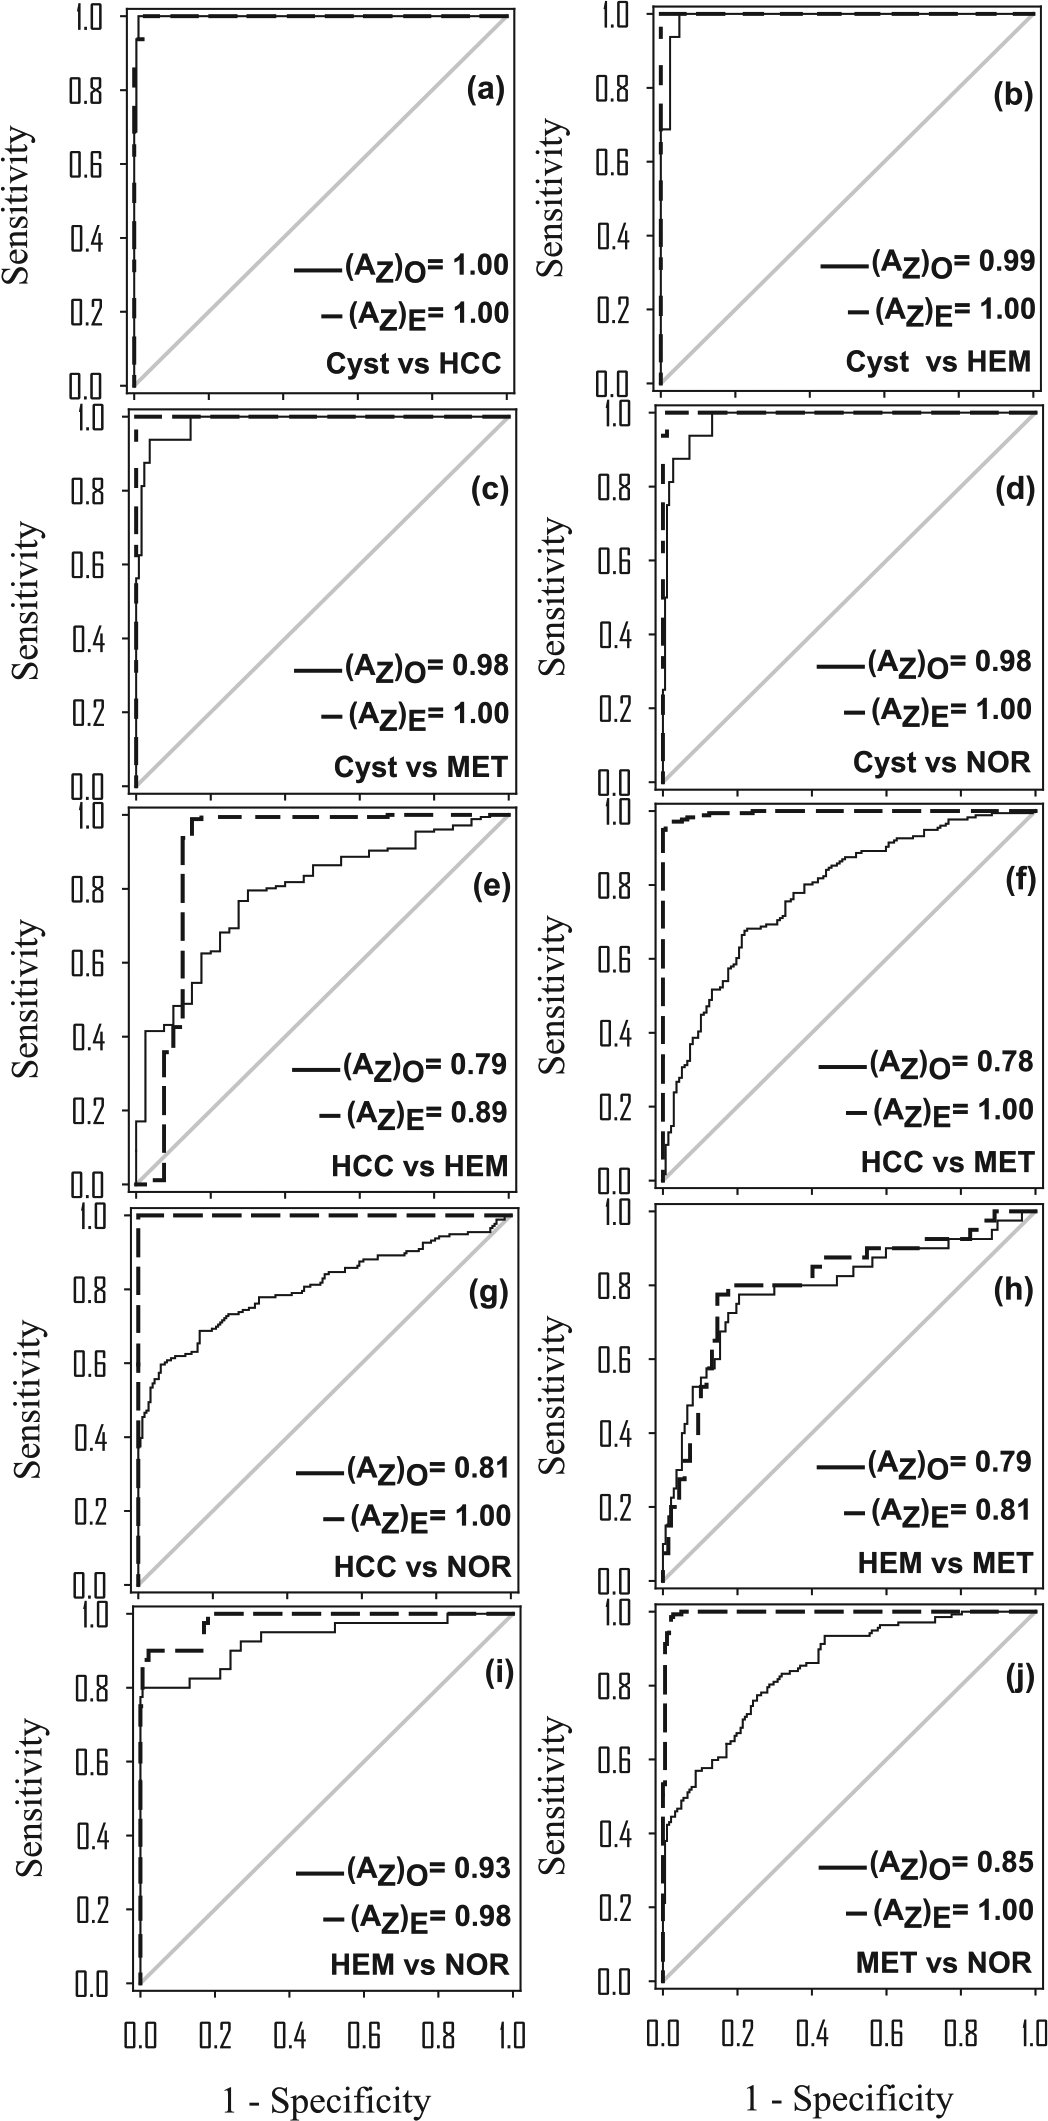
ROC curves of computer-aided classification schemes designed by considering any two liver image categories at a time with (a) unenhanced (O) and (b) enhanced (E) test data sets. ROC = receiver operating characteristic; HCC = hepatocellular carcinomas; HEM = hemangiomas; MET = metastases; NOR = normal.
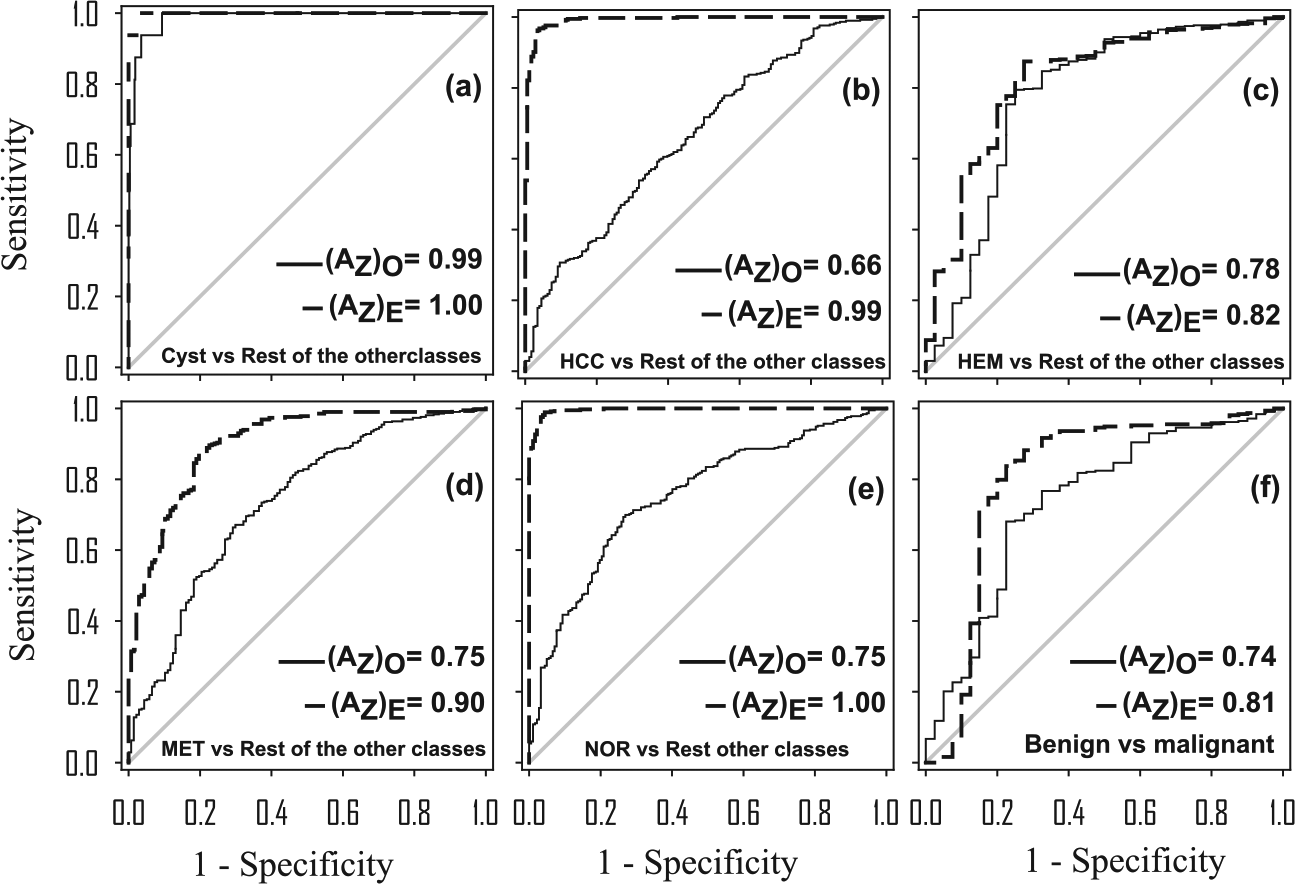
ROC curves of computer-based systems designed by considering six specific classifications between liver tissue categories with (a) unenhanced (O) and (b) enhanced (E) test data sets. ROC = receiver operating characteristic; HCC = hepatocellular carcinomas; HEM = hemangiomas; MET = metastases; NOR = normal.
Diagnostic capabilities of detection systems are also evaluated by the parameters such as accuracy, sensitivity, specificity, positive predictive value (PPV), negative predictive value (NPV), and Matthews correlation coefficient (MCC). These parameter values are listed in Table 1. The system designed for the detection of cyst shows comparable performance in terms of sensitivity and NPV, and improved performances in terms of accuracy, specificity, PPV, and MCC. The system designed for the detection of HCC shows 100% performance with enhanced data set in terms of all diagnostic parameters. HEM/NOR system have comparable accuracy, specificity, PPV, and NPV values, and improved sensitivity and MCC values with enhanced data set. All the six parameters are improved for the system designed for the detection of MET. All parameter values are improved with enhanced data set for all lesion classes/NOR system, and it shows that the detection of focal abnormalities is better with enhanced data set in comparison with the unenhanced data set.
Values of Diagnostic Parameters Calculated for Computer-Based Detection Systems Designed Using (a) Unenhanced (O) and (b) Enhanced (E) Test Data Sets.

“O” represents unenhanced data set, and “E” represents enhanced data set. HCC = hepatocellular carcinomas; NOR = normal; HEM = hemangiomas; MET = metastases; PPV = positive predictive value; NPV = negative predictive value; MCC = Matthews correlation coefficient.
Studies reported with contrast agents show that accuracy, sensitivity, and specificity were in the range of (a) 75 to 94.5, 92.8 to 93.2, and 96.2, respectively, for HCC/(HEM and MET);7,12 (b) 89 to 99.4, 88.0 to 95.6, and 80.8 to 100, respectively, for HEM/(HCC and MET);5-7,12 and (c) 92.0 to 98.2, 87.0 to 94.0, and 99.6, respectively, for MET/(HCC and HEM).6,7,12 Accuracy, sensitivity, and specificity of the classification systems designed using the regularized MSRAD-template 9 enhancement method are (a) 97.7, 98.8, and 96.7, respectively, for HCC/(HEM and MET); (b) 89.0, 81.0, and 95.0, respectively, for HEM/(HCC and MET); and (c) 87.5, 86.0, and 97.0, respectively, for MET/(HCC and HEM). These results with enhanced data sets are in comparable ranges with that of contrast agents. Therefore, enhancement method provides a noninvasive substitute in the diagnosis of important focal lesions on B-mode ultrasound images.
Discussion
The detection and classification of focal liver lesions on B-mode ultrasound image without enhancement is limited. In the present study, a significant improvement is demonstrated in diagnosis of focal liver lesions by B-scan ultrasound images using the modified anisotropic diffusion–based enhancement method. Modified anisotropic diffusion–based enhancement method has considerably improved the possibilities of ultrasound in the assessment of liver tumors. The study aimed to provide the quantitative evidence of its benefits. The enhancement method improves the contrast of the ultrasound images. Therefore, the discriminating strength of contrast feature was presented with the help of box plot and p-value statistics. The width of IQR in box plot is reduced for each liver image class with enhanced data set in comparison with unenhanced data set, which in turn improves the capability of contrast feature in discrimination among focal liver classes with enhanced data set (Figure 2). Moreover, the p-value statistics for HCC/MET was not statistically significant with enhanced data set. Therefore, to design a system for clinical purpose, a set of relevant features is necessary to select, which can provide the effective discrimination for all possible combination among the liver tissue classes. Two hundred eight sensitive features in providing the discrimination among five liver image classes along with contrast feature are considered in diagnostic system designing. The strength of feature set with classifier is tested on 550 SROIs for both enhanced and unenhanced data sets. The performances of binary classification studies, by considering the discrimination between two liver image classes and six more possibilities, show that the (Az)E values are higher than the (Az)O values for all the 16 possible binary combinations (Figures 3 and 4). Thus, ROC curves indicate the improved diagnostic performances of classification and detection systems with the enhancement method. The significant performance gain with enhancement was observed for HCC/HEM, HCC/MET, HCC/NOR, MET/NOR, HCC/rest of the other classes, MET/rest of the other classes, and NOR/rest of the other classes. These results increase the confidence level with use of enhancement method for the determination of focal liver lesions and their diagnosis.
To emphasize the clinical utility of enhancement method, the values of diagnostic parameters such as accuracy, sensitivity, and specificity are shown for the three important classifications among solid lesions on present test data set. The values of these parameters lie in the range with that of contrast agents, which in turn prove its clinical usefulness.
Conclusion
A clear improvement in the diagnosis of focal liver lesions with modified anisotropic diffusion–based enhancement method was demonstrated in this work using box plot study, p-value statistics, ROC curve analysis, and diagnostic parameters. The diagnostic results with enhancement method are highly improved, especially in detection of malignant lesions that exhibit very similar baseline characteristics. Thus, the enhancement method allows ultrasound to occupy a reliable role in the noninvasive diagnosis of liver images and offers new perspectives for its use in clinical hepatology, as the method can reduce the frequency to go for the use of contrast agent or other imaging modalities. Thus, the application of modified anisotropic diffusion method improves the confidence of diagnosis of focal liver lesions with B-mode ultrasound images.
Footnotes
Acknowledgements
The author acknowledges Indian Institute of Technology, Roorkee, India and Department of Radiodiagnosis and Imaging, Postgraduate Institute of Medical Education & Research, Chandigarh, India for their support in carrying out this research work.
Declaration of Conflicting Interests
The author(s) declared no potential conflicts of interest with respect to the research, authorship, and/or publication of this article.
Funding
The author(s) received no financial support for the research, authorship, and/or publication of this article.