
Abstract
High-intensity focused ultrasound (HIFU) has demonstrated the capacity to be used for local thermal ablation in clinical surgery; however, relying solely on conventional ultrasound B-mode imaging to monitor HIFU thermal ablation and determine ablation levels remains a challenge. Here, we experimentally demonstrate the ability to use Nakagami imaging to monitor HIFU-induced thermal lesions in porcine livers ex vivo. Ultrasonic Nakagami imaging has been proven to be able to characterize tissues with different scatterer concentrations and distributions. The pathological sections from HIFU thermally ablated porcine liver tissues reveal that normal and denatured tissues significantly differ in scatterer concentration and distribution. Therefore, we believe that Nakagami imaging can be used to monitor thermal ablation by tracing Nakagami parameter changes in liver tissues. The ex vivo porcine liver experiments were performed using a homemade HIFU device synchronized with a commercial diagnostic ultrasound scanner to obtain the ultrasound envelope data before and after thermal ablation. These data were used to evaluate the performance of thermal lesion characterization using Nakagami imaging and were compared with those derived from conventional B-mode imaging. Experimental results showed that Nakagami imaging can be used to identify thermal lesions, which are difficult to visualize using conventional B-mode imaging because there is no apparent bubble formation. In cases with apparent bubble formation, Nakagami imaging could provide a more accurate estimation of lesion size and position. In addition, the Nakagami imaging algorithm is characterized by low computational complexity, which means it can be easily integrated as postprocessing for existing array imaging systems.
Keywords
Introduction
High-intensity focused ultrasound (HIFU) can noninvasively deliver concentrated energy to locations deep in the human body and induce localized thermal coagulation to cause irreversible cell damage.1,2 In the past decade, HIFU thermal ablation has been used in several clinical therapies, including the ablation of tumors in the prostate, 3 liver, 4 and other organs.5,6 Because HIFU ablation is noninvasive, a real-time imaging system is required to monitor the degree and area of thermal ablation during HIFU exposure. This requirement limited the development of HIFU ablation therapies until magnetic resonance imaging (MRI)-guided HIFU (MRgFUS) methods were proposed.7,8 Currently, MRI thermometry techniques can provide an accurate temperature map to indicate the focal point of HIFU and excellent soft tissue contrast to visualize thermal damage (also known as thermal lesions).9,10 Although MRgFUS has shown to be useful to monitor HIFU surgery, it still has some limitations: it is expensive, has a low temporal resolution, and is not appropriate for patients with magnetic metal implants.
Aside from MRI-based methods, several ultrasound-based methods have also been proposed. Conventional B-mode ultrasound images vary in contrast before and after HIFU exposure owing to the generation of tissue coagulation and cavitation bubbles.11,12 Bush et al. 13 reported that the backscatter coefficient between normal tissues and thermal lesions did not change significantly; therefore, the thermal lesion dimension is difficult to quantify with current sonographic methods because of the low contrast at the boundary between normal tissues and thermal lesions. Ultrasonic thermography traces temperature changes during focused ultrasound exposure to monitor HIFU. Noninvasive temperature estimation tracks radio-frequency signal shifts that occur owing to changes in the speed of sound with changes in temperature.14,15 However, when tissue temperature rises over 50°C, which results in necrosis, the temperature dependence of the speed of sound becomes nonlinear. 16 This result limits the applicability of ultrasonic thermography to the monitoring of HIFU during the high-temperature stage. Ultrasound elastography visualizes thermal lesions by measuring tissue displacement induced by external or internal deformation. 17 The stiffness of necrotic tissues (due to protein denaturation) is higher than that of normal tissues18,19; thus, thermal lesions can be identified using the modulus of elasticity. Although the feasibility of elastography in clinical applications has been demonstrated in human prostates in vivo, 20 it is still limited by organ heterogeneity and complexity (such as blood vessel networks), which cause low specificity and contrast-to-noise ratio (CNR) in elastography. Moreover, other methods, such as the manifold learning algorithm, have been proposed to monitor thermal lesions through the detection of HIFU-induced changes in radio frequency (RF) signals. 21
Over the past two decades, envelope statistical models of ultrasound backscattering signals have been proposed for tissue characterization.22,23 The most common of these models include the Rayleigh distribution, pre-Rayleigh distribution, Rician distribution, K distribution, homodyned-K distribution, and Nakagami distribution. Each of these models contains some information inside resolution cell such as scatterer density, cross-section, and spacing, which could describe underlying properties of tissue microstructures. For example, a Rayleigh distribution occurs when the scatterer distribution is fully developed (with a large number of scatterers at random locations) in the resolution cell; a pre-Rayleigh distribution occurs when the number of scatterers per resolution cell is low; a Rician distribution (an extension of the Rayleigh distribution) occurs when scatterers within the resolution cell are periodically located.24,25 The Nakagami distribution has been the most frequently used for tissue characterization because it can represent pre-Rayleigh, Rayleigh, and Rician distributions through the variation of the Nakagami parameter m, and it is simple to calculate.26,27 Several studies showed that Nakagami parameter imaging could be used to classify biological tissues (including breast tumor27,28), blood flow,29,30 and carotid arteries.31,32 Based on these pioneering studies, this study assumes that HIFU-induced thermal lesions can be characterized using the Nakagami parameter by associating the cell concentration and distribution with the scatterer concentration and distribution. Some studies about hyperthermia reported that there were differences in cell concentration and distribution in histological sections between denatured and normal tissues.33 -35 This evidence supports the feasibility of this study because the microstructures of normal tissues and necrotic tissues have significant differences. In addition to biological evidence, transparent tissue-mimicking phantom experiments support that the Nakagami distribution can potentially evaluate the formation of HIFU-induced thermal lesions. 36 Our preliminary study showed that it is feasible to use Nakagami imaging to visualize HIFU-induced thermal lesions in porcine livers. 37 Rangraz et al. repeated our preliminary work in porcine muscle tissues and proposed two indices different from those in our preliminary work for thermal lesion detection; however, in their results, there was no significant difference between the pre- and postablation Nakagami parameters for porcine muscle tissue. 38 Instead, there was a significant difference in the scaling parameters between pre- and post-ablation. Tsui et al. determined that Nakagami parameter imaging can be used to monitor RF ablation. 39
This study attempts to demonstrate that Nakagami parameter imaging can characterize necrotic tissues, thus potentially visualizing HIFU-induced thermal lesions. The ex vivo porcine liver experiments were performed to obtain ultrasound envelope data before and after thermal ablation. These data were used to evaluate the performance of thermal lesion characterization using Nakagami imaging and were compared with those obtained using conventional B-mode imaging. Compared with our preliminary study, in this study, an absolute difference map of the Nakagami parameters before and after HIFU thermal ablation was used, and more ex vivo experimental porcine liver data were presented. Thus, statistical analysis was performed to prove the applicability of Nakagami imaging for the characterization of HIFU-induced thermal lesions in porcine livers. Receiver operating characteristic (ROC) analysis was performed to prove that Nakagami imaging is a more effective method for the characterization of thermal lesions in porcine livers than conventional B-mode imaging. Moreover, the results of monitoring HIFU exposure as a function of time are also presented in this study, which show the feasibility of monitoring HIFU thermal therapy procedures using Nakagami imaging.
Materials and Method
Nakagami Probability Density Function
Ultrasound tissue characterization using the Nakagami model was introduced by Shankar et al. 26 The probability density function of the Nakagami distribution under the envelope R is given as follows:
where Γ and U are the gamma function and unit step function, respectively. The parameters m (Nakagami parameter) and Ω (scaling parameter) can be expressed as,
where E(.) represents the statistical average, and R represents the back-scattered signal envelope. The Nakagami parameter is a shape parameter that can dominate the Nakagami model, causing it to function as different statistical distributions. For m > 1, the envelope distribution will be the Rician or post-Rayleigh distribution. From m = 0 to m = 1, the envelope distribution changes from pre-Rayleigh to Rayleigh distribution. When m = 1, the envelope distribution is a Rayleigh distribution that indicates that the speckles are fully developed. Because different m values correspond to different conditions in scatterer concentration and distribution within the resolution cell, the Nakagami parameter can be used to identify thermal lesions during thermal ablation.
Nakagami Imaging
In this study, we followed the standard procedure for Nakagami imaging proposed by Tsui et al. 40 The RF A-line signal acquired by the ultrasound scanner is band-pass filtered (a finite impulse response filter with −6-dB stopband points at 4 and 6 MHz) for noise reduction. Then, an envelope image without logarithmic compression is created. After that, a Nakagami image is constructed using a Nakagami parametric map obtained using a sliding window to sample the envelope image to calculate the Nakagami parameter. In the following experiments, the step sizes of the sliding window along the axial and lateral directions were 0.04 mm and 0.14 mm, respectively. Note that the absolute difference map of the Nakagami parameters before and after HIFU thermal ablation is used to visualize the thermal lesions. This absolute difference map is displayed in a linear scale with a dynamic range from 0 to 1. It was found that the absolute difference map shows better contrast between the thermal lesions and the background than the indices used in our preliminary work 37 and the Rangraz et al. study. 38
The size of the sliding window for Nakagami parameter estimation is important for the spatial resolution of Nakagami imaging and the stable estimation of the Nakagami parameter. A small window can provide a higher spatial resolution image, but less envelope information can lead to the unstable estimation of the Nakagami parameter. This work follows the procedure suggested by Tsui et al. 40 to determine the optimal size of the sliding window, which can both provide acceptable spatial resolution and stable Nakagami parameter estimation. However, considering that the lateral width and axial length of the resolution cell in the ultrasound image depend on the imaging wavelength and pulse length, respectively, and are generally not equal, this work modifies the shape of the window according to the ultrasound resolution cell size instead of the square window Tsui et al. suggested. 40 According to our simulation, the optimal size of the sliding window was four times the size of the ultrasound resolution cell in this study.37,40 The axial length and lateral width of the sliding window for local Nakagami parameter estimation were 1.79 mm and 3.46 mm, respectively. The sliding window area was about 6.18 mm2. In current clinical treatments of prostate, liver, breast, kidney, bone, and pancreas cancers and soft-tissue sarcoma, the treatment areas are mostly more than 1 cm2. Therefore, the window size in this study is appropriate for estimating lesions in current clinical treatments.
Experiment Setup
The experimental setup is shown in Figure 1(a). A focused ultrasound transducer (frequency = 2 MHz, diameter = 35 mm, curvature radius = 55 mm; Sonic Concepts Inc., Bothell, Washington, USA) was used to generate an HIFU to provide stable heating for thermal ablation. The envelope data for B-mode and Nakagami imaging during thermal ablation were collected by a commercial diagnostic ultrasound scanner (Terason T-3000, Teratech Corporation, Burlington, Massachusetts) with a 128-element linear array probe with an operating range from 5 to 12 MHz. The parameters of the ultrasound imager were set as follows: a 5-MHz center frequency, 20-MHz sampling frequency, and 38 × 50 mm (width × depth) imaging field of view. The length of the acquired RF data for each A-line was 1300 samples, and each sample was stored in a 14-bit integer format. According to Yu’s report, the beam-forming method has a significant effect on the size of the resolution cell and eventually on Nakagami parameter estimation. 41 The ultrasound imaging used in this study adopted a single transmit focal zone that causes variations in the resolution-cell size along the imaging depth and subsequently affects Nakagami parameter estimation. Hence, all the experiments were designed deliberately to ensure that thermal lesions were formed in the imaging focal zone. To further ensure the ablation location, a polyacrylamide phantom is used to fix the ex vivo porcine liver tissue. The liver tissue samples were diced to a suitable size and placed in a container (40 × 40 × 60 mm3) filled with polyacrylamide. After solidifying, the polyacrylamide phantom provided an ideal surface for thermal ablation. Figure 1(b) shows the time sequence of the experiment. One operation cycle contained a 1.8-second HIFU sonication to ablate the tissue and 1.2-second idle time to acquire interference-free imaging data. The entire experimental procedure contains 20 operation cycles (60 seconds). Finally, the photographs of the cut samples were analyzed as a gross pathology to examine the size and region of the thermal lesions. Experiments were repeated for 25 samples using the above procedure.
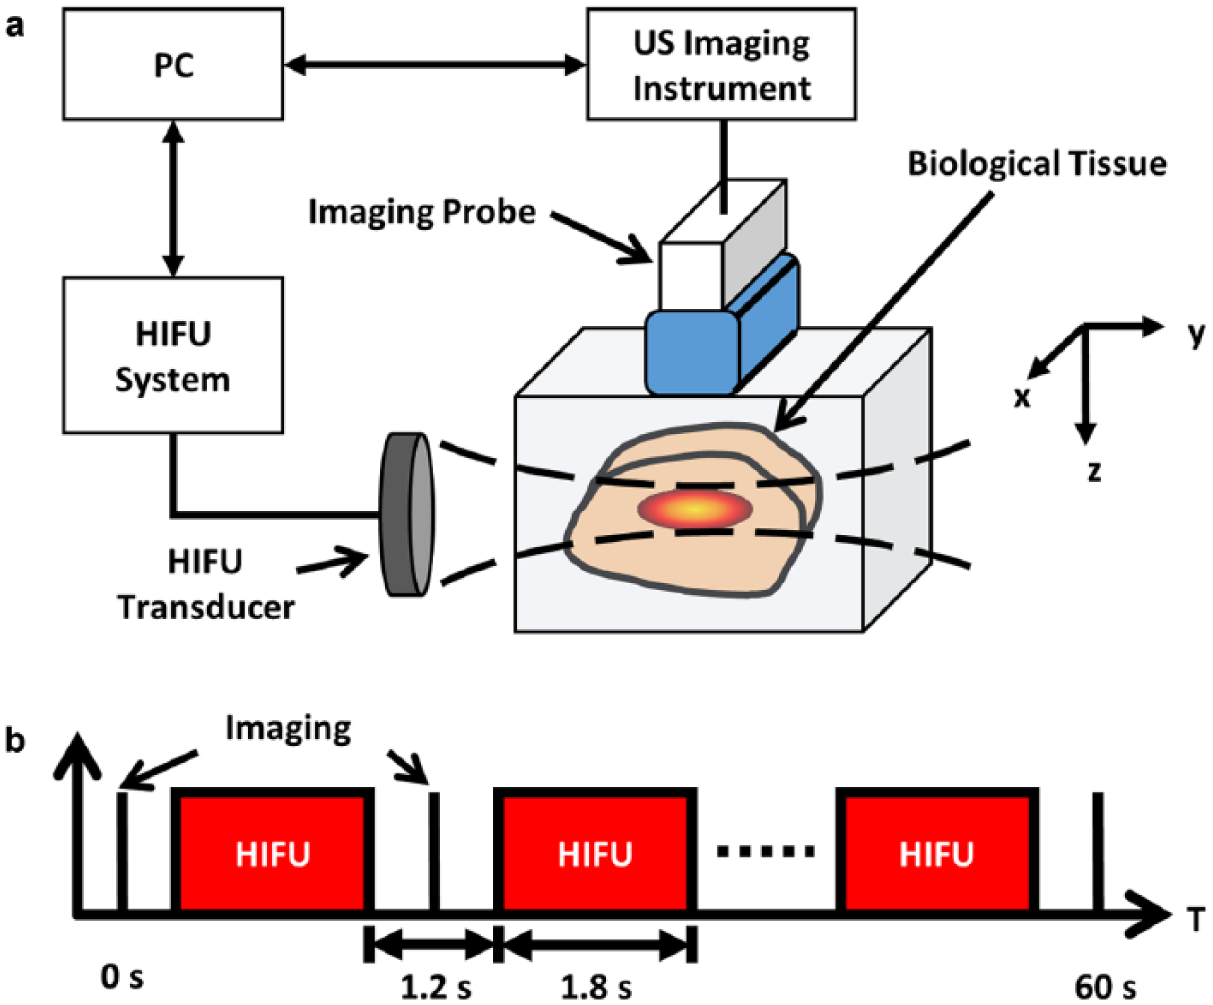
(a) Experimental setup. (b) Representative time sequence of HIFU sonication and ultrasound imaging. HIFU = high-intensity focused ultrasound.
Data Analysis
Nakagami images of all the porcine liver samples were displayed in a linear scale, and the corresponding conventional B-mode images were shown in a 60-dB logarithmic scale (i.e., a 60-dB dynamic range). The statistical mean, standard deviation, and t-test were used to demonstrate if there was a significant statistical difference before and after ablation in the denatured and nondenatured zones. Furthermore, CNR and ROC curves were used to compare the performance and sensitivity of thermal lesion visualization of B-mode images and Nakagami images. The CNR used is expressed as, 42
where µ and σ are the mean and standard deviation calculated using the log-compressed envelope for the B-mode image and the Nakagami parameter for the Nakagami image. The red and yellow boxes shown in Figure 2(g) and 4(g) indicate the regions of interest for statistical analysis and CNR calculation. The red and yellow boxes represented the denatured (target) zone and nondenatured (background) zone, respectively.
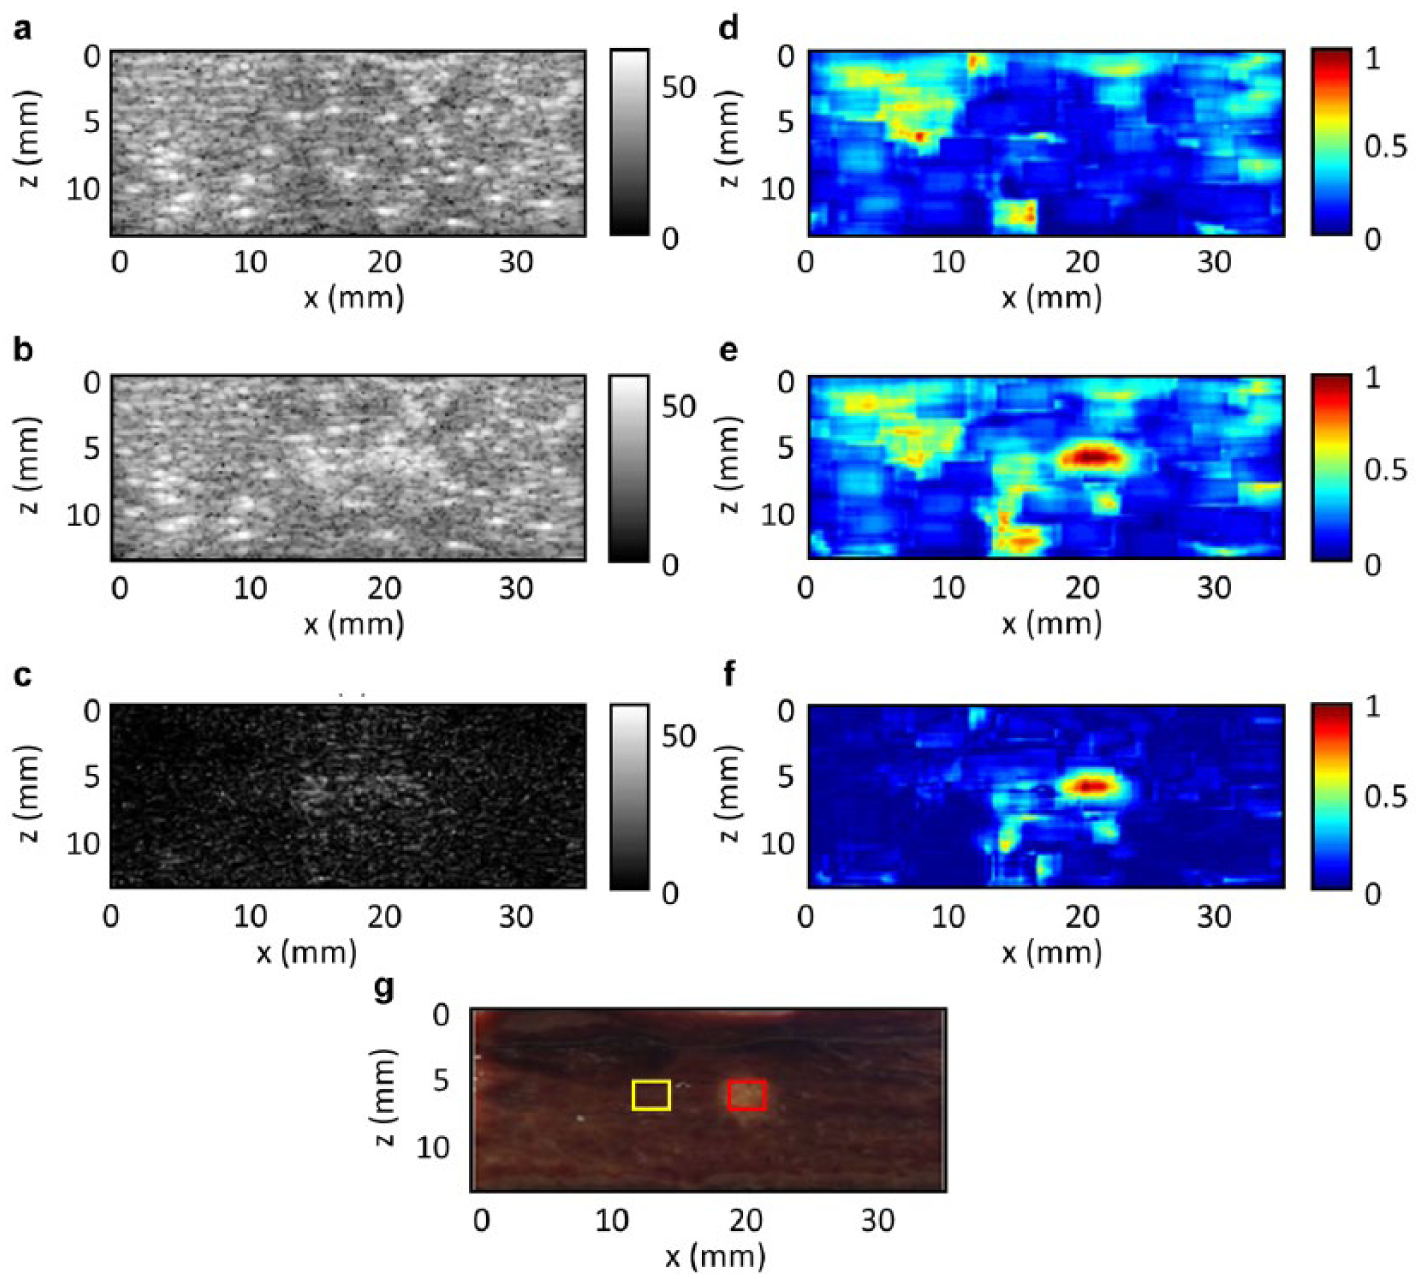
Results when there is apparent bubble formation during HIFU thermal ablation. (a) and (b) Ultrasound B-mode images before and after thermal ablation, respectively, with a 60-dB dynamic range. (c) Absolute difference ((b) – (a)) between the two B-mode images shown in (a) and (b). (d) and (e) Nakagami parameter images before and after thermal ablation, respectively. (f) Absolute difference ((d) – (e)) between the two Nakagami parameter images shown in (d) and (e). (g) Cross-sectional photo of the imaged porcine liver sample. HIFU = high-intensity focused ultrasound.
Results
With Apparent Bubble Formation
Figure 2(a) and (b) shows the B-mode images before and after ablation, respectively, and it can be observed that there is some variation between the two images. Figure 2(c) shows the absolute intensity difference between Figure 2(a) and (b) to emphasize the variation due to ablation; nevertheless, this method cannot characterize thermal lesions effectively. Figure 2(d) and (e) show the Nakagami images before and after ablation, respectively. The variation due to ablation is more apparent in the Nakagami images than that in the B-mode images. Figure 2(f) shows the absolute difference of the Nakagami parameter between Figure 2(d) and (e), which emphasizes the region with thermal lesions. Thermal lesions were characterized clearly in the Nakagami image in terms of size and location. Figure 2(g) shows a cross-sectional picture of the ablated porcine liver. Comparing Figure 2(c), (f), and (g) indicates that lesion characterization via Nakagami imaging is close to the realistic necrosis in terms of the size and location, but that of the B-mode image is not.
Figure 3 shows the statistical analysis results of the data from the case shown in Figure 2. Figure 3(a) shows that the envelope intensity increased from 30 to 43 dB in the nondenatured zone and from 34 to 48 dB in the denatured zone. Both results show that the absolute difference of intensity was strong enough to be observed by the naked eye in the B-mode images; however, both t-test results show that there was no statistically significant difference (both p values were larger than 0.001) before and after ablation.
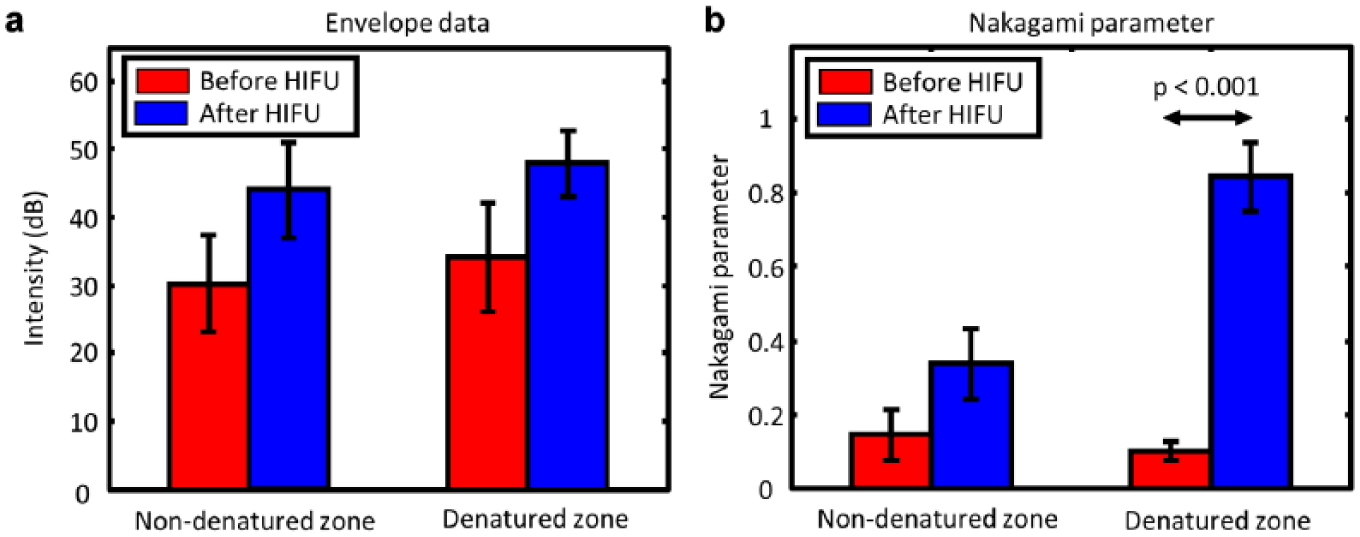
The means and standard deviations calculated in the experimental case with apparent bubble formation (shown in Figure 2). The red bars show the results before HIFU, and the blue bars show the results after HIFU. The regions used for the calculations are shown in Figure 2(g), where the red box represents the target zone and the yellow box indicates the nontarget zone. HIFU = high-intensity focused ultrasound.
Figure 3(b) shows the means of the Nakagami parameters in the nondenatured and denatured zones. Although the mean of the Nakagami parameter in the nondenatured zone increased from 0.14 to 0.33 owing to bubbles formation, there was still no statistically significant difference before and after ablation. The mean of the Nakagami parameter in the denatured zone increased from 0.09 to 0.84. Contrasting the results from the nondenatured zone, there was a statistically significant difference in the denatured zone (p < 0.001).
The CNRs show that even though bubble formation increased the envelope intensity in the B-mode image, the Nakagami image is still better at characterizing thermal lesions because the CNR of the Nakagami image (CNR = 2.98) is greater than that of the B-mode image (CNR = 0.005). These results show that Nakagami imaging can estimate the position and size of thermal ablation more precisely and robustly and has better contrast resolution than B-mode imaging when there is apparent bubble formation during thermal ablation.
Without Apparent Bubble Formation
Figure 4 shows the results of a case where there was no apparent bubble formation during thermal ablation. The B-mode images before and after ablation, shown in Figure 4(a) and (b), respectively, illustrate that intensity variation is difficult to observe by the naked eye because there was no apparent bubble formation. Figure 4(c) is the absolute intensity difference between Figure 4(a) and 4(b), and the thermal lesion still cannot be characterized effectively in the map. The Nakagami images before and after ablation, shown in Figure 4(d) and (e), respectively, show apparent variation. Figure 4(f) shows the absolute difference of the two Nakagami parameter images (Figure 4d and e) and emphasizes the region with the thermal lesions. In this case, the Nakagami image could reveal thermal lesions even when there was no apparent bubble formation during ablation. Figure 4(g) shows a cross-sectional picture of the ablated porcine liver sample. Comparing Figure 4(c), (f), and (g) indicates that lesion characterization via Nakagami imaging is better than that of B-mode imaging even when there is no apparent bubble formation during ablation.
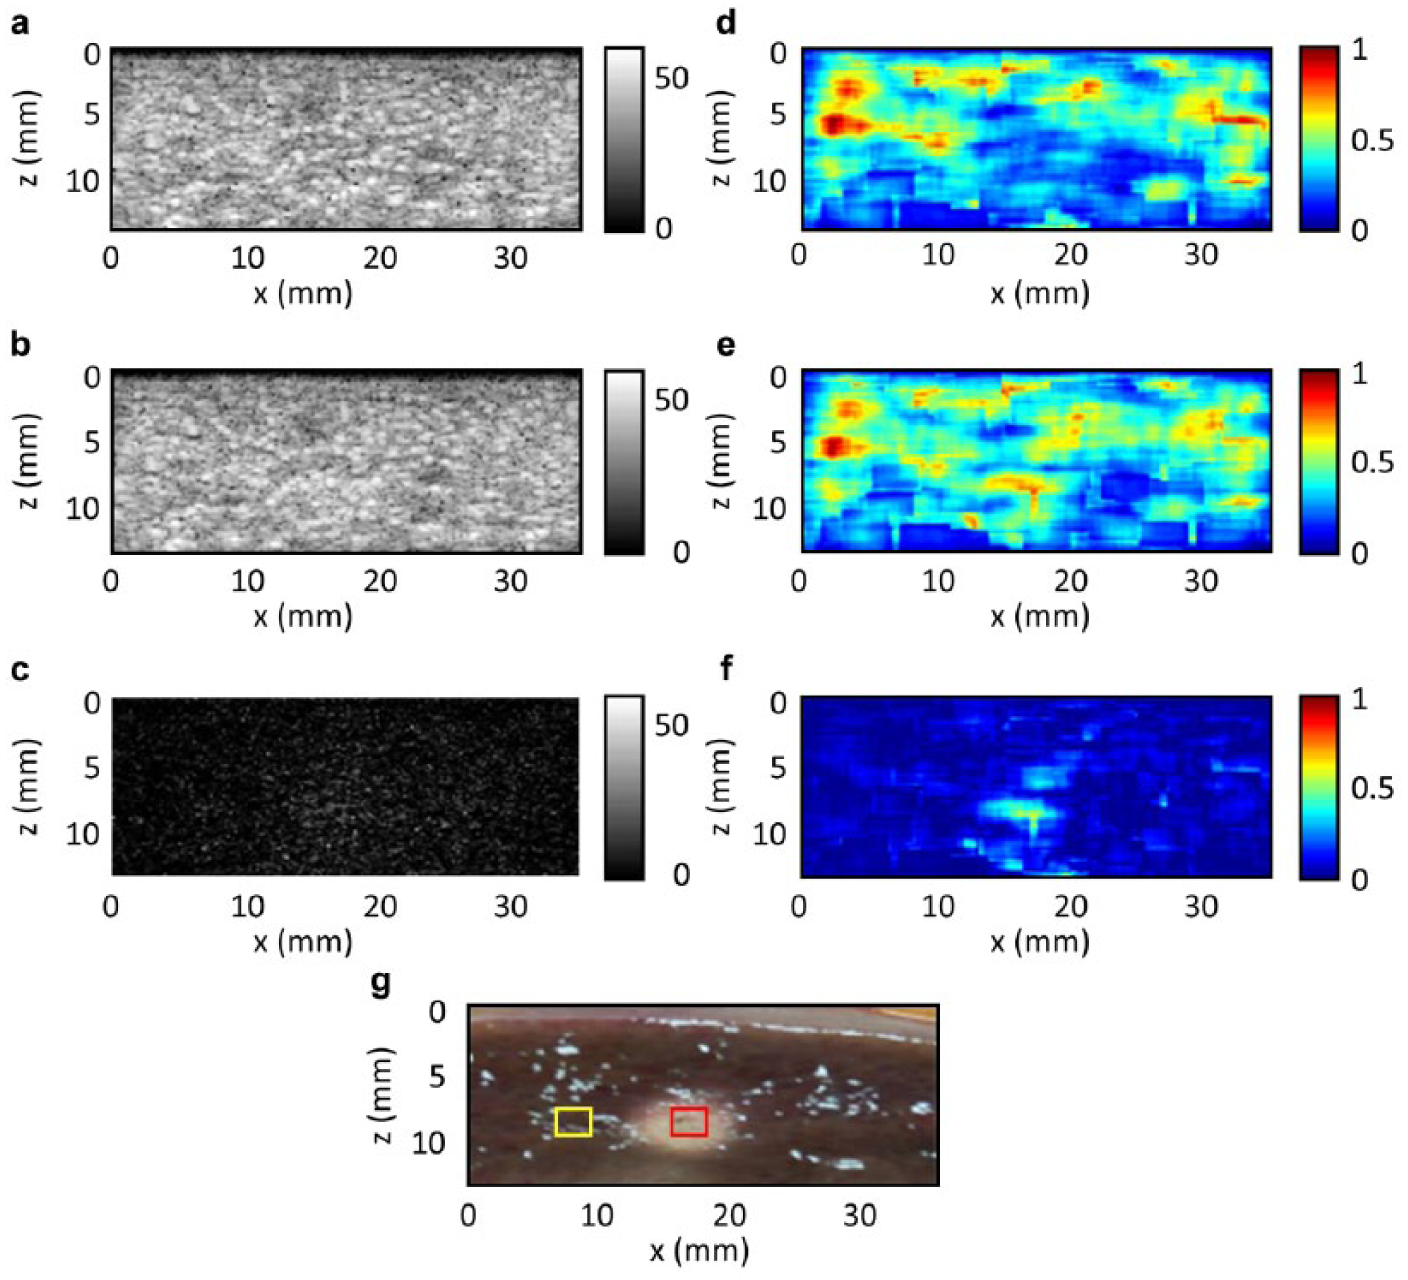
Results when there is no apparent bubble formation during HIFU thermal ablation. (a) and (b) Ultrasound B-mode images before and after thermal ablation, respectively, with a 60-dB dynamic range. (c) Absolute difference ((b) – (a)) between the two B-mode images shown in (a) and (b). (d) and (e) Nakagami parameter images before and after thermal ablation, respectively. (f) Absolute difference ((d) – (e)) between the two Nakagami parameter images shown in (d) and (e). (g) Cross-sectional photo of the imaged porcine liver sample. HIFU = high-intensity focused ultrasound.
Figure 5 shows the statistical analysis results of the case without apparent bubble formation (shown in Figure 4). The mean of the envelope intensity decreased from 41 to 39 dB in the nondenatured zone and increased from 36 to 45 dB in the denatured zone, as shown in Figure 5(a). The t-test results revealed that there was no statistically significant difference in envelope intensity in either the nondenatured zone or denatured zone before and after ablation, which concurred with the expectation in the case without apparent bubble formation. Figure 5(b) shows the means of the Nakagami parameter in the nondenatured and denatured zones. The results from the denatured zone showed that there was a significant difference because the Nakagami parameter increased from 0.2 pre-ablation to 0.6 postablation (p < 0.001); however, there was still no significant difference in the nondenatured zone. Results of CNR also show that Nakagami imaging has better lesion characterization capabilities than B-mode imaging because the CNR of the Nakagami image (CNR = 4.12) was greater than that of the B-mode image (CNR = 0.6238).
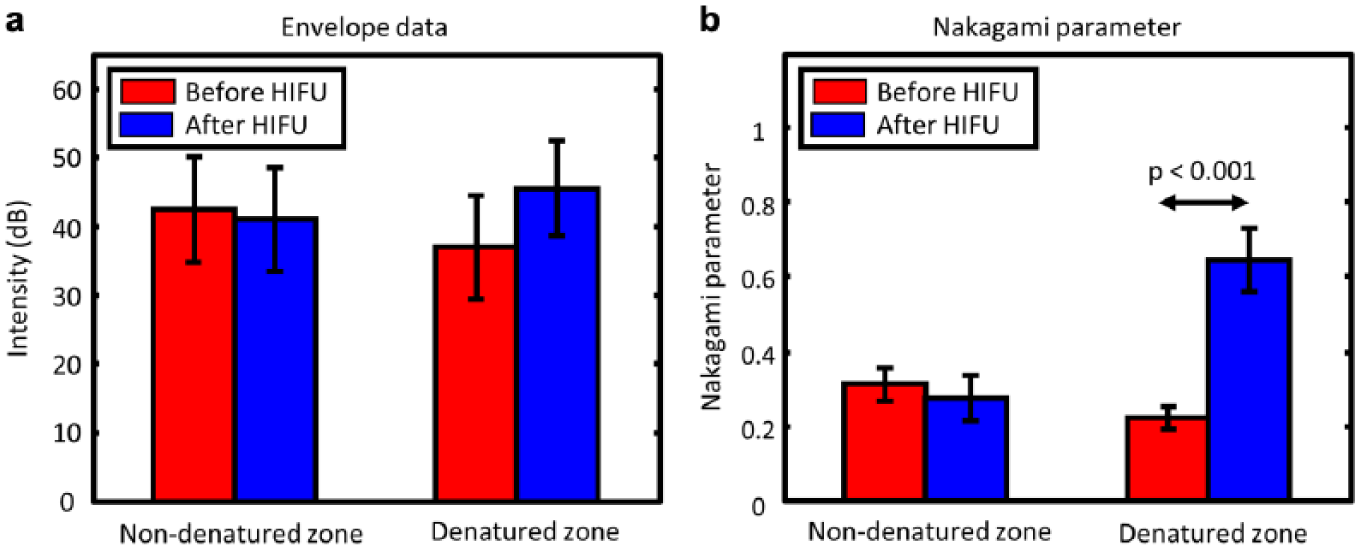
The means and standard deviations calculated in the experimental case with no apparent bubble formation (shown in Figure 4). The red bars show the results before HIFU and the blue bars show the results after HIFU. The regions used for the calculation are shown in Figure 4(g), where the red box represents the target zone, and the yellow box indicates the nontarget zone. HIFU = high-intensity focused ultrasound.
ROC Curve
ROC curves were calculated based on the envelope intensity and Nakagami parameter to evaluate the performance of thermal lesion characterization. Each cross-sectional picture of the porcine liver samples was used as the gold-standard for the ROC analysis. Figure 6 shows the ROC curves for thermal lesion characterization using the B-mode and Nakagami images. The Nakagami ROC curve has a larger area under the curve than the B-mode curve. This indicates that Nakagami imaging performs thermal lesion characterization better than the B-mode imaging. The conclusion of the ROC analysis is consistent with the conclusions of the above statistical analysis and CNR results.
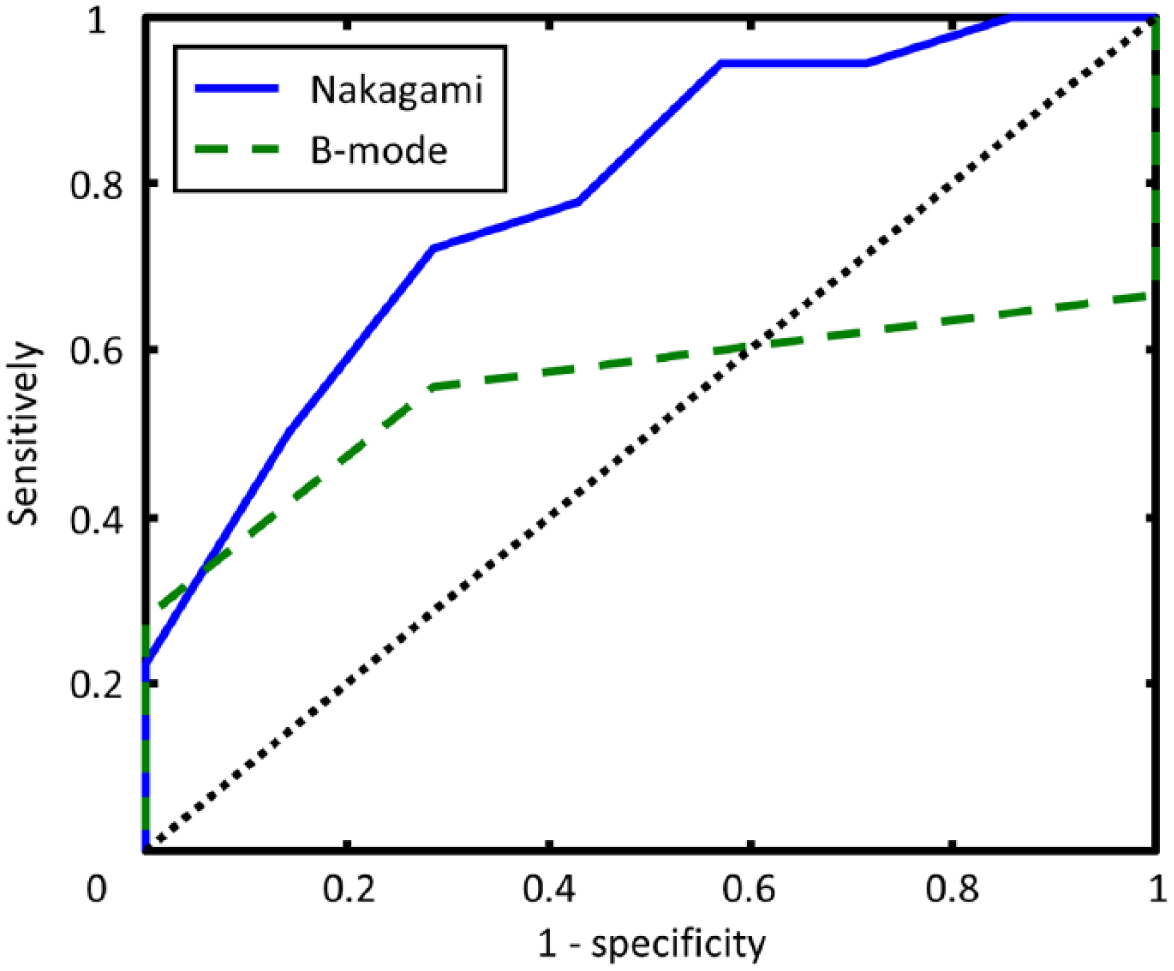
The ROC curve for the envelope intensity and Nakagami parameter. ROC = receiver operating characteristic.
Nakagami Parameter as a Function of Time during HIFU Treatment
Figure 7 shows the Nakagami parameter differential images every 8 seconds during HIFU exposure. At the beginning of HIFU exposure, during the first 8 seconds, the Nakagami parameter differential (absolute difference) image was difficult to use to reveal the thermal ablation region. As the thermal dose increased and the tissues started to coagulate, from 16 to 32 seconds, the size and area of the thermal lesions started to be clearly visible in the images.
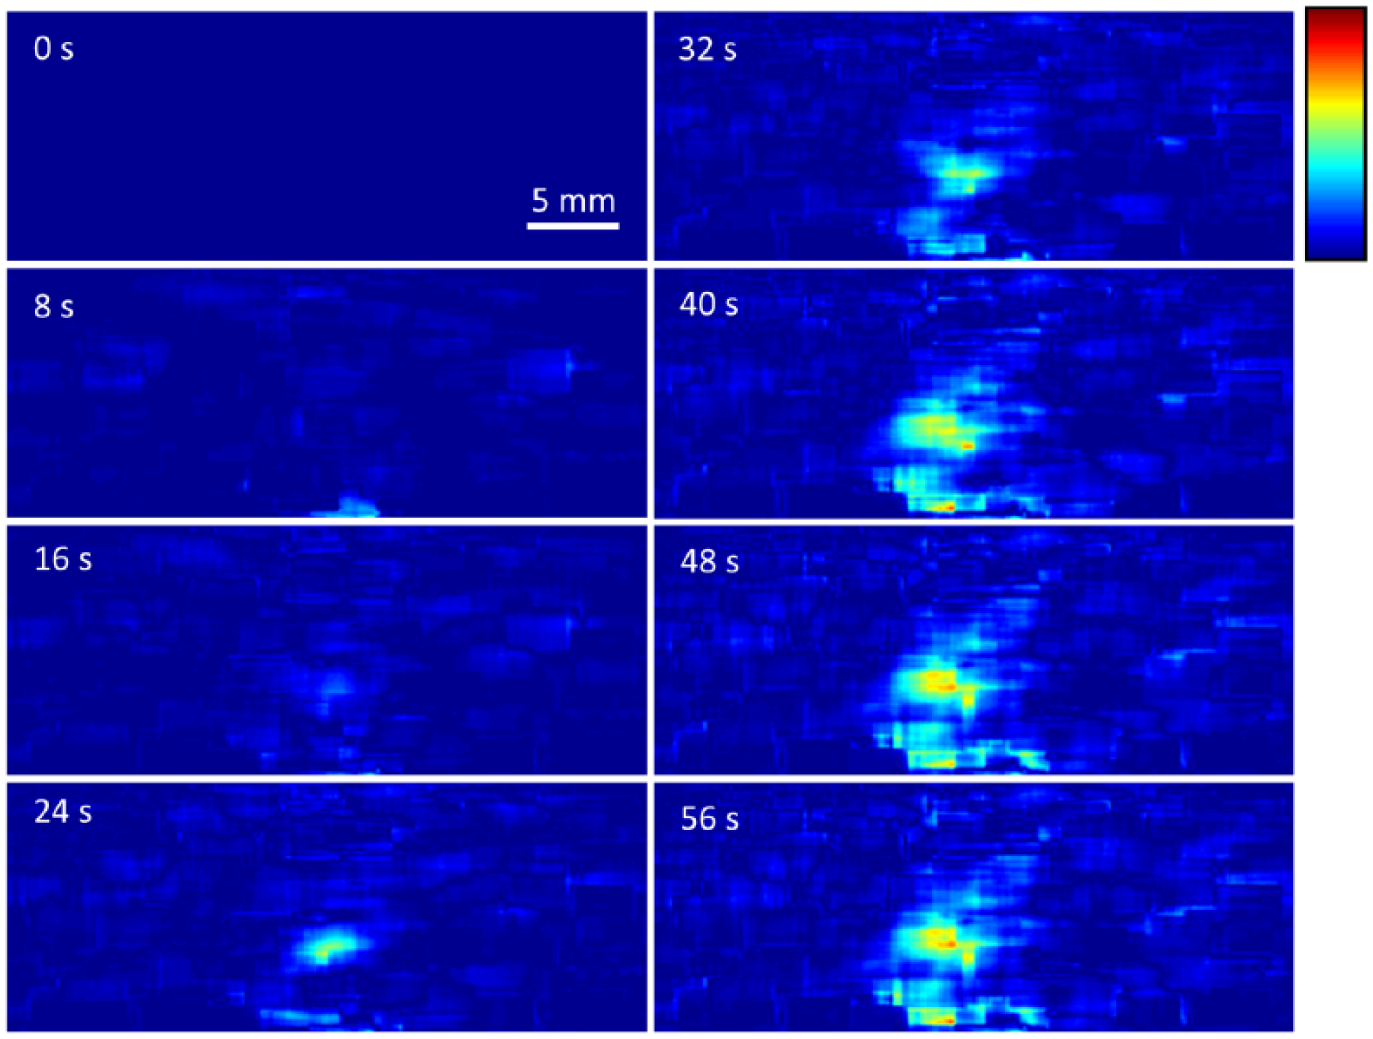
Time sequence of the absolute difference map of the Nakagami parameters illustrating the different stages of lesion development in an ex vivo porcine liver tissue phantom from 0 to 60 seconds.
Figure 8 shows the absolute difference between the Nakagami parameters of the denatured area (blue line) and nondenatured area (red line) over the duration of the experiment shown in Figure 7. The results in the denatured zone show that the absolute difference of the Nakagami parameter increased stably during the first 8 seconds, although there was no apparent contrast in the image as shown in Figure 7. From 10 seconds until the end of the experiment, the absolute difference of the Nakagami parameters presented another linearly increasing trend. The results of the nondenatured zone show that the absolute difference between the Nakagami parameters approximately remained constant.
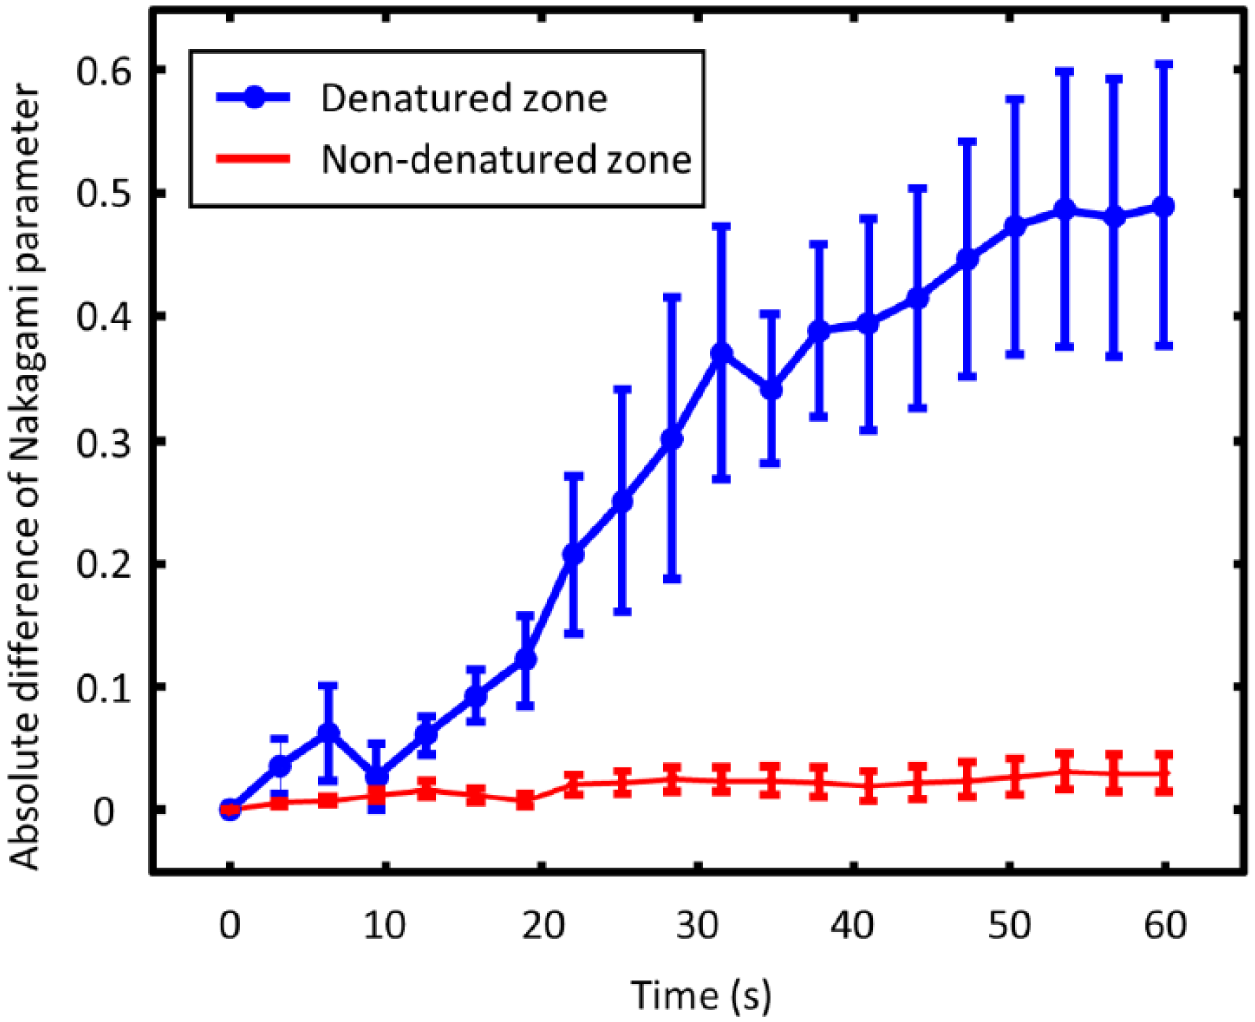
Nakagami parameter variation as a function of heating time.
Discussion
In this study, the experimental results demonstrate the proposed absolute difference between the Nakagami parameters before and after ablation could be a good index to use to monitor HIFU thermal ablation of liver tissues. Our results indicate that the proposed absolute difference mapping of Nakagami parameters is more applicable than conventional B-mode imaging for the characterization of HIFU-induced thermal lesions because it is less dependent on bubbles forming during thermal ablation. From the results with apparent bubble formation, as shown in Figures 2(c) and 3(a), the envelope intensity of the B-mode images increased in both denatured and nondenatured zones. Normally, envelope intensity should not have apparent variation in the nondenatured zone because the tissue structure in here did not change. The envelope intensity also should not vary apparently in the denatured zone because the backscatter coefficients of thermal lesions and normal tissues showed no significant difference. 13 A possible reason for this is that cavitation-induced bubbles contributed to the intensity increase. 43 The same results were reported by Zhang et al., 35 indicating that the bubble clouds appeared and contributed to the contrast in the ultrasound B-mode images after HIFU exposure.
This study also indicated that the proposed Nakagami imaging technique has a higher tolerance to bubbles formed during HIFU thermal ablation. Figure 2(f) shows that the variation in the Nakagami parameter was very small in the nondenatured zone (where bubble formation occurred). Some previous studies showed that bubble formation affects Nakagami parameter estimation to a lesser extent.36,39 This is because the Nakagami parameter mainly depends on the distribution of the backscattered signal statistics and, thus, is less affected by the magnitude of the backscattering signals.40,44
Moreover, this study recorded the envelope data during the HIFU exposure, as shown in Figures 7 and 8. We observed that the absolute difference between the Nakagami parameters before and after HIFU exposure consisted of two independent increasing trends. During the first 8 seconds, the absolute difference between the Nakagami parameters increased slightly. For this beginning part, it was suggested that the variation of the Nakagami parameter resulted from the temperature increasing because the speed of sound change led to a variation of the backscattering data distribution. 45 After that, the variation in the Nakagami parameter mainly resulted from the thermal lesion formation.
Note that this work focused on HIFU thermal lesion characterization in porcine livers only. The experimental sample in this study is the porcine liver. The liver is an organ with a uniform tissue structure. Because tissue coagulation changes the structural uniformity of the liver tissue, the Nakagami parameter changes accordingly. We believe this is the main reason Nakagami parameter imaging worked well in liver thermal lesion characterization during this study. However, if the target is an organ with nonuniform tissue structure, the structural difference between the coagulated tissue and normal tissue may not exist. Under this condition, the Nakagami parameter may not work well, which may explain the relatively poor outcome in the work of Rangraz et al., 38 where porcine muscle tissue was used. That is, further study is required to determine whether thermal lesions on other organs or tissues can be characterized by Nakagami imaging.
Concluding Remarks
In this study, the experimental results demonstrate the feasibility of monitoring thermal ablation using Nakagami imaging during HIFU thermal therapy. Compared with the characterization of thermal lesions using B-mode imaging, Nakagami imaging can provide not only a more accurate size estimation and location prediction but also higher contrast. Furthermore, a modified Nakagami parameter based on frequency diversity and compounding was developed by Dumane and Shanker to enhance the sensitivity in characterizing different scatterer concentrations. 46 Tsui et al. also suggested that the Nakagami parameter calculated using logarithmic compressed backscattered envelopes could enhance the dynamic range of the Nakagami parameter. 47 All these studies may further improve the performance of lesion characterization and allow Nakagami imaging to become a better image guidance technique.
In addition, the low computational complexity of Nakagami parameter imaging means it can be easily integrated with current imaging systems, and its lower sensitivity to bubbles can avoid the false characterization due to bubble formation during HIFU thermal ablation.
Footnotes
Declaration of Conflicting Interests
The author(s) declared no potential conflicts of interest with respect to the research, authorship, and/or publication of this article.
Funding
The author(s) disclosed receipt of the following financial support for the research, authorship, and/or publication of this article: Funding support from the Ministry of Science and Technology, Taiwan (MOST 103-2320-B-007-001-MY3 and MOST 106-2221-E-007-033-MY3) is greatly appreciated.