
Abstract
The temporal evolutions of displacements, strains, stresses, and fluid pressure in a poroelastic material under sustained compression are theoretically expressed as sums of an infinite number of exponentials. However, estimation of an infinite number of time constants is impractical in experimental settings. In the past, empirical models containing a finite number of exponentials have been proposed and used to approximate the theoretical poroelastic models. At the present time, however, the degree of error associated with such approximations is unclear. In this paper, we present an analysis of the error encountered when approximating a poroelastic model containing an infinite number of exponentials with a single or double exponential model. As a testing platform, the presented error analysis is applied to the estimation of effective Poisson’s ratio (EPR) and fluid pressure in a uniform cylindrical poroelastic sample and a cylindrical poroelastic sample containing an inclusion under stress relaxation. Our results show that, when the infinite number of exponentials in the theoretical models are approximated with finite number of exponentials, significant error is invoked only in the first few time samples of the EPR and fluid pressure, while the error is negligible for the remaining time samples. We also show that, when estimating clinically relevant mechanical parameters such as Poisson’s ratio or the product of aggregate modulus and interstitial permeability, such approximation invokes small error (<3%) in comparison to the general model with infinite number of exponentials. Therefore, such approximation may be acceptable in techniques aiming at reconstructing mechanical parameters from poroelastographic data.
Introduction
Several biological tissues have been modeled as poroelastic materials1-3 using biphasic theories.4-7 The first work on the theoretical development of the stress relaxation analysis of a two-dimensional (2D) poroelastic material using the biphasic theory was the one by Mow et al., 6 where expressions of the displacements, strains, and fluid pressure were determined. This study was then extended by Armstrong et al. 8 to determine analytic expressions for a uniform cylindrical sample compressed with frictionless plates. The first work on the modeling of a poroelastic inclusion inside another poroelastic material was done by Rice et al., 9 where the authors used Eshelby’s formulation 10 to derive expressions of the displacements, strains, and fluid pressure inside a poroelastic inclusion embedded in a poroelastic material even if no closed-form expressions in space and time domain were provided. Our group has recently reported the closed-form solutions of the effective Poisson’s ratio (EPR) and fluid pressure inside and outside a poroelastic inclusion embedded inside another poroelastic material under stress relaxation and creep compression.11-14
When a poroelastic material is subjected to sustained compression, fluid exudation causes the stress to rise above the equilibrium value during the compression phase,8,15 while in the relaxation phase, no fluid exudation occurs, and the internal fluid redistributes inside the sample. All aforementioned theoretical works demonstrate that the displacements, strains, and fluid pressure in a poroelastic material under sustained compression are temporally varying and that their theoretical temporal expressions contain an infinite number of exponentials.8,11-15 The presence of an infinite number of exponentials in the analytic expressions of the displacements and strains creates hardship in the analysis and parameter estimation and is unpractical in clinical imaging settings. Parameter estimation is important for extracting diagnostically important tissue mechanical parameters such as Poisson’s ratio, product of aggregate modulus, and interstitial permeability, which have been found to be useful in diagnosis, prognosis, and treatment of diseases like cancer. However, it has been reported that estimation of mechanical parameters becomes computationally difficult and prone to errors and nonconvergence issues as the number of exponentials in the models increases.16,17 Real-time implementation of data processing and visualization become impossible for a large number of exponentials. It is therefore clear that, in practical scenarios, poroelastic models containing an infinite number of exponentials need to be approximated with models containing a finite number of exponentials. The extent to which such approximations introduce inaccuracies in the estimation of the mechanical parameters of interest is currently unclear.
Ultrasound elastography is an imaging modality that can be used to assess and image the mechanical properties of biological tissues.18,19 Poroelastography20,21 is an elastographic technique used to image the time-dependent mechanical response of poroelastic tissues. In addition to the ultrasound field, poroelastography methods have also been developed for magnetic resonance imaging (MRI) applications. 22 In poroelastography, approximation of models with an infinite series of exponentials by models with a finite number of exponentials (typically one or two) has several benefits. First, in poroelastography, we need to estimate the field variables (fluid pressure, EPR, etc.) for a large number of pixels (at least 128 × 128). Computation of the field variables with large number of exponentials can be computationally very intensive. Use of single or double exponential models can substantially decrease the computational burden. Second, in estimation of material properties by using curve fitting techniques, use of high number of exponentials is prone to errors and nonconvergence specially in noisy conditions. 16 To our knowledge, however, no studies that focus on an investigation of the error invoked when using single or double exponential model in poroelastic estimation and imaging can be found in the literature.
In this paper, we analyze the errors that occur while estimating the EPR and fluid pressure using single and double exponential models in both uniform and inclusion-inserted poroelastic media under stress relaxation. We also analyze the error in the reconstruction of two mechanical parameters, that is, the Poisson’s ratio and the product of aggregate modulus and interstitial permeability in the material using single and double exponential models using both finite element and ultrasound poroelastographic simulation data.
Approximation of Analytical Solutions
The general poroelastic samples used for the analysis reported in this paper are shown in Figure 1. The radial direction is along r and the circumferential direction is along the angle θ. In a stress relaxation experiment, the cylindrical sample is compressed from the top with a frictionless compressor plate keeping the bottom fixed.
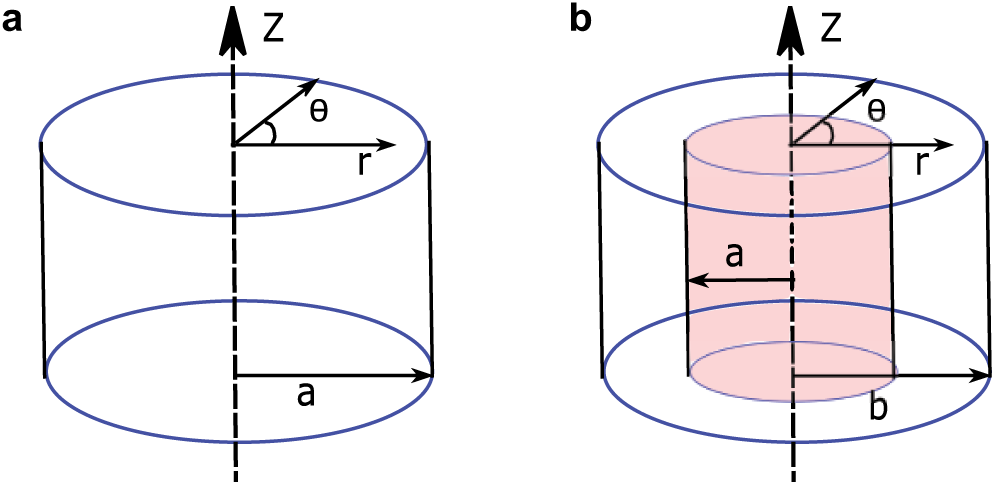
(a) A schematic of a uniform cylindrical sample of a poroelastic material of radius a and (b) a schematic of a cylindrical sample of a poroelastic material of radius b with a cylindrical inclusion of radius a. The axial and radial directions are along the z-axis and r-axis, respectively. The circumferential direction is in the direction of the increasing angle.
Analytic models of the poroelastic samples shown in Figure 1 subjected to stress relaxation compression have been reported by Berry et al. 15 and Islam et al. 11 The important equations, initial and boundary conditions, pertinent to the models are described below.
The first basic equation for cylindrical symmetric poroelasticity is the continuity equation of the pore fluid, which can be written as 23

where ε is the volume strain, p is the fluid pressure,

where k is the interstitial permeability.
The second basic equation is the equation of radial equilibrium, which can be expressed as

where

The equation of radial equilibrium can be written now as

The elastic stress-strain relations can be written as


where u is the radial displacement and
Equations (2) to (7) are the equations that are used to develop analytical expressions of fluid pressure and EPR for an applied axial strain of
The analysis is based on the assumption of intrinsic incompressibility for both the solid phase and the fluid phase. The incompressibility of solid and fluid phase is incorporated in the analytical model by using
The boundary conditions for a poroelastic sample in an elastography experiment are (a) on the bottom plane of the sample, there is no axial displacement; (b) on the right edge of the sample, there is zero fluid pressure 15 ; and (c) a constant uniaxial stress is present at the top boundary of the sample. Perfect bonding as well as continuous stress, fluid pressure, and displacement between inclusion and background should also be considered in case of inclusion-inserted media.24,25
The initial conditions in the problem are assumed as follows: (a) the volumetric strain is 0 and (b) the fluid pressure is equal to the product of shear modulus of the sample and applied strain at
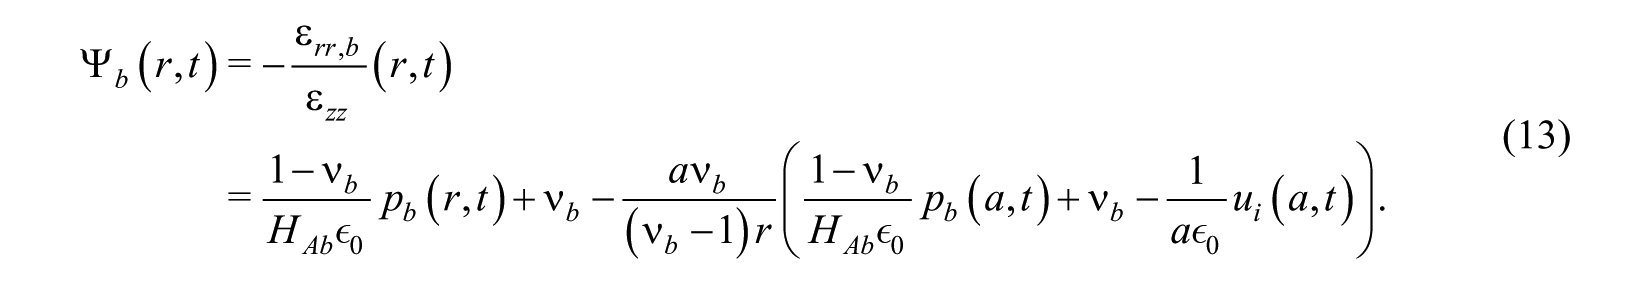
Below, we summarize the resulting equations of these models, which are relevant for the error analysis reported in this paper. As previously mentioned, our analysis will refer to the EPR and fluid pressure. As the expressions of the EPR and fluid pressure in uniform medium and inside inclusion of inclusion-inserted medium are similar, we write the expressions of EPR and fluid pressure in only inclusion-inserted medium below.
The expression for the EPR inside the inclusion in the inclusion-inserted medium can be written as 11
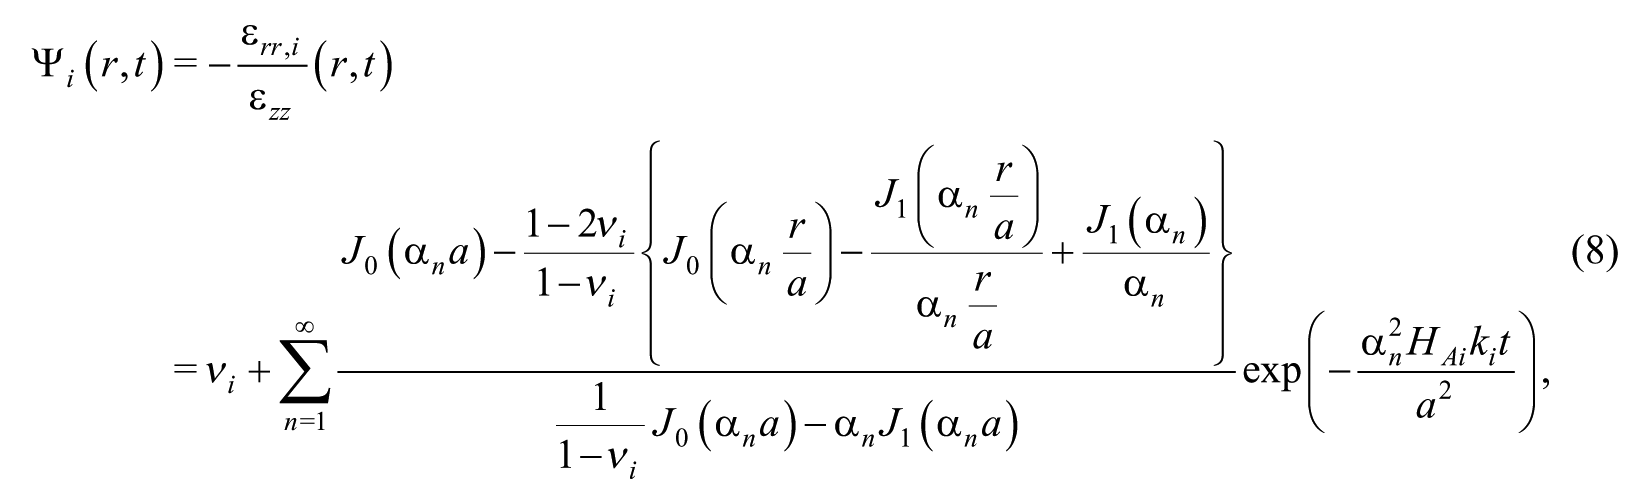
where
where
where

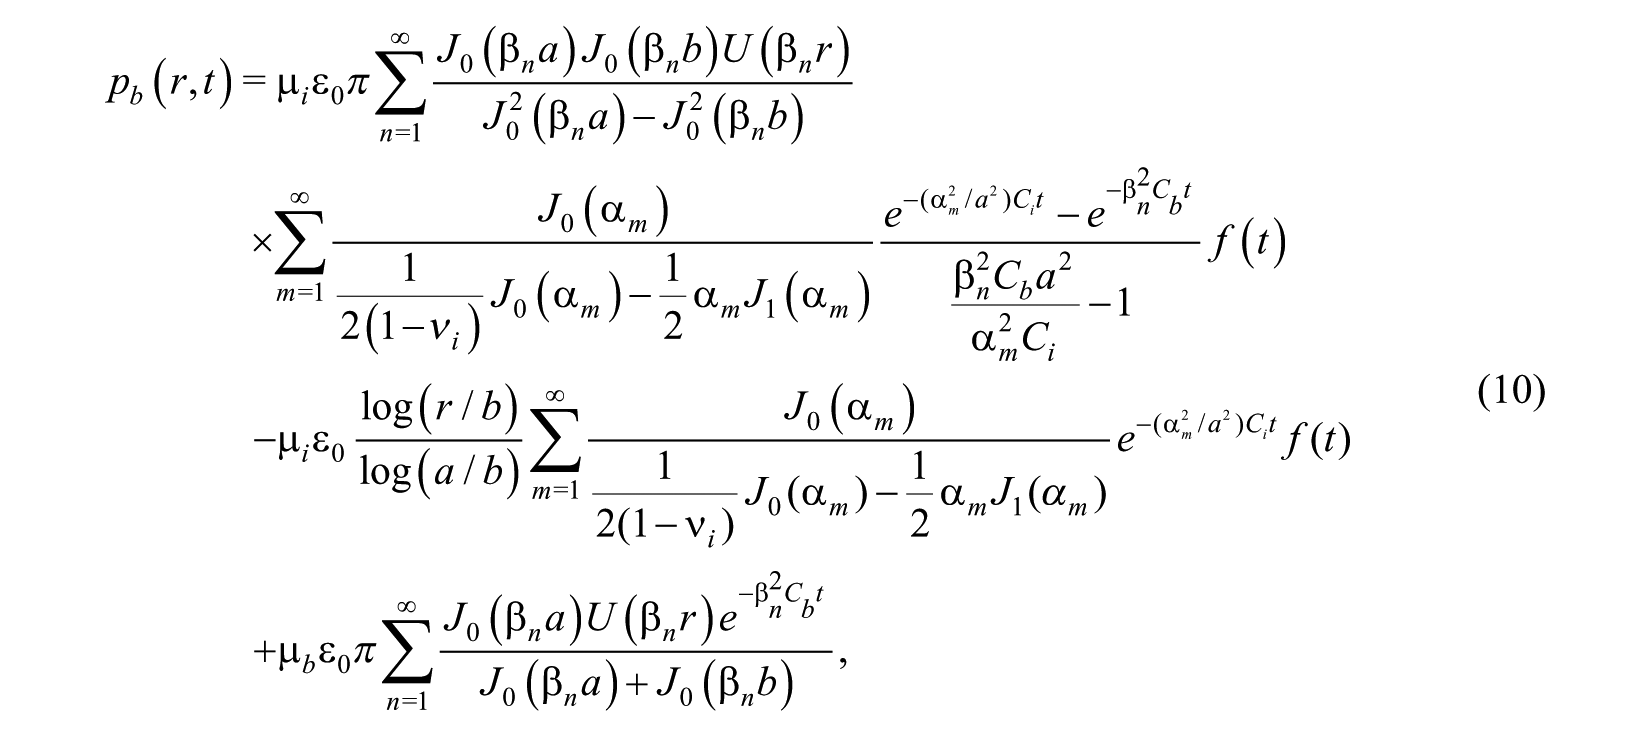
The expression for the radial strain outside the inclusion can be written as 11
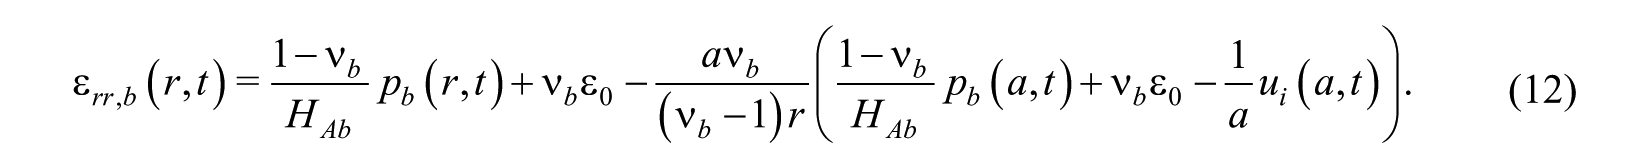
where
When finite number of exponentials are used in Equation (8), expression of the EPR inside the inclusion becomes
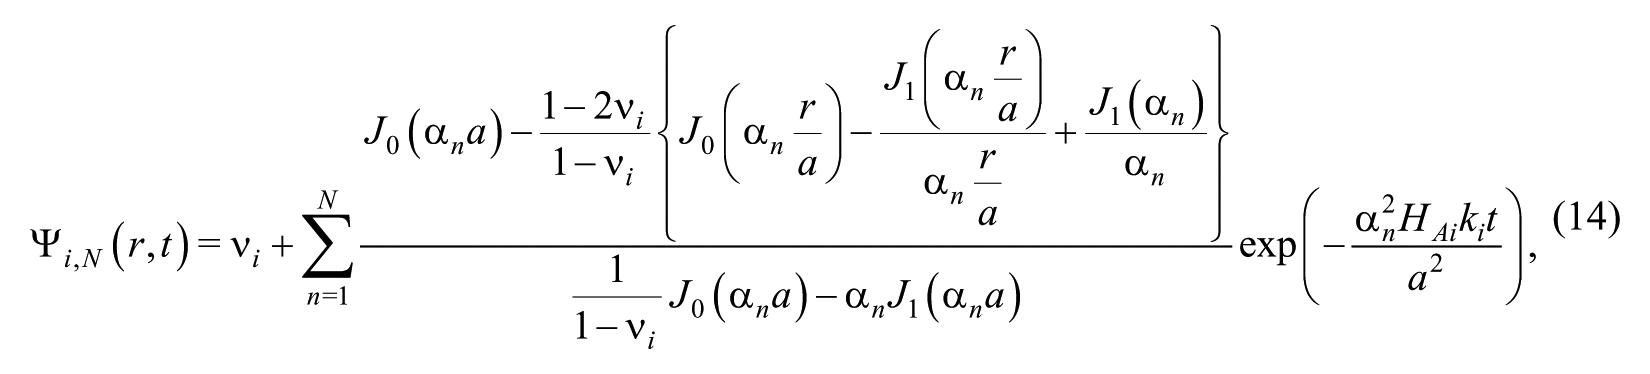
where N indicates a finite number. For a single exponential approximation, N = 1 and for double exponential approximation, N = 2. The fluid pressure and EPR in the uniform sample, fluid pressure inside and outside, and EPR outside the inclusion in the inclusion-inserted sample can be approximated using single or double exponential in a similar manner.
Simulations
Finite Element Simulations
To compare the results of the EPR and fluid pressure for single and double exponential approximation with the results from finite element analysis, a commercial finite element modeling (FEM) software, namely, ABAQUS, Abaqus Inc, Providence, Rhode Island, was used. For our analysis, we have used the “coupled pore fluid diffusion and stress analysis” module of ABAQUS. Details of this simulation module along with necessary equations can be found in the documentation provided by ABAQUS
26
(6.7.1). In brief, a poroelastic material saturated with a fluid is modeled in ABAQUS as a biphasic material (consisting of a solid phase and a fluid phase) and an effective stress principle is adopted to describe its behavior. The material is modeled by attaching the finite element mesh to the solid phase, and fluid can flow through the mesh. The mechanical part of the model is based on the effective stress principle, which can be described as, “the total stress acting at a point,

where I denotes the identity matrix.
The model also uses a continuity equation for the mass of wetting fluid in a unit volume of the poroelastic material,
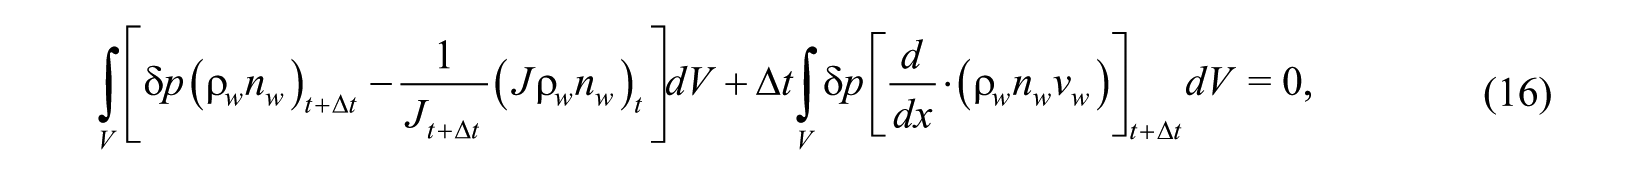
where

The uniform sample and the inclusion-inserted sample were modeled as a linearly elastic, isotropic, incompressible, permeable solid phase saturated with an incompressible fluid. The samples were compressed from top and the bottom side was kept static. The interstitial permeability of the sample was assumed independent of the strain and void ratio. A single 2D plane of the 3D (three-dimensional) cylinder was analyzed in ABAQUS. 15 The mesh element type used for this analysis was CAX4RP with 400 elements in a single row. A boundary condition of zero fluid pressure on the right-hand side of both samples was imposed to ensure flow of the fluid only in the right direction. 15 The analysis is done in two steps. An instantaneous axial strain of 4% is applied in the first step, which remains constant in the second step. The first step is of 1 s and the second step continues up to 901 s. The specific weight of the fluid was taken as 1 Nm–3. The incompressibility condition of solid and fluid phase is ensured in ABAQUS by fixing the bulk modulus of fluid and solid phase to a large value (1015 Pa).
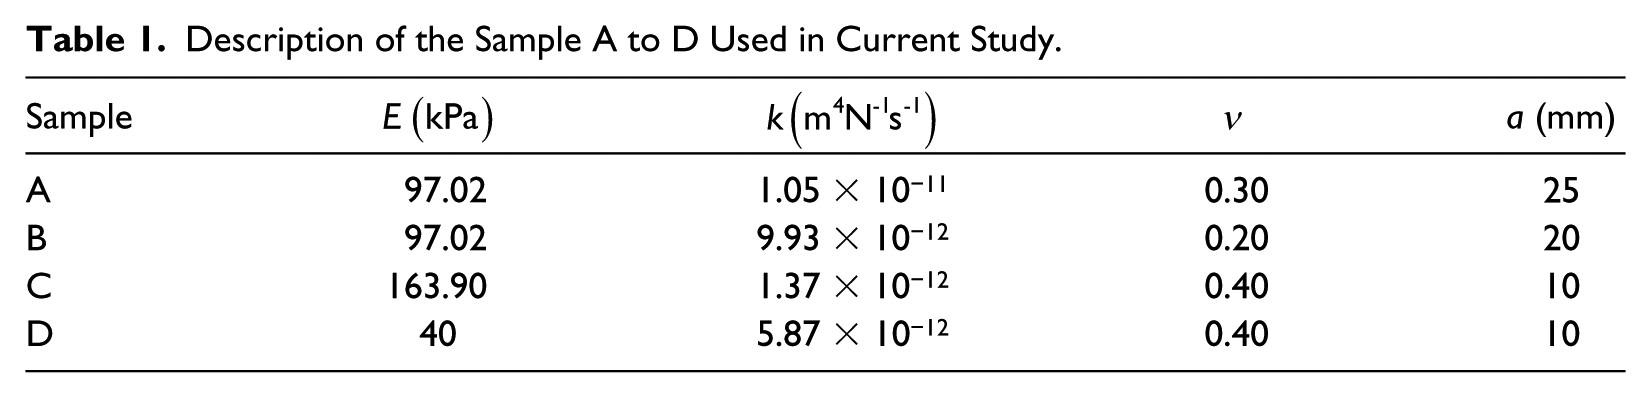
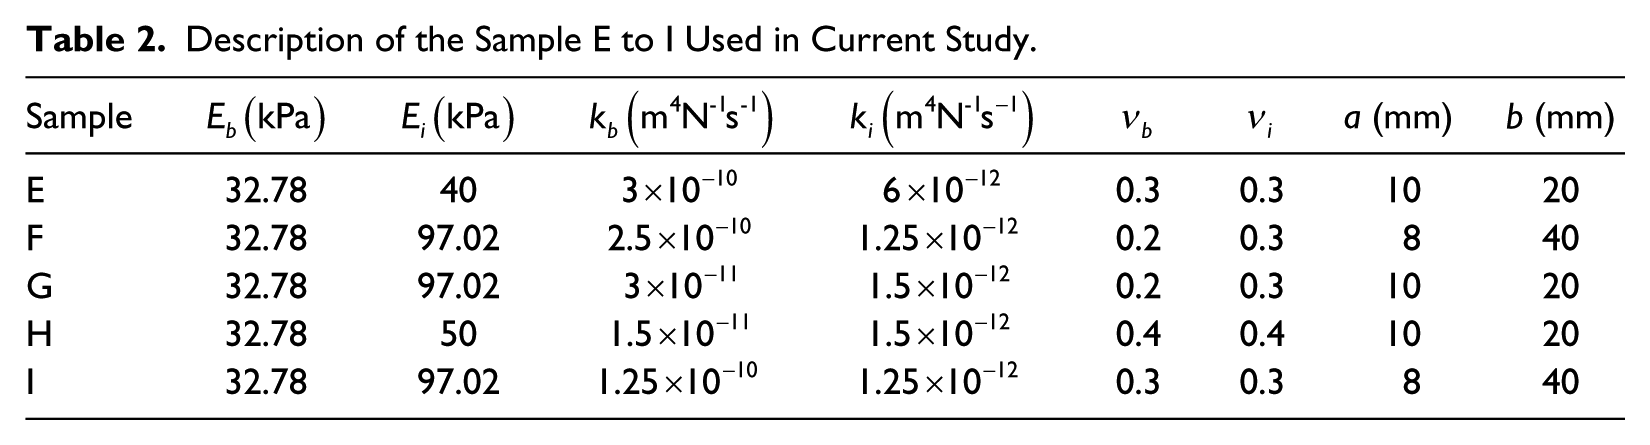
Four uniform and five inclusion-inserted samples were chosen with different sizes and mechanical parameters. The radii of the uniform samples are given in Table 1 and the radii of inclusion-inserted samples and their inclusions are given in Table 2. The heights of the samples were always taken as equal to their radii. Young’s modulus of the background (simulating normal tissue) in the inclusion-inserted samples was chosen as 32.78 kPa based on previous literature27,28 and kept fixed in all samples. As the tumors can have a broad range of Young’s moduli,29,30 we chose four different Young’s modulus values, 40, 50, 97.02, and 163.90 kPa for the homogeneous samples (simulating tumor) and inclusions (simulating tumor) in inclusion-inserted samples. The Poisson’s ratio is reported in the literature to have a range of values between 0.2 and 0.45 for both tumors and normal tissues.31-33 Poisson’s ratio values of 0.2, 0.3, and 0.4 for the inclusion and background were used. Based on previous literature, 34 the tumors can have a broad range of interstitial permeability. We used different values of background-to-inclusion permeability contrast (10, 20, 50, 100, 200) for different inclusion-inserted samples. The mechanical parameters of all the uniform and inclusion-inserted samples used in current study are tabulated in Tables 1 and 2.
Description of the Sample A to D Used in Current Study.
Description of the Sample E to I Used in Current Study.
Ultrasound Simulations
The simulated pre- and postcompression ultrasound radio frequency RF data were generated using the transducer characteristics and the mechanical displacement data obtained from FEM employing a convolution model.35,36 In this model, the object field is convolved with the point spread function (PSF) of the transducer to obtain the transducer response. A Gaussian noise of specific signal to noise ratio (SNR), which depends on the measurement and electronic noise, is then added to the data to obtain the precompressed RF data. Here, the object field consists of the randomly distributed speckle amplitudes, which follows a Gaussian distribution with zero mean and unit variance. Bilinear interpolation is performed on the precompressed object field using the pre- and postcompressed coordinates of the speckles to obtain the postcompressed object field. Similar to precompressed RF data, postcompressed RF data are obtained by convolving the postcompressed object field with the PSF and then adding noise of specific SNR. Using the input mechanical displacement data at different time points (obtained from FEM), postcompression RF frames at different time points are created. 37
The simulated ultrasound transducer had 128 elements, frequency bandwidth between 5 and 14 MHz, a 6.6 MHz center frequency, and 50% fractional bandwidth at –6 dB. The transducer’s beamwidth was assumed to be dependent on the wavelength and to be approximately 1 mm at 6.6 MHz. 21 The sampling frequency was set at 40 MHz and Gaussian noise was added to set the SNR at 40 dB. From one simulated precompressed RF data and postcompression RF data at different time points, the method proposed in Islam et al. 38 was used to estimate the axial and lateral strains at these time points. Axial and lateral strains from 50 independent realizations were averaged to obtain axial and lateral strains at each time point.
Parameter Estimation
Poisson’s ratio (
Error Assessment
The percentage errors in single and double exponential approximations of the EPR and fluid pressure are calculated using the following rule of normalized absolute error in percent 39

where
The root mean squared error in percent (RMSE) in estimated parameters is defined as 40
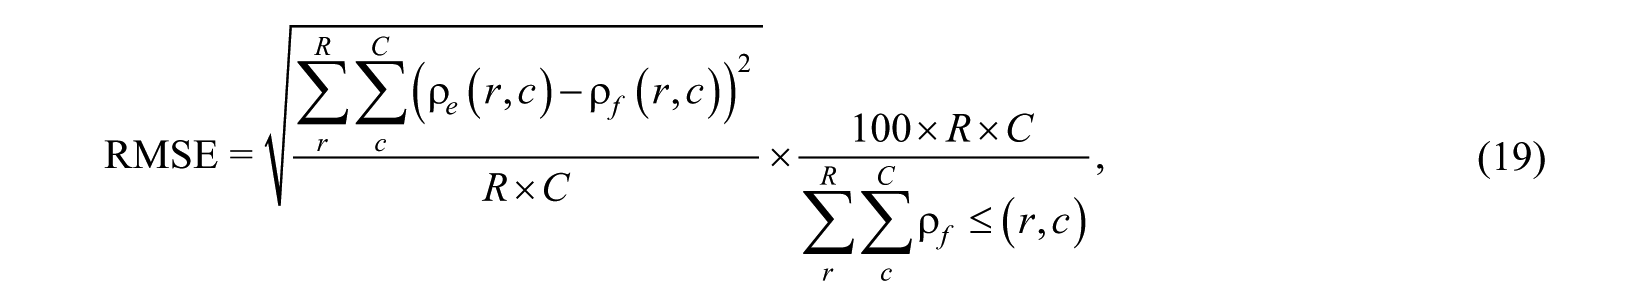
where
Results
Finite Element Simulations
Uniform medium
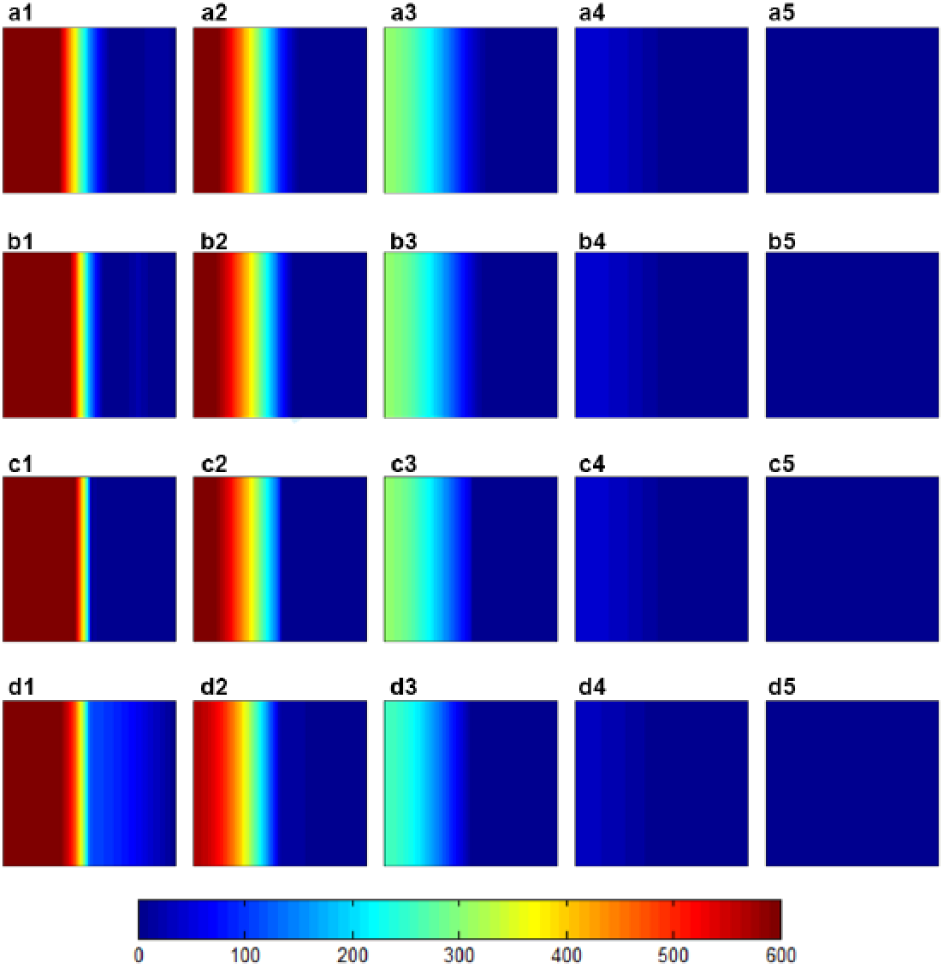
The EPR distributions for the uniform sample (sample A) are shown in Figure 2(a) to (d) for approximations with single, double, and 50 exponentials and the FEM prediction. In all these figures, we see that the EPR starts at 0.5 at
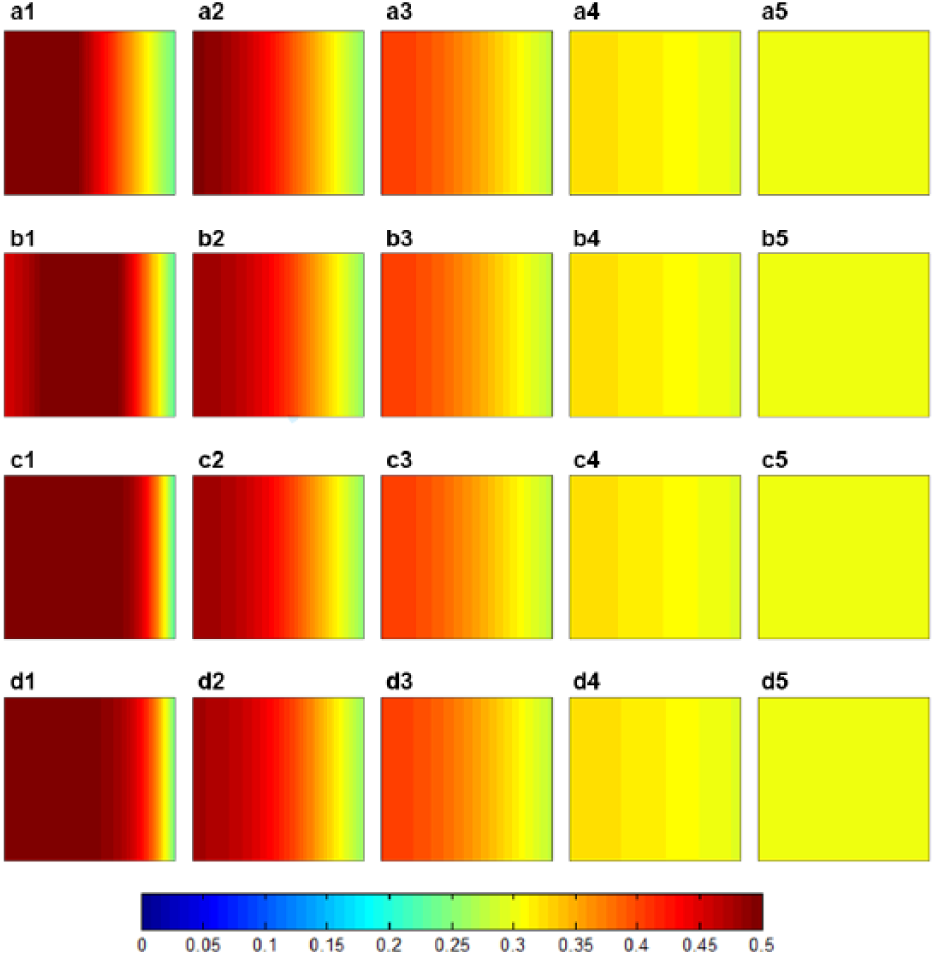
EPRs at different time points of 4 s, 40 s, 100 s, 250 s, and 448 s for single exponential approximation are shown in (a1), (a2), (a3), (a4), (a5); for double exponential approximation shown in (b1), (b2), (b3), (b4), (b5); for 50 exponentials in (c1), (c2), (c3), (c4), (c5); and from FEM in (d1), (d2), (d3), (d4), (d5) for sample A. FEM = finite element modeling.
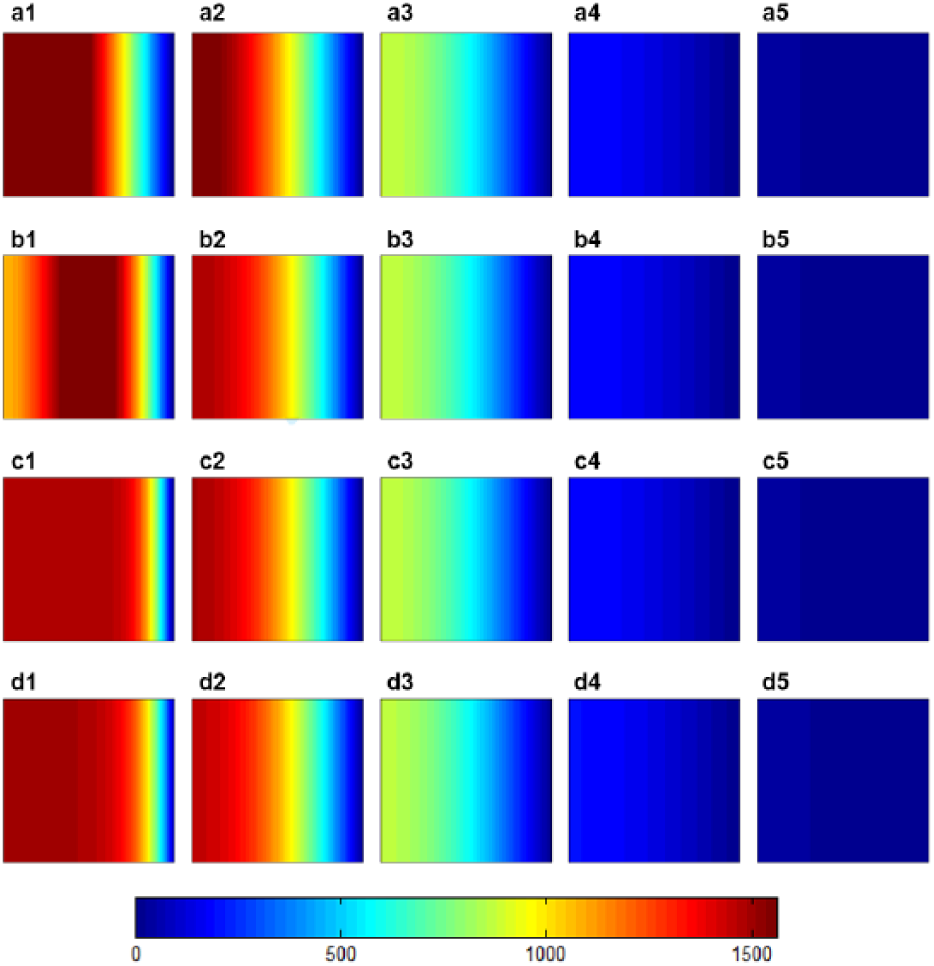
Fluid pressures (Pa) at different time points of 4 s, 40 s, 100 s, 250 s, and 448 s for single exponential approximation are shown in (a1), (a2), (a3), (a4), (a5); for double exponential approximation shown in (b1), (b2), (b3), (b4), (b5); for 50 exponentials in (c1), (c2), (c3), (c4), (c5); and from FEM in (d1), (d2), (d3), (d4), (d5) for sample A. FEM = finite element modeling.
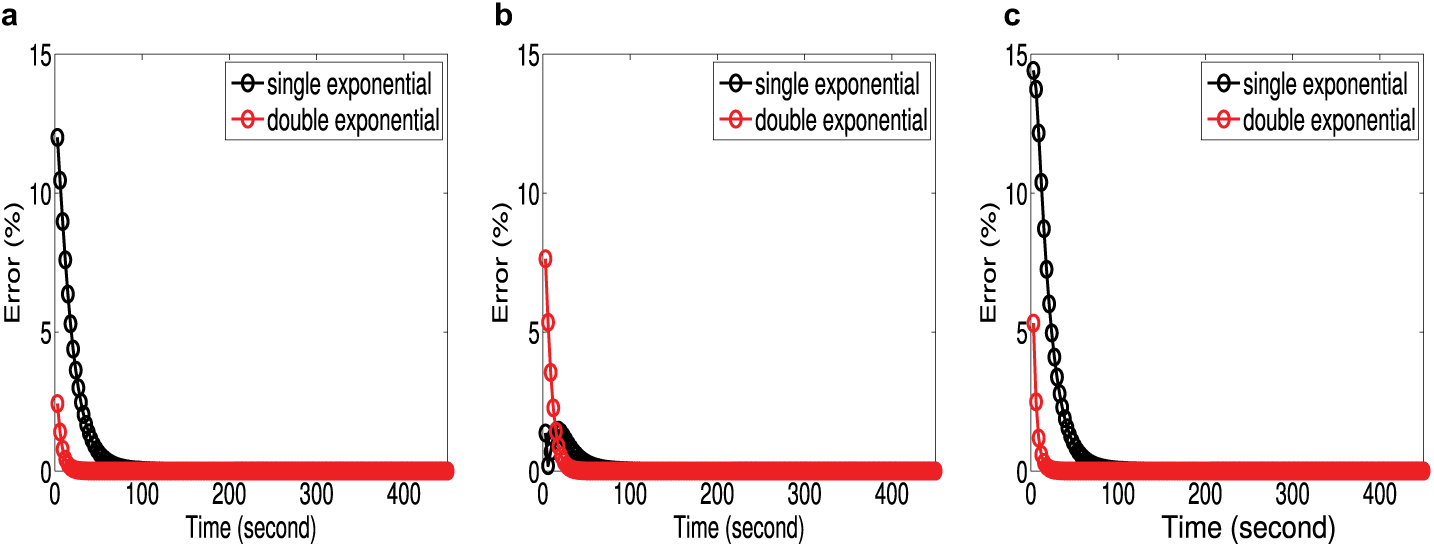
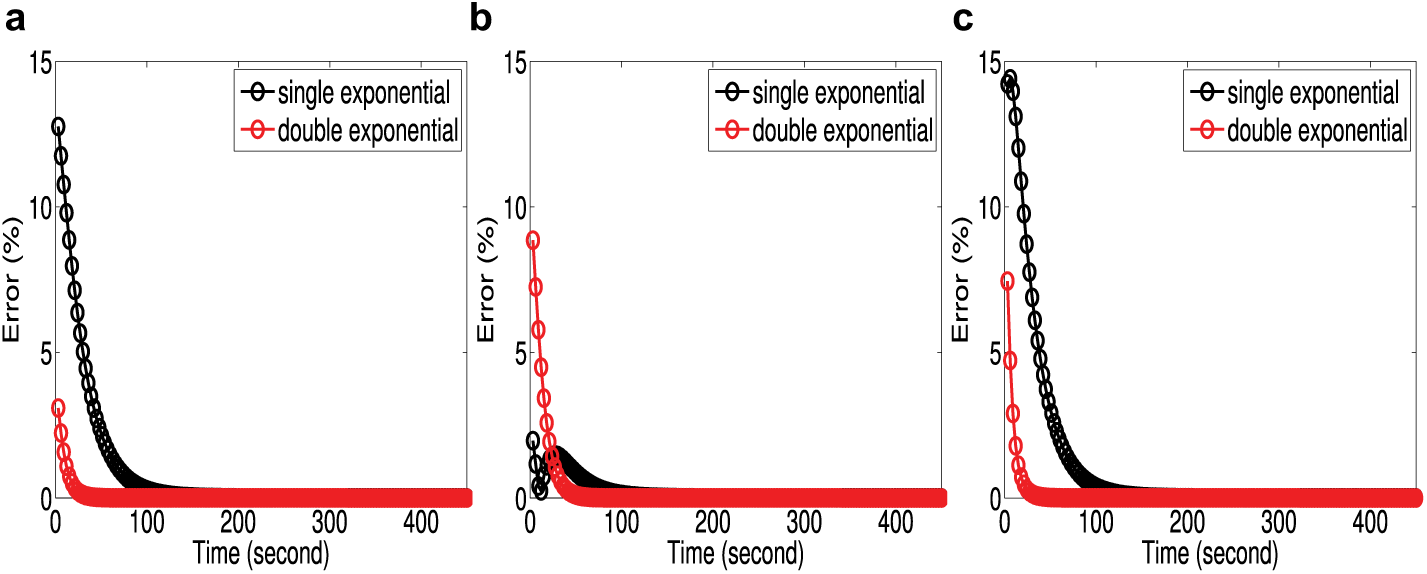
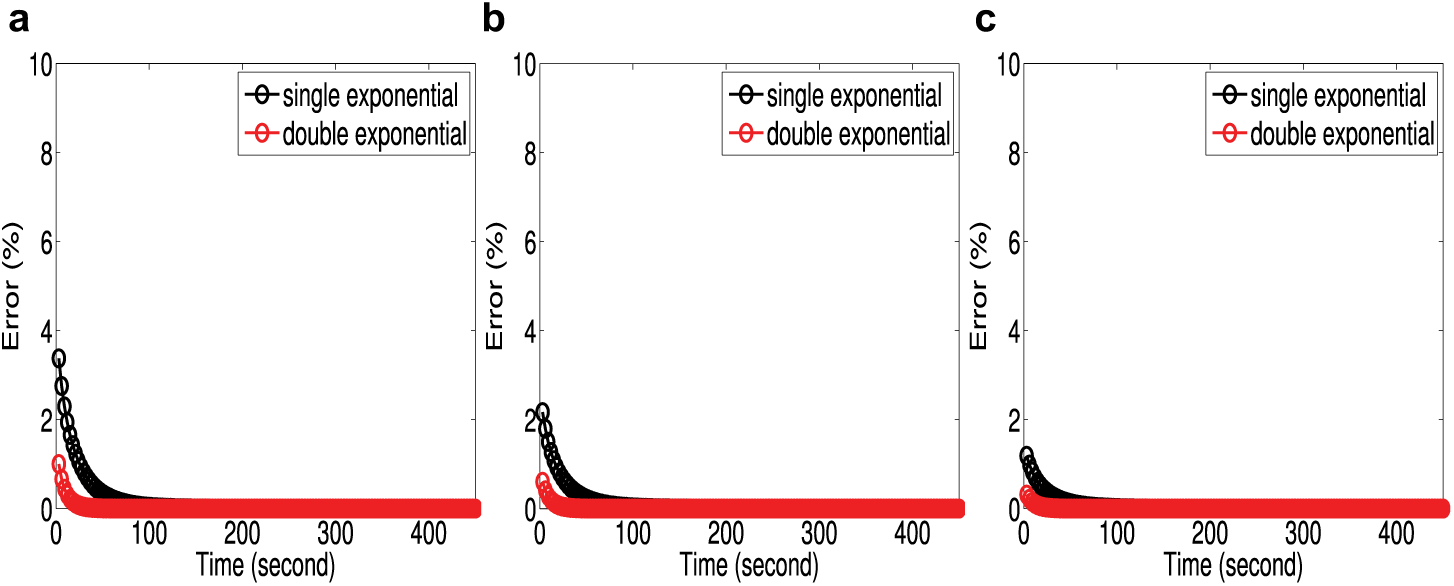
Error in approximating the EPR with single and double exponential at different positions of uniform sample A at (a) r = 5 mm, (b) r = 10 mm, and (c) r = 15 mm. EPR = effective Poisson’s ratio.
Error in approximating the fluid pressure with single and double exponential at different positions of uniform sample for sample A at (a) r = 5 mm, (b) r = 10 mm, and (c) r = 15 mm.
Inclusion-inserted medium
For the inclusion-inserted medium (sample E), the EPRs at 4 s, 40 s, 100 s, 250 s, and 448 s for single exponential approximation are shown in Figure 6(a1) to (a5), for double exponential approximation shown in (b1) to (b5), for approximation with 50 exponentials in (c1) to (c5) and from FEM in (d1) to (d5). In these figures, we see that, inside the inclusion, the EPR starts at 0.5 at
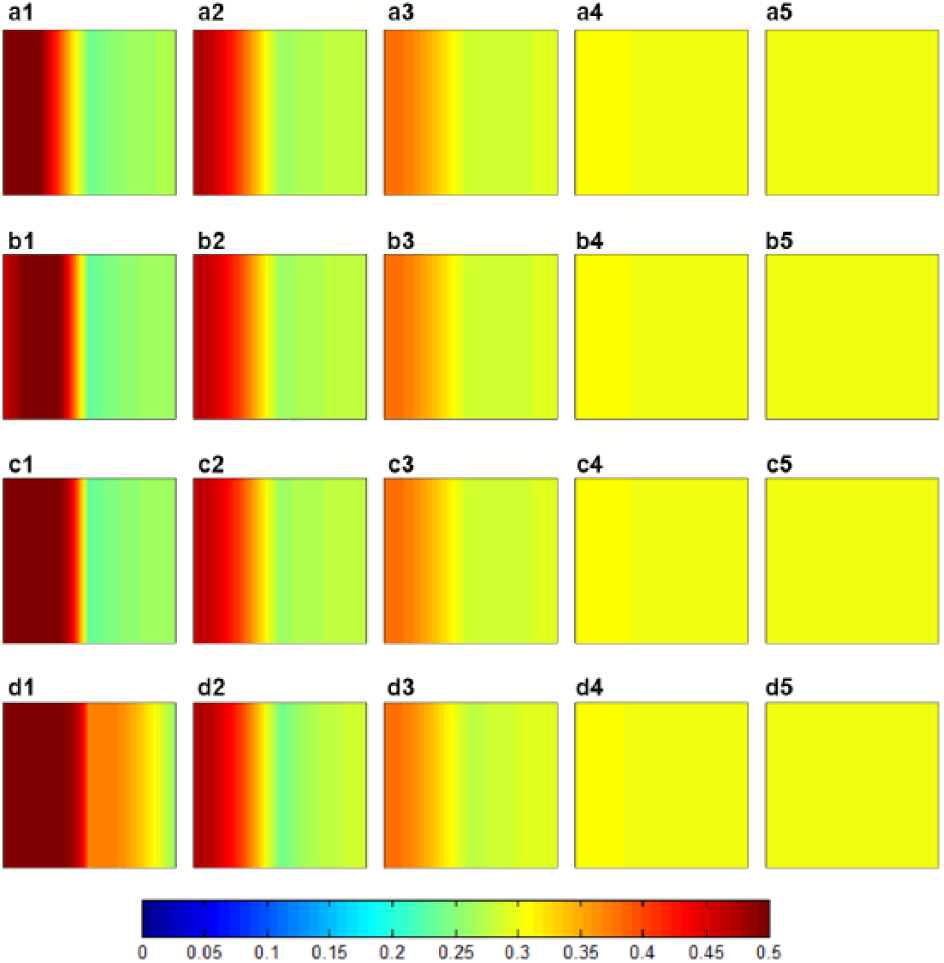
EPR at different time points of 4 s, 40 s, 100 s, 250 s, and 448 s for single exponential approximation are shown in (a1), (a2), (a3), (a4), (a5); for double exponential approximation shown in (b1), (b2), (b3), (b4), (b5); for 50 exponentials in (c1), (c2), (c3), (c4), (c5); and from FEM in (d1), (d2), (d3), (d4), (d5) for sample E (inclusion-inserted medium). EPR = effective Poisson’s ratio; FEM = finite element modeling.
Fluid pressures (Pa) at different time points of 4 s, 40 s, 100 s, 250 s, and 448 s for single exponential approximation are shown in (a1), (a2), (a3), (a4), (a5); for double exponential approximation shown in (b1), (b2), (b3), (b4), (b5); for 50 exponentials in (c1), (c2), (c3), (c4), (c5); and from FEM in (d1), (d2), (d3), (d4), (d5) for sample E (inclusion-inserted medium). FEM = finite element modeling.
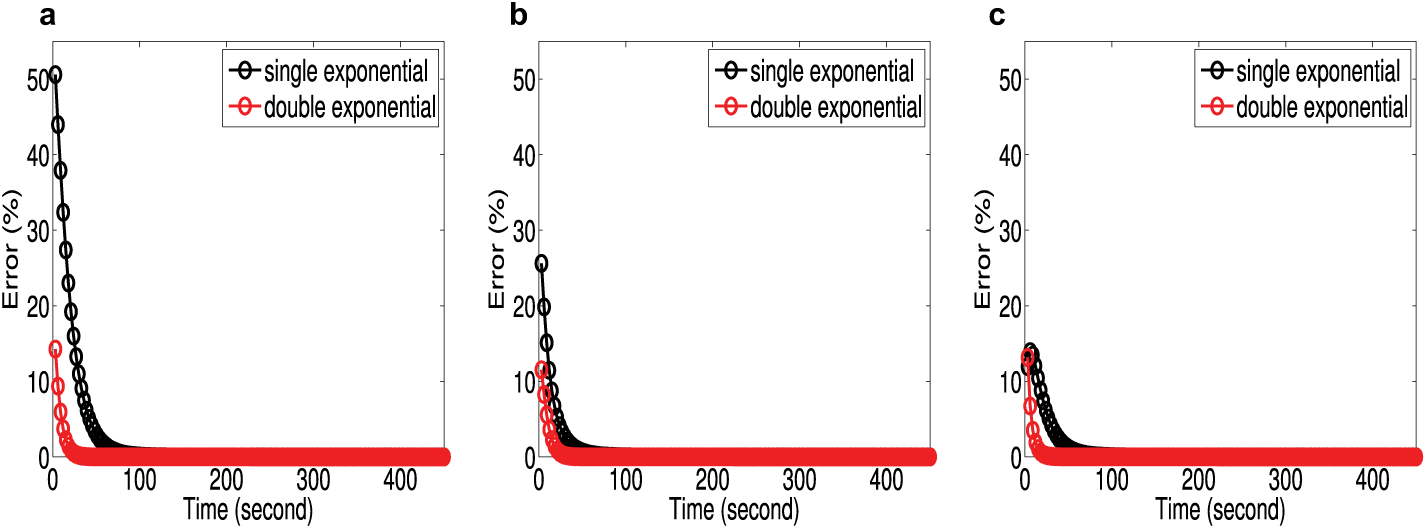
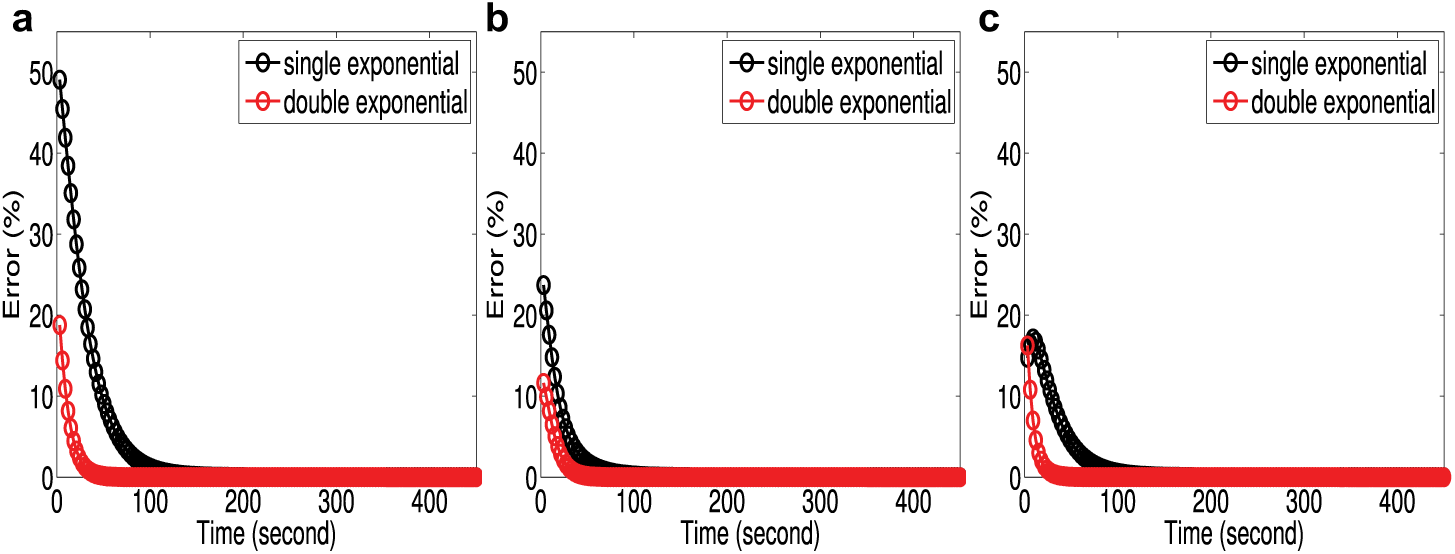
Error in approximating the EPR inside the inclusion at different positions with single and double exponential for sample E at (a) r = 2 mm, (b) r = 4 mm, and (c) r = 6 mm. EPR = effective Poisson’s ratio.
Error in approximating the fluid pressure inside the inclusion with single and double exponential at different positions for sample E at (a) r = 2 mm, (b) r = 4 mm, and (c) r = 6 mm.
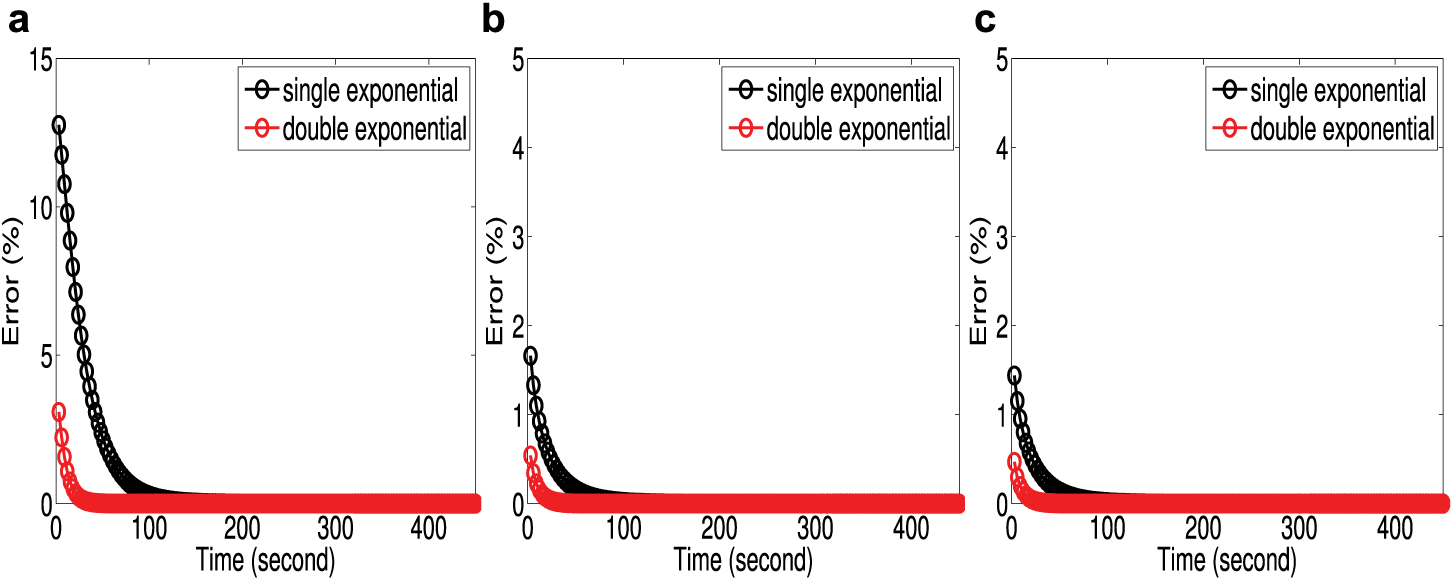
Error in approximating the EPR outside the inclusion with single and double exponential at different positions for sample E at (a) r = 13 mm, (b) r = 15 mm, and (c) r = 17 mm. EPR = effective Poisson’s ratio.
Error in approximating the fluid pressure outside the inclusion with single and double exponential at different positions for sample E at (a) r = 13 mm, (b) r = 15 mm, and (c) r = 17 mm.
Error in parameter estimation
The RMSEs in estimated parameters of samples A to I from the FEM data are shown in Tables 3 to 5. From Table 3, we see that for case of uniform medium, the RMSEs in estimated parameters from all samples for single, double, and 50 exponentials are very low and well below 2% both in cases of
RMSEs in Estimated Parameters of the Sample A to D from Finite Element Simulation Data.
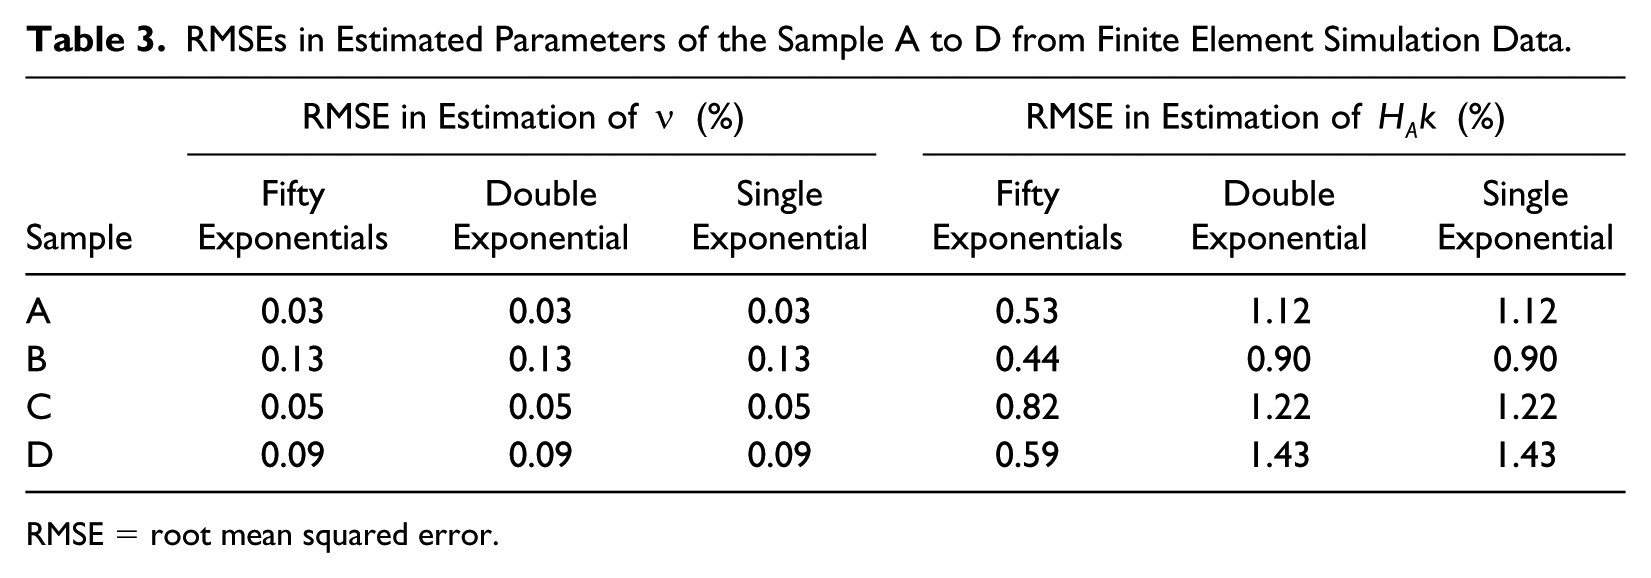
RMSE = root mean squared error.
RMSEs in Estimated Parameters of the Inclusion in Sample E to I from Finite Element Simulation Data.
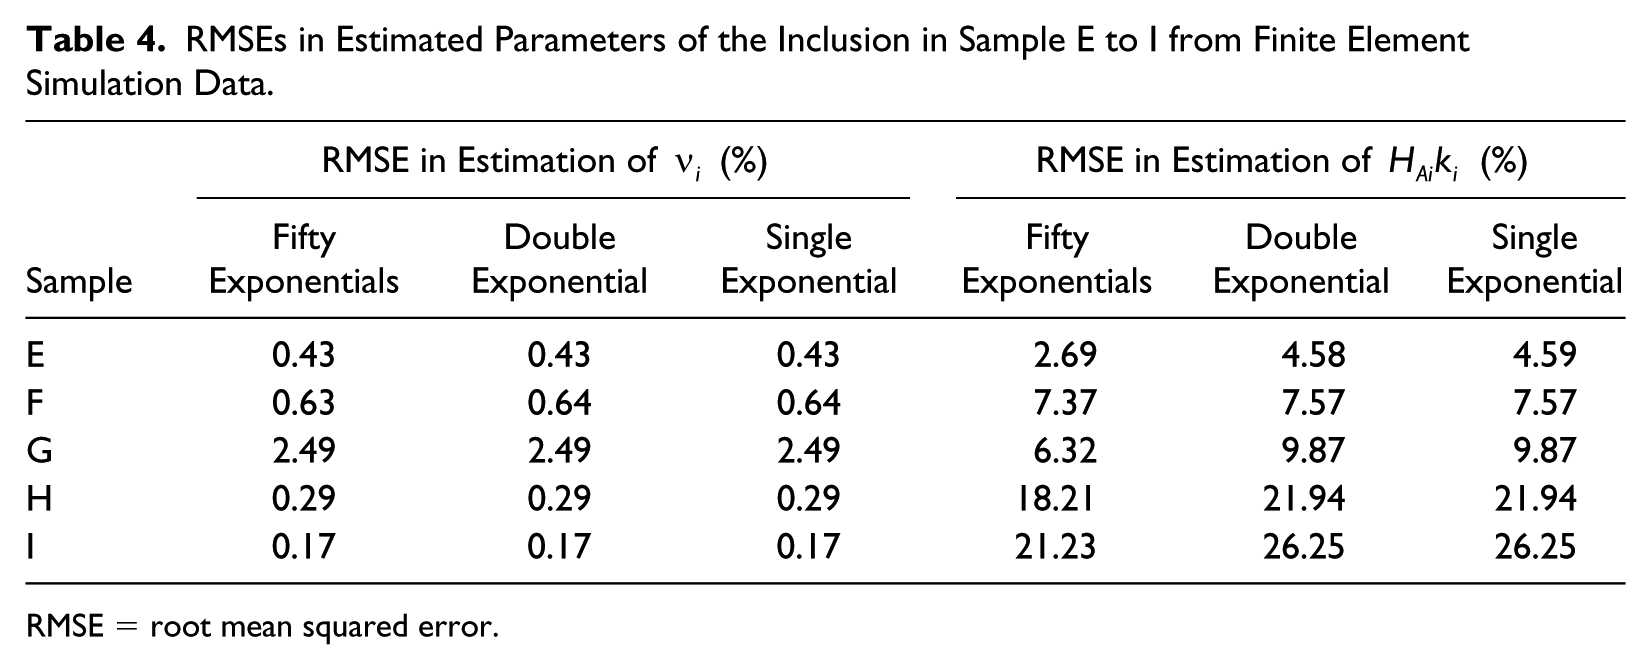
RMSE = root mean squared error.
RMSEs in Estimated Parameters of the Background in Sample E to I from Finite Element Simulation Data.

RMSE = root mean squared error.
Ultrasound Simulations
Uniform and inclusion-inserted medium
The EPR estimated at five time points from ultrasound simulated data of samples A and E are shown in Figure 12(a1) to (a5) and (b1) to (b5), respectively. By comparing this figure with Figure 2(d1) to (d5) and Figure 6(d1) to (d5), we understand that the EPR estimated from the ultrasound simulated data and the EPR from finite element simulation data match well.
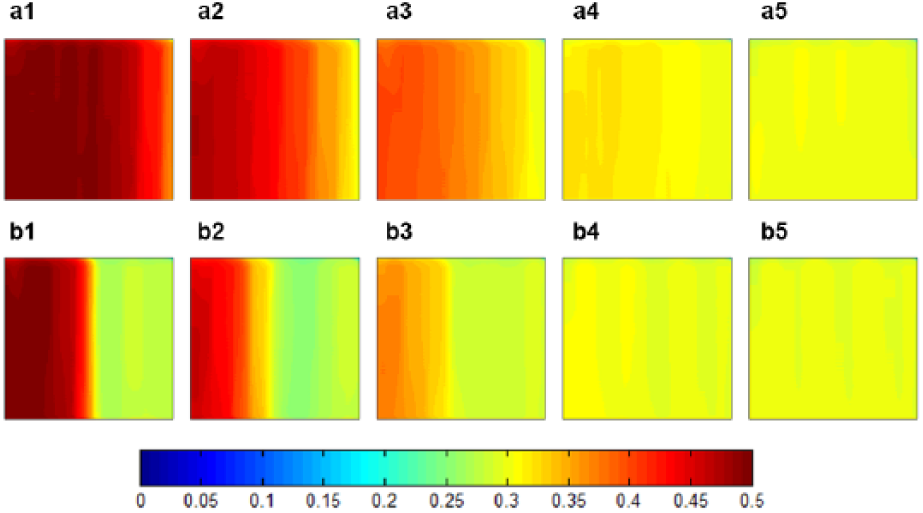
Estimated EPR at different time points of 4 s, 40 s, 100 s, 250 s, and 448 s from ultrasound simulated data of sample A (uniform medium) are shown in (a1) to (a5) and estimated EPR at the same time points from ultrasound simulated data of sample E (inclusion-inserted medium) are shown in (b1) to (b5). EPR = effective Poisson’s ratio.
Error in parameter estimation
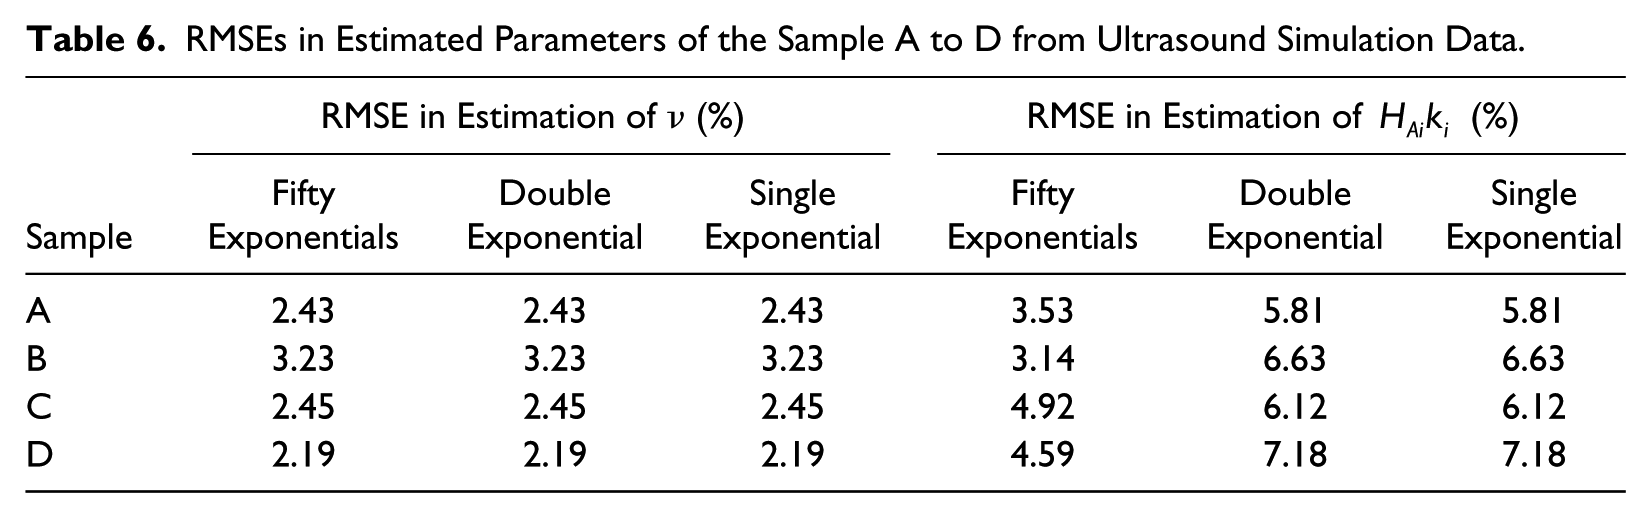
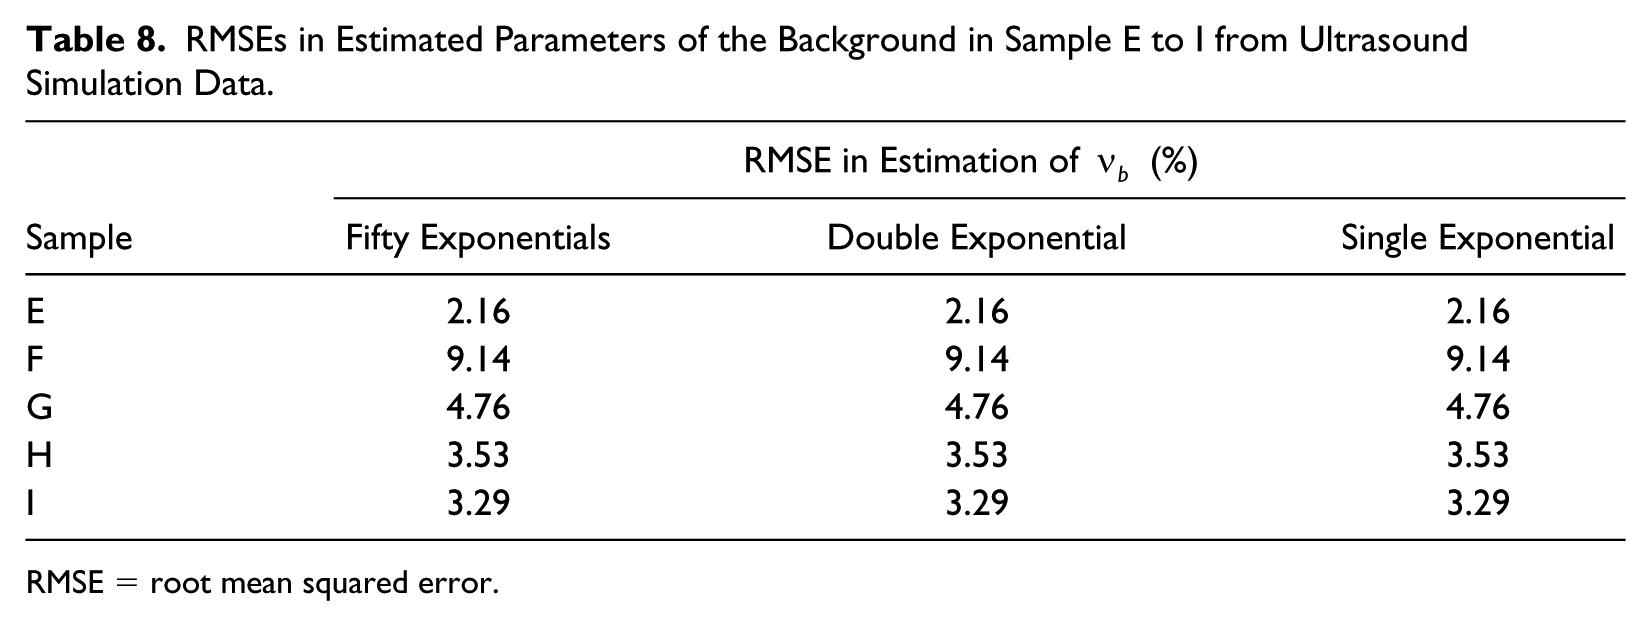
The RMSEs in estimated parameters, that is, Poisson’s ratio and the product of aggregate modulus and interstitial permeability of the uniform and inclusion-inserted samples (samples A-I) from the ultrasound simulated data are shown in Tables 6 to 8. From Table 6, we observe that for uniform samples, the RMSEs in estimated
RMSEs in Estimated Parameters of the Sample A to D from Ultrasound Simulation Data.
RMSEs in Estimated Parameters of the Inclusion in Sample E to I from Ultrasound Simulation Data.
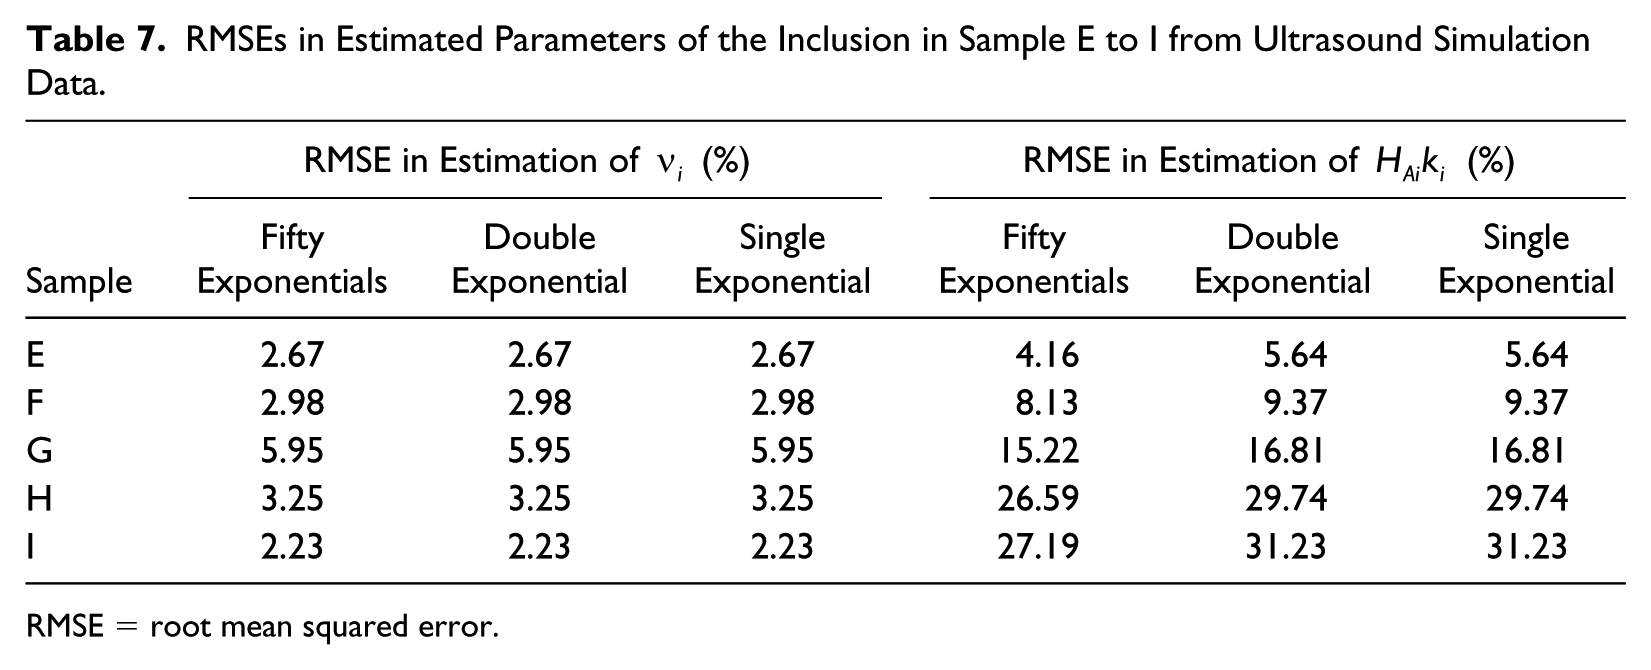
RMSE = root mean squared error.
RMSEs in Estimated Parameters of the Background in Sample E to I from Ultrasound Simulation Data.
RMSE = root mean squared error.
Discussion
The analytical models developed by Armstrong et al., 8 Berry et al., 15 and Islam et al.11,12 are important to understand the response of tissues that can be modeled as poroelastic materials and for better interpretation of medical imaging results. These theoretical models demonstrate the impact of various material properties on the strains, stresses, and fluid pressure behavior inside the tissues. However, these models contain sums of an infinite number of exponentials. Therefore, they have limited applicability to clinical data. In parameter estimation methods, which are necessary to extract the underlying mechanical properties of tissues, every exponential is treated as a nonlinear parameter, and the complexity as well as number of computations increase dramatically with increasing number of exponentials. In this paper, we analyze the error that occurs when these poroelastic models are approximated with a single exponential model or a double exponential model. Two field variables are considered in this analysis, the EPR and fluid pressure. These field variables were chosen due to their importance in poroelasticity imaging techniques, such as ultrasound poroelastography and MRI poroelastography.
From the results reported in this paper, we observe that the error associated to the single and double exponential approximations of the theoretical poroelastic models is higher for time samples immediately following compression. The exact number of these time samples depends on the properties of the material, but, in general, it is a small fraction of the overall time constant of the sample. For the uniform sample analyzed in this paper, we found an error greater than 5% only for the first five time samples of the EPR when using the single exponential model. In this particular sample, the first five samples span a time of 16 s, which corresponds to 14.04% of the first time constant. For the double exponential approximation case, the error for the EPR estimation was found to be always below 5% and to go below 2% after only two time samples (corresponding to approximately 7 s) as shown in Figure 4. Similar considerations apply to the inclusion-inserted medium when estimating the EPR inside the inclusion as the nature of the error inside the inclusion is similar to the one in the uniform sample while estimation of EPR outside the inclusion seems to be less affected in both the single and double exponential approximation cases. These observations are also applicable to the error associated to the single and double exponential approximations in the case of the fluid pressure both in uniform and inclusion-inserted media. It should be noted that the errors associated to the approximated models (both for EPR and fluid pressure) are also dependent on the boundaries and interfaces. We found out that, in proximity of boundary or interfaces between two materials, these approximations can lead to higher amounts of error. In nonuniform materials with multiple tissue interfaces, the error due the approximation of the analytical models with single/double exponential models may be higher than in the cases studied in this paper. Although the error analysis in this paper has been performed for the EPR and fluid pressure only, the same conclusions hold for circumferential strain, radial stress, and axial stress as their theoretical expressions also contain an infinite number of exponentials similarly to EPR and fluid pressure. 15
It has been reported that, in stress relaxation applications, the total analysis time span should theoretically be at least nine times the time constant of the first exponential of the strains in tissue sample
Based on the error analyses reported in this paper, the single and double exponential approximation can be “safely” used in most applications. For determination of strains, displacements, EPR, and fluid pressure, when material properties are known beforehand, the double exponential approximation model may be the preferred one because of the error associated to this model is low and the model is still computationally efficient. The single exponential approximation model is preferred for estimation of mechanical parameters because it is computationally efficient and has a similar performance to the double and infinite exponential models. Single exponential approximations have been used for elastographic time constant imaging.42-44
In general, human soft tissues are characterized by both interstitial permeability and vascular permeability. 28 When analyzing the strain response to applied compression of poroelastic samples with both interstitial permeability and vascular permeability, three cases may be considered: (a) when interstitial permeability is dominant over vascular permeability, (b) when vascular permeability is dominant, and (c) when interstitial permeability and vascular permeability are comparable. 27 In this paper, we refer to the first case, that is, when interstitial permeability is dominant over vascular permeability. In the second case, the strain response of a uniform poroelastic sample can be expressed using a single exponential model. So, this case does not require error analysis. 27 In the third case, the strain response of the uniform poroelastic sample is very similar to that of the first case except that it is multiplied by an exponential term containing vascular permeability and aggregate modulus. 27 Therefore, in the third case, the error due to single or double exponential approximations would be lower than in the first case as the exponential term containing the vascular permeability increases the weight of the first exponential on the overall strain response. As our analysis is for the interstitial permeability dominant case, it represents the worst case scenario, the one for which the error due to the approximation with single/double exponential models is expected to be the highest among all three cases.
In the field of soil mechanics and poromechanics, the permeability (

In the literature, the hydraulic conductivity over
This study has been designed for application in ultrasound poroelastography. Experimental validation of the simulation study included in this paper was not possible due to the lack of suitable phantoms with known poroelastic mechanical properties. Furthermore, since in experiments the actual tissue mechanical properties are unknown, the errors associated to the estimated mechanical parameters (Poisson’s ratio, product of aggregate modulus and interstitial permeability, etc.) cannot be experimentally measured. As the ultrasound simulations simulate a practical poroelastography experiment, the error associated to the parameters estimated from the ultrasound simulation data when the infinite exponentials are approximated with single/double exponentials represents a lower bound for the error that may be incurred when using practical experimental data.
As a final remark, the availability of single and double exponential models that approximate theoretical poroelastic models containing an infinite number of exponentials can be useful in a number of ways. The first one is the use of the approximated equations to estimate the material properties by using inverse formulation. The estimation of material properties becomes much easier to perform using the single or double exponential models rather than the general model with an infinite number of exponentials. Another possible use of the approximated models is in the determination and analysis of the time-dependent stress, strain, and pore pressure behavior in the material when the material properties are known a priori. The computationally efficient approximated analytical solutions can provide an easy and fast tool to understand the effect of different material properties inside normal and diseased tissues.45-47
Conclusion
In this paper, we analyze the error incurred in the estimation of the EPR and fluid pressure in uniform and nonuniform poroelastic samples when the theoretical models containing an infinite number of exponentials are approximated with a single exponential model or a double exponential model. It is demonstrated that the error for such approximations is significant only for early time samples of the field variable under investigation. It is also demonstrated that such approximations introduce insignificant error in the reconstruction of mechanical parameters such as Poisson’s ratio and the product of aggregate modulus and interstitial permeability. These findings can be useful to assess the suitability of simpler and more computationally efficient models to understand the performance of medical imaging methods focused on the estimation of the poroelastic response of tissues.
Footnotes
Declaration of Conflicting Interests
The author(s) declared no potential conflicts of interest with respect to the research, authorship, and/or publication of this article.
Funding
The author(s) received no financial support for the research, authorship, and/or publication of this article.