
Abstract
Measurement of corneal biomechanical properties can aid in predicting corneal responses to diseases and surgeries. For delineation of spatially resolved distribution of corneal elasticity, high-resolution elastography system is required. In this study, we demonstrate a high-resolution elastography system using high-frequency ultrasound for ex-vivo measurement of intraocular pressure (IOP)-dependent corneal wave speed. Tone bursts of 500 Hz vibrations were generated on the corneal surface using an electromagnetic shaker. A 35-MHz single-element transducer was used to track the resulting anti-symmetrical Lamb wave in the cornea. We acquired spatially resolved wave speed images of the cornea at IOPs of 7, 11, 15, 18, 22, and 29 mmHg. The IOP dependence of corneal wave speed is apparent from these images. Statistical analysis of measured wave speed as a function of IOP revealed a linear relation between wave speed and IOP cs = 0.37 + 0.22 × IOP, with the coefficient of determination R2 = 0.86. We also observed depth-dependent variations of wave speed in the cornea, decreasing from anterior toward posterior. This depth dependence is more pronounced at higher IOP values. This study demonstrates the potential of high-frequency ultrasound elastography in the characterization of spatially resolved corneal biomechanical properties.
Introduction
The cornea is the transparent outer layer of the eye that provides most of the eye’s refractive power. Diseases of the cornea can degrade vision by altering its shape and mechanical properties. The outcomes of surgical interventions are dependent on the cornea’s mechanical properties. Presently, there is no clinical instrumentation available to quantify classical mechanical parameters of the cornea, for example, shear modulus or Young’s modulus. Knowledge of these properties can potentially benefit treatment of corneal disorders such as keratoconus and aid in predicting responses to surgical interventions such as LASIK. Elasticity imaging has the potential for non-invasive characterization of corneal biomechanical properties.
Keratoconus is the most prevalent corneal dystrophy in the United States, with incidence of one in every 2000 Americans. 1 Keratoconus is characterized by progressive thinning of the cornea and loss of structural integrity. This results in protrusion: outward bulging of the cornea, forming a rounded cone shape. 1 Riboflavin/ultraviolet-A-induced collagen cross-linking (CXL) is a method to halt the progression of keratoconus. 2 - 4 Methods for estimating corneal biomechanical properties can be a useful diagnostic tool in keratoconus screening and or its treatments. CXL treatment increases corneal stiffness by inducing cross-linking of collagen fibers. 3 The stiffness of pre- and post-CXL corneas can be assessed through quantitative measurement of corneal biomechanical properties.
Corneal laser surgery is a procedure that aims to correct for refractive errors by ablating a portion of corneal tissues using a laser.5,6 The inherent assumption in these procedures is post-surgical corneas will have morphologic and physiologic functions as predicted by the shape-subtraction model. 5 This model assumes a biologically and biomechanically inert cornea. 5 However, alteration of corneal surface curvature often results in unpredicted changes of corneal structure and its mechanical properties, leading to unexpected visual outcomes.7,8 A rare complication of corneal surgery is ectasia, 9 characterized by a very thin residual stromal bed, typically less than 300 µm, and progressive steepening of the cornea.9,10 Techniques for characterizing corneal biomechanical properties, along with simulation study, can aid in the development of more comprehensive biomechanical model of the cornea that can better predict corneal response to surgeries.8,9
Currently, there are only two available clinical systems for measuring corneal biomechanical properties. 11 These systems are the ocular response analyzer (ORA; Reichert, Inc., Depew, New York) and the Corvis ST (Oculus Optikgërate GmbH, Wetzlar, Germany). ORA is a dynamic bidirectional applanation device 12 which works by applying a precisely metered air pulse to the cornea. As a result, the cornea moves from its normal convex shape into slight concavity, subsequently returning to its original convex shape. Difference in pressures as the cornea passes two applanation points represents corneal hysteresis (CH).
Corvis ST is a device that uses ultra-high-speed camera to monitor dynamic deformation of the cornea after application of air pulse. These devices have been used in clinical applications.12-18 However, the reported quantitative measures of biomechanical properties, for example, CH and corneal resistance factor (CRF), from ORA do not represent quantitative mechanical property such as shear modulus or Young’s modulus. Therefore, techniques for non-invasive quantitative measurement of corneal biomechanical properties are sought.9,11
In this effort for creating non-destructive means for characterizing corneal biomechanical properties, elasticity imaging is a potential tool. Elasticity imaging aims to extract biomechanical properties of soft tissues.19-22 Elasticity imaging finds broad applications in medicine since disease processes or abnormalities alter tissues’ elastic properties.23,24 Quantitative elasticity imaging combines mechanical excitation of soft tissues (vibration, 22 shear waves generation, 25 and surface waves generation)26,27 and synchronized motion tracking using coherent imaging systems (optical imaging,28-32 ultrasound imaging,19,20,22,25 and magnetic resonance imaging).33,34 This results in images of tissue biomechanical properties, providing elastic contrasts that are potentially useful for clinicians in detecting abnormalities or monitoring progression of diseases. Current trend in the literature on imaging elastic properties of the cornea is on using optical-based elastography: optical coherence elastography (OCE) 31 and Brillouin microscopy. 32
Ultrasound elasticity imaging system generally uses ultrasound frequencies in the range of 2-12 MHz. This frequency range provides spatial resolution from hundreds of micrometers and several millimeters, 35 suitable for imaging deep-lying tissues. Ultrasound elastography of the cornea includes ultrasound surface wave elastography (USWE) and acoustic radiation force impulse—shear wave elasticity imaging (ARFI-SWEI).
Zhou et al. 26 measured strain-dependent wave speeds of ex-vivo porcine corneas using USWE with a Verasonics system (Verasonics, Redmond, Washington). They obtained phase speeds of 100, 150, and 200 Hz vibrations as a function of intraocular pressure (IOP). They were able to show IOP-dependent wave speed estimates. However, the use of 6.4 MHz center frequency limits the ability to provide depth-resolved spatial distribution of corneal wave speed.
Tanter et al. 36 used ARFI-SWEI technique to measure elastic wave speed in the cornea using a 15-MHz linear array tranducer. The cornea in this case represents a challenging small target, as it is only approximately 5 wavelength thick at 15 MHz. Nonetheless, their study demonstrated that ARFI-SWEI in the cornea is feasible.
Characterization of thin superficial tissue structures requires high-frequency ultrasound. High-frequency ultrasound/ultrasound biomicroscopy (UBM) using transmit frequencies, an order of magnitude higher than diagnostic ultrasound imaging, provides spatial resolution in the order of tens of microns. High-frequency ultrasound elastography can provide high-resolution characterization of corneal biomechanical properties. Such a characterization is useful in predicting the effect of different flap thickness in LASIK on corneal mechanical properties in the understanding and assessment of keratoconus progression and post-LASIK ectasia. 37
Earlier works on high-frequency ultrasound elastography of the cornea include strain elastography of the cornea. 38 In this study, Hollman et al. used strain elastography to obtain a three-dimensional strain map from a porcine eye. A 53-MHz single-element transducer was used for tracking corneal displacement during compression. Shih et al. 39 performed ARFI imaging of the cornea using a confocal dual-frequency transducer setup. An 11-MHz outer element generated acoustic radiation force in the cornea while a 48-MHz high-frequency central element tracked corneal motion after application of acoustic radiation force push. Their acquisition resulted in two-dimensional maps of corneal relative stiffness. However, due to limitations of strain images, more quantitative estimates of corneal biomechanical properties are needed.
Sit et al. 27 performed a feasibility study of in vivo measurement of Young’s modulus of elasticity in human eyes. A 100-Hz harmonic vibration was applied safely on closed eyelids for 0.1 second. Wave speed propagation was measured using USWE with a linear array transducer operating at 6.4 MHz. They found a mean wave speed of 1.82 ± 0.10 m/s in the cornea at a mean IOP of 12.8 ± 2.7 mmHg. The calculated Young’s modulus was 696 ± 113 kPa. They found that Young’s modulus was significantly correlated to the IOP (r = 0.57; p = 0.004). They demonstrated that measurement of corneal wave speed using diagnostic ultrasound frequency is feasible. Still, a high-frequency ultrasound elastography system is required for providing spatially resolved images of corneal biomechanical properties.
Qian et al. 40 described a micro-elastography system using confocal alignment of 4.5 MHz ring transducer and a 40-MHz needle transducer. The ring transducer generates acoustic radiation force in the cornea. The 40-MHz high-frequency transducer is used for motion tracking. They used their system for the implementation of ARFI imaging and Young’s modulus estimation of ex-vivo porcine corneas at IOP of 5 to 30 mmHg. They showed significantly different corneal stiffness at different IOPs, with higher stiffness at higher IOP. Still, spatially resolved images of corneal biomechanical properties were not provided.
The objective of this study is to implement a high-frequency ultrasound elastography system for non-destructive measurement of IOP-dependent corneal biomechanical properties. We used a 35-MHz single-element high-frequency transducer in our study. Lamb wave phase speed of 500 Hz vibrations is used as a quantitative metric of biomechanical properties related directly to elastic moduli. Our high-resolution elasticity imaging system resulted in spatially resolved wave speed images of the cornea at different IOPs. To the best of our knowledge, this is the first study using high-frequency ultrasound elastography that provides spatially resolved images of quantitative corneal biomechanical properties at different IOPs. Our results confirmed IOP-dependent effect of corneal wave speed. We obtained a linear relation between corneal wave speed and IOP. Furthermore, we also observed depth distribution of corneal wave speed with a decreasing trend from anterior toward posterior. This depth-distribution is more pronounced at higher IOPs.
Material and Method
Acquisition System Description
Ultrasound elasticity imaging works by displacing the tissue through application of forces and subsequent motion tracking of the induced tissue motion using acoustic waves. A mechanical shaker (mini-shaker type 4810; Bruel & Kjaer, Duluth, Georgia) generated 500 Hz harmonic vibrations on the surface of the imaging targets. A 35-MHz polyvinylidene fluoride (PVDF) single-element high-frequency transducer from Panametrics (Olympus, Waltham, Massachusetts) with 19 mm depth-of-focus and aperture f/3 was used for motion tracking. The transducer was attached to a three-axis motor driven positioner (Bislides; Velmex, Inc., Bloomfield, New York). Figure 1 depicts the block diagram of our acquisition system for the implementation of high-frequency ultrasound elastography.
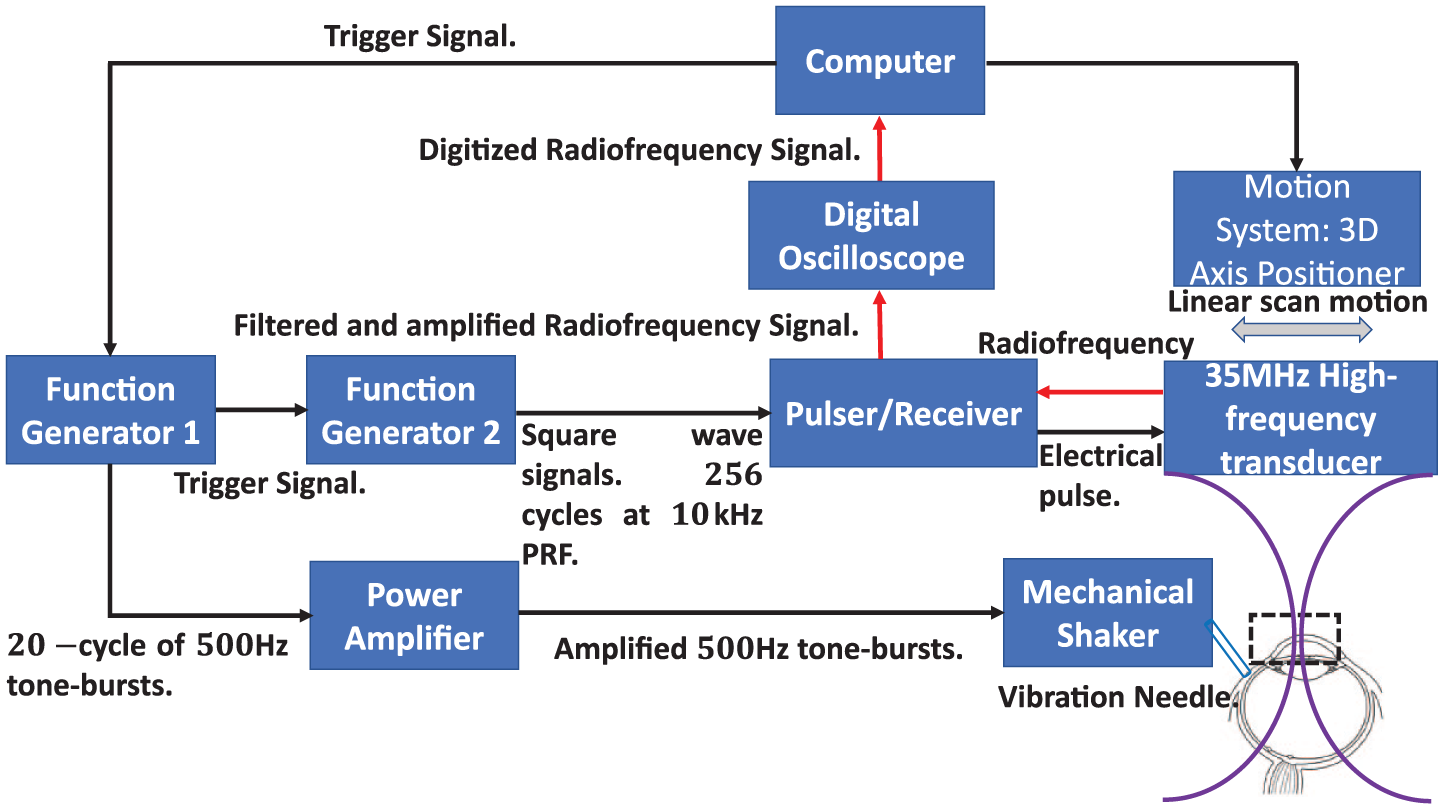
Quantitative elasticity imaging system diagram. A trigger signal triggered the first function generator. The first function generator produced 20 cycles of 500 Hz tone bursts that were amplified by the power amplifier and used to excite the mechanical shaker for generating vibrations in the imaging targets. The first function generator also triggered the second function generator. The second function generator produced 256 cycles of square wave trigger signal at 10 kHz Pulse Repetition Frequency (PRF) for input to a pulser/receiver. The pulser/receiver generated a broadband signal for exciting the 35-MHz high-frequency transducer. Propagation of transverse vibrations in the imaging targets (tissue-mimicking gelatin phantoms and porcine eyes) was monitored using tracking pulses emitted by the 35-MHz high-frequency transducer. The 35-MHz transducer was attached to a three-axis motor driven positioner. Back-scattered radiofrequency data were digitized using a digital oscilloscope before sent to a computer for post-processing.
Elasticity imaging acquisition was initiated with a single-channel function generator (Agilent 33220A; Agilent Technologies, Inc., Santa Clara, California). Software trigger of this function generator produced 20 cycles of 500 Hz tone bursts with 250 mVpp (mV peak-to-peak) amplitude. The sine bursts were amplified using a power amplifier (type 2718; Bruel & Kjaer) before exciting a mechanical shaker (mini-shaker type 4810; Bruel & Kjaer). The shaker was coupled to the surface of the imaging targets using a 1.27-mm-diameter needle. From mini-shaker type 4810 data sheet, the shaker is acceleration-limited at 500 Hz. The maximum acceleration is 550 m/s
2
for unloaded speaker. The displacement amplitude is
Elasticity imaging acquisition proceeds by translation of the 35-MHz transducer to subsequent tracking axis and repeat of the vibrate and track sequence. Figure 2 illustrates the acquisition sequence. The acquisition resulted in motion radiofrequency data, with dimensions of depth (fast-time), lateral position, and slow-time. A typical size of the radiofrequency data set is 2048 × 107 × 256 (depth × lateral position × slow-time). For corneal imaging, the vibration source
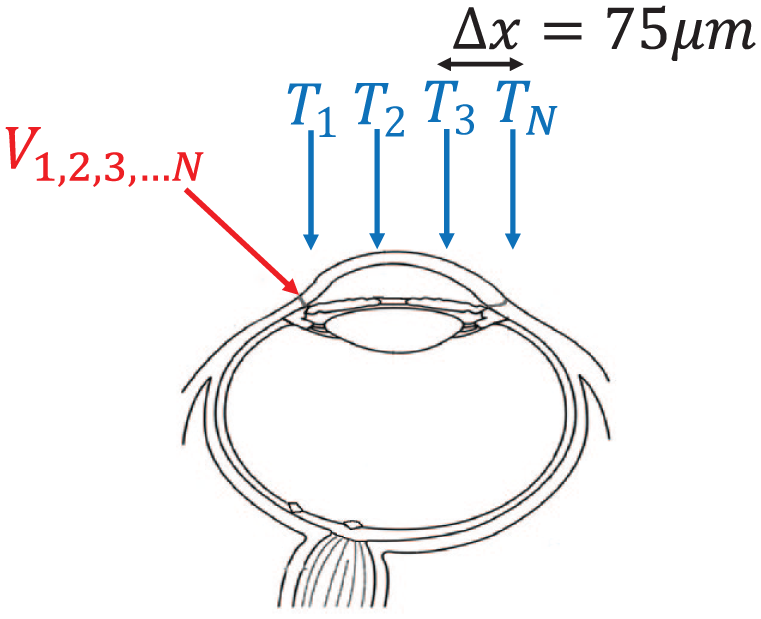
Custom-sequence implementation for quantitative elasticity imaging. The vibration axis was held fixed, while tracking axis was laterally translated along lateral direction with a lateral spacing location of
We characterized the spatial resolutions of our imaging system by imaging of a 50-µm-diameter copper wire target. The measured axial and lateral resolutions were 43 and 191 µm, respectively. The lateral resolution is expected to be not great due to large f/3 aperture. The lateral resolution can be improved using tighter
Experimental Setup and Data Processing
A total of 15 porcine eyes were used for strain-dependent corneal wave speed measurement. Porcine eyes were obtained fresh and unscaled from a local slaughterhouse (Joe’s Meat Market, Ontario, New York). The eyes were maintained at a temperature of 3.1°C. Elasticity imaging of the cornea was performed within 48 hours in all cases, most within 24 hours. Prior to imaging, extra-ocular muscles were removed from the eyes. The eye was then placed in a custom-devised chamber that allowed insertion of a needle through the sclera into the anterior chamber for IOP control. The needle was connected to a water column and a water reservoir. The height of the water column indicates IOP level inside the eye. The IOP levels were adjusted by elevation of the water reservoir.
For ex-vivo experiment, porcine eyes were immersed in edema-inhibiting fluid-couplant of 10% Dextran-40 (Alfa Aesar, Tewksbury, Massachusetts) in saline solution for the duration of the experiment. The fluid inhibited the swelling that can induce variability in the measured corneal wave speed over time. Experiments were performed at room temperature, which was recorded for each wave speed measurement.
Radiofrequency data were filtered on the fast-time/depth axis using a rectangular band-pass filter. The band-pass filter was centered at
In cylindrical geometry, curvature coordinate is represented by a pair of coordinates:
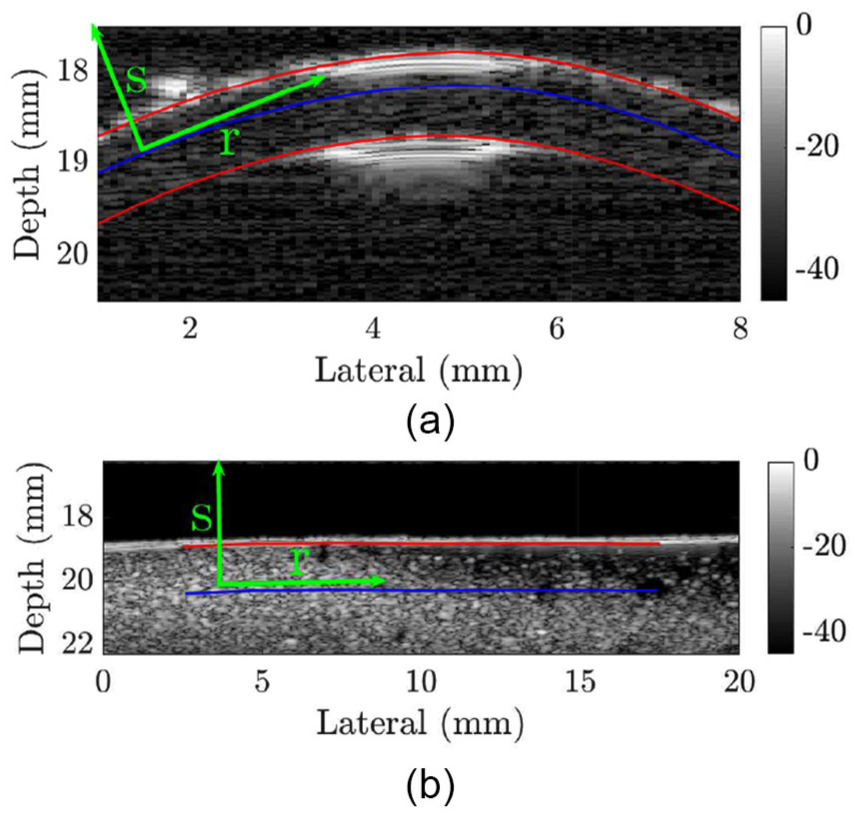
Trajectories based on surface segmentation of the imaging targets. Wave speed analysis is performed along the blue curves in each imaging target. The axes in curvature-based coordinate system are also shown.
Prior to wave speed estimation, a two-dimensional directional filter as described in Lipman et al.
43
was applied to the curvature-based displacement data to pass only right-going traveling waves (propagating in positive
The curvature-based displacement at a given radial distance
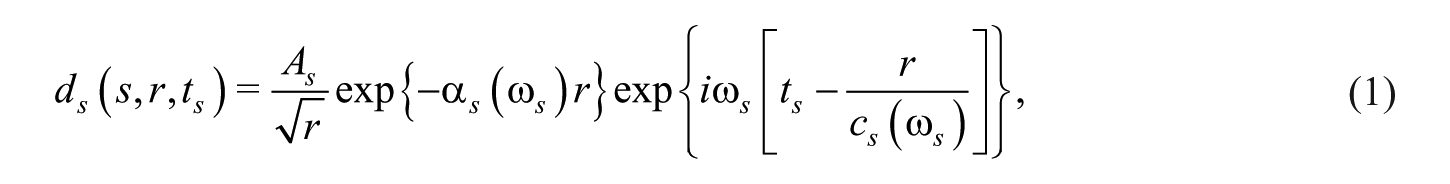
where

Phase-delay estimation was performed at all locations along a given curvature
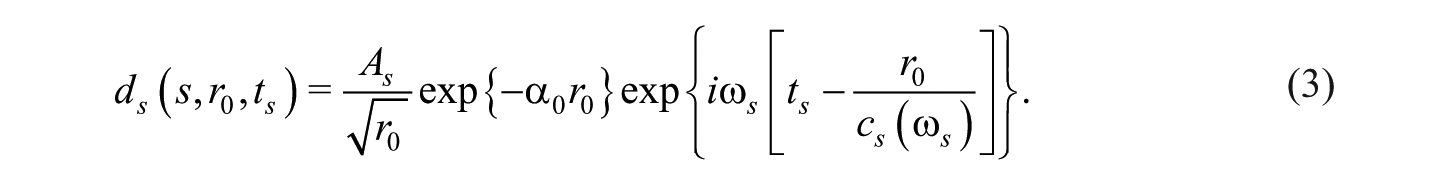
The last factor in Equation (3) is the traveling wave factor, describing right-going traveling wave. The displacement data at
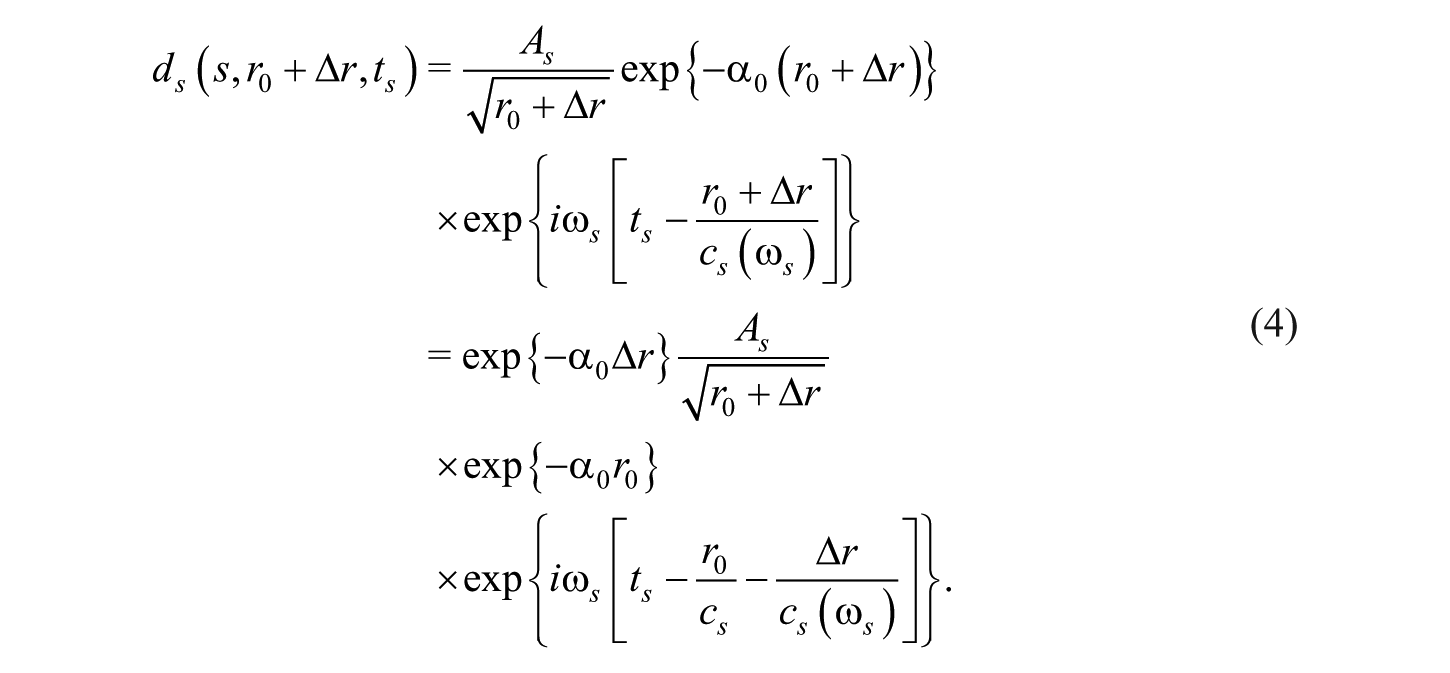
Equation (4) indicates that the displacement at
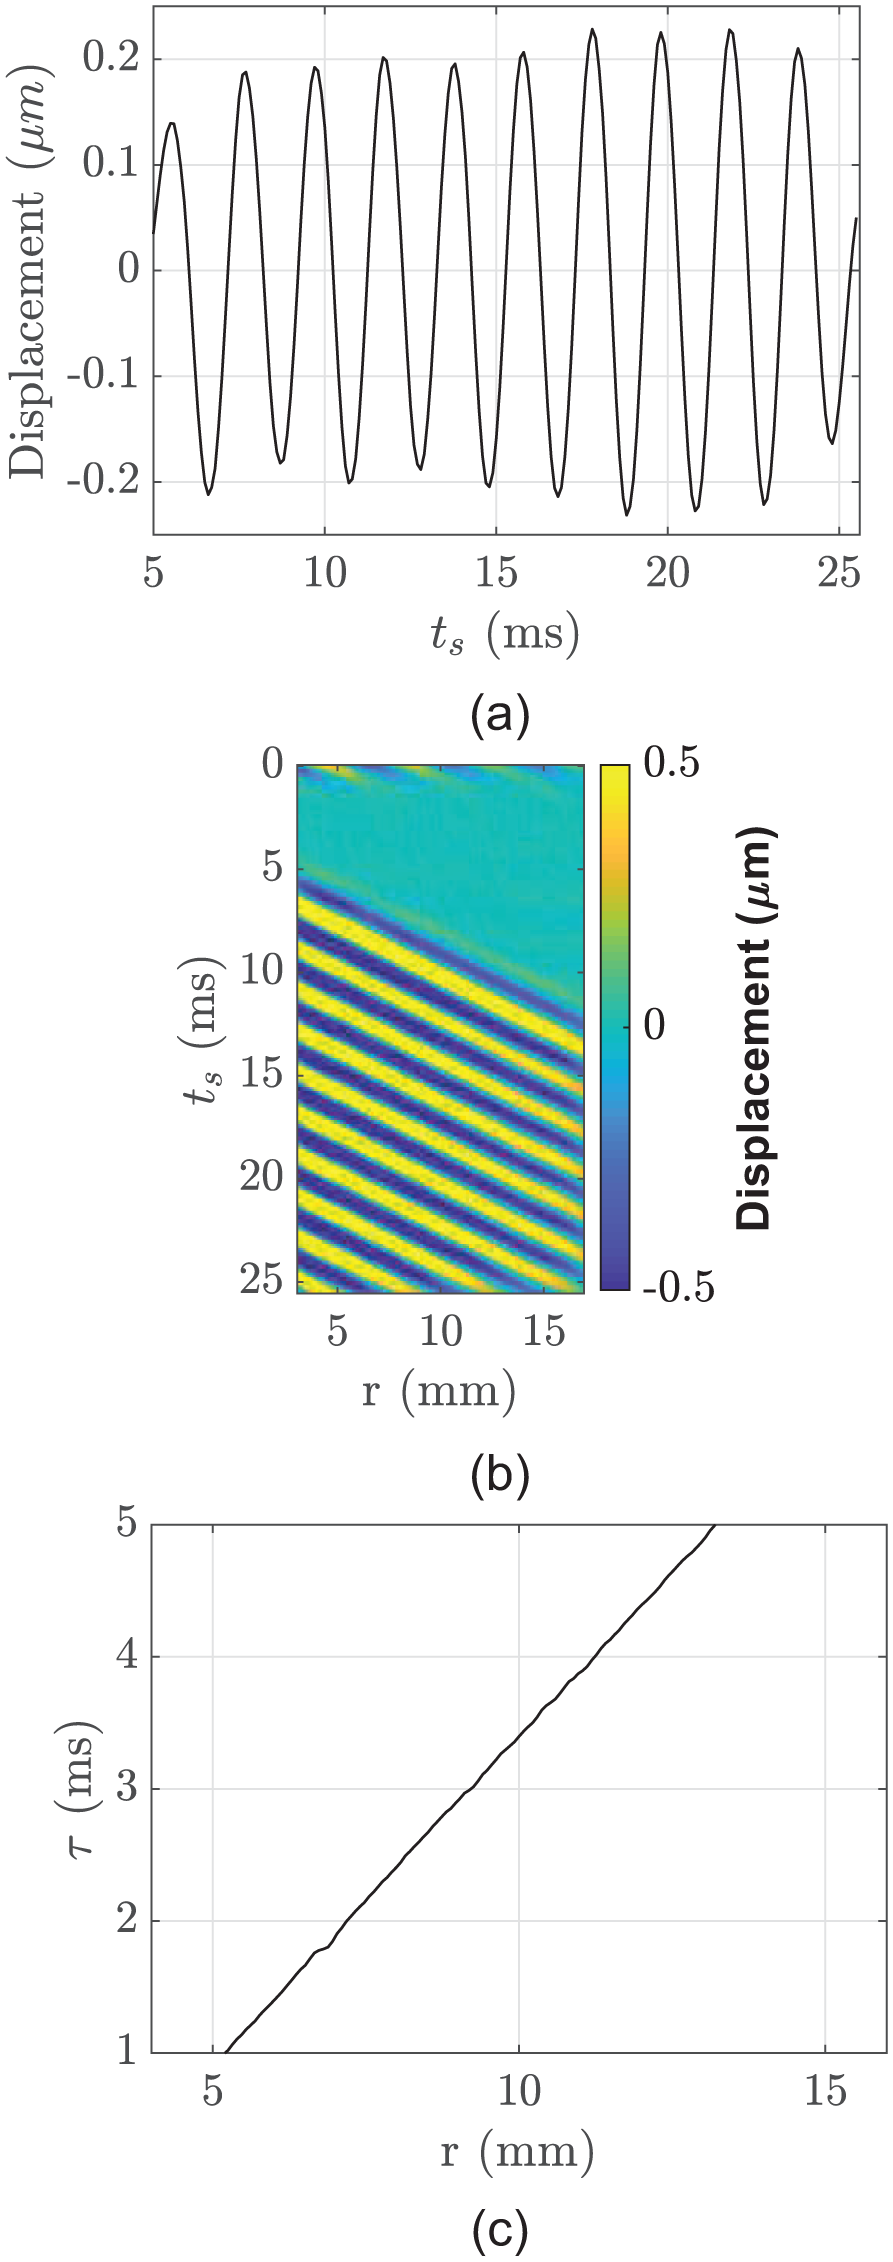
Slow-time displacement, space-time map, and estimated arrival time-delay: (a) tracked displacement data from harmonic transverse waves excitation; (b) space-time map from gelatin phantom; and (c) arrival time-delay.
For the implementation of curvature-based displacement, wave speed analysis was performed along surface curvature of the imaging targets. In the case of block gelatin phantom, the surface is approximately planar and curvature-based displacement falls in the regime of radial distance
Comparison of Wave Speed Estimates from High-Frequency Ultrasound Elastography and STL-SWEI Implementation
We tested the measurements of wave speed on gelatin phantoms from high-frequency ultrasound elastography with those from STL-SWEI (single tracking location—shear wave elasticity imaging) implementation developed earlier in our lab.41,42 Two homogeneous gelatin phantoms were manufactured from 7% and 11% 200-bloom gelatin concentration in water. Cornstarch with 1% concentration was added to the gelatin solution as acoustic scatterers.
Wave speed images were acquired over 15 mm lateral span with
We compared these wave speed estimates with those from STL-SWEI implemented on a Siemens Antares ultrasound scanner (Tarrytown, New York) with a VF10-5 linear array transducer. The distance between the push-beam axes was ∆P = 5.99 mm. The distance between the first push-beam axis and the track-beam axis was ∆x = 5.99 mm. The transmit frequency of the VF10-5 probe was
Wave Modes in High-Resolution Ultrasound Elastography
As high-frequency ultrasound is used for imaging superficial tissue structures, implementation of quantitative elasticity imaging requires consideration of the behavior of transverse waves near a boundary. Propagation of these waves can be visualized from the slow-time frames of tracked displacement data. In the case of the gelatin phantoms, the elastic wave is a Scholte wave—a transverse surface wave that propagates at the interface between a semi-infinite elastic solid medium and a fluid region.42,44,45 The Scholte wave speed is 84% the shear wave speed.
In the case of corneal imaging using ultrasound, the cornea can be modeled as a curved thin slab bounded by fluid regions: coupling fluid on the anterior and the anterior chamber on the posterior. Thus, a Lamb wave model is appropriate for corneal imaging. We measured Lamb wave phase speed of 500 Hz vibrations in the cornea as a quantitative metric of biomechanical properties.
Strain-Dependent Corneal Wave Speed Measurement
In seven eyes, strain-dependent corneal wave speed measurement included four IOP levels of 7, 11, 15, and 18 mmHg. For the remainder eight eyes, strain-dependent wave speed measurement was extended to include IOP levels above that of the physiologically normal range: 22 and 29 mmHg. At each IOP level, we repeated wave speed measurement 2 to 3 times to assess repeatability of the measurement. From each wave speed image, a two-dimensional ROI within the cornea was selected at each IOP level for statistical analysis. For a given cornea, the same ROI size was used for each IOP level. The ROI was obtained from B-mode segmentation of the cornea at each IOP level. We also performed statistical analysis using one-way analysis of variance (ANOVA) in MATLAB using anova1 and multcomp to assess statistical significance of strain-dependent corneal wave speed.
Results
Displacement Images
Figure 5 depicts the right-going propagation of harmonic Scholte wave on the surface of a homogeneous 7% gelatin phantom and 500 Hz anti-symmetrical Lamb wave propagation in the cornea at two slow-time points:
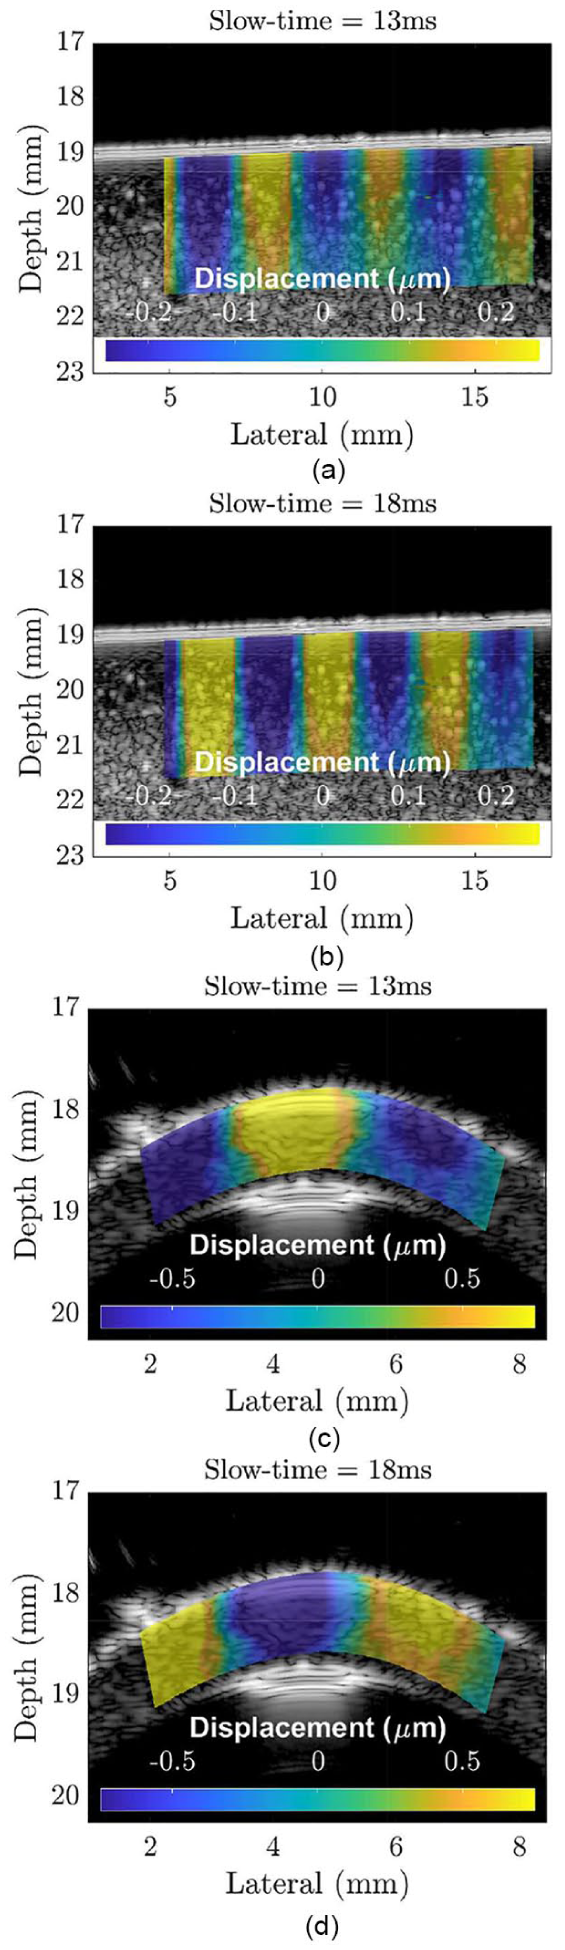
(a, b) Slow-time frames of displacement data from high-frequency ultrasound elastography, showing right-going propagation of 500 Hz harmonic Scholte waves on 7% gelatin phantom. Scholte waves propagate along the fluid–solid interface between coupling fluid and gelatin phantom. The displacement is in µm. The colorbar range is from −2.5 to 2.5 µm. The vibration source was located 13 mm to the left of the image. Scholte wave propagation results from 20 cycles of 500 Hz harmonic excitations. (c, d) Slow-time frames of displacement data from high-frequency ultrasound elastography, showing right-going propagation of 500 Hz anti-symmetrical Lamb wave on a porcine cornea. The displacement is in µm. The colorbar range is from −7.5 to 7.5 µm. The vibration source is located at the limbus. Lamb wave propagation results from 20 cycles of 500 Hz harmonic excitations.
Comparison of Scholte Wave Speed of Gelatin Phantoms from High-Frequency Ultrasound Elastography and STL-SWEI Implementation
Figure 6 shows the wave speed images of 7% and 11% gelatin phantoms using high-frequency ultrasound elastography. For each gelatin phantom, wave speed images were acquired from five different speckle realizations. These images depict homogeneous shear modulus distributions within each gelatin phantom.
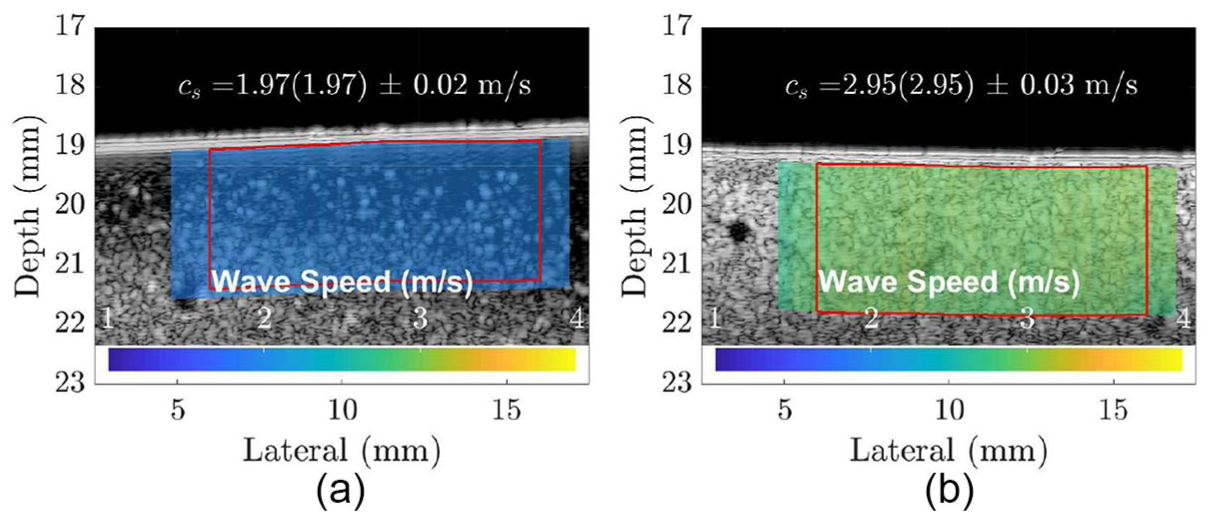
Wave speed images of 7% and 11% gelatin phantoms using high-frequency ultrasound elastography. Wave speed images were acquired from five different speckle realizations. Wave speed images depict homogeneous speed distributions. The range of the color scale in each image is from 1 to 4 m/s. The statistics of wave speed estimates from a 10-mm-width × 2.4-mm-depth ROI are presented in each image. The ROI is bounded by red lines. The reported statistics are the mean(the median) ± the standard deviation of wave speed, as indicated by the inserted text. (a) 7% and (b) 11% gelatin phantom. ROI = region of interest.
Table 1 tabulates the statistics of wave speed estimates from the gelatin phantoms obtained with the high-frequency ultrasound system. Table 2 provides the statistics of wave speed estimates from the gelatin phantoms using STL-SWEI. Wave speed estimates of gelatin phantoms from high-frequency ultrasound elastography are comparable with those from STL-SWEI using diagnostic frequency.
Wave Speed Estimates from 7% and 11% Gelatin Phantoms Using High-frequency Ultrasound Elastography.
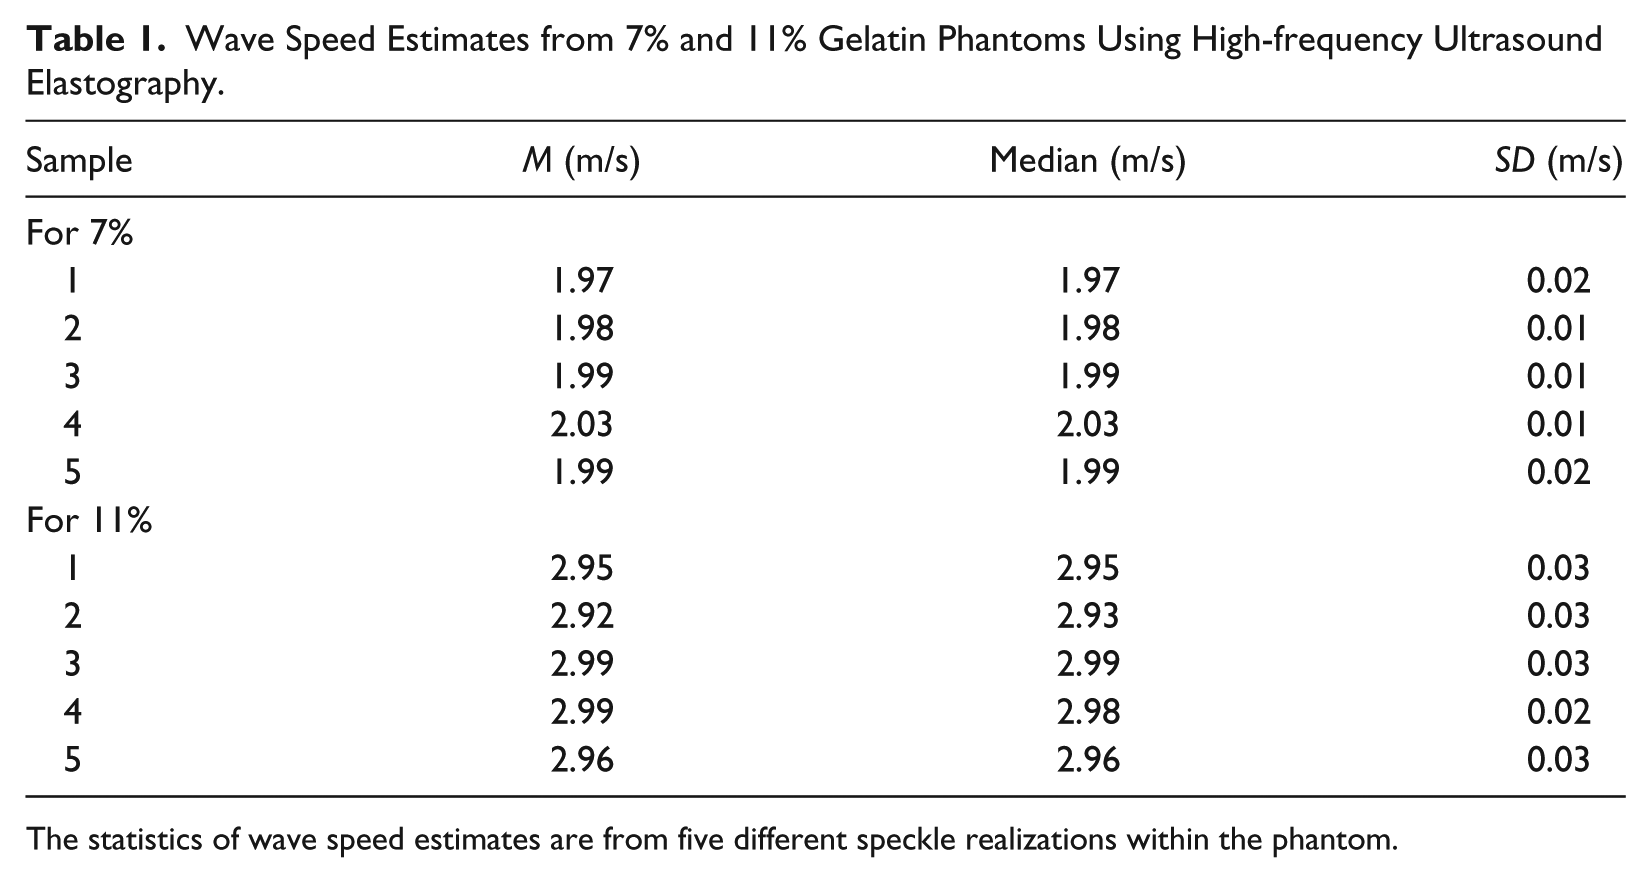
The statistics of wave speed estimates are from five different speckle realizations within the phantom.
Wave Speed Estimates from 7% and 11% Gelatin Phantoms Using Single Tracking Location—Shear Wave Elasticity Imaging.
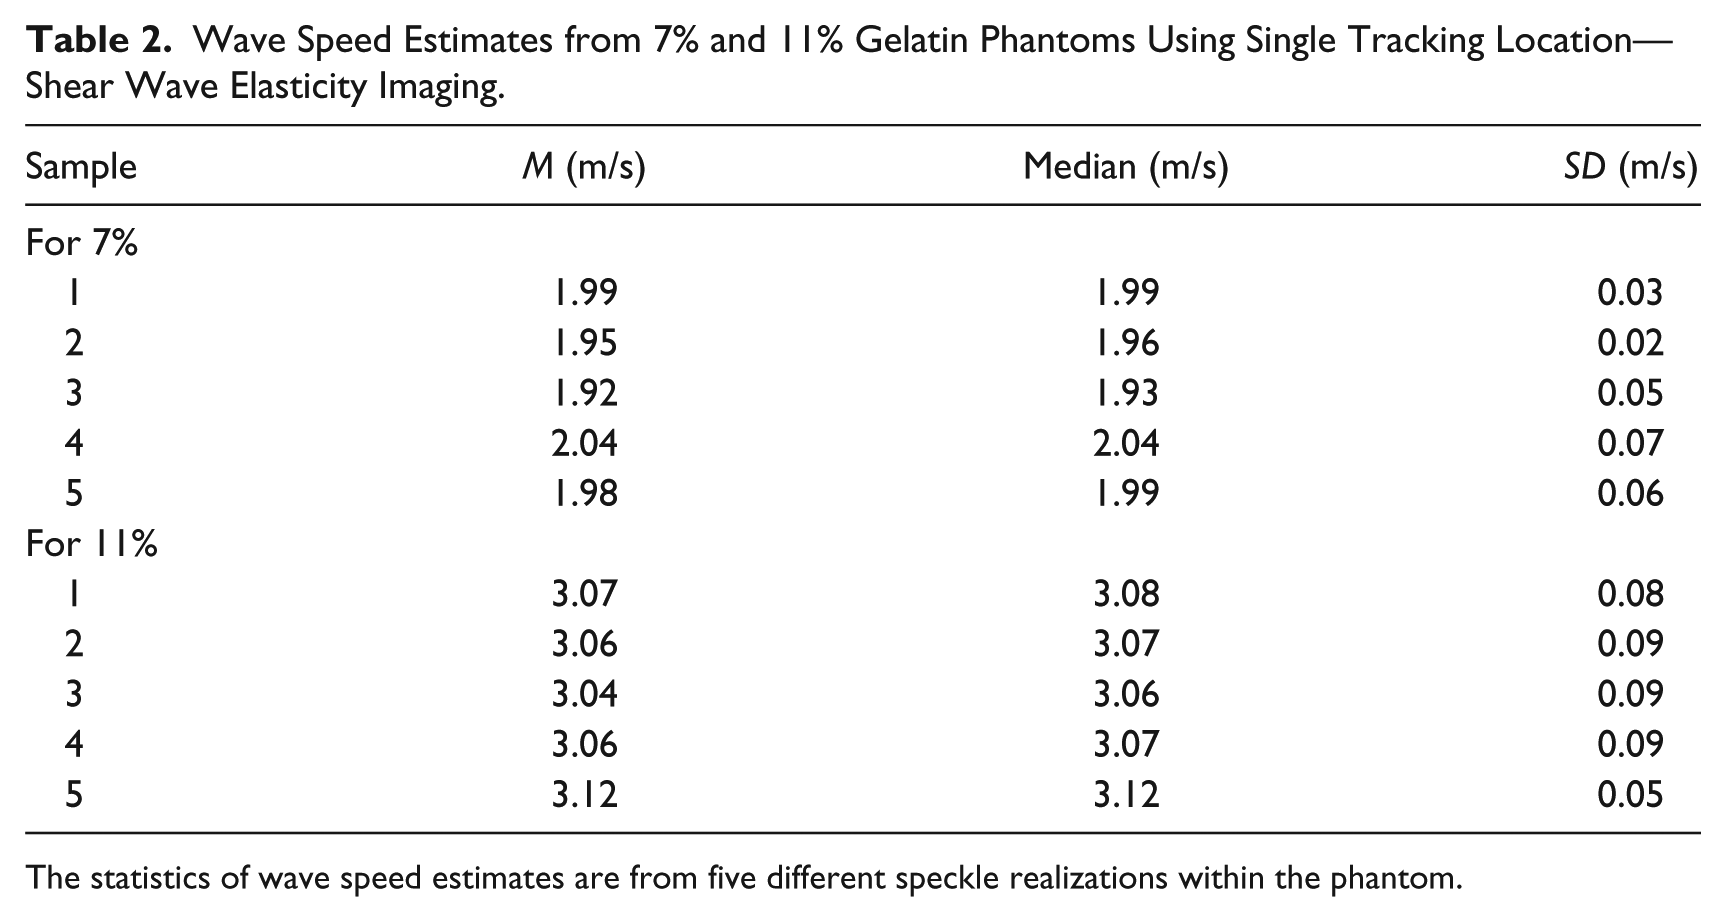
The statistics of wave speed estimates are from five different speckle realizations within the phantom.
IOP-Dependent Corneal Wave Speed Measurement
Figures 7 and 8 show the corneal wave speed images at a number of different IOPs. Figure 7 uses the same color scale for each image, while Figure 8 uses colorbars that are centered at the median wave speed at respective IOP. Using the latter representation, we can delineate spatial variations of the measured corneal wave speed better. In both representations, the IOP dependence of corneal wave speed is apparent. An increase in IOP results in the stiffening of the cornea, as reflected in the higher measured wave speed.
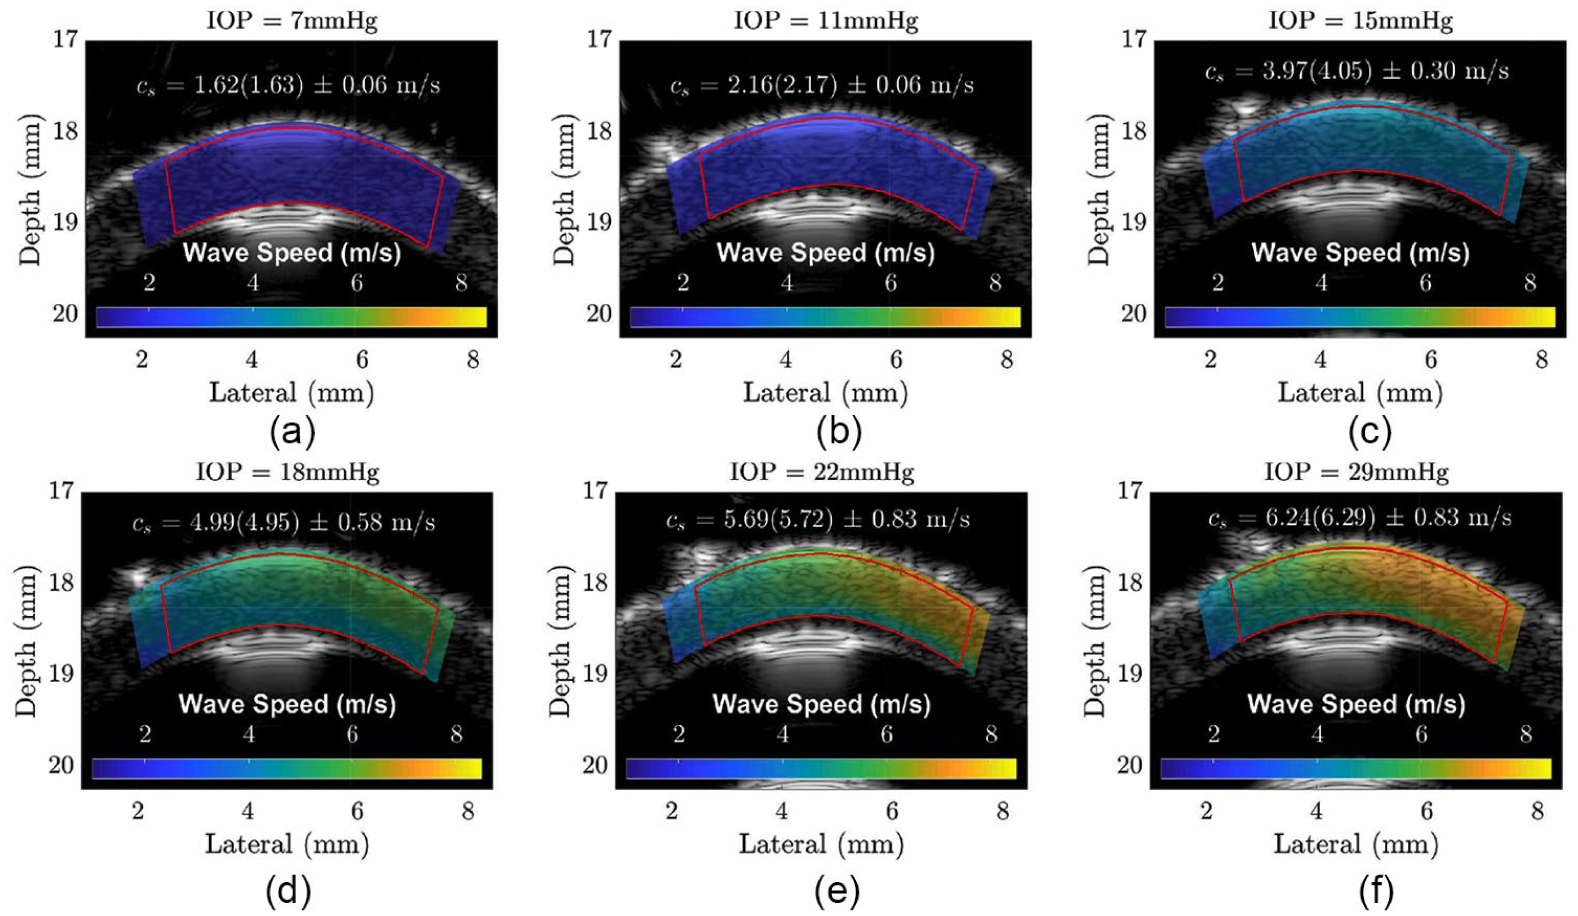
Representative example of wave speed images of an ex-vivo porcine cornea at different IOP levels. Wave speed images are presented in duplex mode, overlaid on top of B-mode image of the anterior segment at the corresponding IOP. Strain-dependent effect of the measured corneal wave speeds is apparent by looking at the color scale. The range of the color scale for each wave speed image is from 1 to 8.5 m/s. Increase in IOP results in the stiffening of the cornea, as reflected from the measured corneal wave speeds. A two-dimensional ROI within the cornea was selected for statistical analysis of the measured wave speeds. The ROI is a curved slab, bounded by red curves. The reported statistics are the
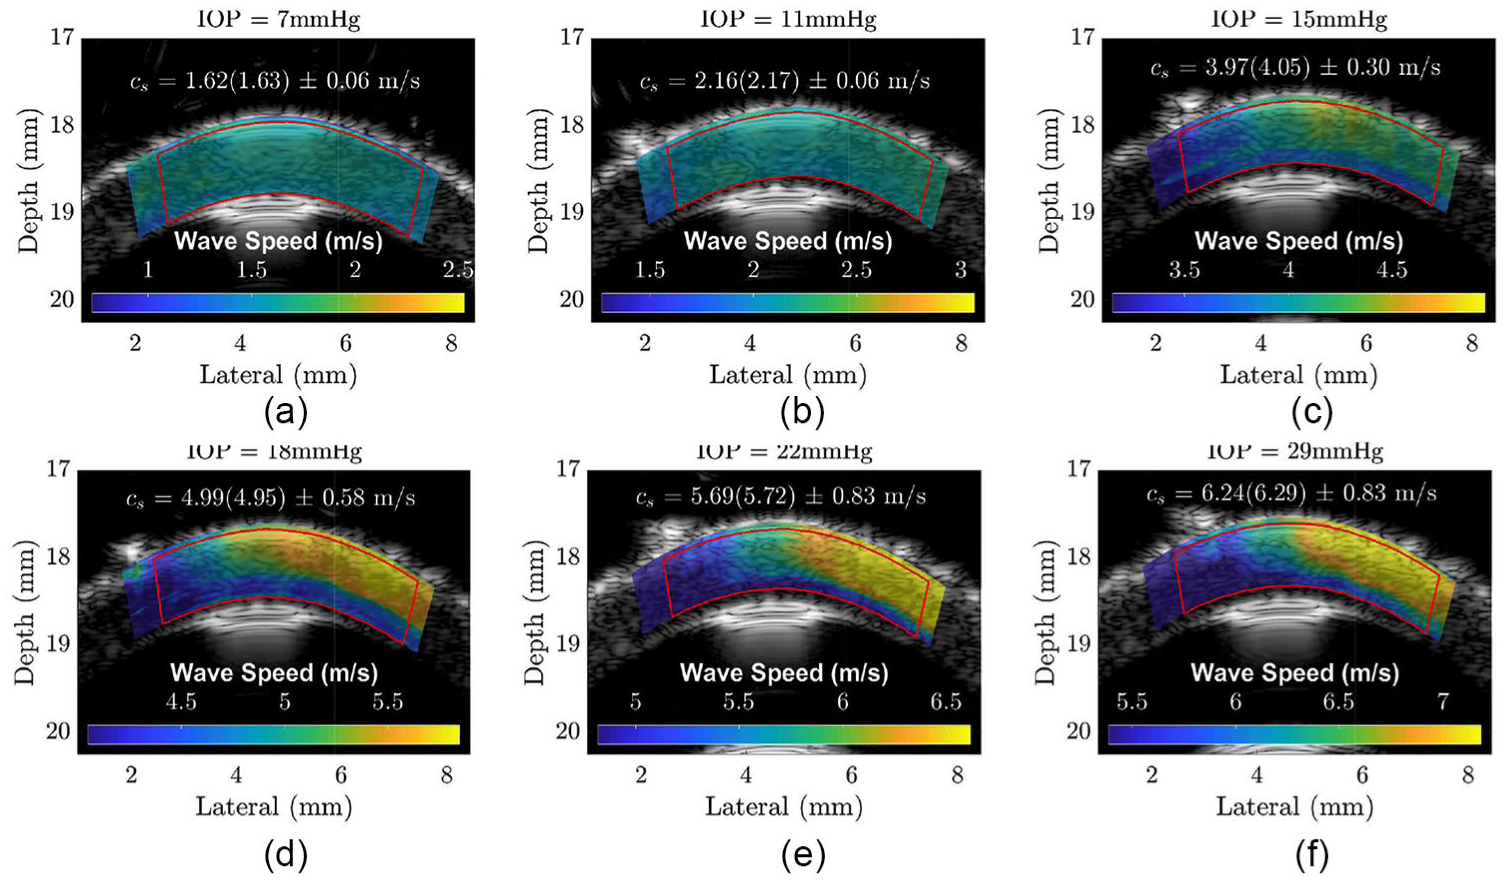
Representative example of wave speed images of an ex-vivo porcine cornea at different IOP levels using color scale centered at the median wave speed for given IOPs. The range of the color scale for each wave speed image is 1.8 m/s. Using this representation, spatial variation of the measured corneal wave speeds is more apparent. Depth-resolved distribution of corneal wave speeds is visible at higher IOP levels. Increase in IOP results in the stiffening of the cornea, as reflected from the measured corneal wave speeds. The reported statistics are the
Figure 9 shows the box plots of wave speed as a function of IOP across porcine eye samples. The lower range of IOP (up to 18 mmHg) consists of data from 15 porcine eyes. The higher range of IOP (above 18 mmHg) consists of data from eight porcine eyes. The reported wave speeds are the mean and median values across two-dimensional ROI of the cornea at respective IOP level. We performed linear regression to fit the IOP-dependent corneal wave speed data. Using median value of wave speed, we obtained the fit function: cs = 0.37 + 0.22 × IOP, with the coefficient of determination
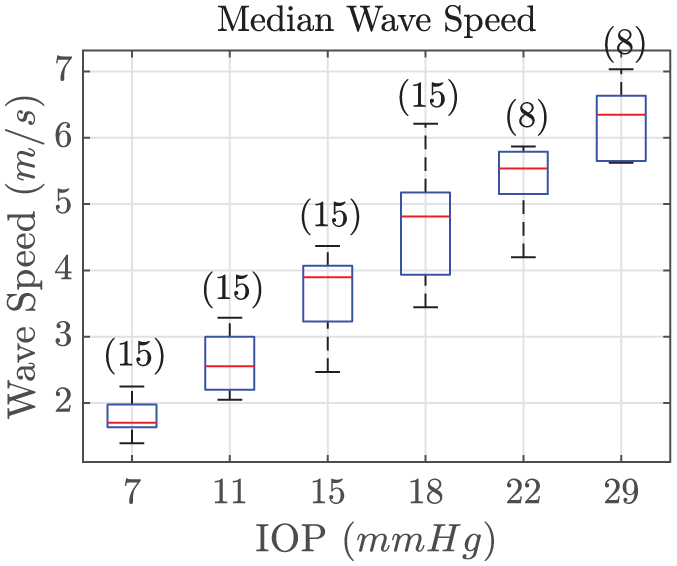
Box plots of wave speed as a function of IOP from different porcine eye samples. The reported wave speed from each eye sample is the median value from two-dimensional ROI. The bottom and top edges of the box represent the 25th and 75th percentiles, respectively. The central mark in each box indicates the median. The whiskers are 1.5 times the interquartile range. The number above each box indicates the number of porcine eyes in the assigned IOP group. Wave speeds at different IOP groups are statistically significantly different. One-way ANOVA and comparison of wave speeds between IOP groups result in p-values ≤ 0.05. We performed linear regression to the IOP-dependent wave speed data. The fit function for wave speed is cs = 0.37 + 0.22 × IOP, with the coefficient of determination
Figure 10 shows the representative plots of depth-dependent corneal wave speed at different IOP levels. The plotted wave speed at each depth was obtained by taking the median value of wave speeds at each curvature depth
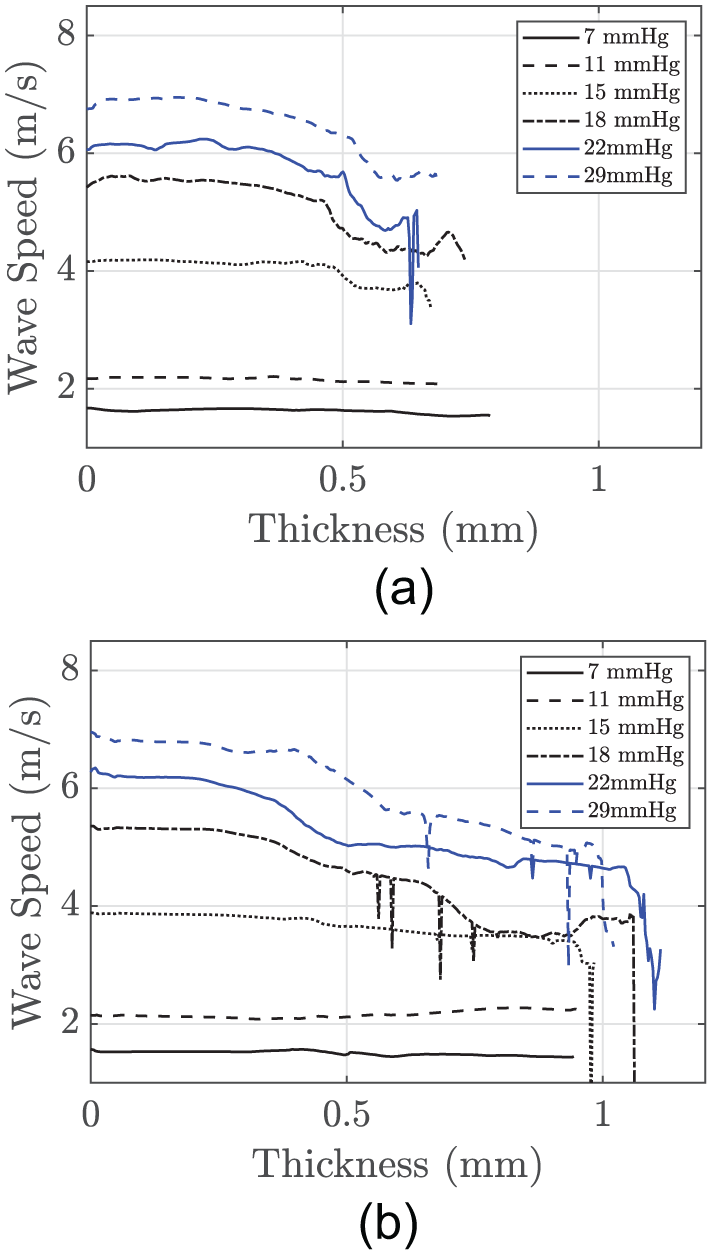
Representative depth-resolved wave speed versus thickness plots at various IOP levels from different eye samples. At lower IOP levels (7 and 11 mmHg), wave speeds are approximately constant over depth (from anterior toward posterior). At higher IOP levels, corneal wave speed exhibited spatial variations with higher wave speeds at the anterior and gradually decreases toward the posterior, with variations among different eye samples. The plotted wave speed at each depth was obtained by taking the median value of wave speed at each circumferential distance
Discussion
The measured wave speeds of porcine corneas obtained using our method are comparable with those obtained using diagnostic ultrasound elastography in the literature.26,27,36,40 IOP-dependent corneal wave speed was observed to be a linear function of IOP in the 7-29 mmHg IOP range. Increase in IOP beyond 29 mmHg could lead to nonlinear relation between wave speed and IOP. The smallest variation in IOP level in our study was 3 mmHg and the difference between wave speeds at 15 and 18 mmHg is statistically significant. An earlier study 46 also attempted to infer IOP changes in the eye by detection of low-amplitude and low-frequency vibration using Doppler ultrasound. In their in vitro experiments, as little as 4 mmHg IOP changes was detectable.
A limitation of this study is that extensive characterization of elastographic image qualities was not performed. Our subsequent works aim to perform such a measurement using simulation and phantom experiments. The effect of ultrasound and signal processing parameters, for example, cross-correlation kernel length and kernel overlap, on elastographic image qualities will be assessed. We can perform this characterization experimentally as has been shown by Qian et al. 47 for the characterization of their high-frequency ultrasound elastography system. Righetti et al. 48 showed that the axial resolution in elastography in the context of strain imaging is limited by ultrasonic pulse-width. Furthermore, they also suggested that scaling up of elastography using high-frequency ultrasound results in corresponding increase in the elastographic axial resolution, compared to that obtained using diagnostic frequency ultrasound elastography. Using our high-frequency ultrasound elastography system, we demonstrated this scaling and were able to come up with spatially resolved images of corneal wave speed at different IOPs.
Furthermore, we also observed wave speeds contrast across the 780-µm-thick porcine cornea, decreasing from anterior toward posterior. This observation agrees with results obtained using destructive testing37,49,50 and using optical techniques: OCE 31 and Brillouin microscopy. 32 High-frequency ultrasound elastography offers similar benefits to OCE in providing high-resolution images of corneal biomechanical properties nondestructively. The lower measured wave speed in posterior cornea can been linked with the micro-architectural hierarchy of collagen fibers in the cornea. 51 The anterior portion of the cornea (Bowman’s membrane) consists of random distribution of fibrils that maximizes its stiffness. 51 The posterior two-thirds of the stroma consists of much regular arrangement of fibrils that has lower stiffness compared to that of the anterior cornea. 51 Using Brillouin optical microscopy, Scarcelli et al. 32 showed that the anterior part of the stroma demonstrates the highest elastic modulus. Furthermore, they also showed that the innermost region near the endothelium shows rapid modulus decrease with depth. 32 A precipitous drop in wave speed at the posterior cornea from our measurement can be associated with this, in particular at higher IOPs where the elastic contrast between regions of different collagen fiber structures is more accentuated.
In characterizing our high-frequency ultrasound elastography system, we used 3-cm-thick block gelatin phantoms. In the future, we can better characterize our system using thin layers of gelatin phantom, for example, 1-, 2-, and 4-mm-thick gelatin phantoms as demonstrated by Qian et al.
40
to better approximate plate wave modes. Furthermore, we also performed a t-test and concluded that the wave speed estimates from 7% gelatin phantom using high-frequency ultrasound elastography and STL-SWEI as shown in the left column of Tables 1 and 2 are not statistically significantly different (
A possible concern is the interference between successive vibration pulses. While the pushing/vibration time is 40 ms and the tracking time is only 25.6 ms, the subsequent pushing (excitation) does not start until the radiofrequency data have been transferred from local storage in the digital oscilloscope to a desktop computer. So, for a given transfer speed through local area network connection, there is a finite transfer time of the radiofrequency data. Looking at the acquired data acquisition time stamps, we acquired approximately 80 tracked sequence-mode radiofrequency data each minute. Therefore, a single sequence of push and track, including data transfer, costs about 750 ms. This is a sufficient time to guarantee that the tissue goes back to its original state before starting the subsequent push-and-track sequence.
The main challenge with the current scheme is the time required for data acquisition: 14 minutes. Our use of radiofrequency averaging increases sonographic signal-to-noise ratio (SNR) and improves the quality of time-delay estimation using WNCC at the cost of increased acquisition time. Improved acquisition time can enable acquisition of wave speed at different vibration frequencies and IOPs to obtain dispersion curves and estimates shear viscosity of the cornea. Implementation of high-frequency ultrasound elastography using array-based transducers can alleviate this problem and translate toward in vivo measurement. Furthermore, electronic beam-formation offers superior image qualities (spatial resolution, sonographic SNR, depth-of-field) compared to those of single-element transducers. Still, radiation force-based quantitative elasticity imaging implementations are not yet available on commercial array-based high-frequency ultrasound imaging systems and is limited to research systems. Quantitative elastography using high-frequency ultrasound can be a working instrumentation in in vivo measurement of corneal biomechanical properties.
Spatially resolved wave speed measurement of the cornea can be used to derive spatially resolved distribution of shear modulus or Young’s modulus.27,36 In vivo measurement of Young’s modulus of the cornea can be directly useful in the assessment of keratoconus treatment. Young’s modulus can be an objective quantitative measure of corneal elasticity that is potentially useful for clinicians. Although we did not convert our wave speed measurement into Young’s modulus, subsequently, we will perform Young’s modulus estimation or shear modulus estimation by fitting of Lamb wave model.
Conclusion
We have demonstrated a high-resolution elastography system using high-frequency ultrasound for the characterization of strain-dependent corneal wave speed. Our measurement of corneal wave speed agrees with similar works using diagnostic ultrasound elastography, high-frequency ultrasound elastography, and OCE. A linear relationship between wave speed and IOP was observed. High-resolution ultrasound elastography of the cornea provides spatially resolved wave speed images that delineate depth-resolved distribution of wave speed in the cornea at different IOPs. Our results suggest that more contrast in the distribution of wave speed from anterior toward the posterior is observed at higher IOPs. This work demonstrates the potential of high-resolution ultrasound elastography for the characterization of corneal biomechanical properties.
Footnotes
Authors’ Note
The work presented in this paper was completed at the University of Rochester. Laurentius O. Osapoetra is currently with Sunnybrook Research Institute.
Declaration of Conflicting Interests
The author(s) declared no potential conflicts of interest with respect to the research, authorship, and/or publication of this article.
Funding
The author(s) disclosed receipt of the following financial support for the research, authorship, and/or publication of this article: This work was supported by internal funding from the Department of Physics at the University of Rochester.