
Abstract
The ultrasonic backscatter technique holds the promise of characterizing bone density and microstructure. This paper conducts ultrasonic backscatter parametric imaging based on measurements of apparent integrated backscatter (AIB), spectral centroid shift (SCS), frequency slope of apparent backscatter (FSAB), and frequency intercept of apparent backscatter (FIAB) for representing trabecular bone mass and microstructure. We scanned 33 bovine trabecular bone samples using a 7.5 MHz focused transducer in a 20 mm × 20 mm region of interest (ROI) with a step interval of 0.05 mm. Images based on the ultrasonic backscatter parameters (i.e., AIB, SCS, FSAB, and FIAB) were constructed to compare with photographic images of the specimens as well as two-dimensional (2D) μ-CT images from approximately the same depth and location of the specimen. Similar structures and trabecular alignments can be observed among these images. Statistical analyses demonstrated that the means and standard deviations of the ultrasonic backscatter parameters exhibited significant correlations with bone density (|R| = 0.45-0.78, p < 0.01) and bone microstructure (|R| = 0.44-0.87, p < 0.001). Some bovine trabecular bone microstructure parameters were independently associated with the ultrasonic backscatter parameters (ΔR2 = 4.18%-44.45%, p < 0.05) after adjustment for bone apparent density (BAD). The results show that ultrasonic backscatter parametric imaging can provide a direct view of the trabecular microstructure and can reflect information about the density and microstructure of trabecular bone.
Introduction
Osteoporosis is a disease that can lead to low bone mass and microstructural deterioration.1-3 As the elderly population increases, osteoporosis has become a major public health issue. More than 200 million people worldwide have suffered from this disease, and approximately 20% to 30% of women in America, Europe, and Asia are affected.4,5 Techniques to diagnose osteoporosis must be sensitive to changes in bone density and microstructure. Currently, dual energy X-ray absorptiometry (DXA), which measures bone mineral density (BMD), is the most widely used diagnostic method for osteoporosis. 6 However, this technique involves ionizing radiation and cannot reflect bone mechanical properties or microstructure.
Quantitative ultrasound is a rapidly growing, noninvasive method for assessing bone quality. This technique is advantageous because it is low cost, free of ionizing radiation exposure, simple, and portable. Ultrasound is a mechanical wave, which could be more sensitive to changes in bone mechanical properties and bone microstructure.7,8 The ability of ultrasound to characterize bone tissue is based on the fact that ultrasonic waves could be affected by trabecular bone microstructure, composition, and density as they propagate through bone tissues.
Most clinical ultrasonic devices use the ultrasonic through-transmission method to diagnose osteoporosis by calculating the broadband ultrasound attenuation (BUA) and speed of sound (SOS). 9 Guided wave techniques have also been used to diagnose osteoporosis by measuring elasticity and thickness of the long cortical bone.10,11 Currently, researchers are more interested in investigating the potential of ultrasonic backscatter for osteoporosis diagnosis. 12 In contrast to the conventional through-transmission method, the ultrasonic backscatter method works in pulse-echo mode. It uses a single transducer to act as both the transmitter and receiver for the ultrasonic signals. Therefore, ultrasonic backscatter may enable direct analysis of some common fracture sites other than the calcaneus, such as the hip, spine, and wrist.13,14
Trabecular bone is a porous structure that contains many rod-like or plate-like trabeculae. The scattering interaction of ultrasound with trabeculae depends on several factors including the acoustic impedance of the trabeculae and surrounding medium, the size of the trabeculae relative to the wavelength, and the geometry and orientation of the trabeculae relative to the direction of wave propagation. According to the review article by Wear, backscatter is known to provide information regarding bone mineral density (BMD), number density, and elastic properties of scatterers, and the dependence of backscatter on these properties has been widely investigated. 12 The frequency averaged broadband ultrasonic backscatter (BUB) showed a correlation (R2 = 0.66) with BMD in vitro (human calcaneus). 15 In addition, ultrasonic backscatter contained information regarding the size and shape of scatterers.16-19 In contrast, experimental results suggested that higher frequency waves might carry more information about the bone density, mechanical properties, and trabecular microstructure.20,21 Hakulinen et al. reported that ultrasonic backscatter parameters (BUB and integrated reflection coefficient [IRC]) showed statistically significant linear correlations with the mechanical parameter (bone ultimate strength) and structural parameters (trabecular thickness [Tb.Th] and trabecular separation [Tb.Sp]) at frequencies up to 5 MHz for human trabecular bone. 20 High-frequency ultrasound could offer more information, which may help to predict the microstructures, mechanical properties, and density of bone.
Ultrasonic parametric imaging is used to construct two-dimensional (2D) images by mapping parametric values to pixel values for all scanning positions. In addition to providing information on bone quantity, parametric images are helpful for bone evaluation because trabecular bone has strong structural and mechanical heterogeneity and anisotropy, and ultrasonic parameters at a single position cannot represent the quality of the whole bone.22,23 In the first investigation of parametric imaging of trabecular bone, Laugier and collaborators constructed images of BUA and SOS by using the through-transmission method.24-29 Later, Raum et al. used a scanning acoustic microscopy technique to image the acoustic impedance and elastic maps of cortical bone.30-33 Riekkinen et al. used AIB to construct an ultrasonic backscatter parametric image for bone assessment. 34 In Riekkinen’s work, they used a 2.25 MHz transducer with a focus beam width of 1.4 mm to scan the bone. Karjalainen et al. conducted tests over a broad range of frequencies (1-5 MHz) to investigate the ability of quantitative ultrasonic backscatter parametric imaging to characterize trabecular bone. 35 However, the quantitative ultrasonic parametric images reported in the previous studies are not clear enough to distinguish trabeculae. The lateral resolution of the focused transducer used in these previous studies limited the clarity of the image.
In this work, we used a 7.5 MHz focused transducer with a lateral resolution of 0.279 mm to acquire more detailed microstructural information of the bovine trabecular bone specimen. The goals of this study are (a) to construct ultrasonic backscatter parametric images with a high lateral resolution transducer to represent bone microstructural information, (b) to study the correlations between ultrasonic backscatter parameters (AIB, SCS, FSAB, and FIAB) and bone density and microstructural parameters at high frequencies (5.62-8.62 MHz), and (c) to investigate the signal of interest (SOI) selection effect on the relationship between ultrasonic backscatter parameters with bone density and microstructural parameters.
Materials and Methods
Sample Preparation
A total of 33 trabecular bone samples was included in this study. The trabecular bone samples were acquired from the proximal end of fresh bovine femora. The fresh bovine femora were brought from a local market in Shanghai, China. The bovine femora were stored in a refrigerator under the temperature of –20°C during the specimen preparation steps. A band saw was used to separate the cortical bone from the trabecular bone. We carefully cut the trabecular bone samples along the main stress orientation of the trabecular network. The cuboid trabecular bone samples had dimensions of 2.0 cm × 2.0 cm × 1.5 cm. We flushed out the bone marrow inside of the trabecular bone samples using a high-pressure water jet. The bovine trabecular bone samples were stored in the phosphate buffered saline (PBS) solution at room temperature prior to ultrasonic and µ-CT measurements. 36
Density and Microstructure Measurements
A µ-CT scanner (Skyscan 1076, Skyscan, Antwerp, Belgium) was used to measure the bone density and microstructural parameters. A certified technician with five years of working experience operated the µ-CT scanner. We scanned the trabecular bone samples under a spatial resolution of 18 μm. The trabecular bone samples were reconstructed using reconstruction software (NRecon, Skyscan). From the reconstructed data, the bone density and microstructural parameters were calculated from the whole three-dimensional (3D) µ-CT images of the bone specimen using CT analysis software (CTan, Skysan).
The bone apparent density (BAD) is an important parameter of trabecular bone quantity. The value of BAD was calculated by dividing the dry mass of each sample by its apparent volume. An electronic scale with a resolution of 0.01 g was used to measure the dry mass of the sample. We calculated the apparent volume by measuring the length, width, and height of the cuboid specimens using a caliper with a resolution of 0.01 mm.
Ultrasonic Backscatter Measurements
Figure 1 shows a block diagram of the ultrasonic backscatter measurement system. We used an ultrasonic immersion system (UPK-T10, UltraPACTM, MISTRAS Group Inc. Princeton, New Jersey, USA) to acquire the ultrasonic backscatter signal. The signal digitization rate of the system is 100 MHz. An ultrasonic probe (V321, Panametrics, S. Burlington, Vermont) was excited to transmit short-duration ultrasonic waves. We placed the main arrangement direction of the trabecular bone perpendicular to the propagation of the ultrasonic wave at the focal zone of the transducer. The focal point was positioned at the front surface of the specimen. The same transducer received the backscattered ultrasonic signals. An X/Y/Z-axis stepper motor controller (UPK-T10, UltraPACTM) controlled the transducer to move parallel to the trabecular bone sample surface. The scanning ROI was 20 mm × 20 mm (400 × 400 points) in the center of each trabecular bone sample, and the scanning interval was 0.05 mm. We analyzed the backscattered signals in the central region (10 mm × 10 mm) of the image. The backscattered signals were stored in a computer for further offline analysis. We acquired a reference signal from a polished steel plate positioned at the focal point of the same transducer.
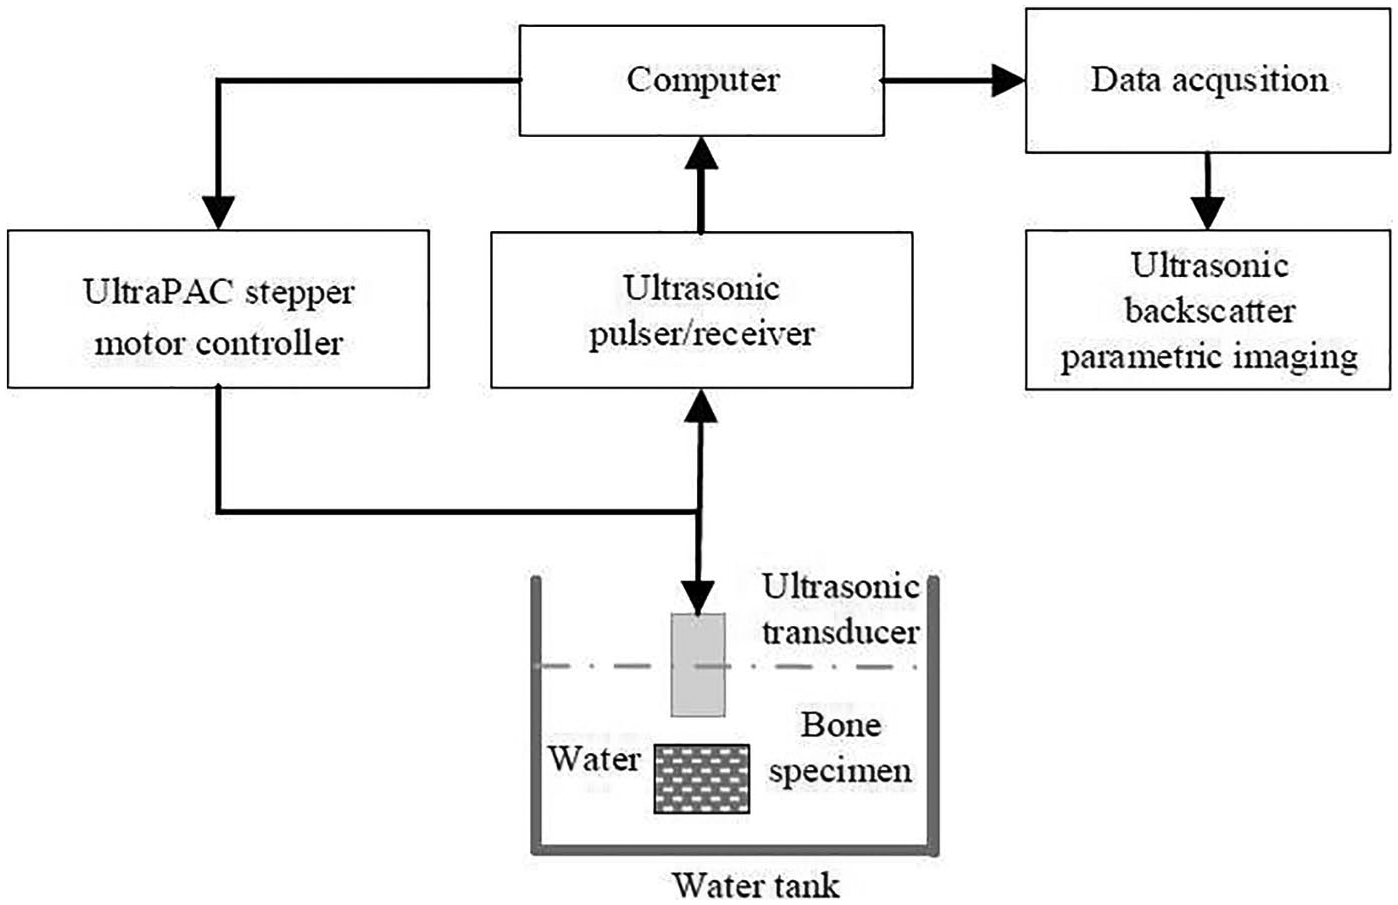
A block diagram of the experimental setup.
The lateral resolution is the –6 dB beam width at the focus. The –6 dB beam diameters at focus were calculated from the information obtained from the manufacturer data sheets of Panametrics Inc. 37 The –6 dB beam width can be calculated using the following equation:

Signal Analysis
Figure 2(a) shows the ultrasonic backscattered signals from a trabecular bone. We applied a rectangular window on the ultrasonic backscattered signal to select the SOI for analysis. T was the start time of the SOI (time delay relative to the start of the backscattered signal), and W was the time width of the SOI. We analyzed different SOIs by varying the T and W to explore the SOI selection effects on the bone characterization results. In this study, T varied from 0 µs to 3 µs with an interval of 0.1 µs. W varied from 0.1 µs to 4 µs with an interval of 0.1 µs.
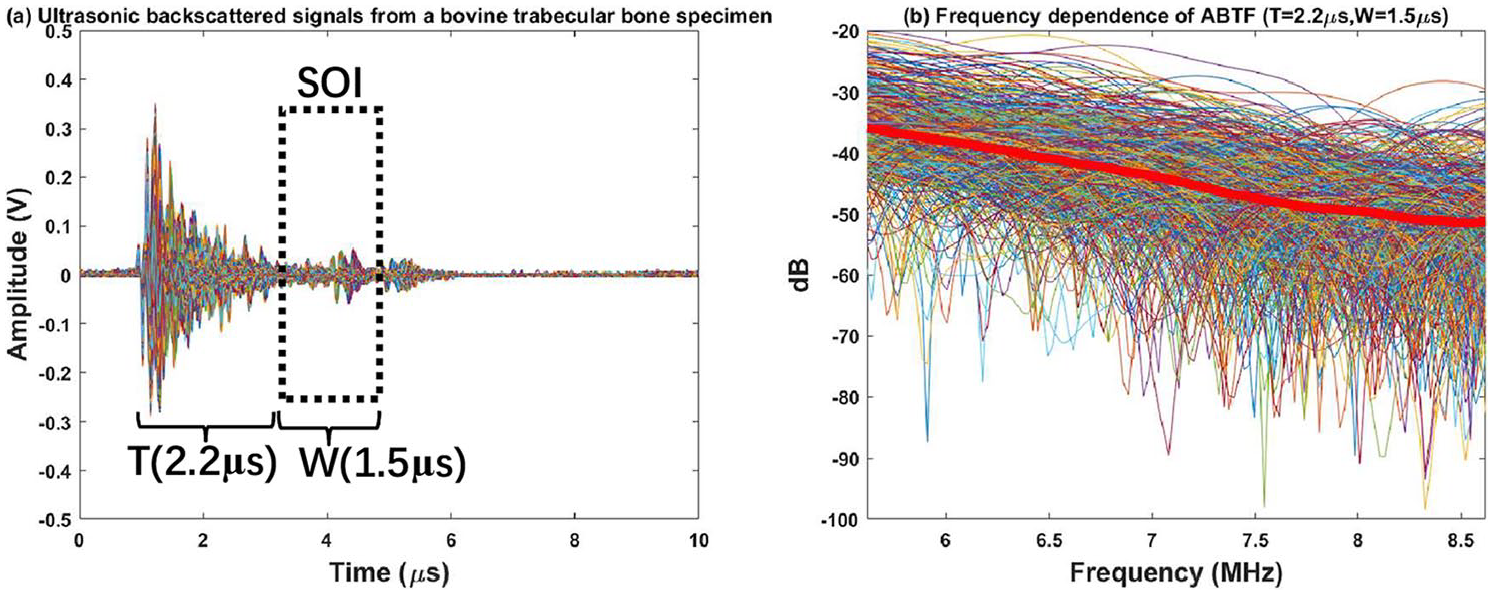
(a) Ultrasonic backscattered signals from a bovine trabecular bone specimen, (b) the frequency dependence of ABTF. We calculated four ultrasonic backscatter parameters: apparent integrated backscatter (AIB), spectral centroid shift (SCS), frequency slope of apparent backscatter (FSAB), and frequency intercept of apparent backscatter (FIAB). ABTF = apparent backscatter transfer function.
The apparent backscatter transfer function (ABTF) is a function of frequency, and it is defined as follows: 38
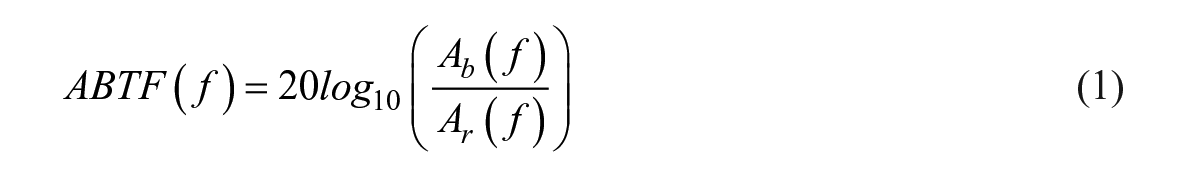
where
The AIB was the integrated value of ABTF in the –6 dB frequency bandwidth: 7
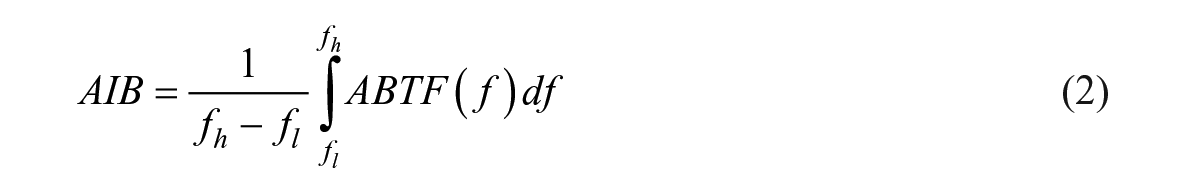
where
The backscatter parameters considered in this study are conventionally measured on an SOI (T > 1 µs) that avoids the front surface echo from the specimen. When the front surface echo from the specimen is included in the SOI (T ≤ 1 µs), the backscatter parameter is usually called the integrated reflection coefficient (IRC).20,40 Note that the calculation of AIB and IRC is the same. The only difference is the SOI selection.
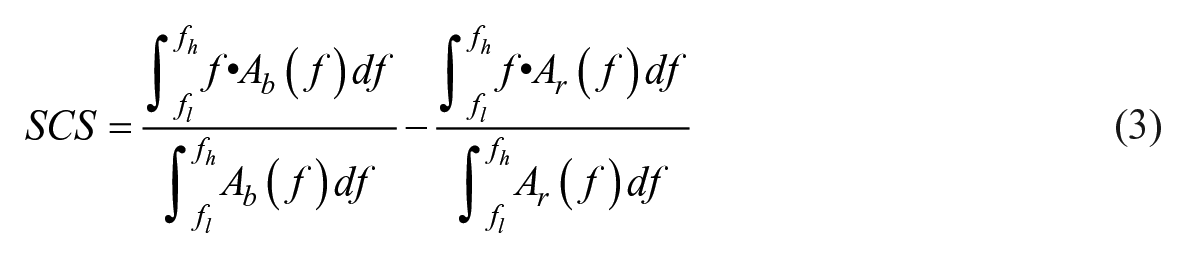
The SCS was defined as a downshift of the centroid frequency between
The FSAB was determined by the slope of the linear regression on the ABTF in the –6 dB frequency bandwidth. 21 Similarly, the FIAB was determined by the zero-frequency intercept of the linear regression on the ABTF in the –6 dB frequency bandwidth. 39
Statistical Analysis
We examined the descriptive statistics of the µ-CT and ultrasonic measurement results. We used the Kolmogorov-Smirnov test (KS test) to check the normality of all the measurement parameters. The KS test showed that ultrasonic and µ-CT measurement parameters follow a normal distribution. The mean, standard deviation (SD), minimum (Min), and maximum (Max) values of the bone characteristic and ultrasonic backscatter parameters were calculated. To investigate the correlations between the ultrasonic backscatter parameters and bone density and microstructure, we used simple linear regression analysis to calculate the Pearson correlation coefficients and p values. Multivariate analysis was performed using the stepwise method. A two-tailed t test was used to test the statistical significance of the correlation coefficients. MATLAB 2018b (MathWorks, Natick, Massachusetts) was used for the statistical analysis.
Results
Comparison with Photograph and µ-CT Image Slice
Figure 3(a) shows a photograph of the bovine trabecular bone specimen. Figure 3(b) is the 2D µ-CT image slice for the surface of a bovine trabecular bone specimen, which is the same specimen as shown in Figure 3(a). Similar structures and trabecular alignments can be observed between Figure 3(a) and 3(b). Figure 3(c) is the 2D µ-CT image slice for 2 mm under the surface of the bovine trabecular bone specimen.
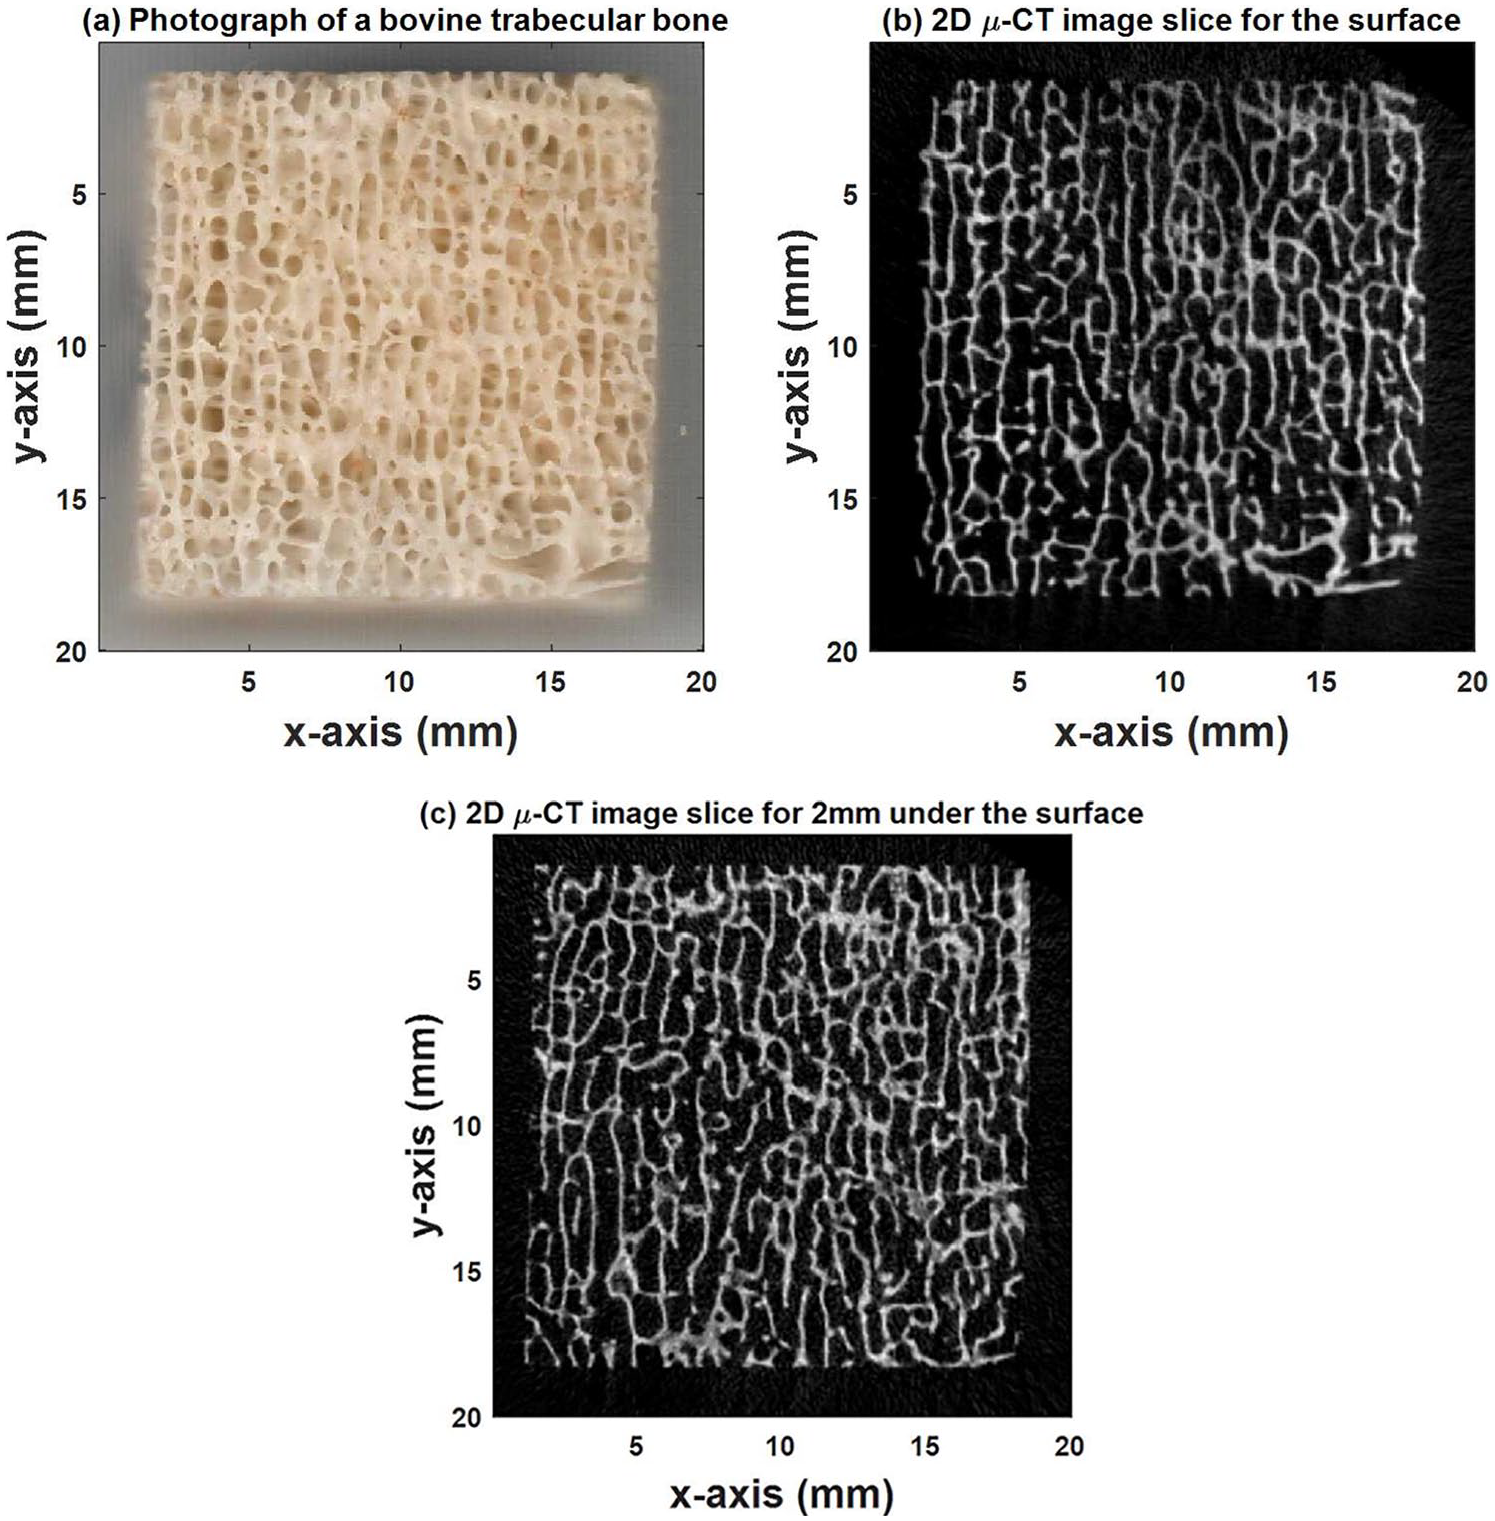
(a) Photograph of a bovine trabecular bone specimen, (b) 2D µ-CT image slice for the surface of the same specimen, and (c) 2D µ-CT image slice for 2 mm under the surface of the same specimen. 2D = two dimensional.
The AIB, SCS, FSAB, and FIAB values at each scanning site were calculated and mapped to the corresponding pixels, which enabled the construction of the ultrasonic backscatter parametric images. Figure 4 shows (a) AIB image, (b) SCS image, (c) FSAB image, and (d) FIAB image from the same surface of the bovine trabecular bone specimen as shown in Figure 3(a). The ultrasonic backscatter parameters were calculated in the same ROI (20 mm × 20 mm) and SOI (T = 0 µs and W = 1.5 µs) in Figure 4. The bar on the right side of each image shows the corresponding parameter values for the different colors in the image.
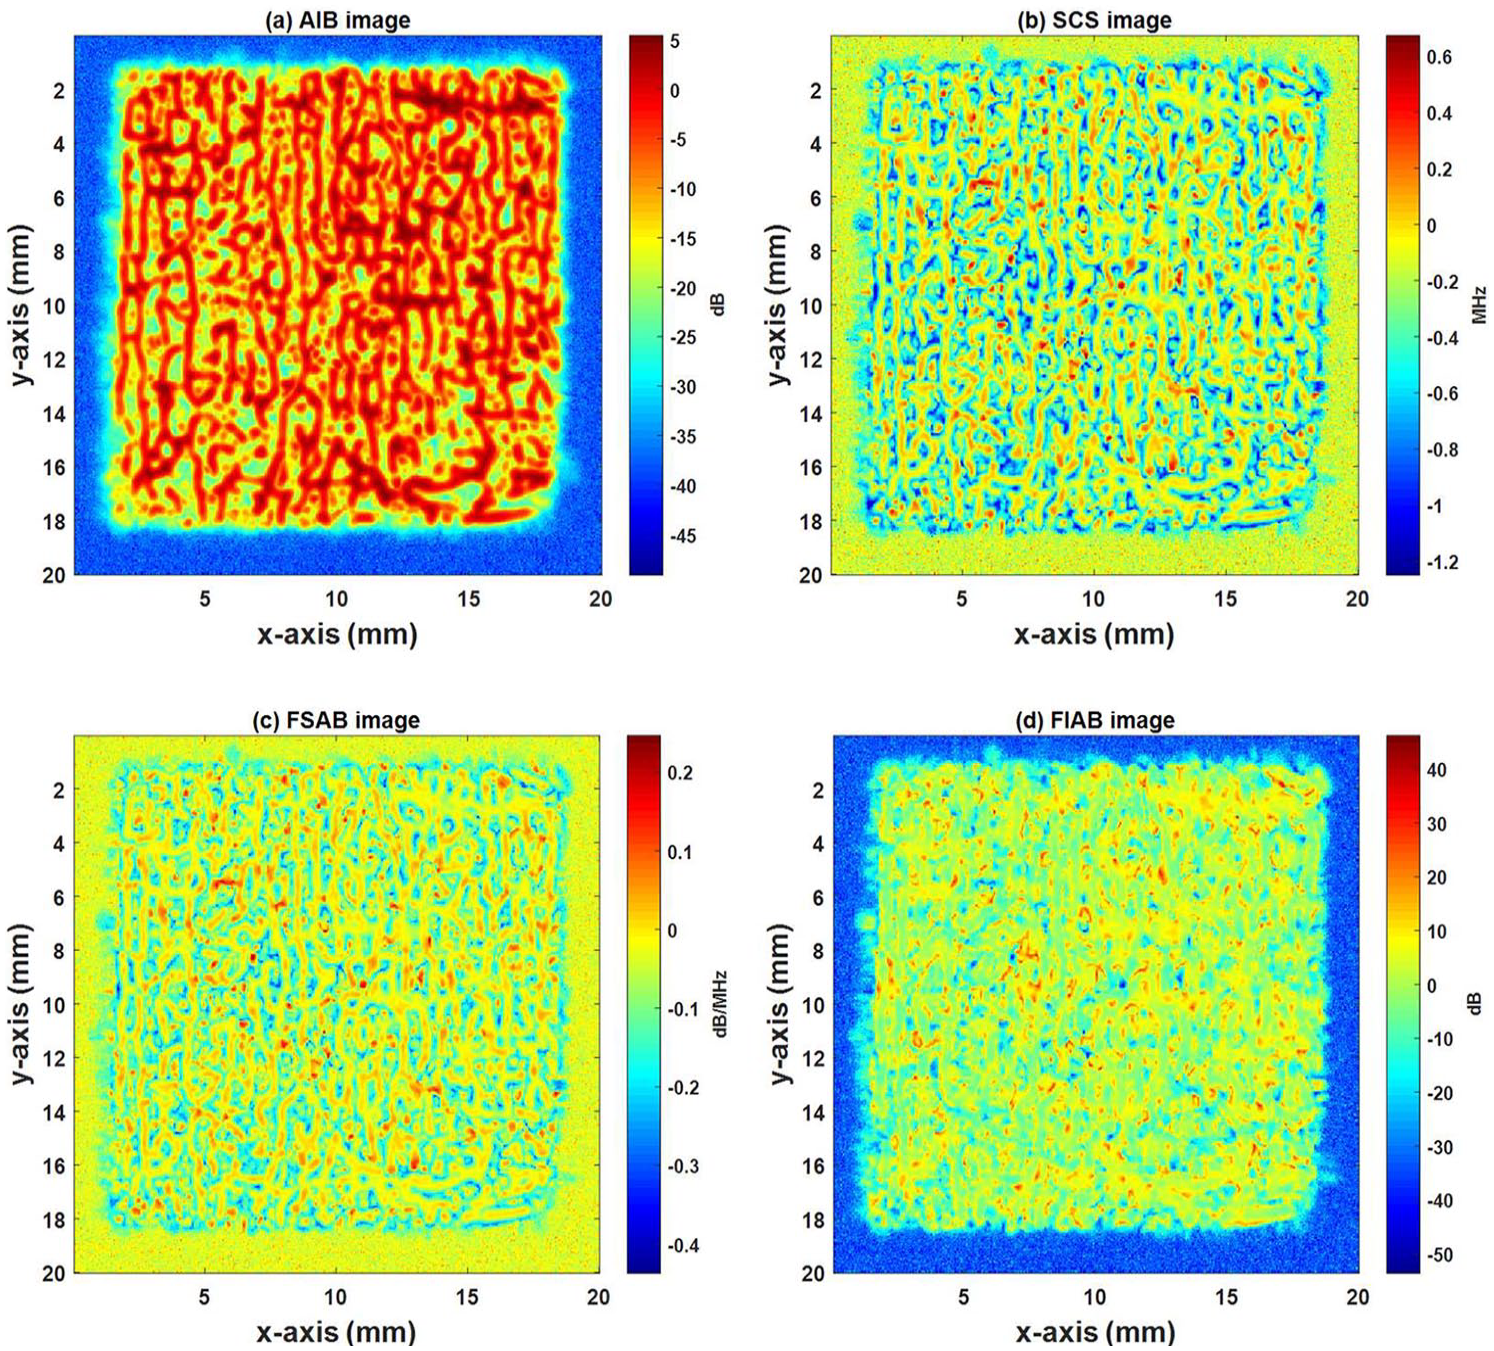
Bovine trabecular bone parametric images using the ultrasonic backscatter parameters of (a) AIB, (b) SCS, (c) FSAB, and (d) FIAB from the same depth and location of Figure 3(b). AIB = apparent integrated backscatter; SCS = spectral centroid shift; FSAB = frequency slope of apparent backscatter; FIAB = frequency intercept of apparent backscatter.
Comparing the ultrasonic backscatter parametric images (Figure 4) with the photograph (Figure 3a) and 2D µ-CT image (Figure 3b), similar structures and trabecular alignments can be observed. In Figure 4, red or yellow pixels indicate large parameter values, which correspond to the positions of strong scatterers such as thick and/or dense trabeculae. In contrast, blue and green pixels in Figure 4 indicate small parameter values, which correspond to the positions of weak scatterers or water. The values and connections of the red and yellow pixels can provide visual information related to the bovine trabecular bone microstructure.
Figure 5 shows (a) AIB image, (b) SCS image, (c) FSAB image, and (d) FIAB image from 2 mm under the same surface of the bovine trabecular bone specimen as shown in Figure 3(a). The ultrasonic backscatter parameters were calculated in the same ROI (20 mm × 20 mm) and SOI (T = 2.2 µs and W = 1.5 µs) in Figure 5.
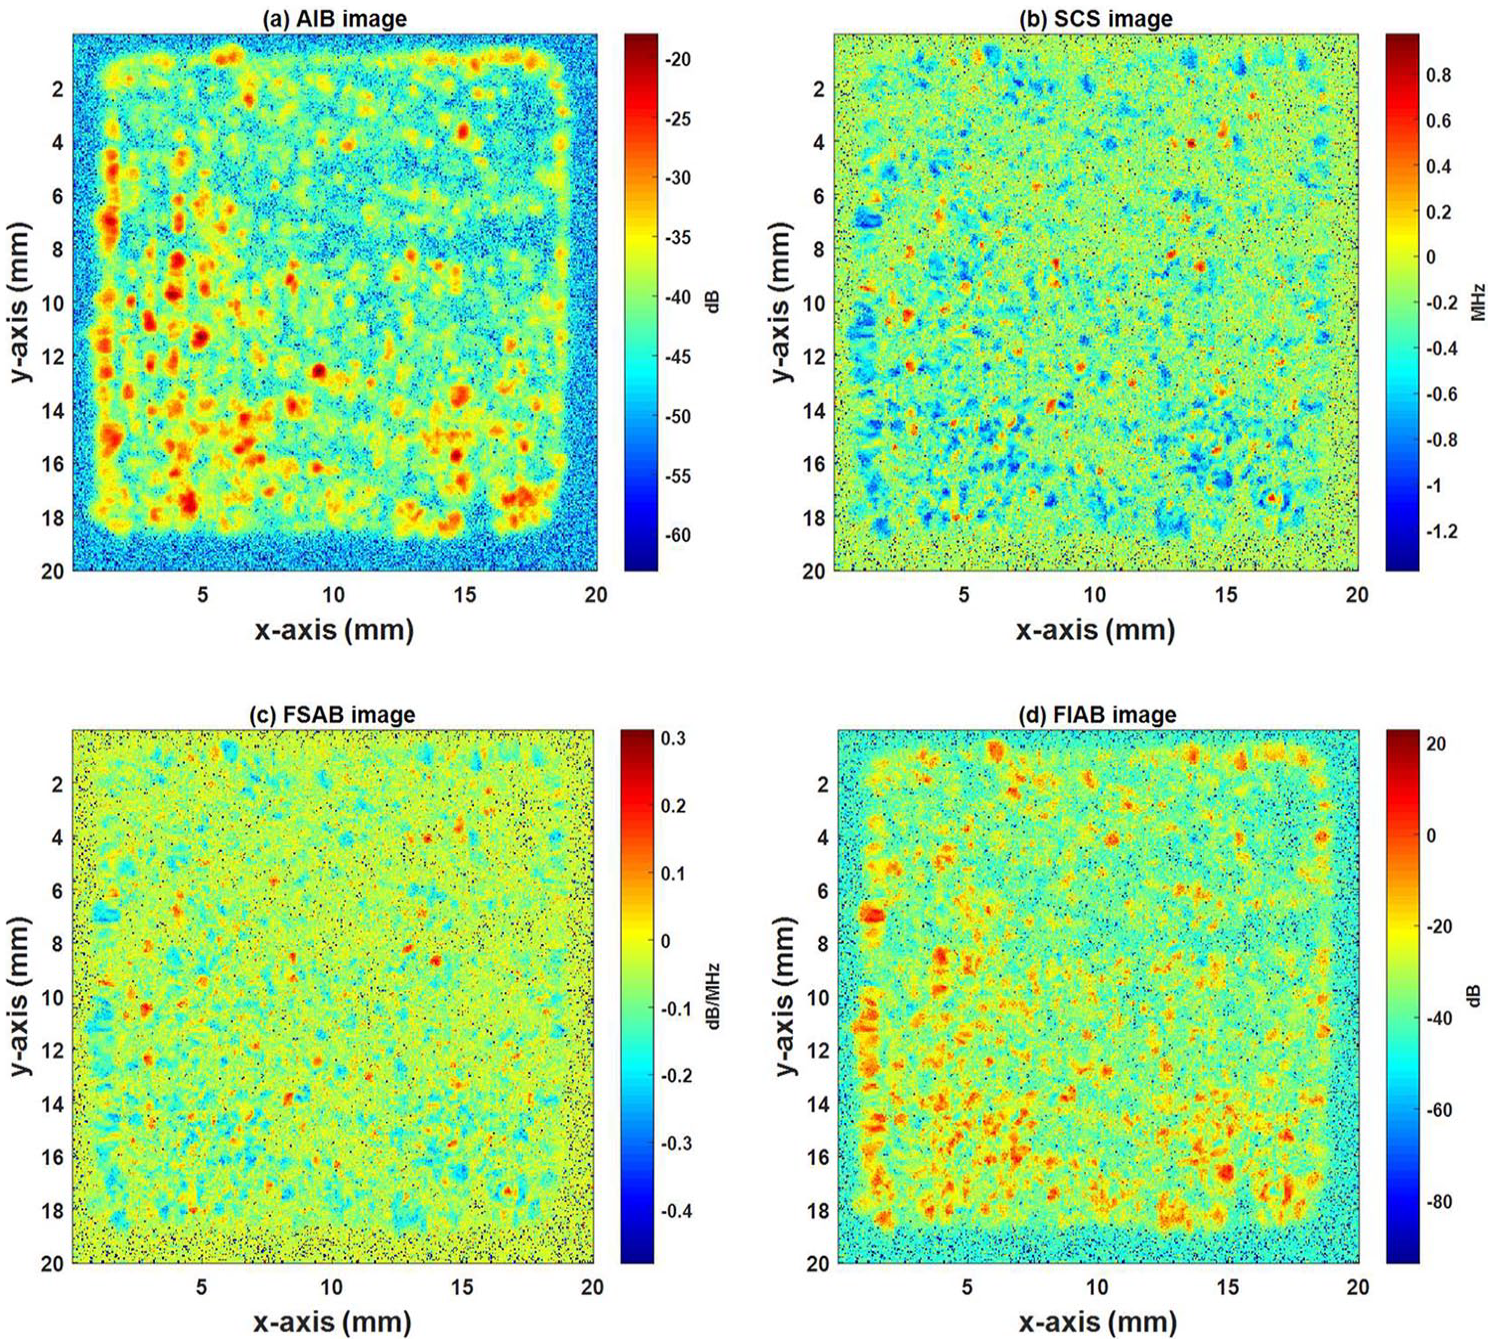
Bovine trabecular bone parametric images using the ultrasonic backscatter parameters of (a) AIB, (b) SCS, (c) FSAB, and (d) FIAB from the same depth and location of Figure 3(c). AIB = apparent integrated backscatter; SCS = spectral centroid shift; FSAB = frequency slope of apparent backscatter; FIAB = frequency intercept of apparent backscatter.
Suppose that ultrasound velocity of bone is 2900 m/s, 42 and the velocity of water is 1480 m/s. 18 The average velocity of the specimen can be calculated by the following equation:

The average velocity of trabecular bone specimen is estimated to be approximately 1842 m/s, with a mean bone volume over total volume (BV/TV) of 25.51% in this study. The SOI is selected with excluded time volume T = 2.2 µs, which means the depth relative to the specimen surface is approximately 2 mm (
Due to the effect of defocus, the beam width varies along the beam axis, and the beam width will be greater at locations below the surface. The clarity of the parametric image is also influenced by attenuation and multiple scattering. The structures and trabecular alignments of the images shown in Figure 5 cannot be clearly seen compared with Figure 3(c), which is the same location of the specimen.
Simple and Multivariate Analysis Results
Table 1 lists the descriptive statistics of the bone characteristic parameter values within the whole 3D volume for all 33 bovine bone samples. Typical ranges for human trabecular bone from the literature are also listed in Table 1 for the reader to compare the difference of the bovine and human trabecular bone.8,43,44
Descriptive Statistics of the Bovine Trabecular Bone Characteristic Parameters.
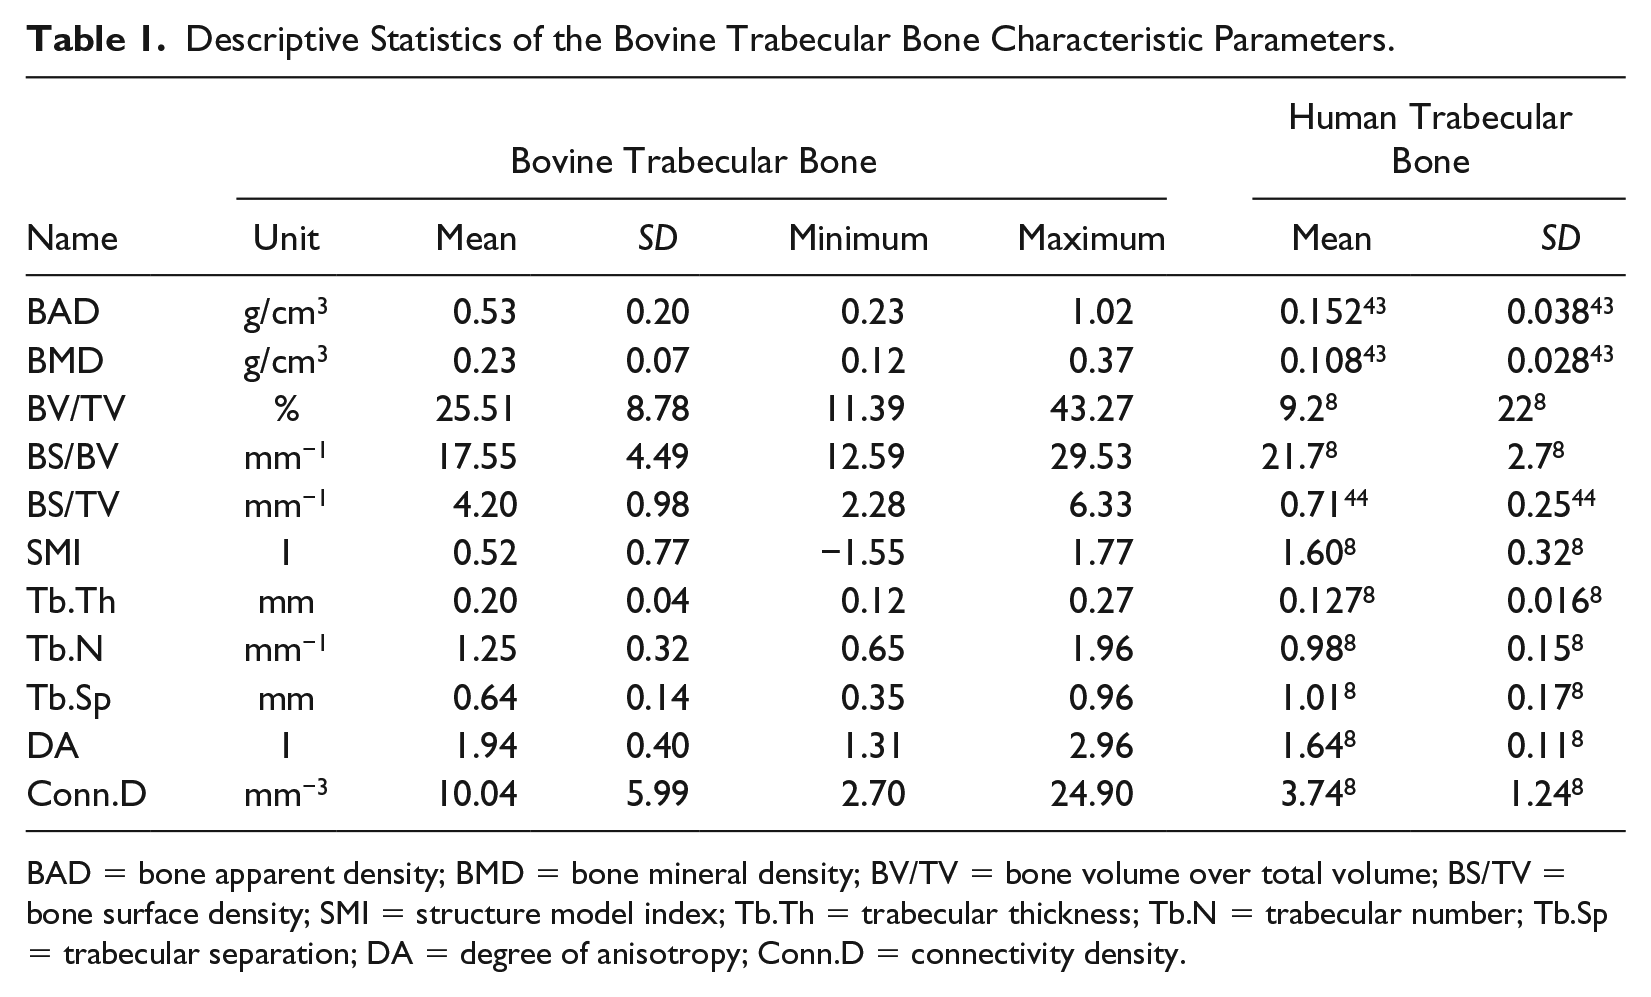
BAD = bone apparent density; BMD = bone mineral density; BV/TV = bone volume over total volume; BS/TV = bone surface density; SMI = structure model index; Tb.Th = trabecular thickness; Tb.N = trabecular number; Tb.Sp = trabecular separation; DA = degree of anisotropy; Conn.D = connectivity density.
Table 2 shows the Pearson correlation coefficients between bone characteristic parameters. Many of the microstructural characteristics are covariant with density-based parameters.
Correlations between Bovine Trabecular Bone Characteristic Parameters.
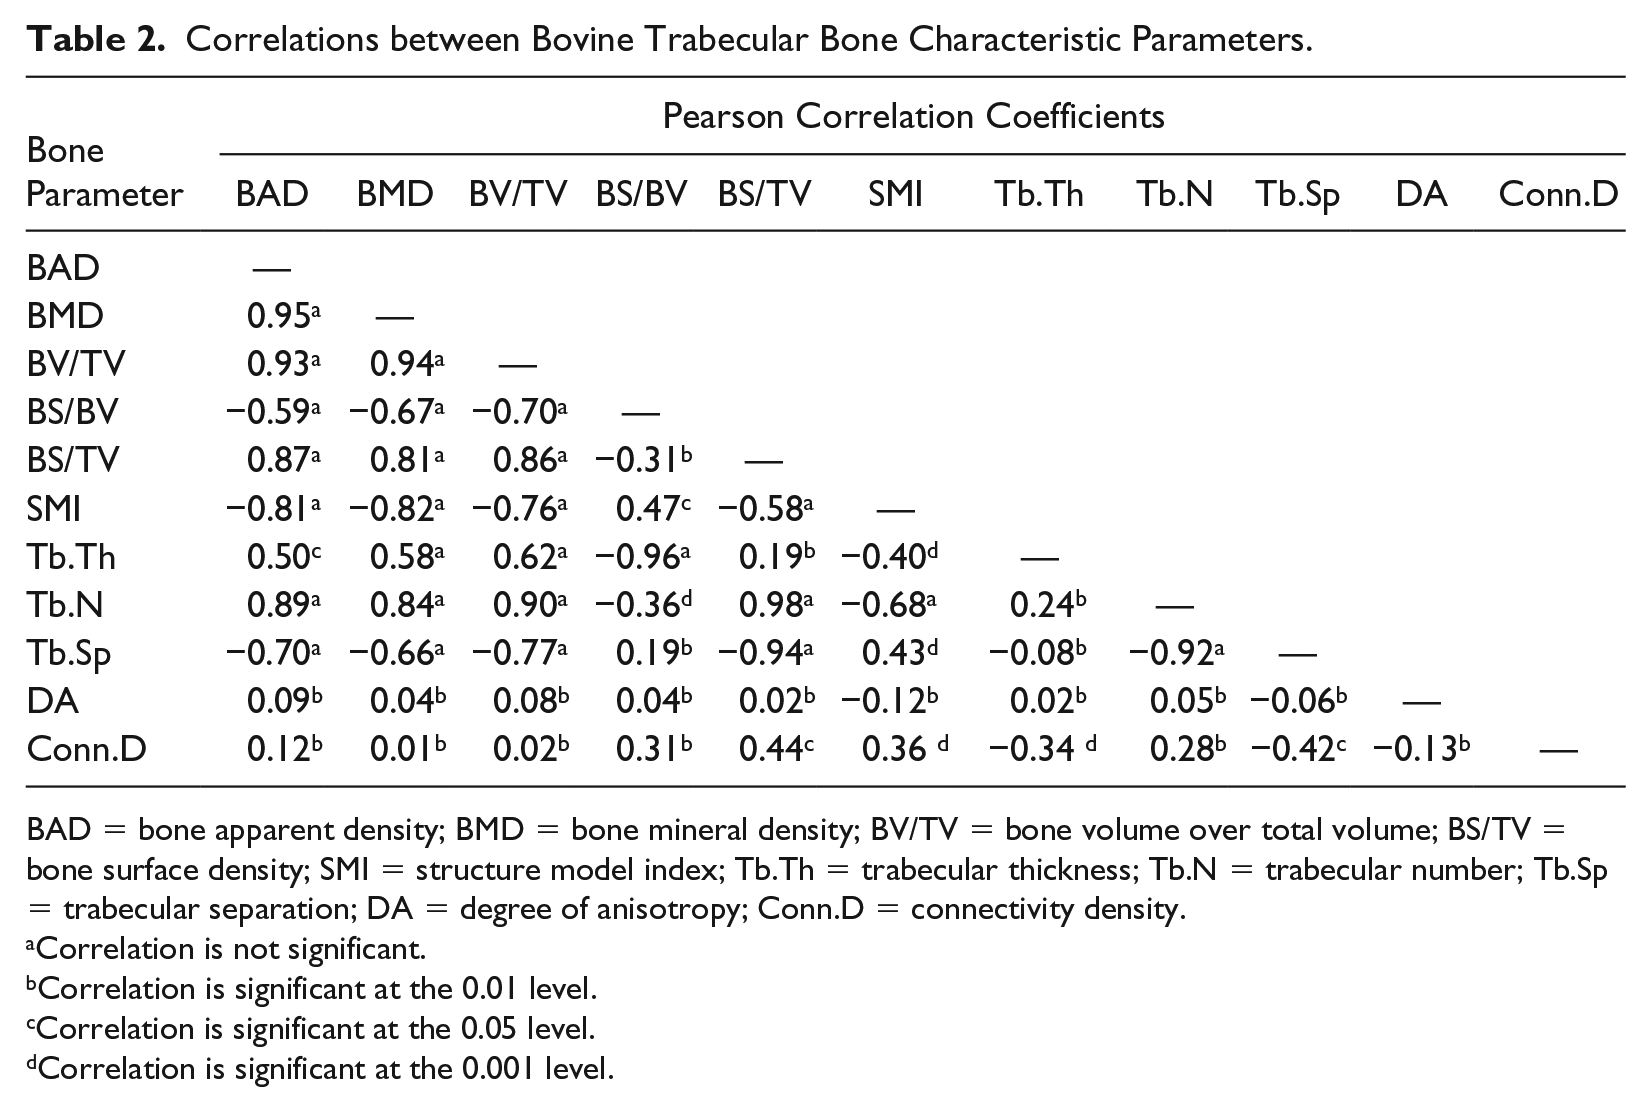
BAD = bone apparent density; BMD = bone mineral density; BV/TV = bone volume over total volume; BS/TV = bone surface density; SMI = structure model index; Tb.Th = trabecular thickness; Tb.N = trabecular number; Tb.Sp = trabecular separation; DA = degree of anisotropy; Conn.D = connectivity density.
Correlation is not significant.
Correlation is significant at the 0.01 level.
Correlation is significant at the 0.05 level.
Correlation is significant at the 0.001 level.
Table 3 lists the descriptive statistics of the ultrasonic backscatter parameter values within the ROI for all 33 bone samples. The ultrasonic backscatter parameters listed in Table 3 are calculated in the SOI of T = 2.2 µs and W = 1.5 µs. To investigate the ability of ultrasonic backscatter parametric imaging to represent bone density and microstructure information, the correlations between the mean and SD of ultrasonic backscatter parameters and bone parameters are calculated.
Descriptive Statistics of the Ultrasonic Backscatter Parameters.
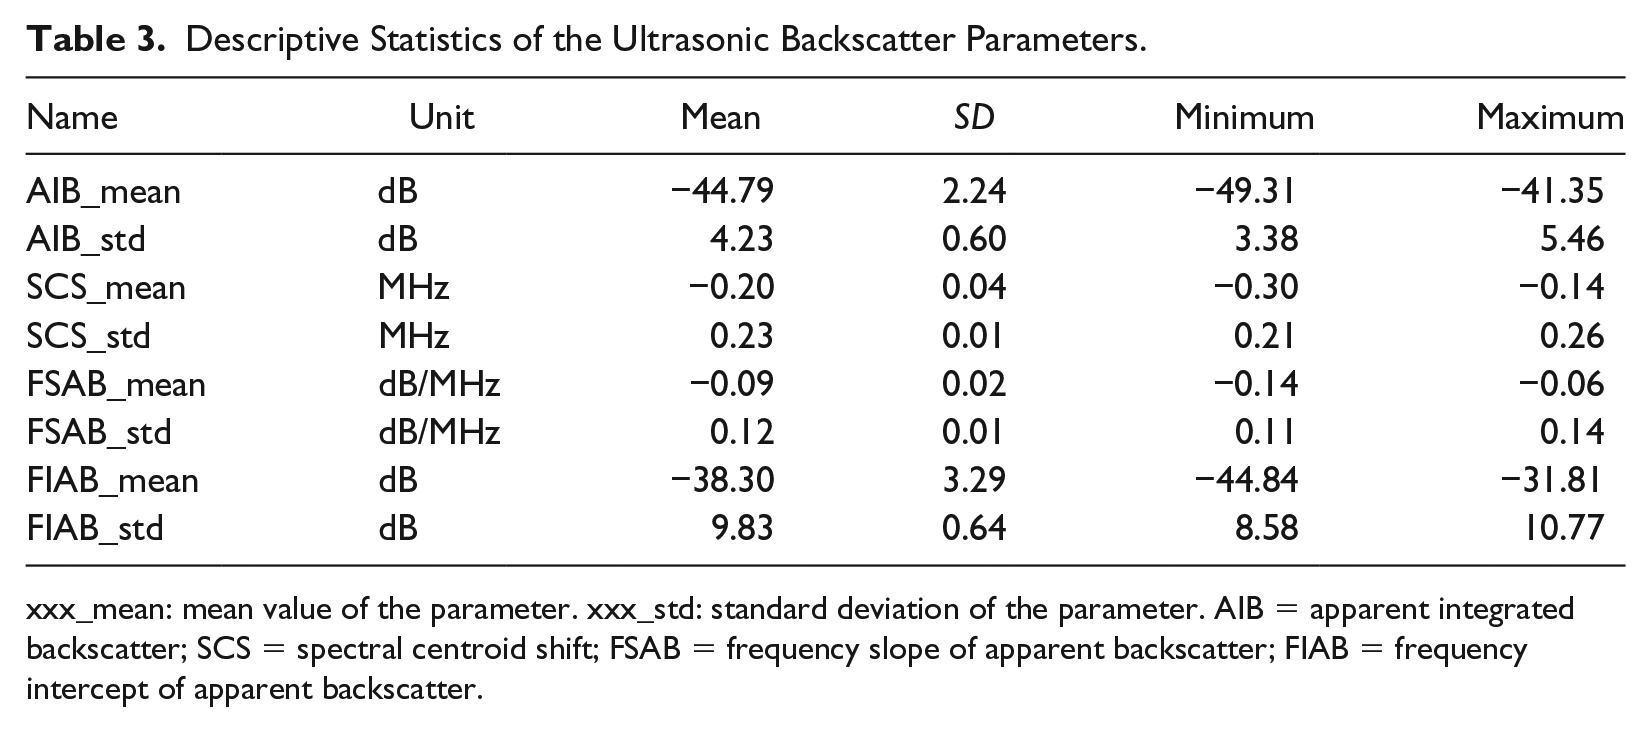
xxx_mean: mean value of the parameter. xxx_std: standard deviation of the parameter. AIB = apparent integrated backscatter; SCS = spectral centroid shift; FSAB = frequency slope of apparent backscatter; FIAB = frequency intercept of apparent backscatter.
Table 4 shows correlations between the ultrasonic backscatter parameters and bone characteristic parameters. The mean values of AIB and FIAB increased with Tb.Sp (R = 0.68-0.75, p < 0.001) and decreased with bone density (R = −0.78 - –0.70, p < 0.001). The mean values of SCS and FSAB decreased with Tb.Sp (R = −0.44, p < 0.01) and increased with bone density (R = 0.58-0.66, p < 0.001). Significant correlations were observed among the SD’s of AIB, SCS, FSAB, and FIAB with bone density (R = −0.78 - –0.45, p < 0.01) and Tb.Sp (R = 0.81-0.87, p < 0.001). We found nonsignificant correlations between degree of anisotropy (DA) and all the ultrasonic backscatter parameters.
Correlations between the Ultrasonic Backscatter Parameters and Bone Characteristic Parameters.
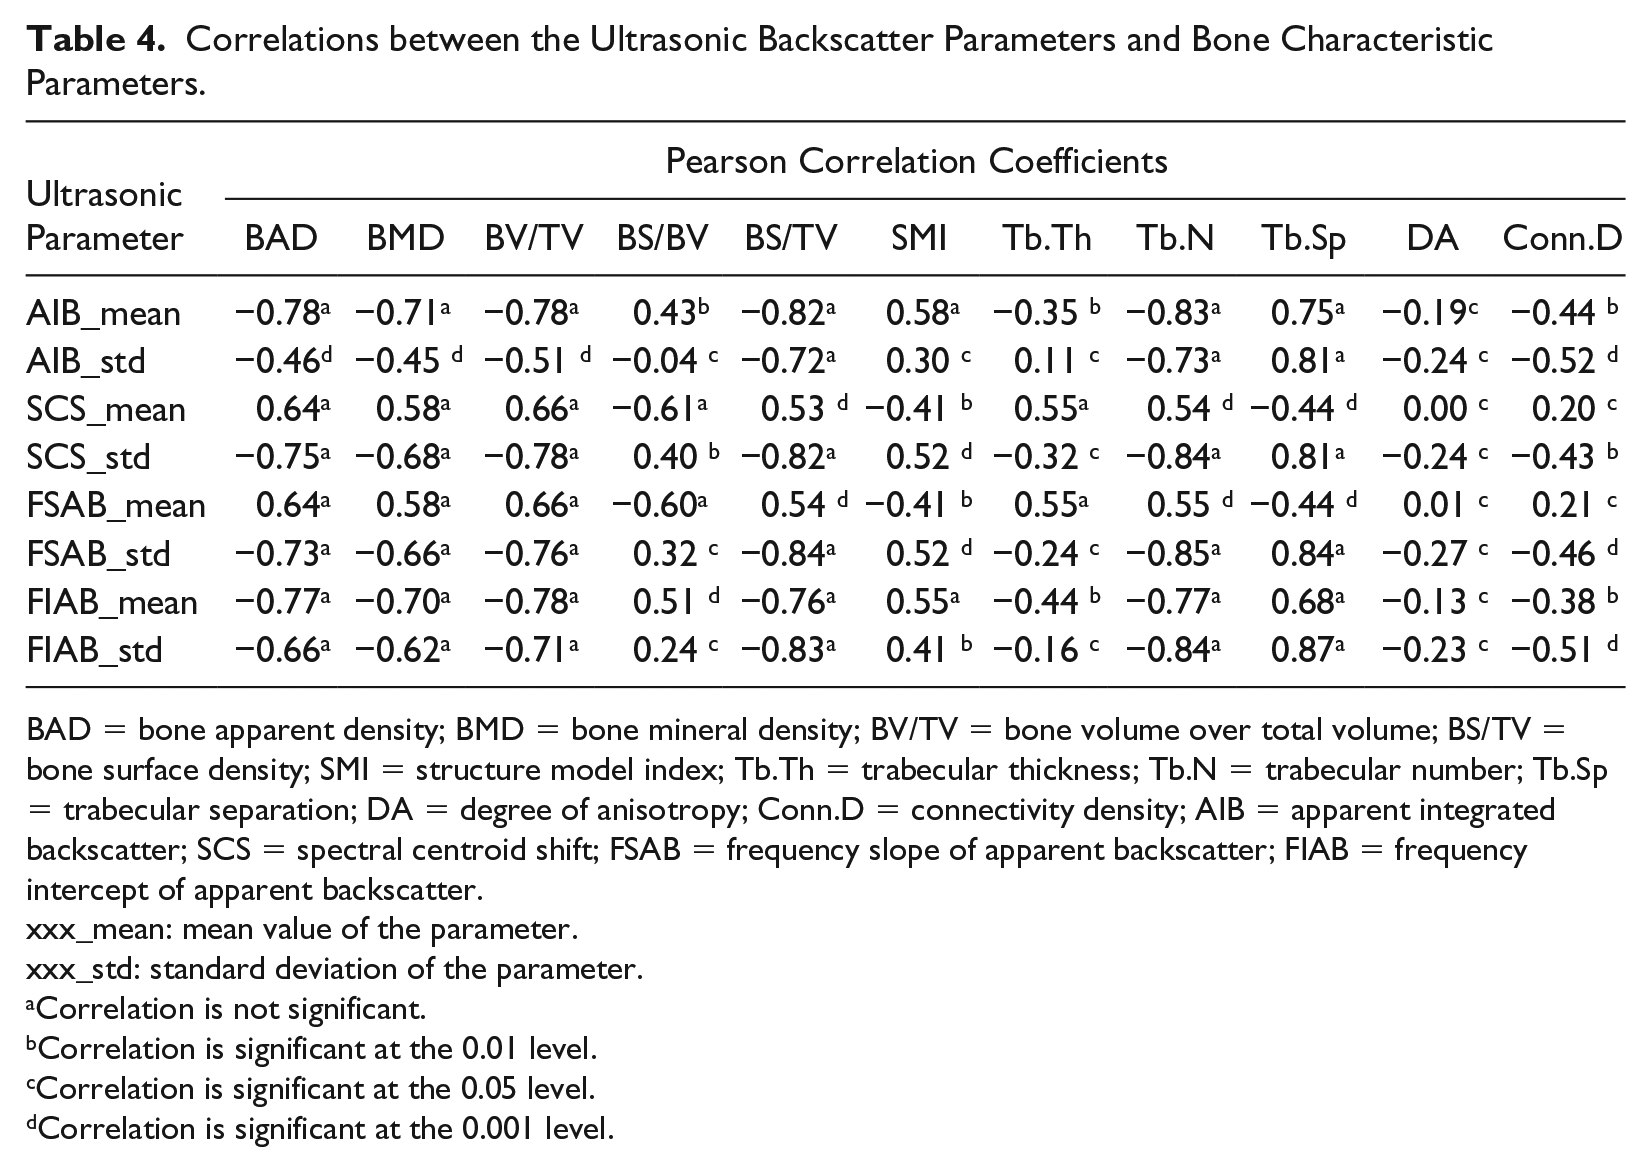
BAD = bone apparent density; BMD = bone mineral density; BV/TV = bone volume over total volume; BS/TV = bone surface density; SMI = structure model index; Tb.Th = trabecular thickness; Tb.N = trabecular number; Tb.Sp = trabecular separation; DA = degree of anisotropy; Conn.D = connectivity density; AIB = apparent integrated backscatter; SCS = spectral centroid shift; FSAB = frequency slope of apparent backscatter; FIAB = frequency intercept of apparent backscatter.
xxx_mean: mean value of the parameter.
xxx_std: standard deviation of the parameter.
Correlation is not significant.
Correlation is significant at the 0.01 level.
Correlation is significant at the 0.05 level.
Correlation is significant at the 0.001 level.
Table 5 shows the increases of the adjusted squared correlation coefficient between ultrasonic backscatter parameters and bone density and microstructure parameters after adjustment for the influence of BAD as a covariable. After adjustment for BAD, some bone density and microstructure parameters still contributed significantly to the mean and SD values of ultrasonic backscatter parameters. Some trabecular bone microstructure parameters (BS/TV, structure model index [SMI], trabecular number [Tb.N], and Tb.Sp) were independently associated with the mean values of the parameters (AIB, SCS, FSAB, and FIAB) after adjustment for BAD, but the increase in explained variability was relatively small (ΔR2 = 4.22%-9.96%, p < 0.05). After adjustment for BAD, significantly independent associations were found between the SD’s of the ultrasonic backscatter parameters and bone density and microstructure parameters, with an increase in R2 of 4.18% to 44.45%.
Increase in Adjusted Squared Correlation Coefficient Compared with the Correlation Using BAD Alone.
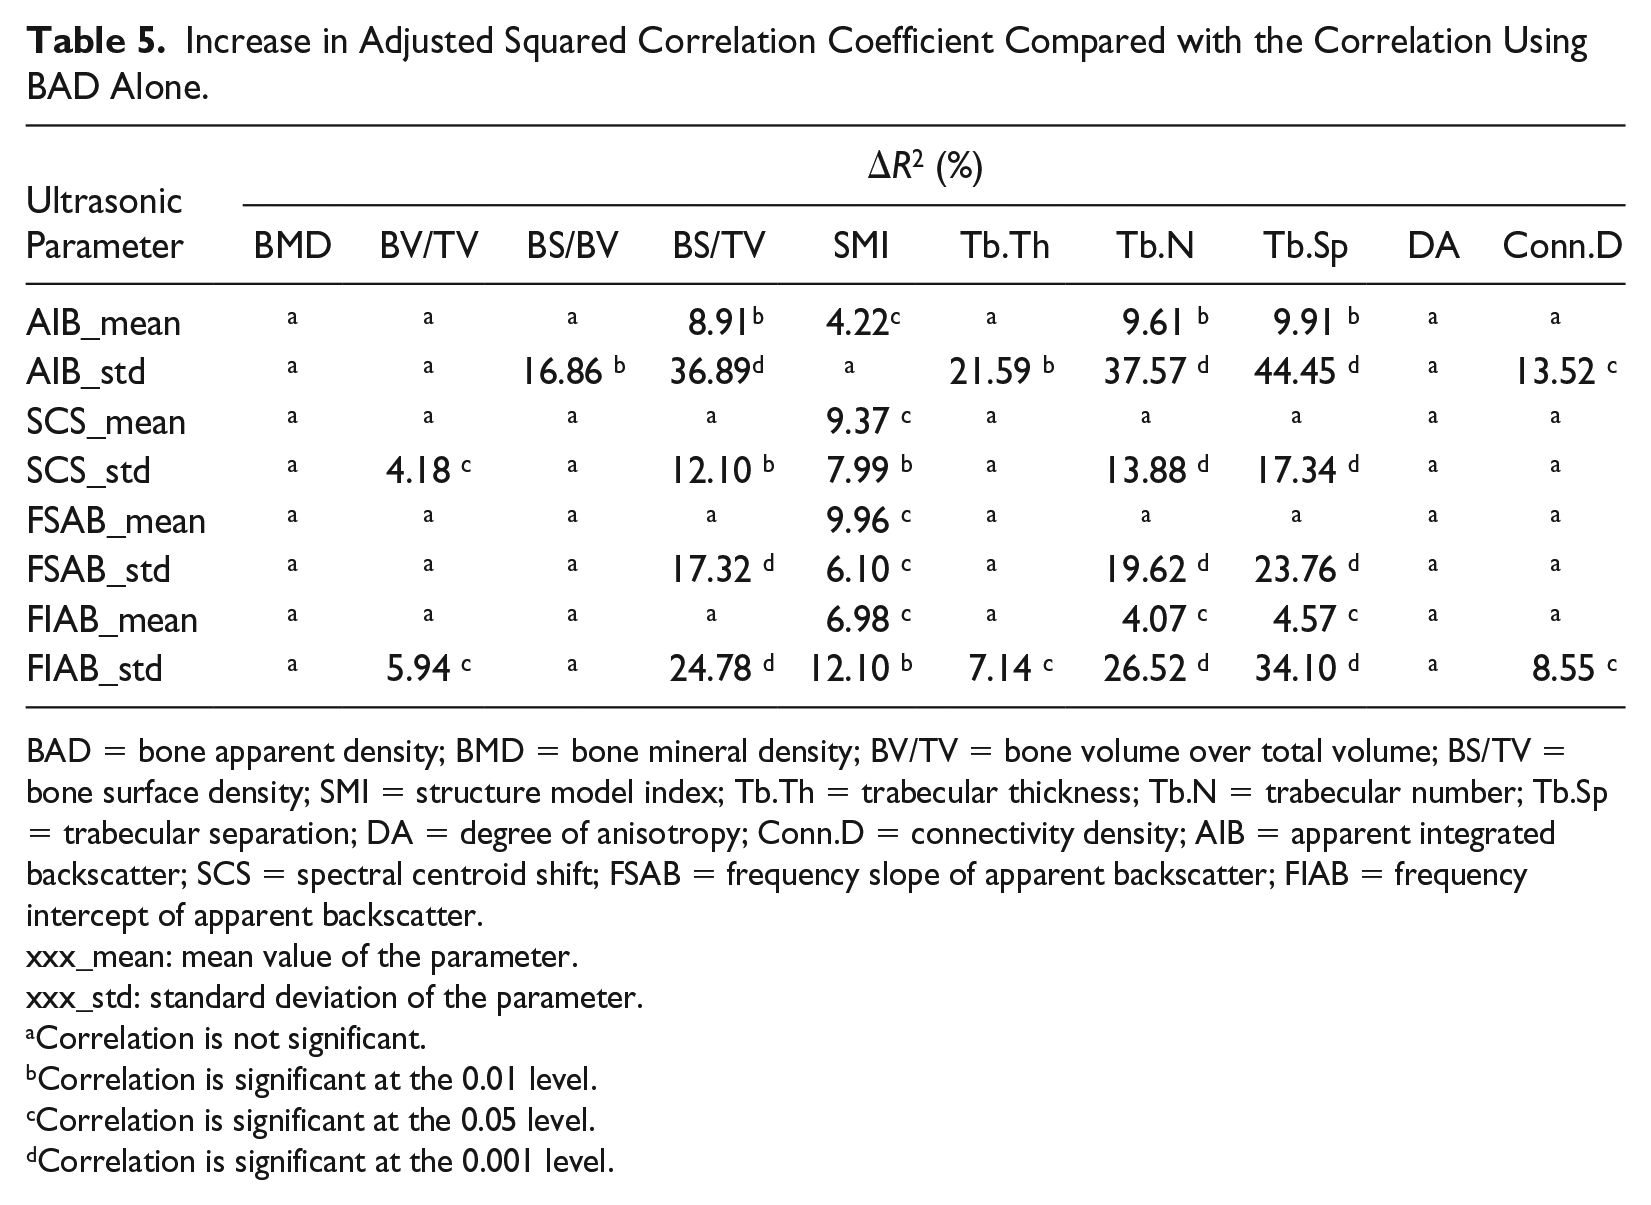
BAD = bone apparent density; BMD = bone mineral density; BV/TV = bone volume over total volume; BS/TV = bone surface density; SMI = structure model index; Tb.Th = trabecular thickness; Tb.N = trabecular number; Tb.Sp = trabecular separation; DA = degree of anisotropy; Conn.D = connectivity density; AIB = apparent integrated backscatter; SCS = spectral centroid shift; FSAB = frequency slope of apparent backscatter; FIAB = frequency intercept of apparent backscatter.
xxx_mean: mean value of the parameter.
xxx_std: standard deviation of the parameter.
Correlation is not significant.
Correlation is significant at the 0.01 level.
Correlation is significant at the 0.05 level.
Correlation is significant at the 0.001 level.
The Effect of SOI Selection
Recently, researchers found that different SOI selection could lead to opposite correlation coefficients. Liu et al. examined the effect of SOI selection on the correlation of AIB and BV/TV over a broad range of frequencies (0.5-10 MHz). 45 In this paper, the authors thoroughly explained the conflicting findings and proposed an explicit standard for in vitro SOI selection. Furthermore, the author proposed an SOI selection standard for in vivo applications based on a novel ultrasonic backscatter bone diagnostic instrument. 46 Hoffmeister et al. analyzed the effect of gate choice selection on backscatter parameters through an in vitro human bone sample experiment; 47 they found that backscatter difference parameters were sensitive to the gate choice. Similarly, we proposed an SOI selection standard of time slope of apparent backscatter (TSAB) for measuring the calcaneus in vivo. 48
Figure 6 shows the Pearson correlation coefficients between the mean values of the ultrasonic backscatter parameters and BAD by varying T and W. Figures 6(a) and 6(d) show that AIB and FIAB have positive correlations with bone density when T is less than 1 µs and negative correlations when T is greater than 2 µs. Negative correlations were more common at 7.5 MHz. The results for AIB are consistent with the findings observed by Liu et al. 45 However, due to the limited penetration depth, the selection of W cannot be too long. The SOI selection standard described by Liu et al. only accounts for the parameter AIB and lacks the 7.5 MHz condition. In this study, we consider not only AIB, but also SCS, FSAB, and FIAB. So, we choose W = 1.5 µs in this study. From Figures 6(b) and 6(c), we find positive correlations among SCS, FSAB, and bone density. Moreover, the results for BAD are not sensitive to the SOI selection. Similar correlation maps such as Figure 6 were observed for the other bone characteristic parameters except for DA and connectivity density (Conn.D).
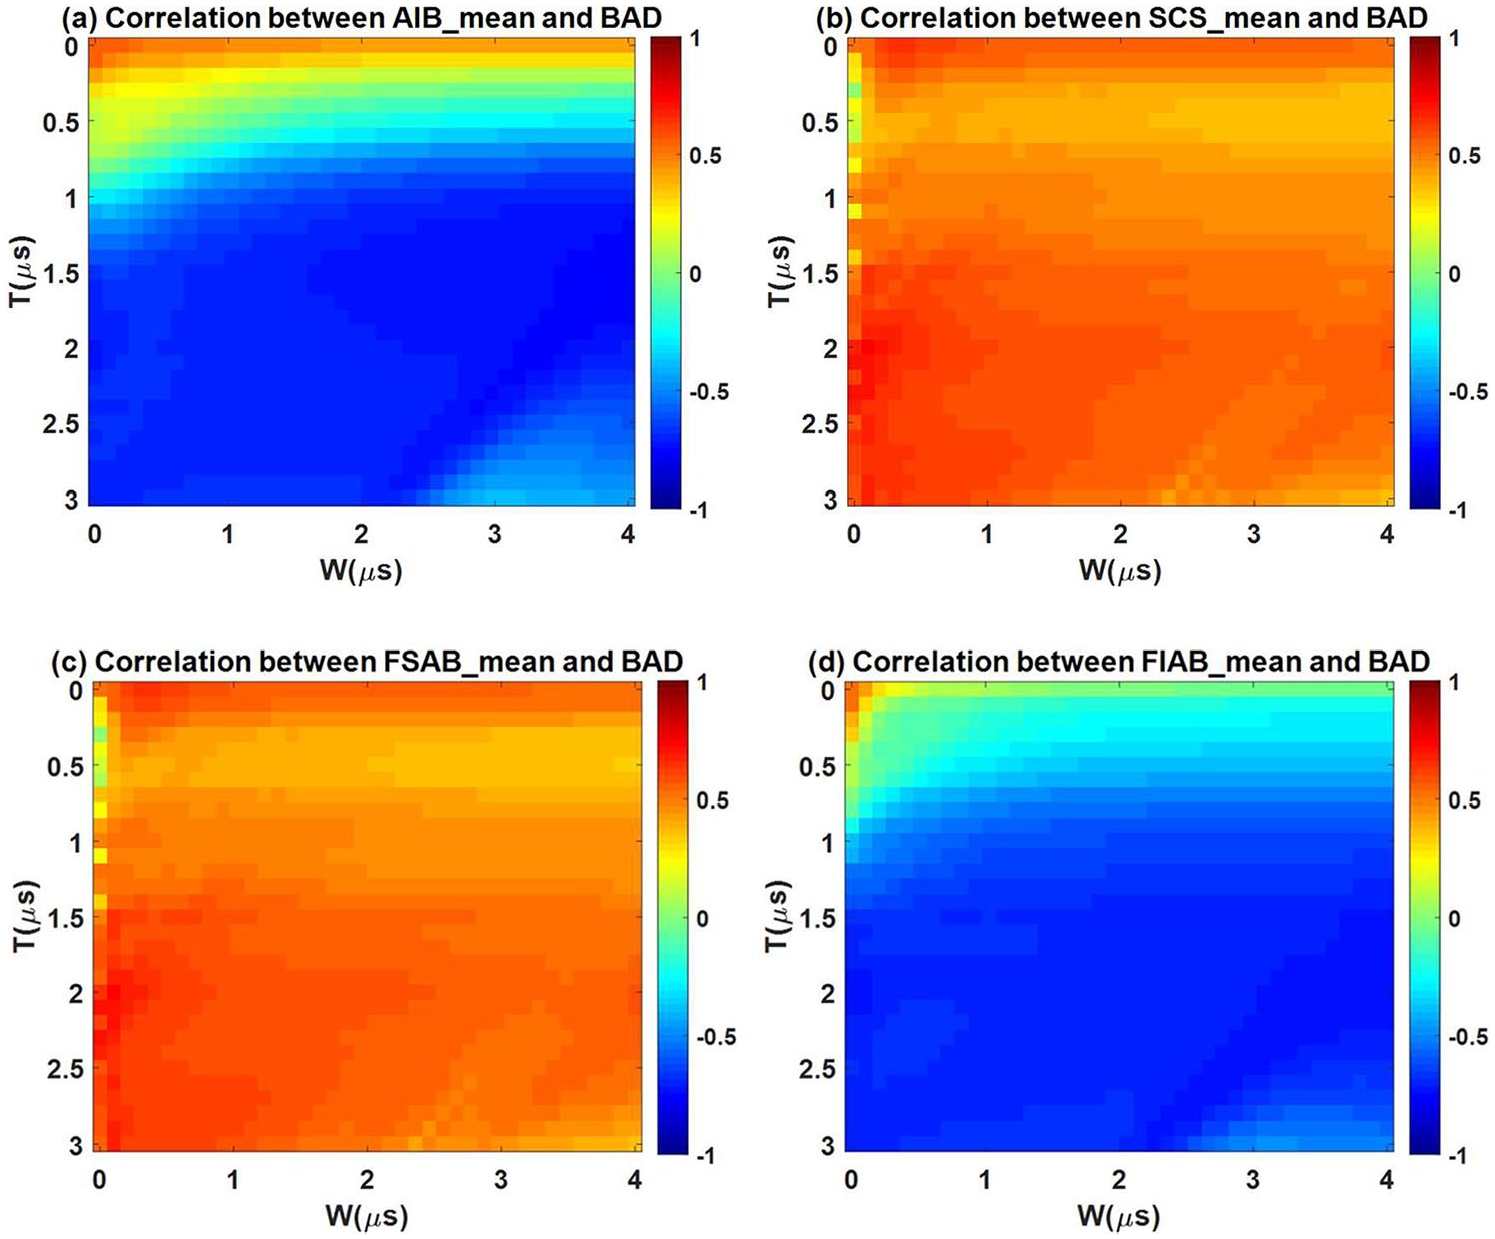
Correlations between the BAD and the mean values of (a) AIB, (b) SCS, (c) FSAB, and (d) FIAB with variations in the SOI. BAD = bone apparent density; AIB = apparent integrated backscatter; SCS = spectral centroid shift; FSAB = frequency slope of apparent backscatter; FIAB = frequency intercept of apparent backscatter; SOI = signal of interest.
Figure 7 shows the Pearson correlation coefficients between the SD of the ultrasonic backscatter parameters and Tb.Sp by varying T and W. The SD’s of the ultrasonic backscatter parameters and Tb.Sp show significant correlations when T is greater than 1.5 µs. Figures 7(b), 7(c), and 7(d) show a similar image. We choose the optimal SOI of T = 2.2 µs and W = 1.5 µs, which is in the middle of the red color region. In the region near the optimal SOI, the correlations change little with variations in the T and W values.
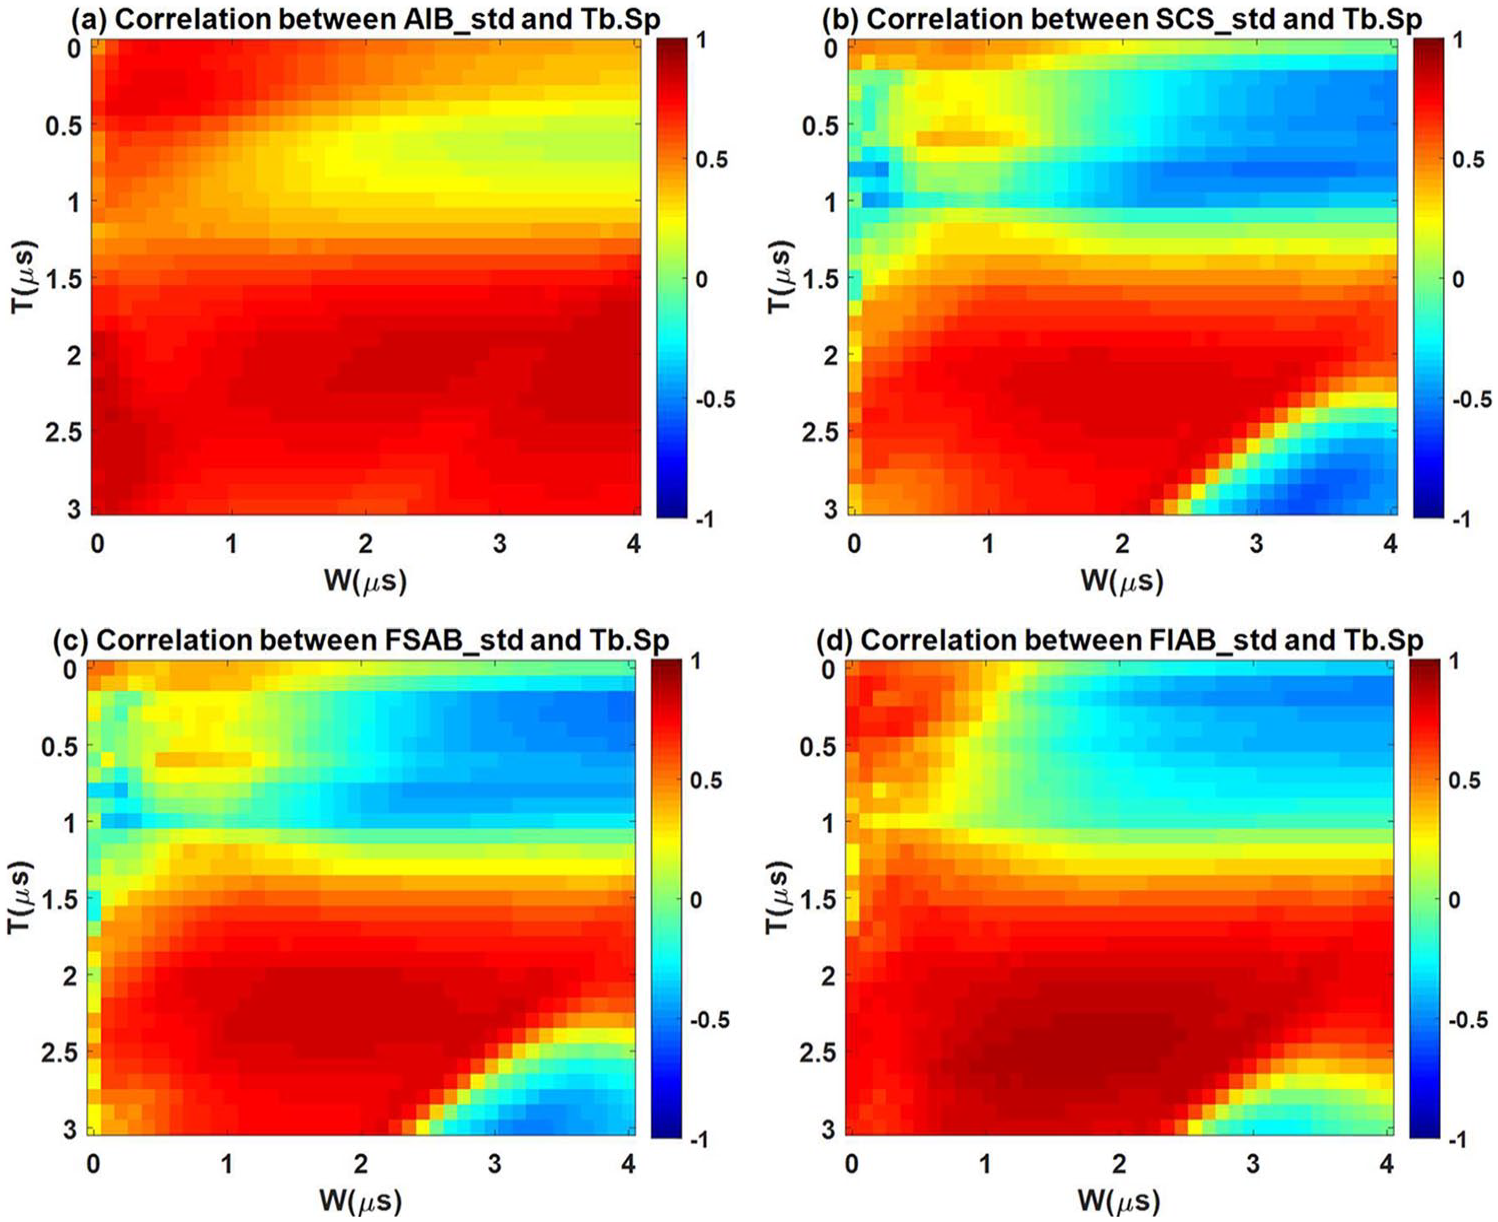
Correlations between the Tb.Sp and standard deviations of (a) AIB, (b) SCS, (c) FSAB, and (d) FIAB with variations in the SOI. Tb.Sp = trabecular bone separation; AIB = apparent integrated backscatter; SCS = spectral centroid shift; FSAB = frequency slope of apparent backscatter; FIAB = frequency intercept of apparent backscatter; SOI = signal of interest.
3D image created by ultrasound backscatter signals
Ultrasound in the MHz range is highly attenuated in bone by absorption and scattering effects.49-51 The penetration depth depends on the frequency and energy of the ultrasound and the density and microstructure of the trabecular bone. We use the 1% peak amplitude as the threshold to measure the penetration depth in Figure 2(a). The effective signals exist about 5 µs, which are measured relative to the front surface echo. Assuming the SOS in bone is 1900 m/s, the penetration depth is approximately 4.75 mm. Figure 8 shows a 3D image of the trabecular bone specimen reconstructed using the envelopes of ultrasonic backscattered signals. The ultrasound propagates in the y-direction. The xz-plane designates the surface and subsurface of the trabecular bone sample.
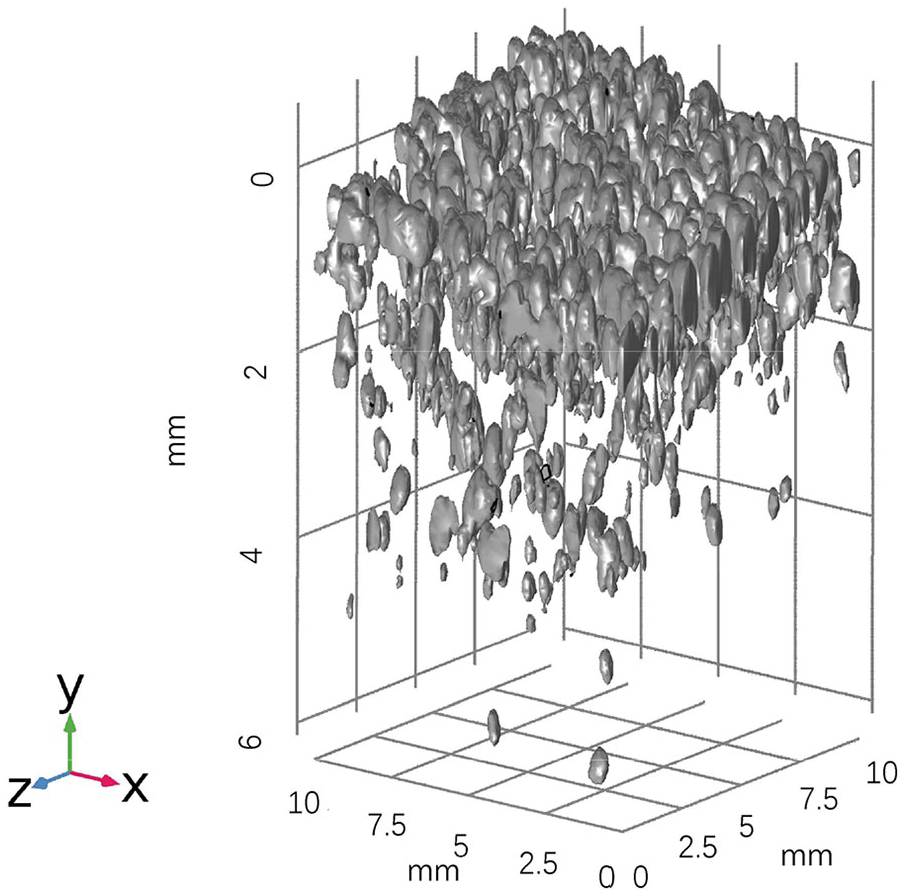
3D image created by the ultrasonic backscatter signals. 3D = three dimensional.
Discussion
Explanation of the Ultrasonic Backscatter Parametric Images
To clearly distinguish trabeculae from water, the beam diameter should be less than minimum of trabecular separation (Tb.Sp), which is 0.35 mm in this bovine bone study. The lateral resolution of the transducer we used in this study is 0.297 mm, which satisfies the condition. The particular choice of the transducer frequency was based on trade-offs between lateral resolution and attenuation effects.
The wavelength is approximately 0.2 mm for 7.5 MHz ultrasound in the surrounding fluid, which is close to the mean trabecular thickness of the bovine bone (0.2 mm) in this study. Ultrasonic backscatter parametric images and µ-CT images illustrate the distribution of trabeculae in different ways. In ultrasonic backscatter parametric images, each pixel represents the average scattering characteristics from a 3D volume in the ultrasound incidence direction; therefore, a 2D ultrasonic backscatter parametric image provides averaged information of the 3D bone density and microstructure. In comparison, a 2D µ-CT image has a higher resolution and is a reconstruction of the distribution of trabeculae in a 2D plane.
In this study, we used parametric images as a tool for in vitro laboratory studies. The images can indicate the boundary of the specimen, which can help identify the ROI to analyze in the bone area, not the surrounding fluid. As described in through-transmission parametric imaging method by Fournier et al., the optimal ROI can be extracted by image processing technology. It is meaningful to construct ultrasonic parametric images because their ability to directly display information related to bone quantity might help identify the ROI without using ionizing radiation, which is one of the hazards of the X-ray-based imaging method.29,52
Correlations with Bone Density and Microstructure
In trabecular bone, the thickness and spacing of trabeculae and bone density could be important factors in determining the scattering characteristics. Thus, the mean and SD values of the ultrasonic backscatter parameters might have relationships with the microstructural parameters and density of the bone. The results shown in Table 4 illustrate that denser and less separated trabeculae had a greater amount of attenuation, which indicates a reduction in the backscatter characteristics or a decrease in mean AIB and mean FIAB.39,46 The SD’s of all the ultrasonic backscatter parameters were negatively correlated with bone density and positively correlated with Tb.Sp. These results could be explained by the greater the separation between the trabeculae, the greater the site-to-site variance in the ultrasonic backscatter parameters.
Comparison with Previous Studies
In our previous study, we had estimated the average size and separation of the trabecular bone structures and in their parametric images and compared the results of this analysis with μ-CT data for Tb.Th and Tb.Sp. The estimated Tb.Th and Tb.Sp from ultrasonic backscatter parametric images had an estimation error of 21% and 22%, compared with the μ-CT measured results. 53 The results demonstrated that ultrasonic C-scan imaging can be used to evaluate cancellous bone microstructure in vitro. However, we found it is hard to acquire a clear trabecular bone image (shown in Figure 4) for the inex vivo measurement due to the effect of cortical bone and soft tissue. Considering that our ultimate goal is the in vivo applications where the cortical bone and soft tissue cannot be avoided, we think it is better to find in vivo applicable measurement of bone. So, we analyze the relationship between ultrasound backscatter (using the parameters shown in Figure 5) and bone density and microstructure parameters in this study.
Compared with other common ultrasonic backscatter coefficients (e.g., compensated frequency averaged BUB), researchers have suggested using apparent integrated backscatter (AIB) as the ultrasonic backscatter parameter for bone characterization due to its convenience for in vivo measurement.7,21 AIB is the integration of the uncompensated backscatter coefficient (BC) over a broad frequency range. In contrast to measurements based on the compensated BC, which conventionally require an additional measurement of attenuation using transmission techniques with a transmitter-receiver pair of transducers at every investigated position, the measurement of parameters based on apparent backscatter only requires a single transducer. This advantage is important for backscatter parametric imaging, which can provide a greater number of backscatter scans at different measurement sites with minimal imaging equipment setup. For BUB estimation, as Riekkinen et al. mentioned, the accurate measurement of ultrasonic attenuation conventionally requires transmission experiments using two transducers. 34 In contrast, the significant association between the ultrasonic backscatter parameters and Tb.Sp and Tb.Th demonstrates that ultrasonic backscatter parametric images have the potential to directly display information related to the bone microstructure, which may help select a diagnosis ROI for multiple measurements. Riekkinen and Karjalainen et al. were some of the first investigators to produce backscatter parametric images of trabecular bone (particularly at higher frequencies).34,35 However, the resolution of the images was too low to clearly distinguish individual trabeculae. The lateral resolution of the focused transducer in these previous studies limited the clarity of the images. In this study, ultrasonic backscatter images can clearly distinguish trabeculae. Significant correlations can also be found between the means and SD’s of the backscatter parameters and bone density and microstructure, which is consistent with the results of the previous studies.
Limitations
One limitation in this study is that measurements were made on bovine trabecular bone, not human trabecular bone. Typical ranges for human trabecular bone from the literature are listed in Table 1 for the reader to compare the difference between the bovine and human trabecular bone.8,43,44 Bovine bone tends to be denser and more plate-like than human bone. The influence of density and microstructural differences between bovine and human bone on the ultrasonic parameter measurements are still unknown. The in vitro experiment of the ultrasonic backscatter parametric imaging needs further investigation.
Another limitation for investigating trabecular bone structures with ultrasound is the influence of overlying soft tissues and cortical bone.54-56 The uncertainties induced by soft tissues and cortical bone depend inherently on the frequency. High-frequency ultrasound propagates with high attenuation, which has a large impact on the ability of ultrasound to investigate bone quality in vivo. Thus, it should be noted that the ability of ultrasonic backscatter parametric imaging to predict bone status depends strongly on the ultrasound frequency and ultrasound attenuation in the bone. The clinical application of the present parametric imaging method needs further investigation. The transducers are suggested to be custom designed to achieve inex vivo enough lateral resolution with lower frequencies, which can increase the ultrasound penetration depth of the bone. Coded excitation technology may be needed to improve the signal to noise ratio, which can also increase the ultrasound penetration depth of the bone. The effect of overlaying cortical bone and soft tissue should be explored and compensated by doing experiments. In the future, our research will focus on the compensation of the attenuation induced by scattering and absorption when ultrasound propagates in bone.
Conclusion
This study represents an attempt to construct ultrasonic backscatter parametric images for investigating bone microstructures in high ultrasonic lateral resolution. The ultrasonic backscatter parametric images can directly show the distribution of trabeculae. In addition, we found significant correlations between the ultrasonic backscatter parameters and bone density and microstructure at high frequencies. Ultrasonic backscatter parametric imaging may have the potential for providing trabecular bone microstructure information. Further studies are needed to confirm the current results within a different frequency range and to consider the influence of soft tissues and cortical bone on ultrasound propagation.
Footnotes
Declaration of Conflicting Interests
The author(s) declared no potential conflicts of interest with respect to the research, authorship, and/or publication of this article.
Funding
The author(s) disclosed receipt of the following financial support for the research, authorship, and/or publication of this article: The National Natural Science Foundation of China (11804056, 11874289, 11827808, 11525416, 11604054, and 81601504), China Postdoctoral Science Foundation funded project (2018M641924, 2019T120293), Shanghai Municipal Science and Technology Major Project (2017SHZDZX01), Shanghai Talent Development Fund (2018112), State Key Laboratory of ASIC, and System Project (2018MS004) supported this work.