
Abstract
After 100 years of theoretical treatment of speckle patterns from coherent illumination, there remain some open questions about the nature of ultrasound speckle from soft vascularized tissues. A recent hypothesis is that the fractal branching vasculature is responsible for the dominant echo pattern from organs such as the liver. In that case, an analysis of cylindrical scattering structures arranged across a power law distribution of sizes is warranted. Using a simple model of echo strength and basic transformation rules from probability, we derive the first order statistics of speckle considering the amplitude, the intensity, and the natural log of amplitude. The results are given by long tailed distributions that have been studied in the statistics literature for other fields. Examples are given from simulations and animal studies, and the theoretical fit to these preliminary data support the overall framework as a plausible model for characterizing ultrasound speckle statistics.
Introduction
The study of speckle as a random interference phenomenon from coherent illumination is over 100 years old. The early work in light (predating the laser) utilized prisms to select a narrow band and study scattering, 1 but even at that time the author said, “The theme of our investigation is an old one.” With the advent of radar and laser sources, the research on the mathematical properties of optical speckle were accelerated.2-8 In medical ultrasound, the mathematical treatment of speckle patterns is over 40 years in extent 9 and has developed into a rich set of models for the statistics of backscattered echoes from tissues. 10
For much of medical ultrasound, important goals include the differentiation of normal versus pathological tissues, the detection of lesions, and the post-processing of B-scans for improved rendering of images including computer assisted diagnosis by algorithms. All of these tasks are strengthened by a careful analysis of speckle or texture from scatterers within normal soft tissues, and then any changes associated with pathological conditions. Accordingly, over time a number of models of ultrasound speckle have been postulated, and many of these models have been adapted from earlier work from optics and electromagnetics. These models include the classical Rayleigh distribution,9,11-13 the K-distribution,14-16 a Rician distribution,6,17,18 the Nakagami distribution,19-21 a “marked model” distribution,22,23 and other advanced models24,25 with continuing applications to a variety of clinical targets.26-29
Recently, we have proposed an alternative approach to the first and second order statistics of speckle from soft vascularized tissues.30-32 Essentially, this model postulates that the fractal branching vasculature and fluid channels have an acoustic impedance mismatch of approximately 3% with respect to the surrounding tissue parenchyma. This mismatch forms the dominant set of inhomogeneities in normal soft vascularized tissues such as the prostate, thyroid, liver, and brain, and therefore the canonical scattering element is a cylinder, not a point or a sphere. Given the multi-scale, fractal structure of the vasculature, an ensemble average over all sizes from large to small leads to power law functions which propagate through different transfer functions and probability density functions (PDFs). This paper examines the first order statistics of speckle from tissue under the assumptions inherent in the framework where weak (Born approximation) scattering originates from a fractal branching set of cylindrical vessels within a reference medium and interrogated by a bandpass ultrasound pulse. It is shown that the echo amplitude, intensity, and log amplitude histograms can be modeled by conventional PDFs that are known in the statistics literature, and therefore have well described properties. These all contain a power law parameter that originates from the tissue structure itself. Preliminary examples from a 3D wave simulation of scattering and an animal imaging study of the liver are given to demonstrate the relevance of these functions.
Theory
Spatial Convolutions and Transforms
The key assumptions and formulas used in deriving the first order statistics of speckle from a fractal branching vasculature are summarized below. First, we assume that a bandpass pressure pulse
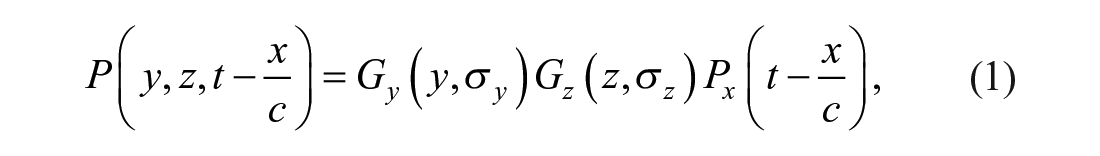
where
Next, applying a 3D convolution model,33-35 we assess the dominant echoes from the pulse interacting with each generation of elements in a branching, fractal, self-similar set of vessels shown in Figure 1, and whose number density as a function of radius
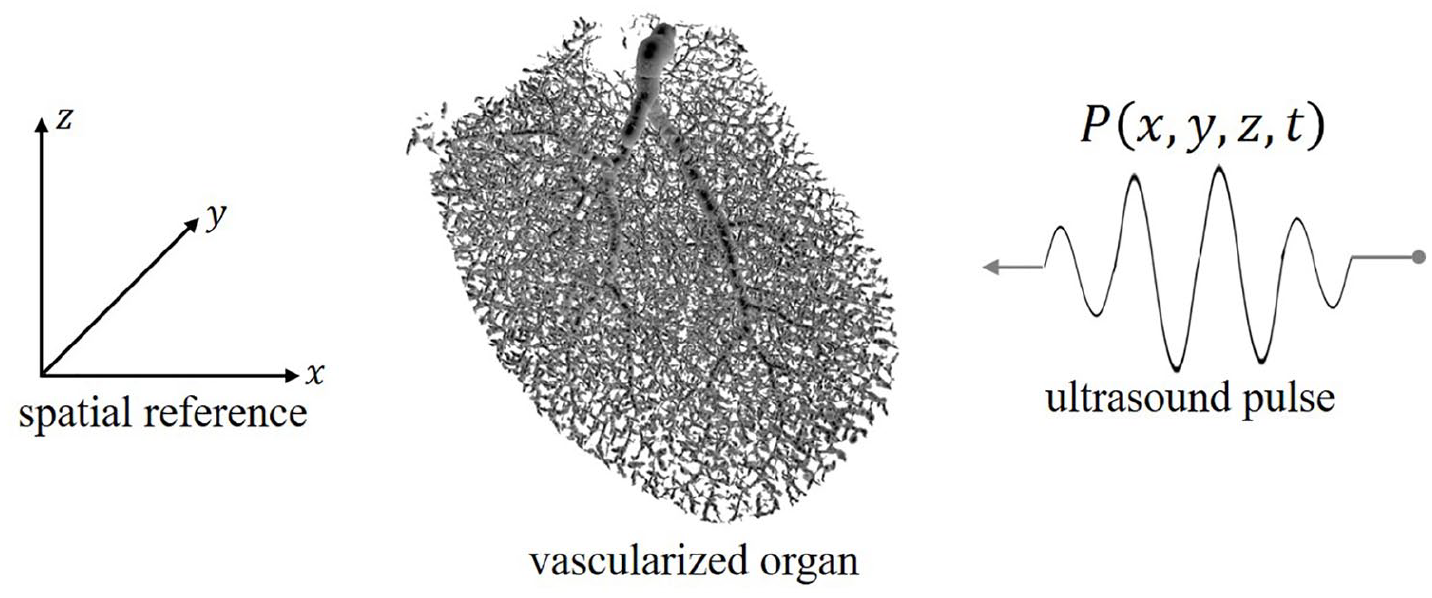
Model of 3D convolution of a pulse with the fractal branching cylindrical fluid-filled channels in a soft tissue.
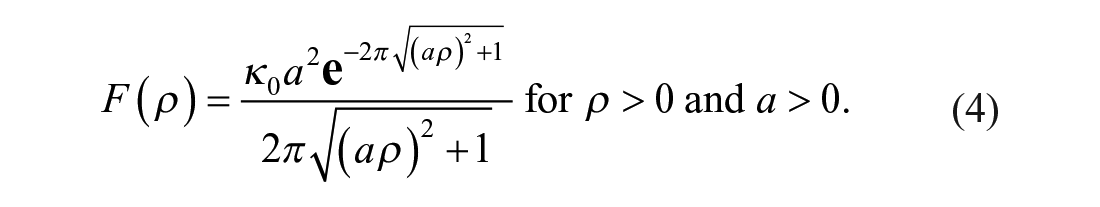
The canonical scatterer shape for any branch is a long fluid-filled cylinder of radius
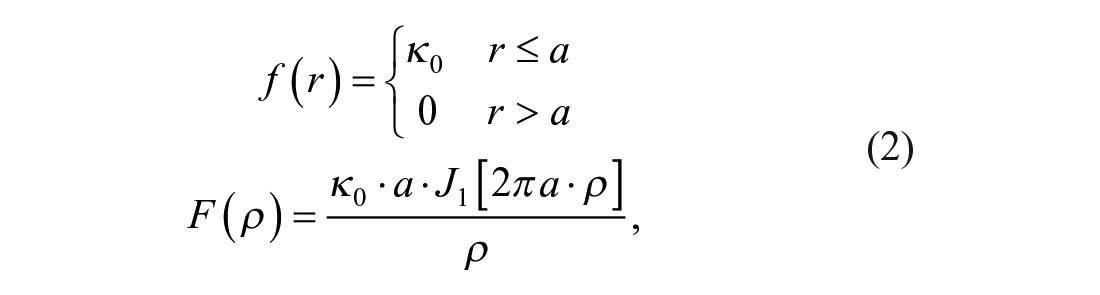
where
In addition, we also consider a “soft-walled” cylindrical vessel representing a less sharp transition in acoustic impedance between the fluid interior and the outer “solid” tissue:
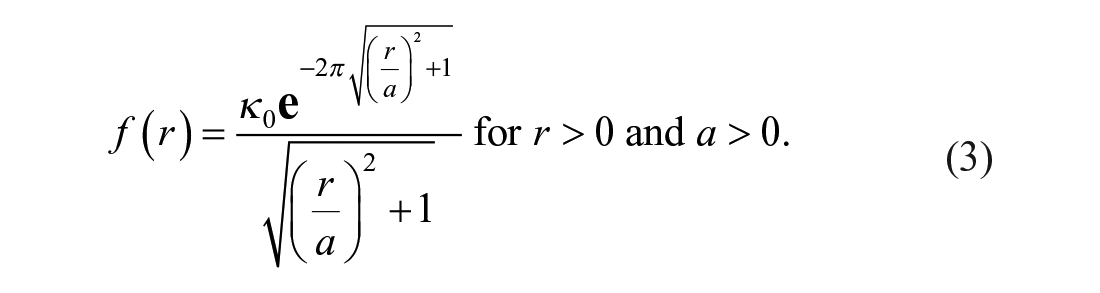
Its Hankel transform is given by theorem 8.2.24 of Erdélyi and Bateman 38 :
The convolution of the pulse with a cylinder of radius
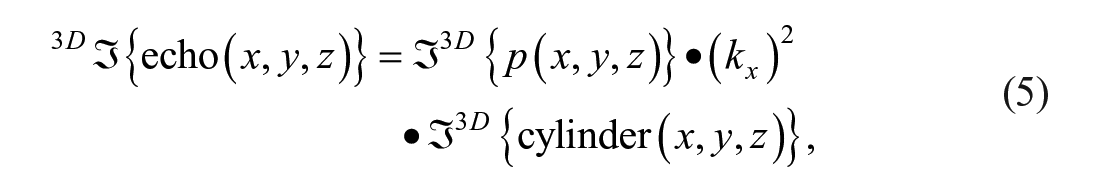
where the
By Parseval’s theorem, the integral of the square of the transform equals the integral of the square of the echo, and provides a measure of the energy within the echo:
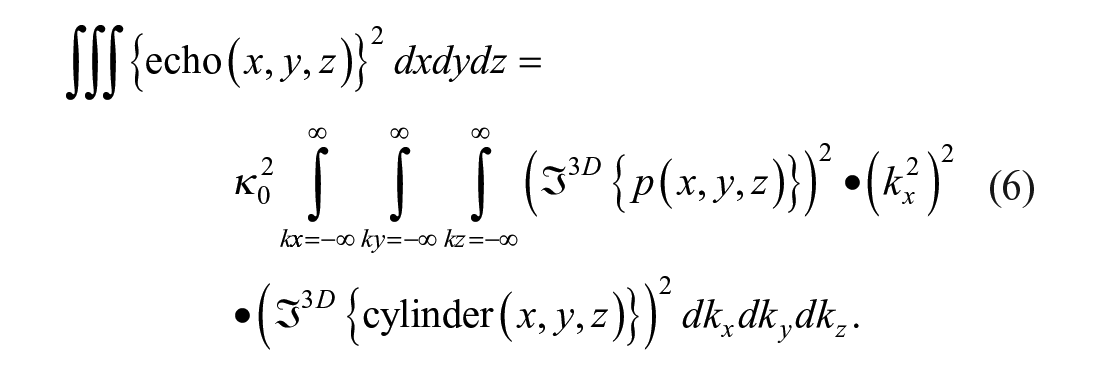
We assume the left side of Equation (6) is also proportional to the average intensity
So as a working approximation, we apply the relation
Probability of Amplitudes
Consistent with fractal models,36,43 we assume that along the line of propagation of the incident pulse in Figure 1, and within the interrogated ensemble, the probability density of encountering vessels at different radii is given by a power law:

for

In our case, the derivative
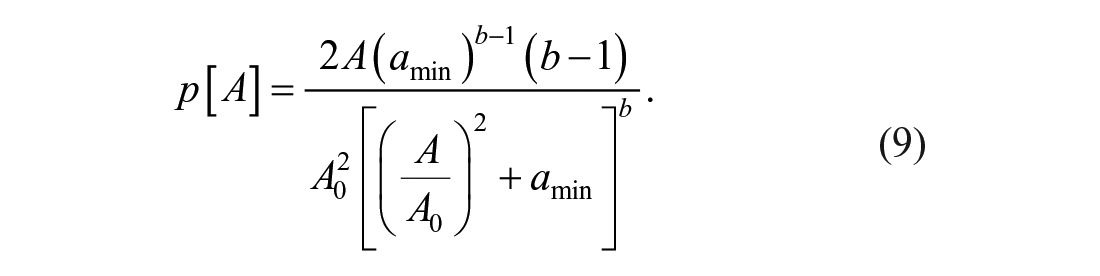
Furthermore, by substituting
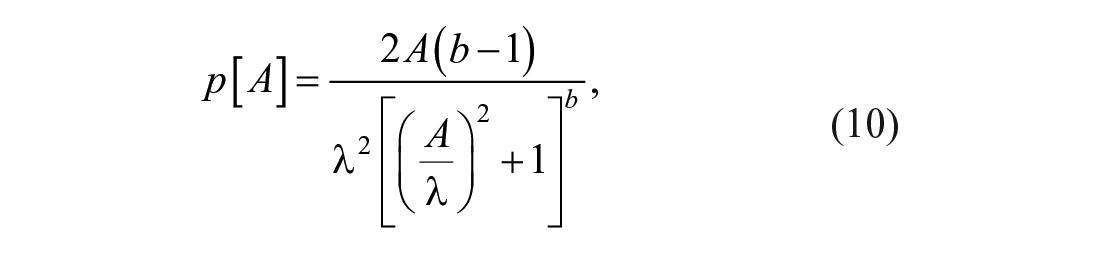
which is a Burr Type XII distribution45,46 with
Thus, the Burr distribution (Equation 10) describes the expected histogram distribution of echo amplitudes from a fractal branching set of Born cylinders. In particular, the power law parameter
Probability of Intensity
For completeness, we examine the PDF of echo intensity from this model. Again, assume that the probability distribution of a fractal branching vasculature is described by a power law in radius
Furthermore, assume the average backscatter intensity

where

Thus, using the transformation rules:
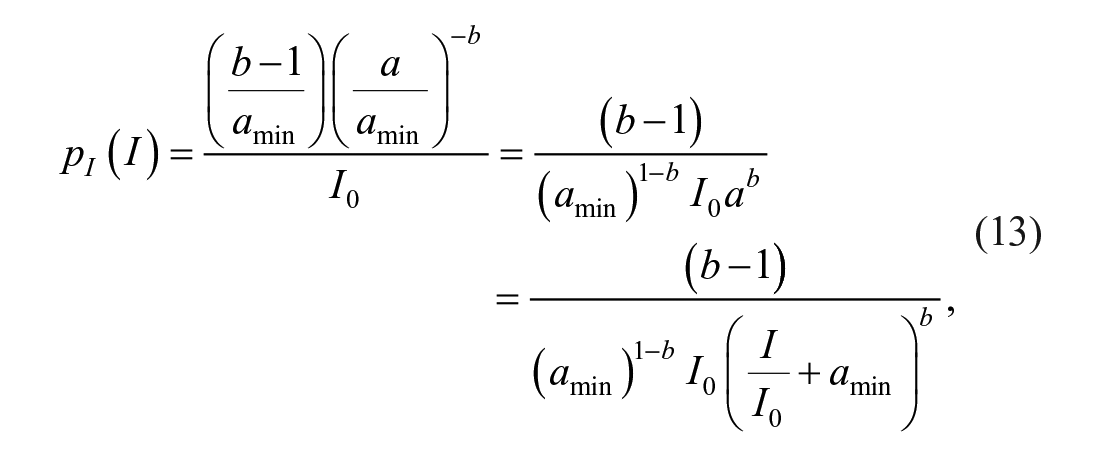
which is a Lomax distribution, also related to a Pareto type II distribution. 47 This can be more compactly written as:

for
Probability of Log-Transformed Envelope
In ultrasound imaging, it is conventional to display the echo amplitudes using a log or dB scale to help with visualization of the wide dynamic range. The log transformation affects the distribution, and again using probability transformation rules,
44
let
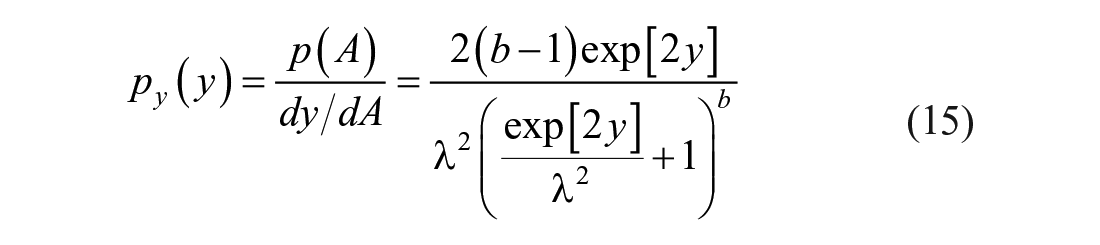
for
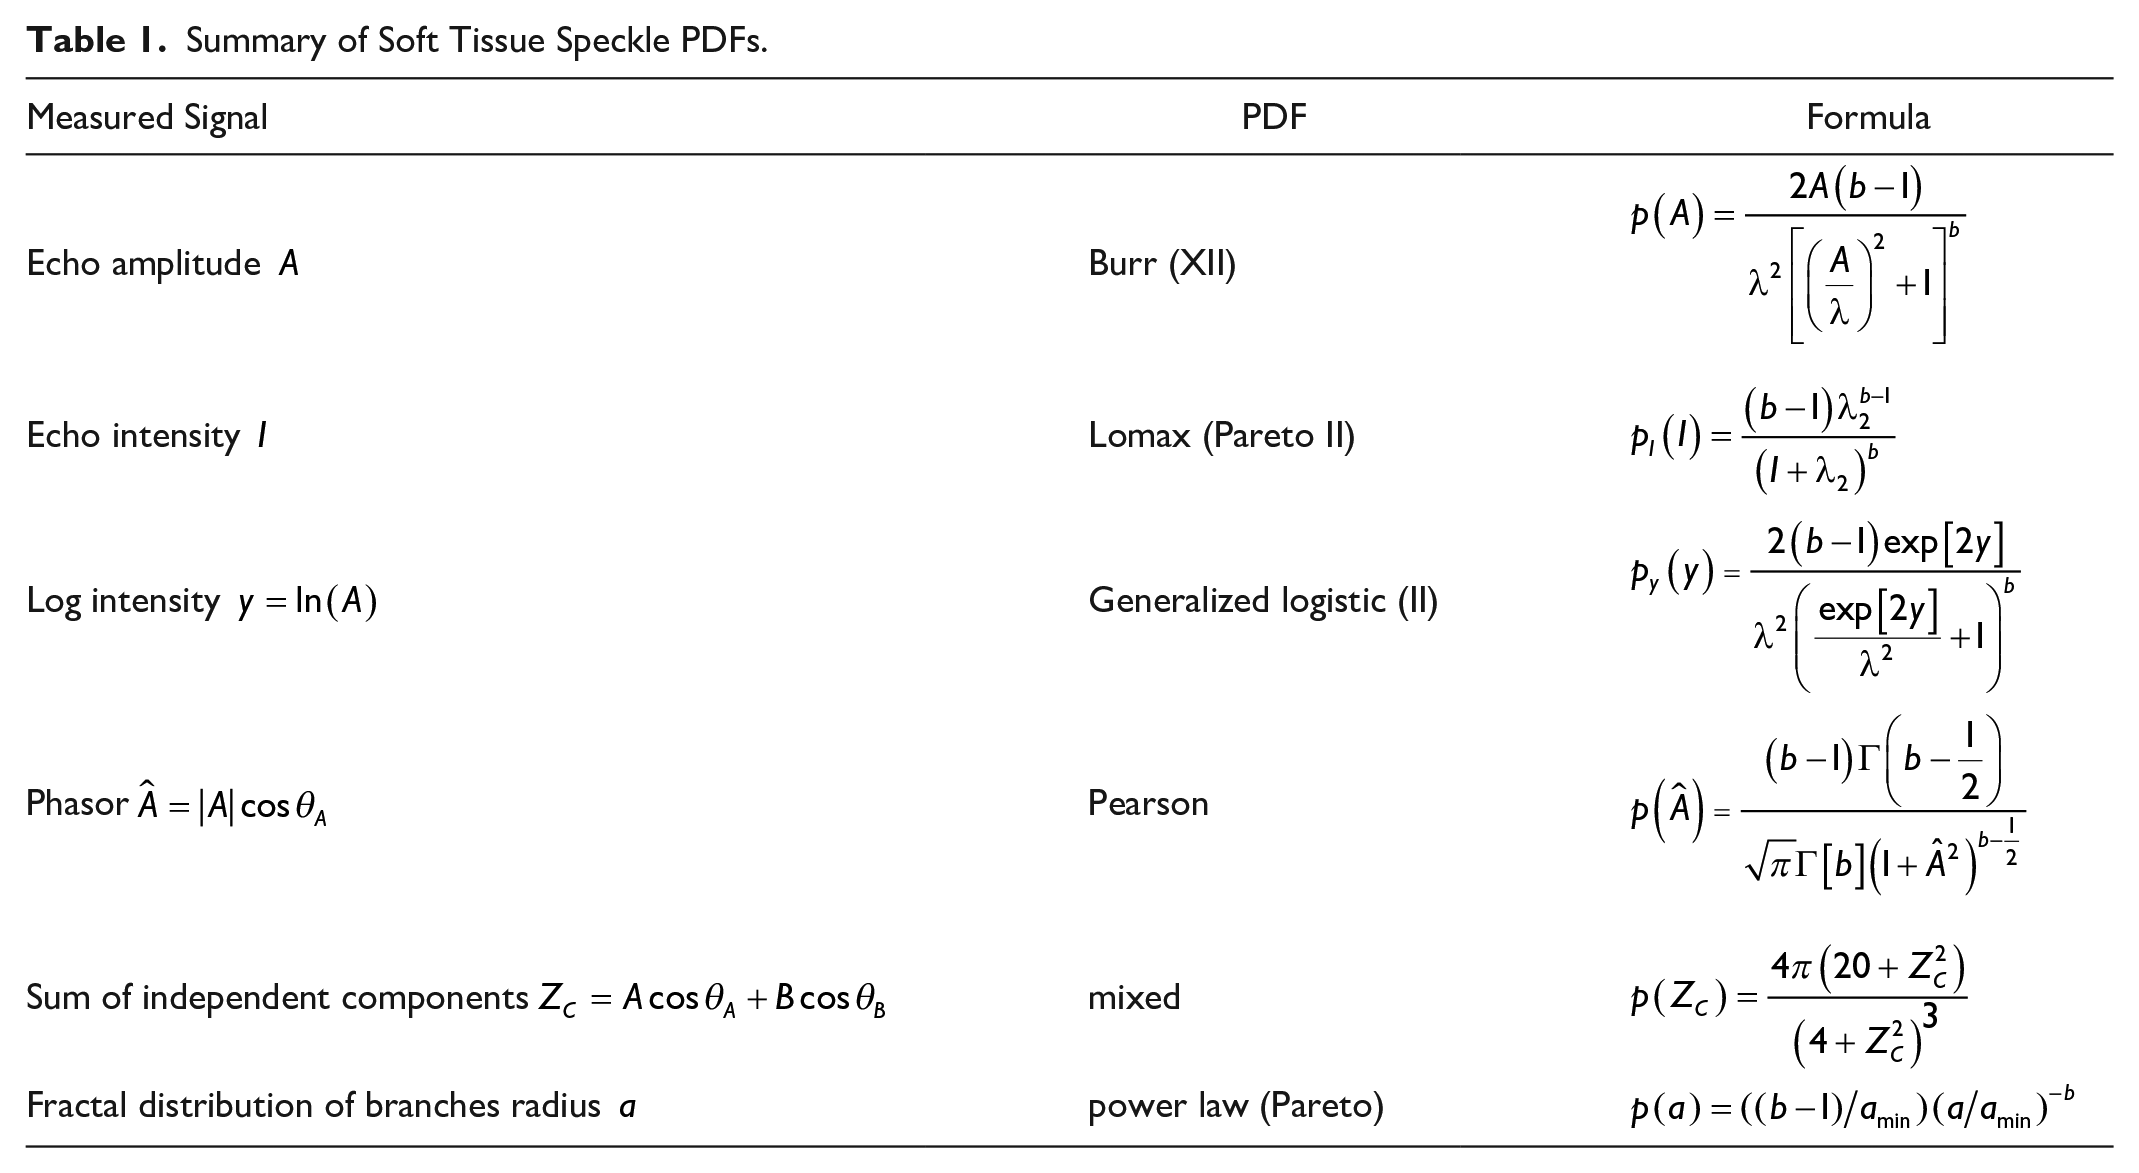
Thus, each form of the received echoes from speckle (amplitude, intensity, ln[amplitude]) are given by standard PDFs known in the literature (Burr type XII, Lomax, generalized logistic). These have now been derived based on a simple transformation of probability distributions using a mapping function linking vessel radius to echo strength. However, when multiple vessels are present within the interrogating pulse, then more complex treatment is required.
Increasing Power Law
with Complex Summation
Let us assume that the interrogated sample volume in an imaging system is large enough to encompass two or several discrete cylindrical scatterers simultaneously. Because of the RF modulation of the pulse, their echo amplitudes will be complex. Because of the fractal distribution, the probability distribution of each individual reflected echo amplitude has already been given as a Burr distribution. Note that historically, the Rayleigh distribution was derived by considering a complex summation of many independent point scatterers, then by invoking the central limit theorem a Gaussian distribution is generated from the sum of many identical and independent random variables.48-52 In marked contrast in our case, we have cylindrical scatterers from a power law probability distribution over a wide range of radii, and we do not anticipate having so many vessels within a sample volume that we can invoke the central limit theorem. Furthermore, power law distributions (long tail distributions) have slow convergence to the central limit, and so it is instructive to look at the complex sum of two or few scatterers. The statistics literature has derived the sum of random variables of these distributions but the solutions generally involve complicated generalized functions or series.47,48,53-57 To simplify this, we examine a complex Burr summation.
With reference to Figure 2, using standard notation we can write the amplitude of the complex sum of two phasors
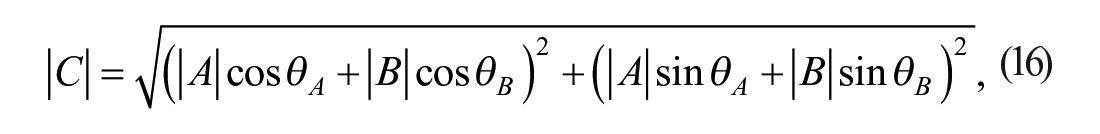
where
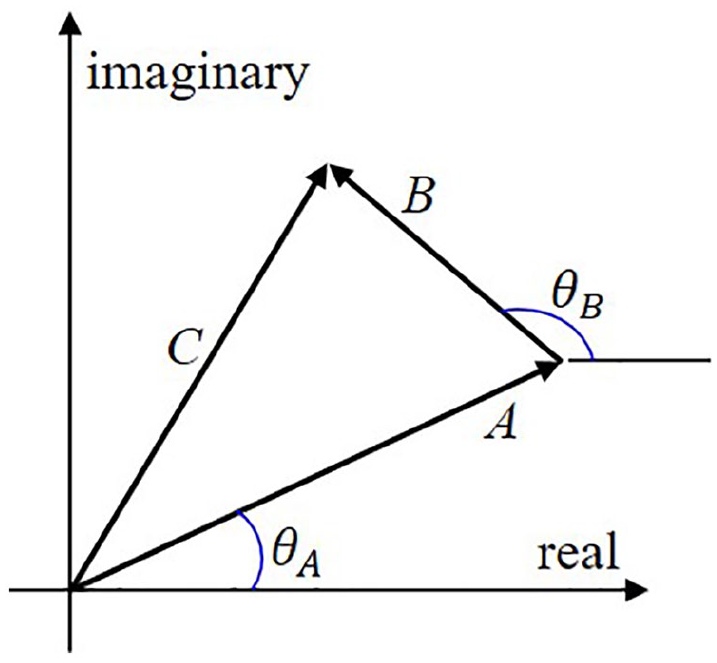
The vector sum of two independent phasors, pertaining to the real and imaginary parts of a complex addition as is commonly found in models of scattering.
The new random variable
for
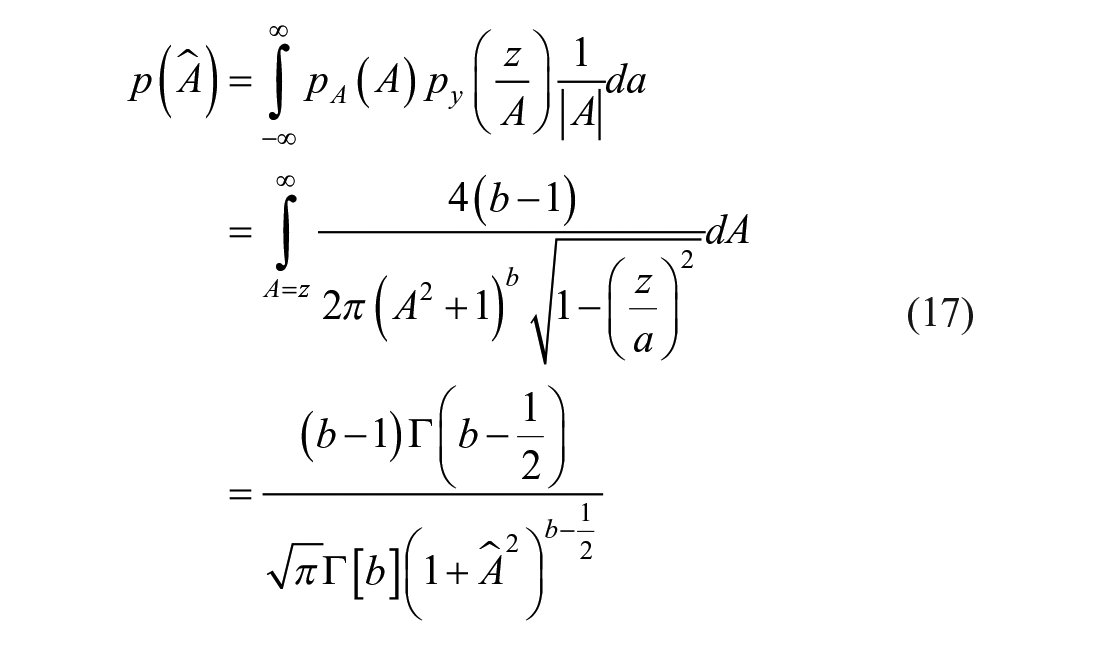
Next we need the PDF for
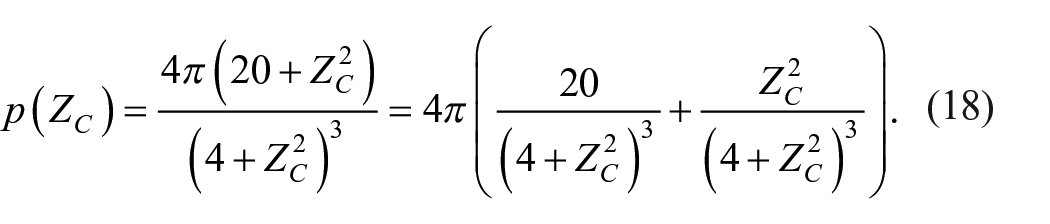
The latter form emphasizes the important term with numerator 20, which dominates for
Summary of Soft Tissue Speckle PDFs.
Methods
Simulations
In this study, to make a simple model of the liver parenchyma having vessels with fractal branching nature, a 3D block including multiscale cylindrical branches was generated to simulate the wave propagation and obtain the statistics of speckles. The block dimensions are 15 mm × 13 mm × 3 mm in the axial
The k-Wave toolbox in MATLAB (The Mathworks, Inc., Natick, MA, USA) is employed to simulate the propagation of compressional waves in the time domain. This open-source toolbox uses the k-space pseudospectral approach to solve the acoustic wave equations. 58
Using a virtual linear array transducer defined as the source and sensor in the k-Wave toolbox, an excitation signal is applied in the form of two transient toneburst cycles with a frequency of 4 MHz. This frequency is selected to lie in the common frequency range used for adult human abdominal scanning. For the material properties assignment, the speed of sound is set to 1540 m/s and 1500 m/s for the background and scatterers, respectively, and a uniform density of 1000 kg/m2 is assumed for the entire medium with a small absorption coefficient. Moreover, in order to avoid the reflection effect from the boundary, the 3D domain is surrounded by an absorbing boundary layer, known in the k-Wave toolbox as a perfectly matched layer, which absorbs acoustic waves at the boundaries and minimizes reflection back to the domain.
A larger study focused on the effect of the number of scatterers per unit volume from these simulations was recently completed
59
across a range of parameters including
Liver Scans
Separately, experimental results were obtained from liver experiments. Rat experiments were reviewed and approved by the Institutional Animal Care and Use Committee of Pfizer, Inc., Groton, CT, USA, where the ultrasound RF data were acquired using a Vevo 2100 (VisualSonics, Toronto, ON, Canada) scanner and a 21 MHz center frequency transducer (data provided courtesy of Terry Swanson). For the purpose of examining speckle PDFs, two scans (one normal and one fibrotic) were selected for having good quality B-scan images with adequate liver ROIs. The focal depth was set to 11 mm and positioned to the lower half of the liver in the sagittal plane. In analyzing the results from simulations and liver scans, parameter estimation was performed using MATLAB nonlinear least squares minimization of error, for two-parameter fits of the Burr distribution to the data.
Results
An example from the simulation results are given in Figure 3. Figure 3(a) shows a 3D orientation of the transducer and random cylindrical scatterers in the domain. Only a few branches are shown here to clarify their orientation as perpendicular to the axial propagation of the interrogating pulse. Figure 3(b) illustrates one realization of a random distribution of weak cylindrical scatterers of various diameters following a power law (fractal) function with
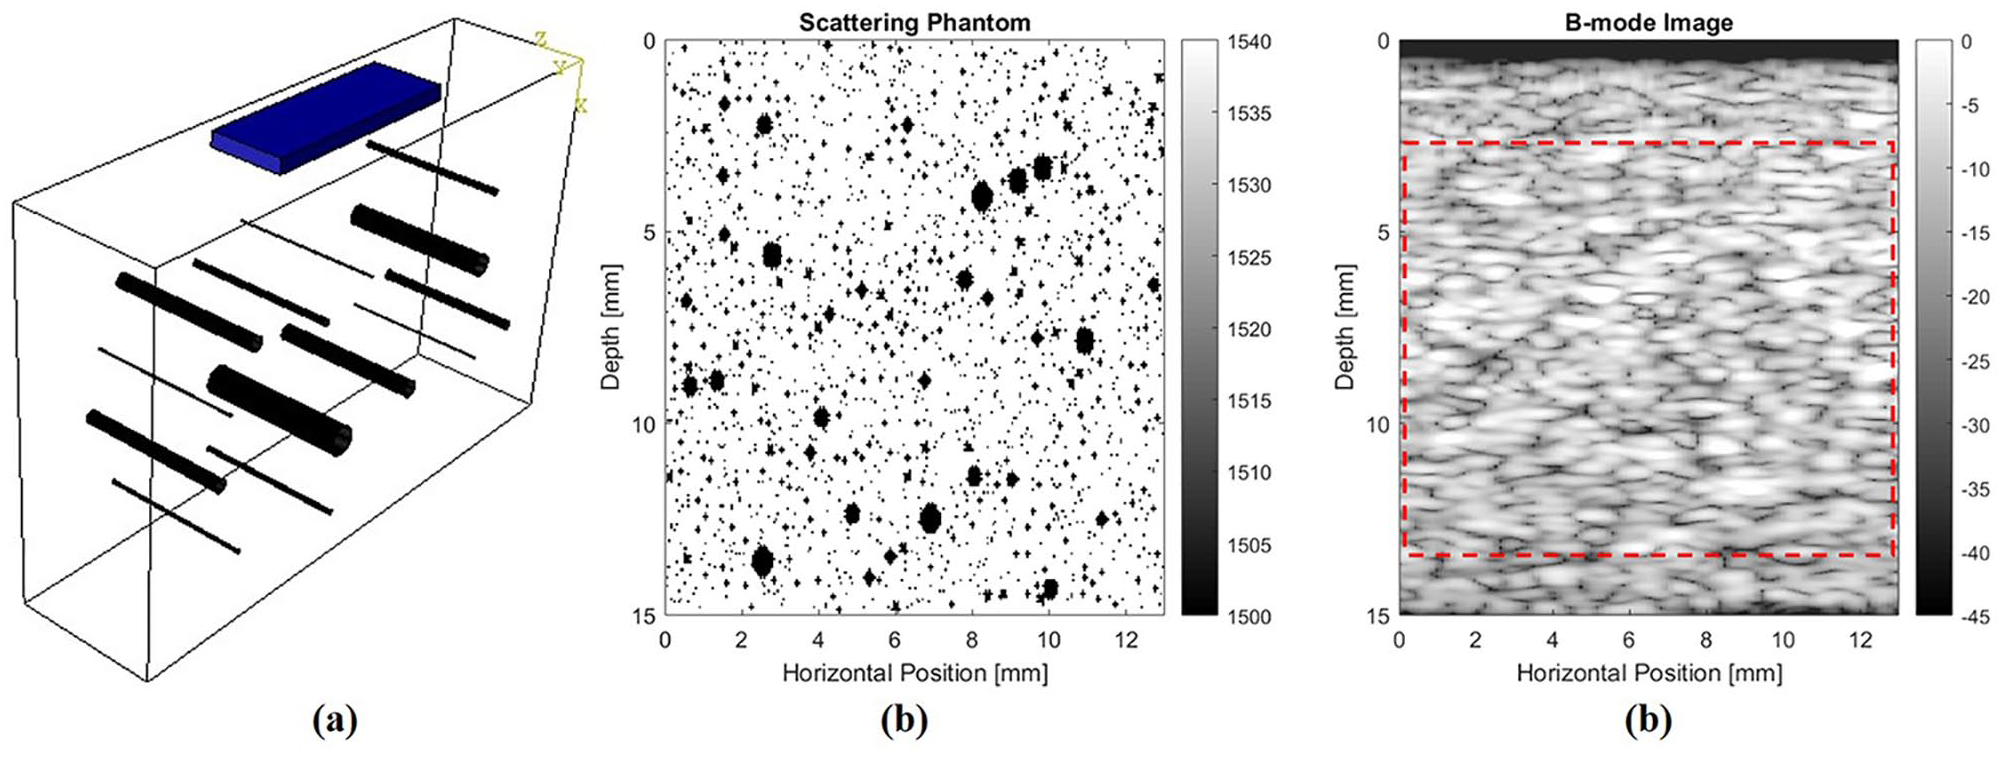
(a) 3D orientation of the transducer and random cylindrical scatterers in the simulation domain. Only a few cylindrical branches are shown here to clarify their orientation as perpendicular to the axial propagation of the interrogating pulse, (b) One realization of a random distribution of weak cylindrical scatterers of various diameters following a power law (fractal) function, and (c) Resulting 4 MHz B-scan demonstrating speckle pattern.
Figure 4 contains the histograms from left to right of the amplitudes (Burr), intensity (Lomax), and log amplitude (logistic) distributions. In each case, the estimated
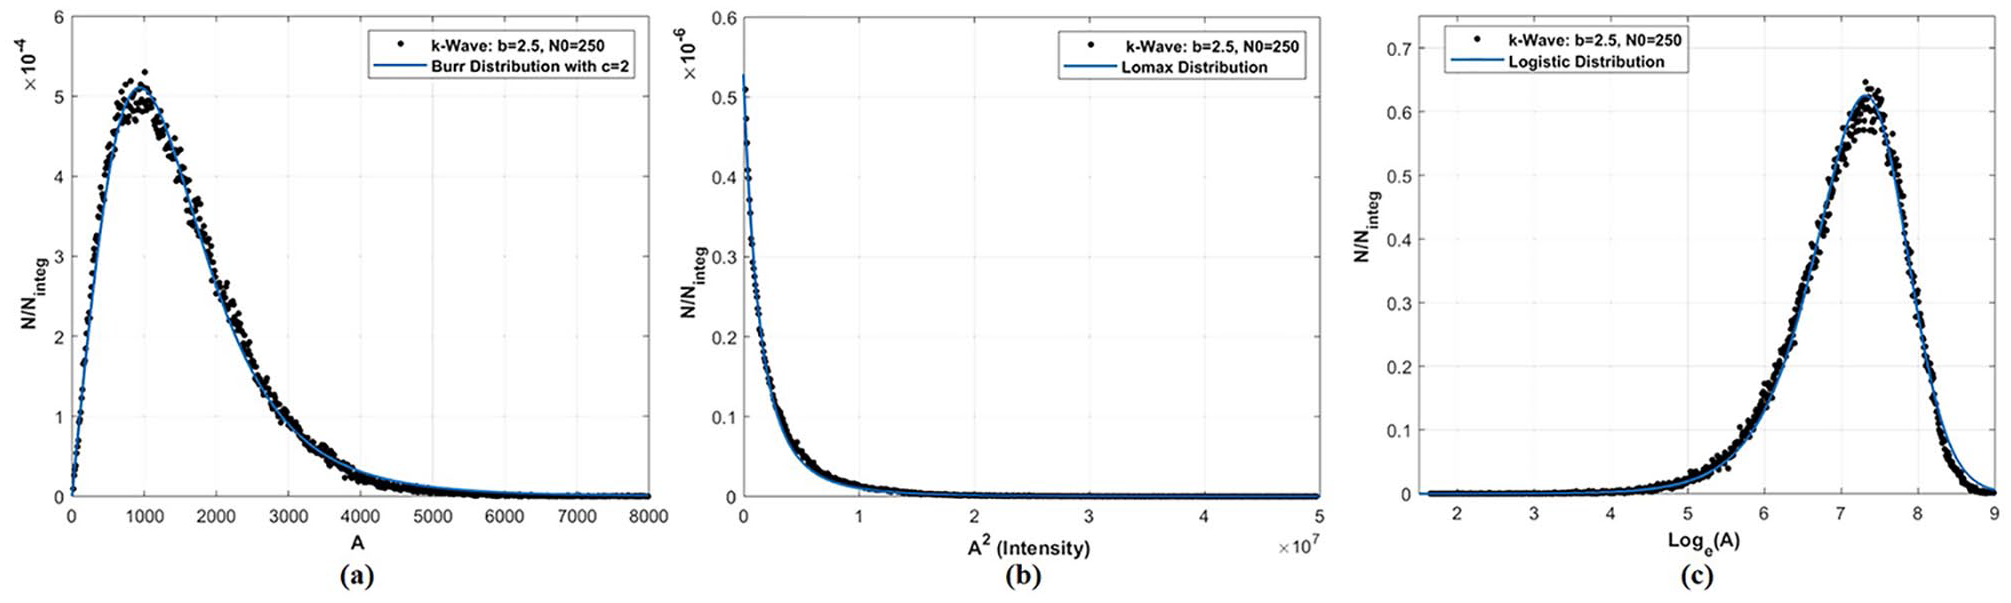
Histogram curve fitting from speckle in Figure 3: (a) Burr
Next, rat livers are examined and ROIs selected within the liver at a depth centered around the transmit focus at 11 mm. Figure 5 provides the B-scan of a normal liver, and Figure 6 illustrates the Burr, Lomax, and logistic fits to the associated histograms. In these cases, the power law parameters are all estimated to be around 3.8. In comparison, a rat liver from the same study but treated with CCl4 so as to create fibrosis, is shown in Figure 7. The corresponding histograms and theoretical curve fits are shown in Figure 8, and in this case the estimated
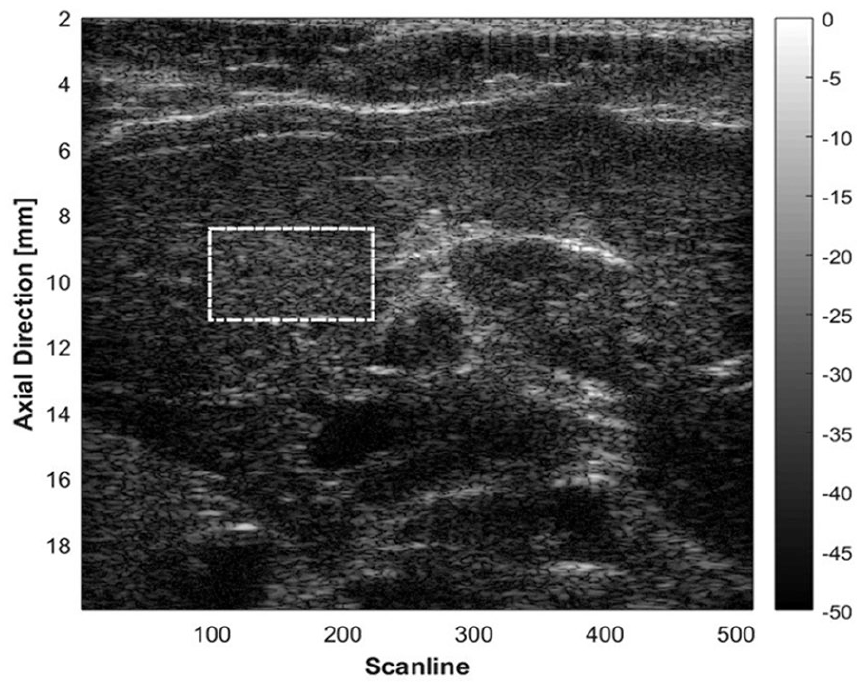
Normal liver B-scan.
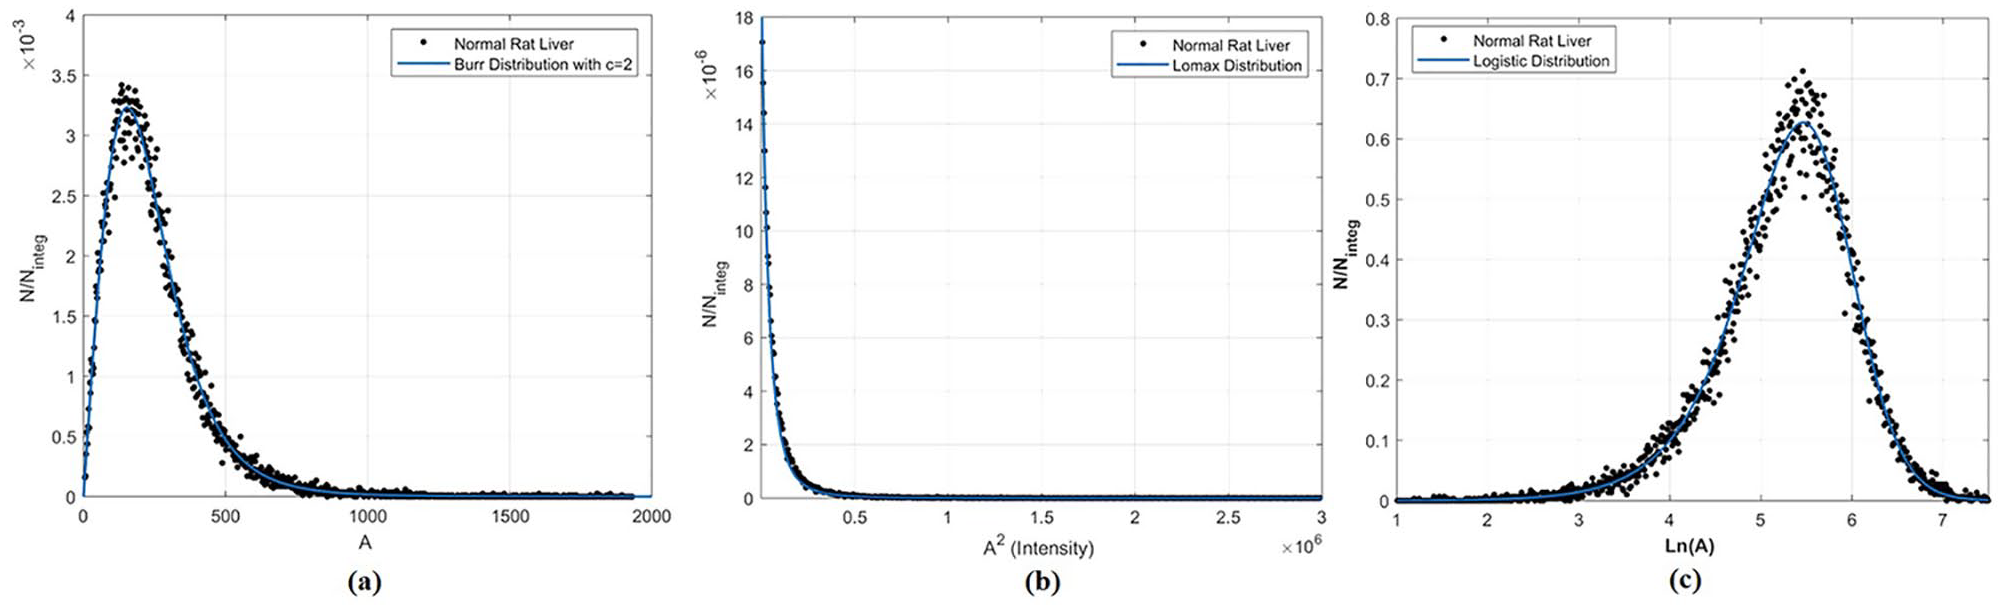
Normal liver histograms from speckle in Figure 5. (a) Burr
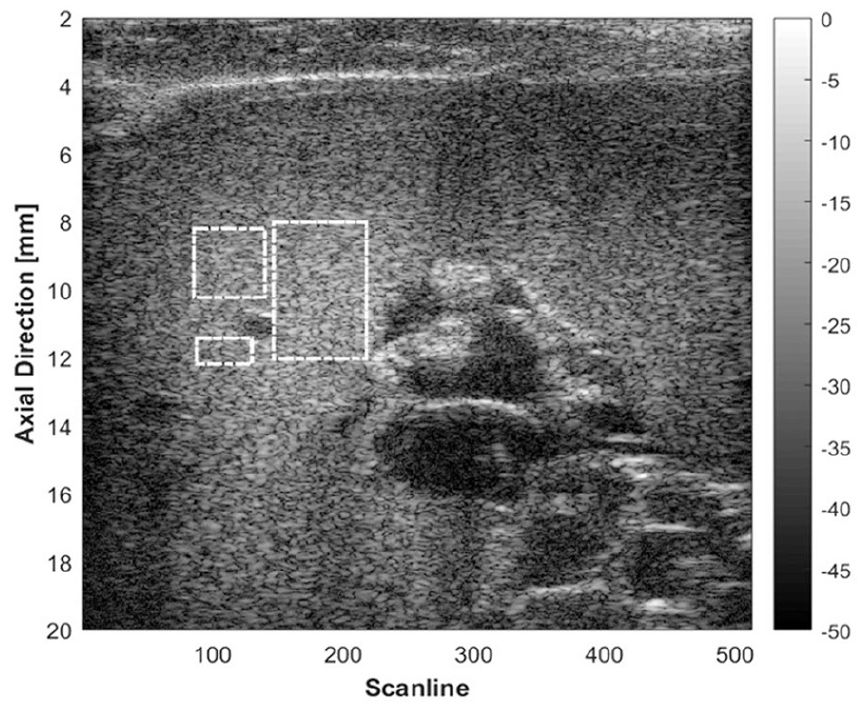
Fibrotic liver B-scan.
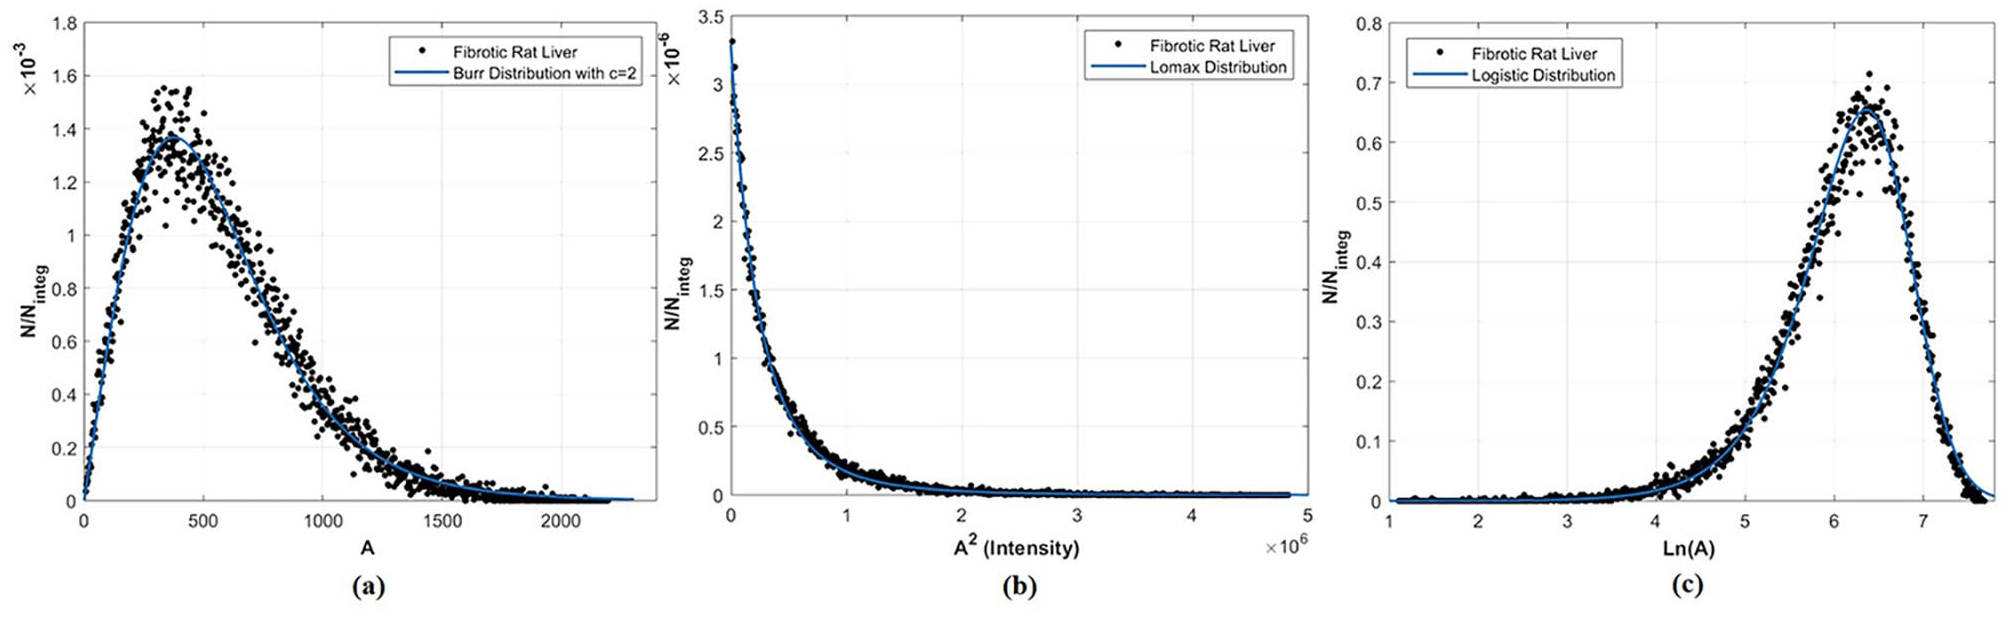
Fibrotic liver histograms from speckle in Figure 7. (a) Burr
Discussion and Conclusion
There are several key assumptions in the derivation of the PDFs that may limit the applicability of the relationships defined in Table 1. First, the convolution model is only an approximation of the complicated wave propagation, but reasonably so for higher f-number focused beams.
33
Furthermore, the fractal model implicitly assumes normal, soft, isotropic tissue with a simple mapping from cylinders of radius
The issue of the relative merits of the three main PDFs (Burr, Lomax, and logistic) is a rich area for discussion. Since these have extensive use in the statistics literature, their behaviors are well known in terms of moments, characteristic functions, and estimators of parameters, and a lengthy catalog of these is beyond the scope of the current discussion. However, the long tail inherent in these distributions places them all in a speckle signal-to-noise ratio of less than the Rayleigh 1.91 theoretical mean to standard deviation.
9
In our investigations, using a minimum mean squared error two-parameter curve fit of different data to each of these, we note that the Lomax distribution for intensity was sometimes the outlier with an elevated
There is an interesting historical twist to these PDFs in that they were originally explored without any reference to ultrasound pulse echo physics. Instead, most of these are associated with economics, income distribution, and complex system lifetimes. The tie between these fields originates with the power law distribution, one of the most ubiquitous laws in natural and human phenomenon. 60 For example in the study of income distribution, a typical country would find many poor people and few rich people. In our ultrasound model, we have many small vessel branches and few large branches. Power law mathematics runs through the core formulas in both fields and then propagates through derived PDFs. Thus, we benefit from the significant work done since the 1940s in fields unrelated to ultrasound. The application of these PDFs to scans from a variety of normal and diseased tissues remains for further investigations.
Footnotes
Acknowledgements
The authors thank Terri Swanson and Dr. Theresa Tuthill of Pfizer Inc. for providing the RF data from their liver studies. Thanks are also due to Professor Nicholas George for his profound insights on and contributions to speckle theory. The authors are grateful to Dr. R. James White and Gary Ge for the 3D vasculature data set and its rendering.
Declaration of Conflicting Interests
The author(s) declared no potential conflicts of interest with respect to the research, authorship, and/or publication of this article.
Funding
The author(s) disclosed receipt of the following financial support for the research, authorship, and/or publication of this article: This work was supported by National Institutes of Health grant R21EB025290.