
Abstract
Needle visualization in the ultrasound image is essential to successfully perform the ultrasound-guided core needle biopsy. Automatic needle detection can significantly reduce the procedure time, false-negative rate, and highly improve the diagnosis. In this paper, we present a CNN-based, fully automatic method for detection of core needle in 2D ultrasound images. Adaptive moment estimation optimizer is proposed as CNN architecture. Radon transform is applied to locate the needle. The network’s model was trained and tested on the total of 619 2D images from 91 cases of breast cancer. The model has achieved an average weighted intersection over union (the weighted Jaccard Index) of 0.986, F1 Score of 0.768, and angle RMSE of 3.73°. The obtained results exceed the other solutions by at least 0.27 and 7° in case of F1 score and angle RMSE, respectively. Finally, the needle is detected in a single frame averagely in 21.6 ms on a modern PC.
Introduction
The core-needle biopsy is a necessary procedure helping to diagnose or to rule out medical condition. During this procedure, a hollow needle is inserted and a sample of tissue collected. Correct diagnosis highly depends on the accuracy of the needle puncture. Therefore, biopsies are performed with the assistance of medical imaging and are regarded as a highly accurate method. Breast cancer is one of the most common diseases diagnosed by biopsy.
Breast cancer is a disease in which a breast tissue cells proliferate excessively, forming larger and larger tumor. It usually originates in the glandular or ductal cells and affects mostly women. It is stated that in 2019 in the United States, there were 316,700 women diagnosed with breast cancer and 2670 men. It caused death of 41,760 women and 500 men in 2019 1 in the USA. In recent years, there has been an increasing trend in both morbidity and mortality caused by breast cancer.2,3
To obtain an accurate and reliable diagnosis of breast tumor and start the right treatment it is necessary to perform various medical imaging techniques. Ultrasound-guided core-needle biopsy is especially important. During this procedure, the breast is punctured with a biopsy gun equipped with an 18 to 14-gauge cutting needle (a core-needle) and ca. 3 to 5 tissue samples are taken. The correct diagnosis highly depends on the accuracy of the needle puncture. The samples are assessed histopathologically and molecularly, which leads to a final diagnosis.4,5 The diagnostic accuracy reaches 95.5%, 6 if the procedure is performed correctly.
The ultrasound-assisted core-needle biopsy is also used to diagnose other organs’ focal lesions, for example, lungs, kidneys, liver, prostate, or lymphatic nodules. Furthermore, ultrasonography is employed during therapeutic punctures, such as the pneumothorax decompression 7 or the abdominal paracentesis. 8 Snapshots captured at the procedure may be included in patient medical record.
The clear visualization of the needle in the ultrasound image is only possible if it is correctly positioned in relation to the ultrasound beam. If the needle and the beam are perpendicular, there is a strong specular reflection that enhances the needle’s image quality. The image is often accompanied by a reverberation artifact (so-called “comet-tail artifact”). 9 Additionally, adjacent clear longitudinal anatomical structures (e.g., borders of bones or fasciae) may disturb the process of needle segmentation and prevent its correct location. 9 If the needle does not lie parallel to the beam’s plane, it is visible only partially at the intersection with the plane. Additionally, the process of needle segmentation and its correct localization may be disturbed by adjacent clear longitudinal anatomical structures (e.g., borders of bones or fasciae). 9
There are two main approaches for needle detection: hardware and software-based one. The hardware-based approach is determined by a tracking device and sensors attached to the needle and ultrasound probe. The sensors are localized by an optical or electromagnetic technique. 10 A full system calibration needs to be performed beforehand. 11 Hardware-based methods are sensitive to errors caused by the needle’s flexibility unless the sensor is attached directly to its tip. 12
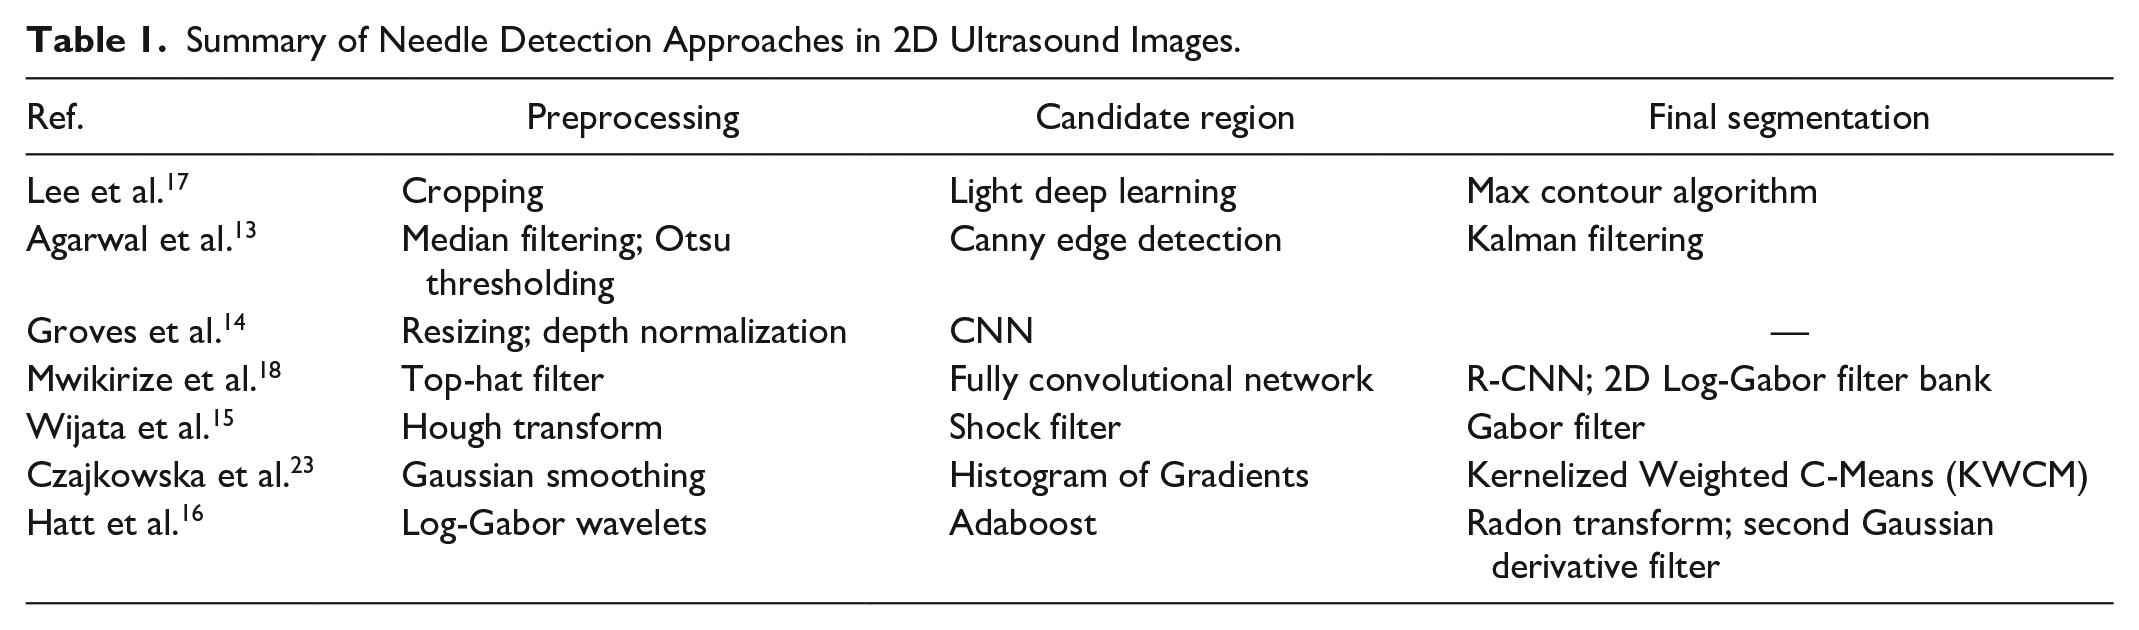
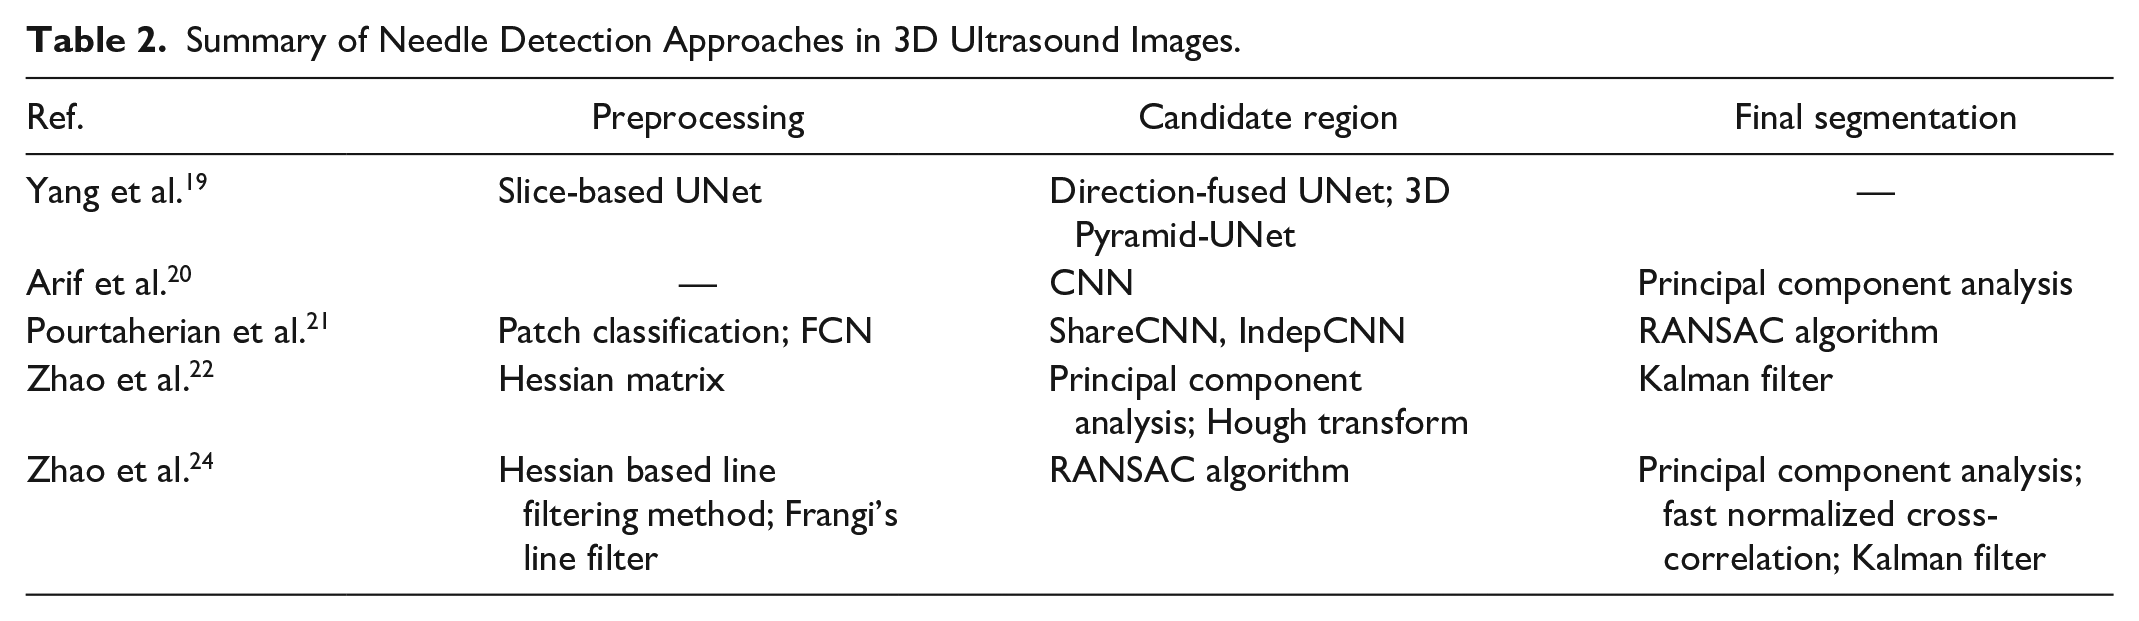
On the other hand, software-based approaches cover a wide range of image processing algorithms, from classic to novel deep learning methods. These methods detect a needle in two- or three-dimensional ultrasound images. They are summarized in Tables 1 and 2 for 2D and 3D images, respectively. To enhance bright linear structures, these methods employ mainly the following pre-processing: Otsu tresholding, 13 Top-hat filter, 14 Hough transform, 15 or Log-Gabor wavelets. 16 The machine-learning methods are widely used for needle segmentation process.14,17–21 The needle covers less than 1% of the image’s surface, so its segmentation becomes a very challenging task. Therefore the next step of image processing involves the computation of its trajectory. A variety of methods have been proposed from a simple selection of the maximal segmented object 17 to more advanced techniques as Kalman filter,13,22 log-Gabor filter, 18 Gabor filter, 15 or Radon transform. 16
Summary of Needle Detection Approaches in 2D Ultrasound Images.
Summary of Needle Detection Approaches in 3D Ultrasound Images.
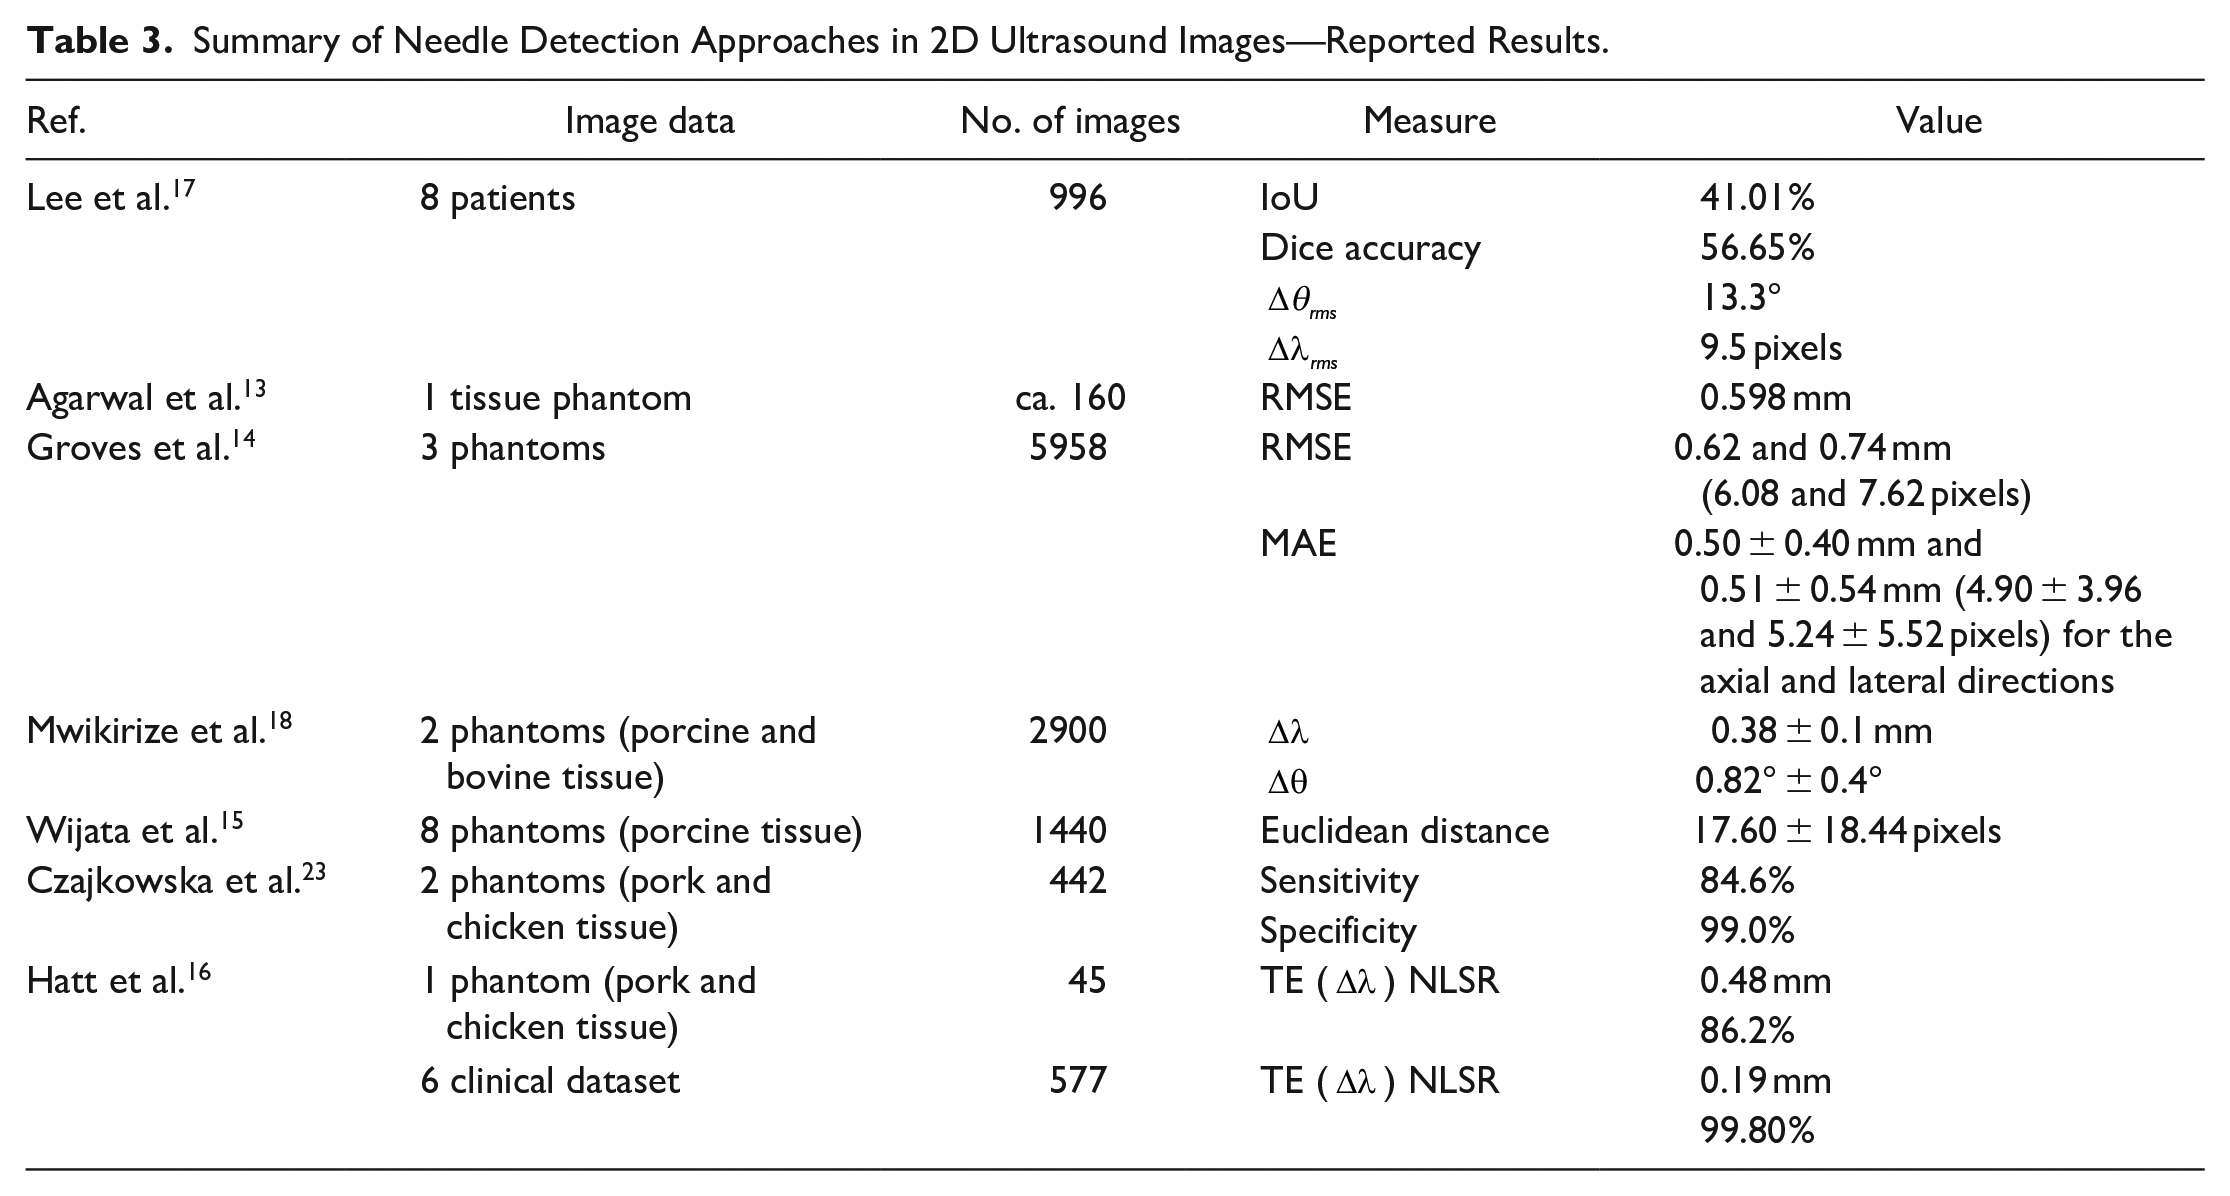
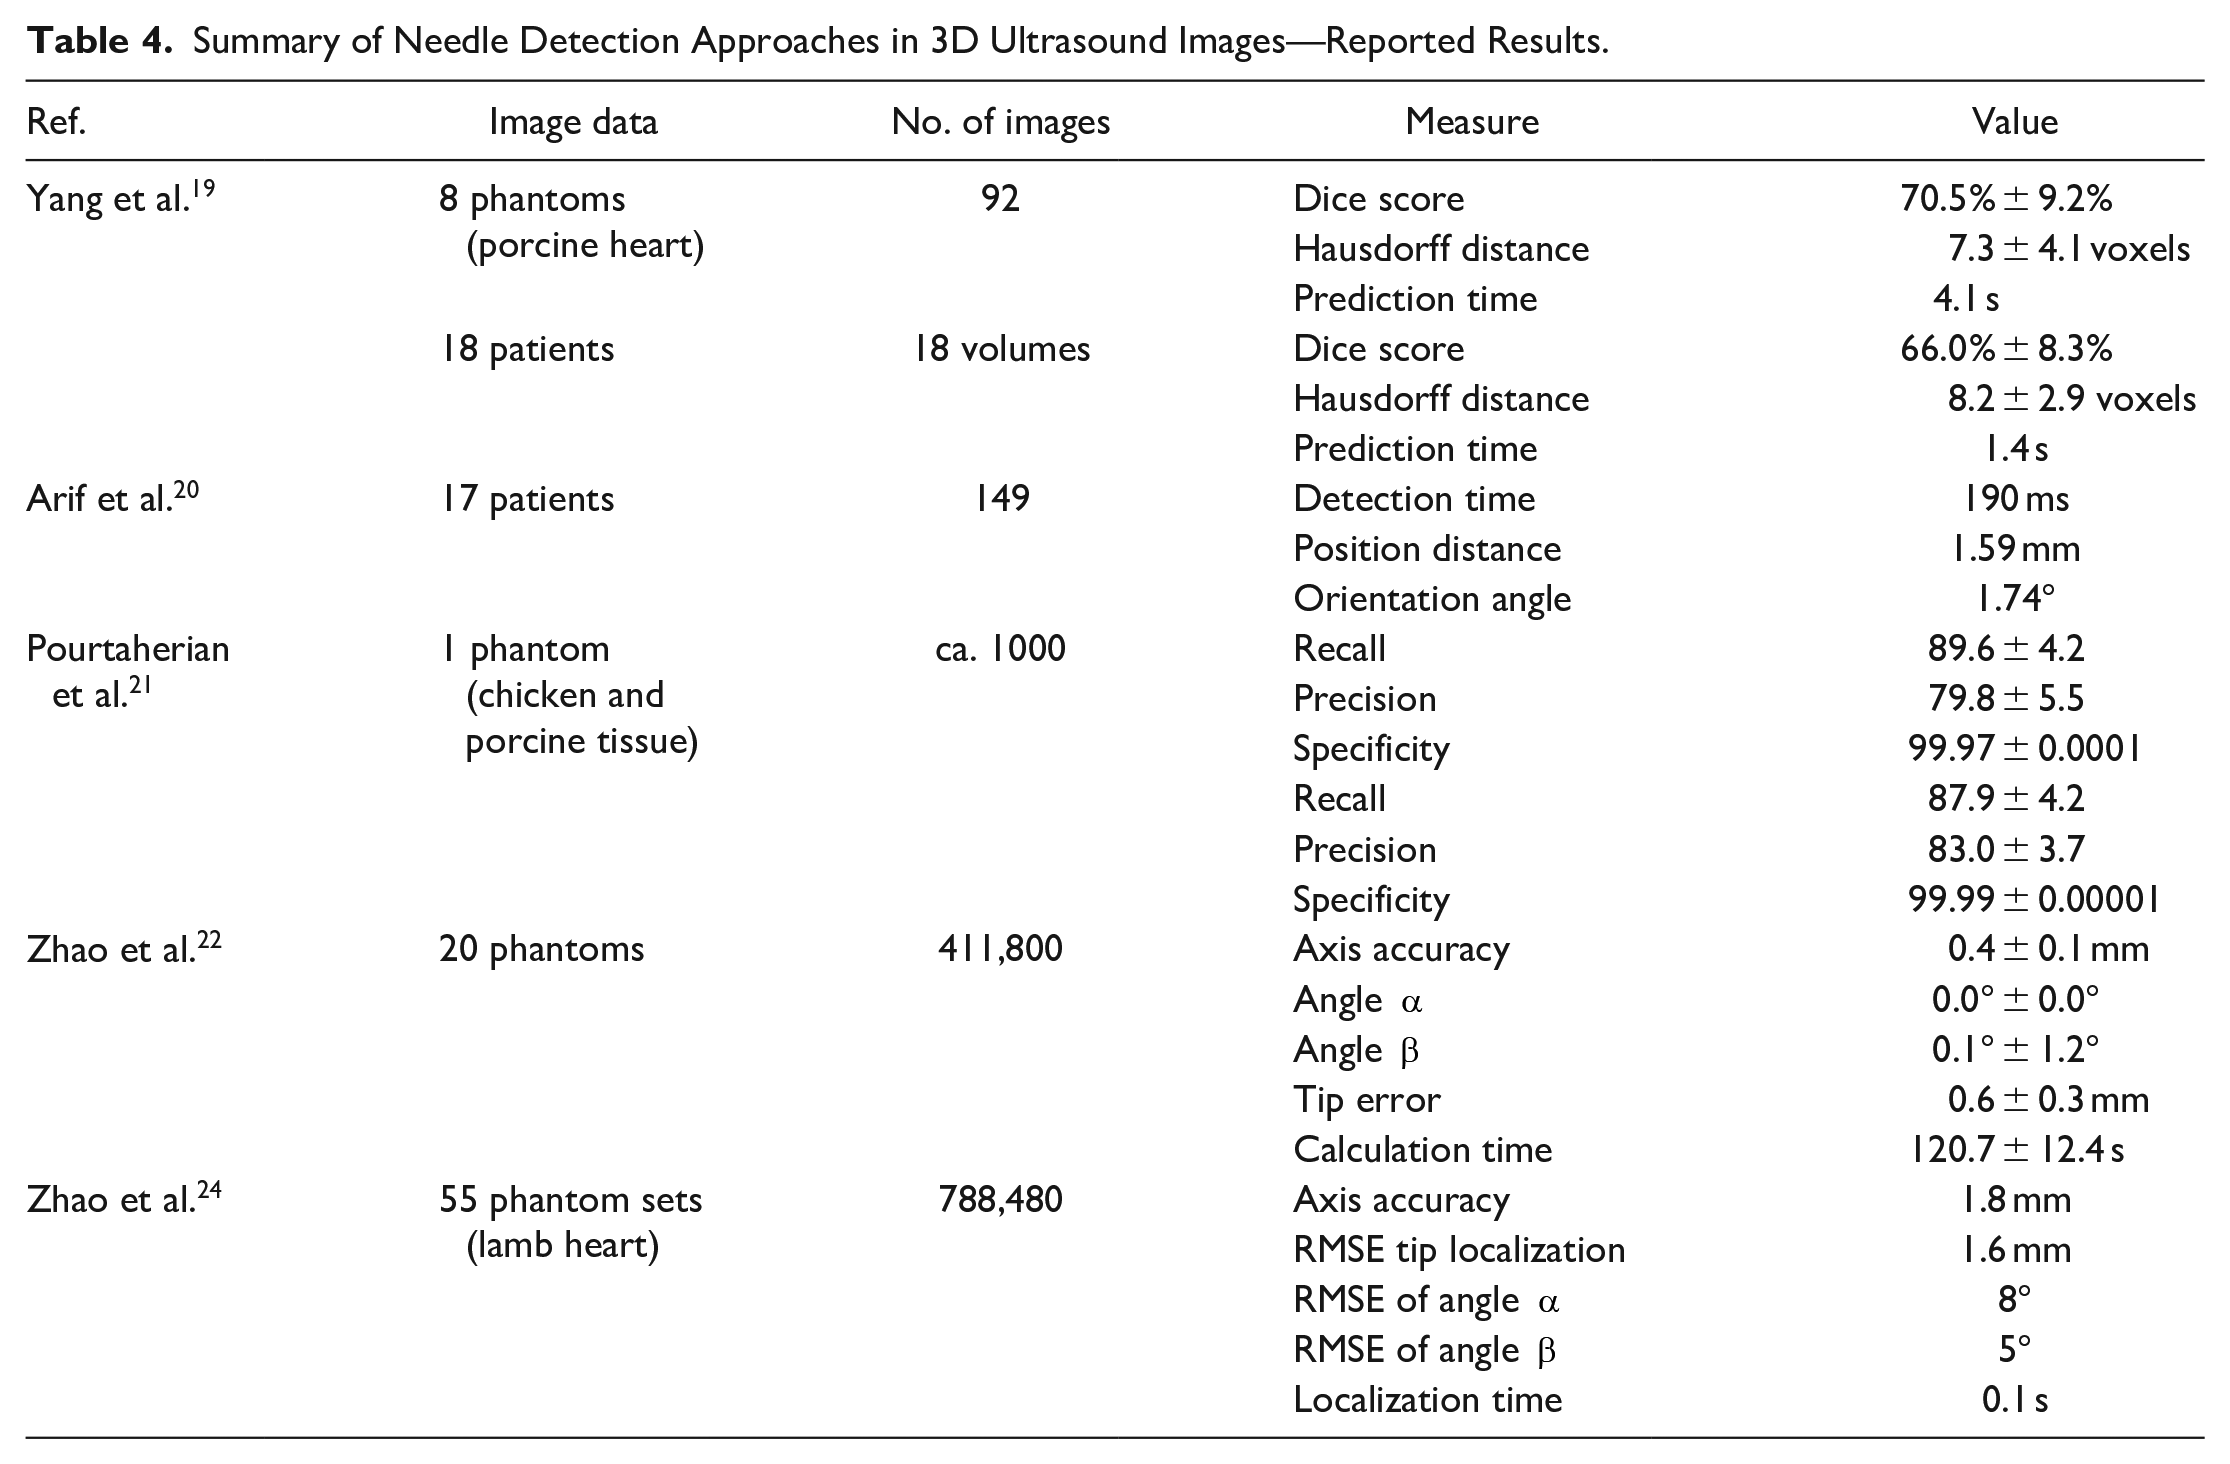
Other needle segmentation approaches and the datasets, accompanied by the obtained segmentation results, are described in Tables 3 and 4 for 2D and 3D images, respectively. The vast number of automatic needle detection methods is based on animal phantoms, mainly porcine and chicken.15,16,18,19,21,23 A few thousands of phantom images were used for training these methods. The phantom-based databases are very common. Nevertheless, it is vital to remember that human tissues are more heterogeneous with a number of artifacts, therefore it is important to provide methods based on clinical data, even if their number is smaller. Unfortunately researches employing human in vivo images are infrequent and do not process more than a thousand 2D16,17 or 3D19,20 images.
Summary of Needle Detection Approaches in 2D Ultrasound Images—Reported Results.
Summary of Needle Detection Approaches in 3D Ultrasound Images—Reported Results.
In this paper, a method using convolutional neural networks to detect a core needle in the 2D ultrasound images is presented. The method enables determination of the needle trajectory in real-time, and also when only partially visible in the imaging plane. The method was evaluated on a database containing 619 images from 91 cases of a breast cancer. No artificial or phantom images were used in the workflow.
Materials
The images used in this study were obtained from two databases. The first one, containing 81 ultrasound images recorded for 58 patients, is publicly available. 25 Images in the database feature various dimensions and acquisition parameters. There is no information about the devices, the images were taken with. The database was used in other research studies, for example by Kriti et al. 26 to evaluate segmentation methods.
The second database consists of 538 two-dimensional ultrasound images from 204 core-needle biopsies performed by radiologists on 33 patients. 27 The images were recorded using an S-Video to USB converter (DFG/USB2pro, Imaging Source, Bremen, Germany) connected to an ultrasound device (EZU-MT25-S1, Hitachi, Tokyo, Japan) with a linear transducer EUP-L65. The ultrasound beam’s depth ranged from 25 to 40 mm depending on the lesion’s location, and the frequency of the ultrasound device ranged from 6 to 14 MHz. The images were captured with a resolution of 768 × 576 at 25 fps.
We merged both databases, and an expert delineated the needle in each image on a PC workstation using a freehand drawing tool on a graphical editor. Convex hull was computed for each delineation, and the internal pixels were filled. These segmented sets of pixels are the ground truth data.
Methods
The developed method for detecting the needle in ultrasound images is fully automatic, consisting of initial pre-processing, image segmentation using a convolutional neural network (CNN), and finally, the needle trajectory detection. These steps are presented in Figure 1.
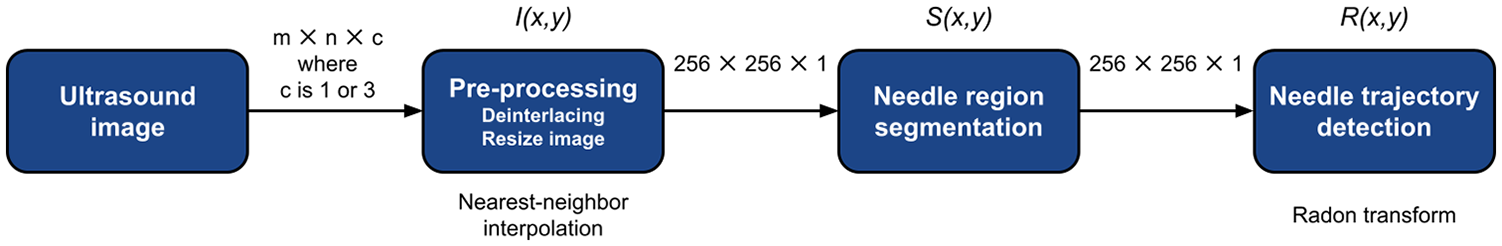
A workflow of presented method for a needle detection in ultrasound images.
Image Pre-processing
The images from the second database described in Section Materials had contained superfluous data at their peripherals, so they were cropped at the appropriate borders. Motion artifacts of the video signal were deinterlaced using nearest-neighbor interpolation.
All the images were converted from RGB colorspace to 8-bit grayscale and resized to fit a CNN requirements (256 × 256 pixels) using nearest-neighbor interpolation. A pre-processed image is denoted in the paper as
Convolutional Neural Network in Needle Region Segmentation
The architecture and the parameters of the developed convolutional network were chosen experimentally. We tested various types of semantic segmentation architecture (LinkNet, U-Net, SegNet). Eventually, the parameters featuring enough effectiveness were found. The final network architecture and the parameters are summarized in Figure 2. All the network source files along with a MATLAB script have been published on Mendeley site. 28
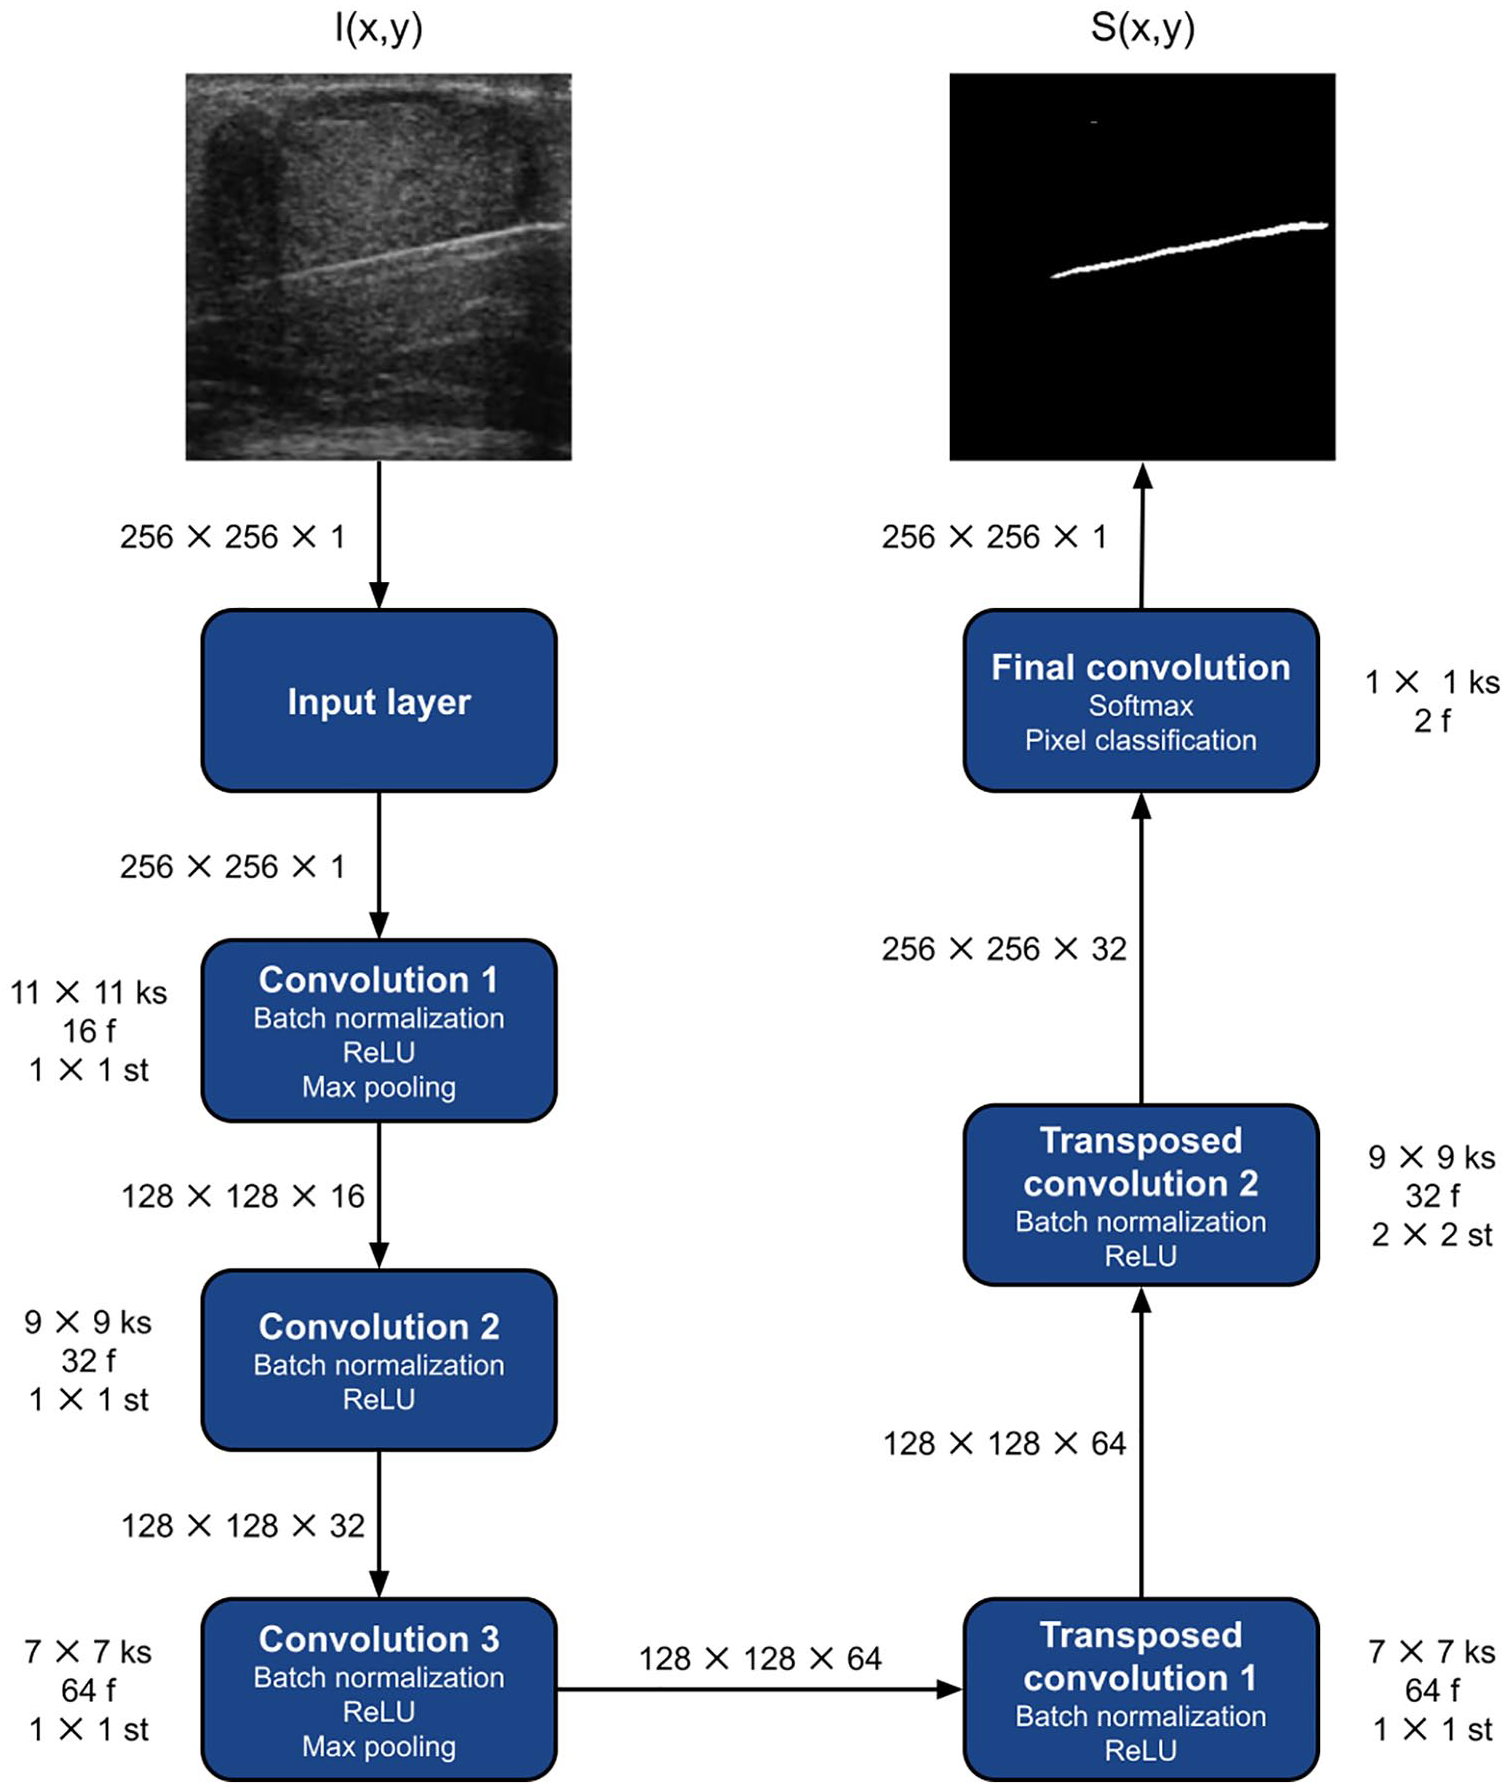
A convolutional neural network architecture developed for segmentation of the needle.
The input layer accepts single-channel grayscale images
The proposed network is divided into two parts: convolution and deconvolution. Convolutional blocks consist of a convolution layer, a normalization layer, and a rectified linear unit (ReLU layer). In the first and third block, the max-pooling layer (2 × 2 stride over a 3 × 3 pool) was added. Sizes of the kernels of the subsequent convolutional layers are 11 × 11, 9 × 9, and 7 × 7. The size was chosen in order to detect locally larger objects. The number of filters for successive convolution layers increases with the power of 2 starting at 16. The padding takes the same values.
The deconvolution blocks consist of a transposed convolution layer, a normalization layer, and a rectified linear unit (ReLU layer). Similarly, the kernel sizes are 7 × 7 and 9 × 9 with 64 and 32 filters, respectively. The second convolution block has a 2 × 2 stride to increase the output image.
The final classification is done using the convolution layer, softmax, and pixel classification layer using generalized Dice loss for semantic segmentation.
The network was trained using the adaptive moment estimation (ADAM) optimizer. Data augmentation was also performed with the following parameters: translation by a random number of pixels from an integer set
The result of the developed CNN is a binary mask
Radon Transform in Needle Trajectory Detection
The needle’s trajectory is finally determined in the image by applying the Radon transform
29
on the
Evaluation Methods
The evaluation methods can be divided into two parts: The former evaluate the quality of segmentation by comparing the area of the ground truth (
We assessed the segmentation result using the following measures: global accuracy, accuracy, intersection over union (IoU), weighted IoU, and F1 score:
Global accuracy reports the number of correctly classified pixels, regardless of class, up to the total number of pixels. It is defined as follows:

where TP, TN, FP, and FN are the numbers of true positive, true negative, false positive, and false negative pixels, respectively.
Accuracy indicates the fraction of correctly identified pixels averaged over the classes.
IoU, also known as the Jaccard similarity coefficient, is the most commonly used metric. IoU metric measures the similarity between two sets. It is defined as the quotient of the cardinality of the sets’ intersection and union.
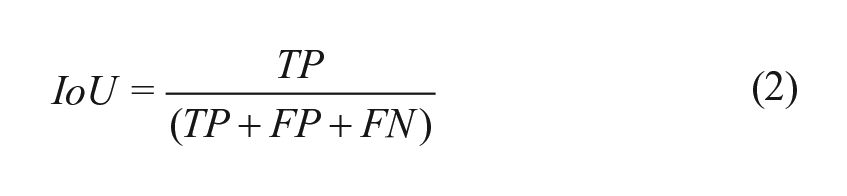
Weighted IoU of each class, weighted by the number of pixels in that class. This measure is appropriate for unevenly sized classes because it can reduce the impact of errors in small classes. This situation occurs in our data, as the needle area is very little compared to the background.
F1 Score indicates how well the predicted boundary of each class matches the actual boundary. F1 Score is the metric used when comparing human assessed data. The formula is as follows:
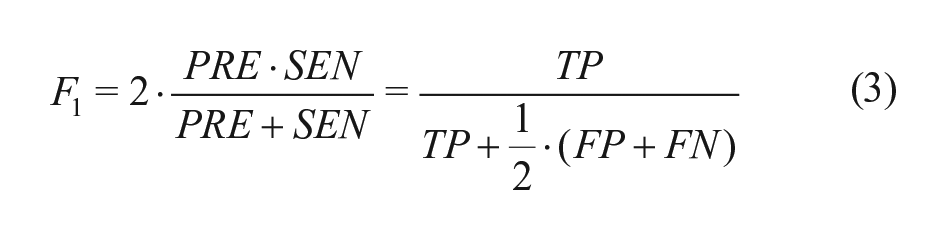
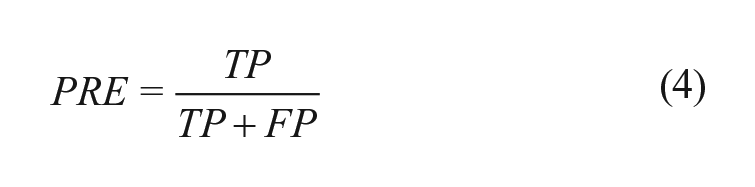
where PRE is the precision that determines the repeatability of the obtained results:
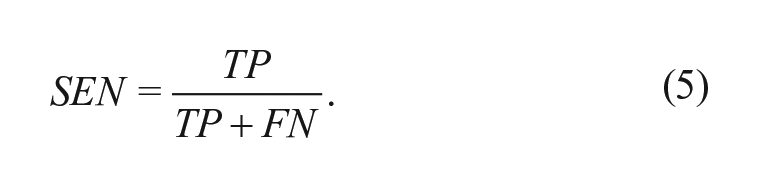
and SEN is the sensitivity that determines the ratio of correctly identified pixels to the sum of true positives and false negatives:
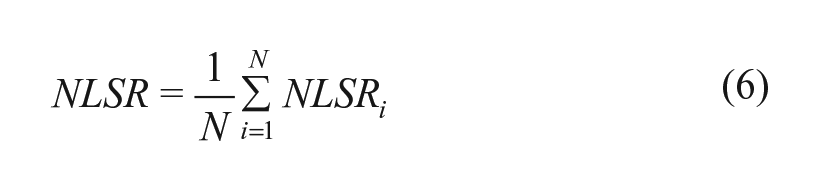
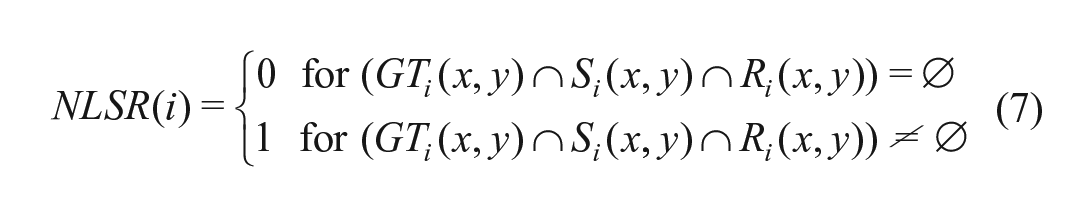
Furthermore, the needle localization success rate (NLSR) was computed. It shows the ratio of
A case
The evaluation values indicating the correctness of the needle trajectory detection (distance and angle) are
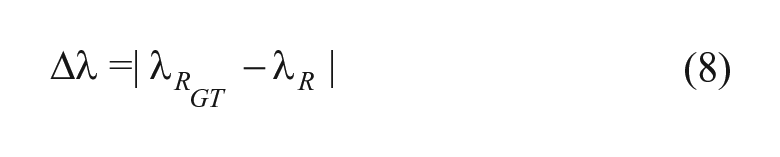
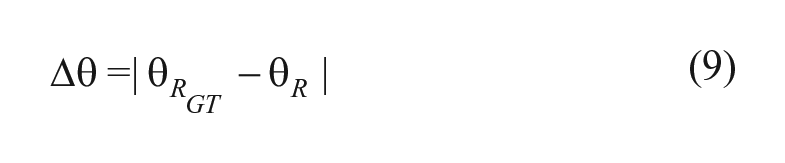
where
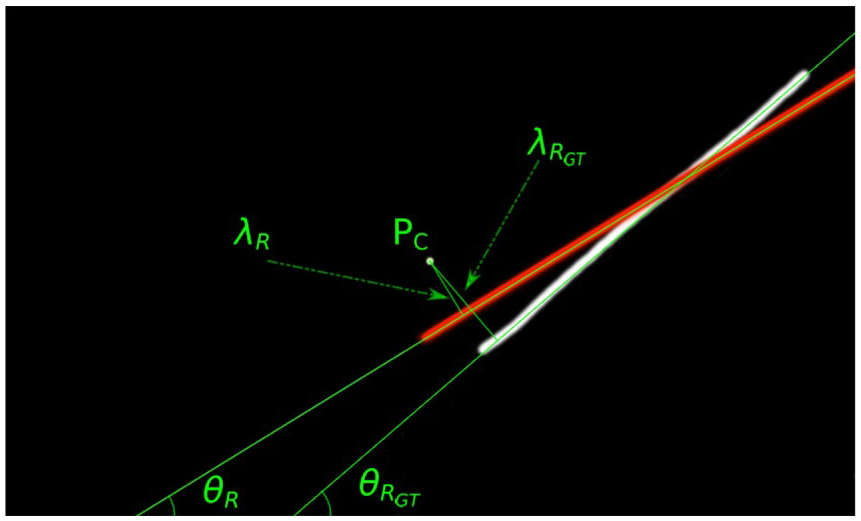
An explanation of the evaluation parameters. Red line—the needle trajectory computed by the proposed method. White line—the expert’s delineation (the ground truth).
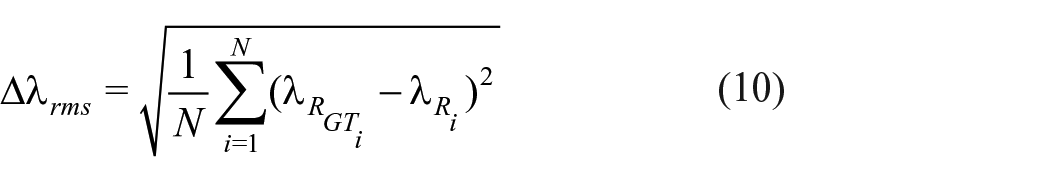
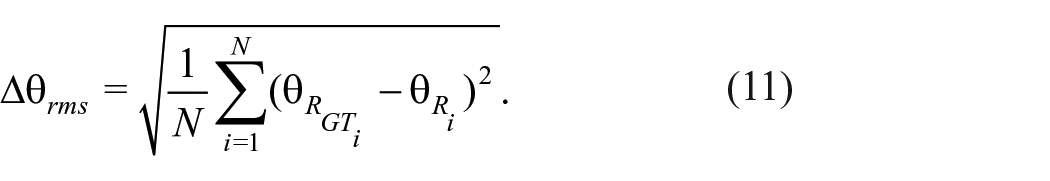
Finally, the root mean square distance error (
Experiments
The combined database was randomly divided into three sets based on patient identifiers: a training set, a validation set, and a test set, in the relation 0.8:0.1:0.1. Along with the training and validation sets, we conducted the proposed model training, and using the test set, we checked the model effectiveness. We repeated the data sampling, training, and testing procedures 15 times.
Under the same assumptions, we conducted the training of a network proposed by Lee et al. 17 and a statistical classifier described by Hatt et al. 16 These methods were chosen for comparison because they also employed databases with real human tissue images: Lee et al. gathered 996 clinical images from eight patients, while Hatt et al. worked with a database consisting of 577 clinical images (and a few dozen phantom images). We compared our segmentation and classification results to these methods.
The proposed and the Lee methods were implemented in MATLAB 2020b environment. The Hatt method was implemented in Python 3.8.5. The experiments were run on Windows 10 with a hardware platform containing AMD Ryzen 9 3900 (CPU), 32 GB RAM 3 GHz, NVIDIA RTX Titan 24 GB (GPU).
Running a single experiment on a trained network took averagely 22 ms for the proposed method, 35 ms for the Lee method, and 7.64 seconds for the Hatt method.
Results of the Needle Segmentation
The achieved segmentation results were divided into three categories: the best (correct), avarage, and incorrect. They are all are presented in Figures 4 to 6, respectively. Even for average values of IoU, the presented trajectory lies very close to the ground truth.
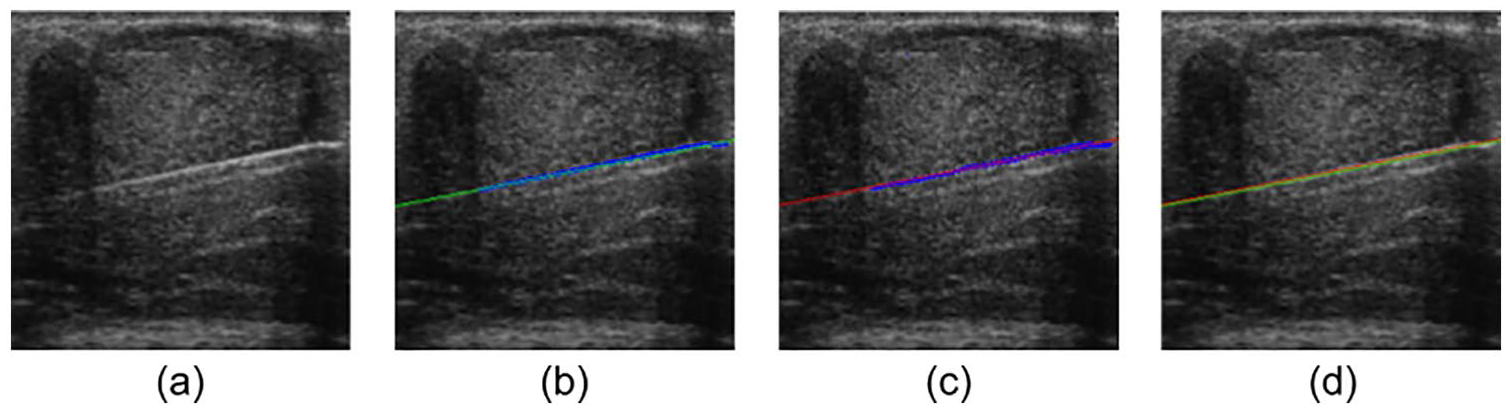
The best result of needle segmentation using the proposed method in relation to IoU. (a) Original ultrasound image. (b) The expert’s delineation (blue) with computed trajectory of the needle (green). (c) Segmentation result of the proposed method (blue) with computed trajectory of the needle (red). (d) The computed trajectories from (b) and (c) presented together.
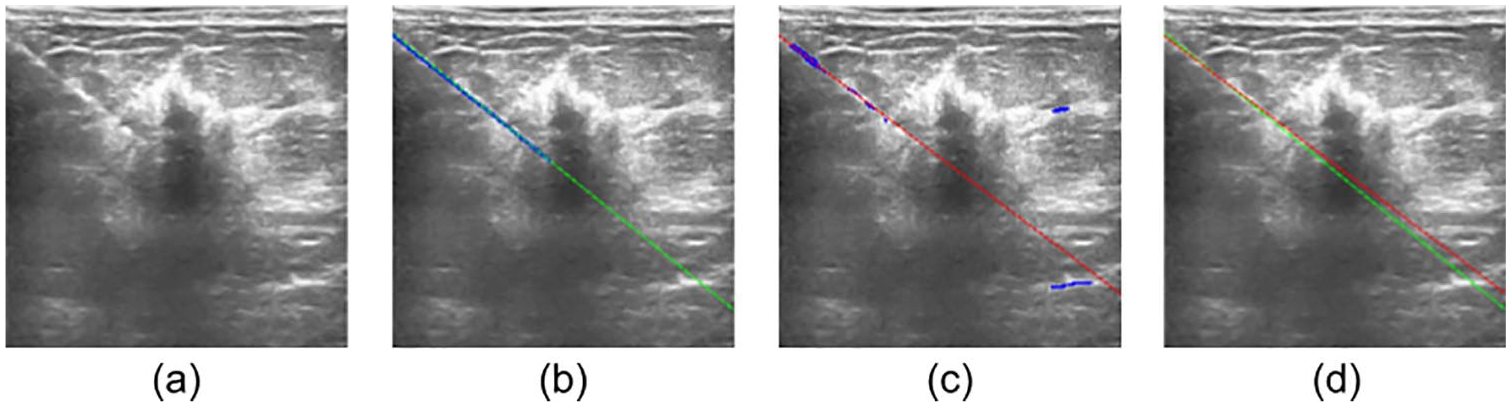
The result of segmentation by the proposed method corresponding to the average values of
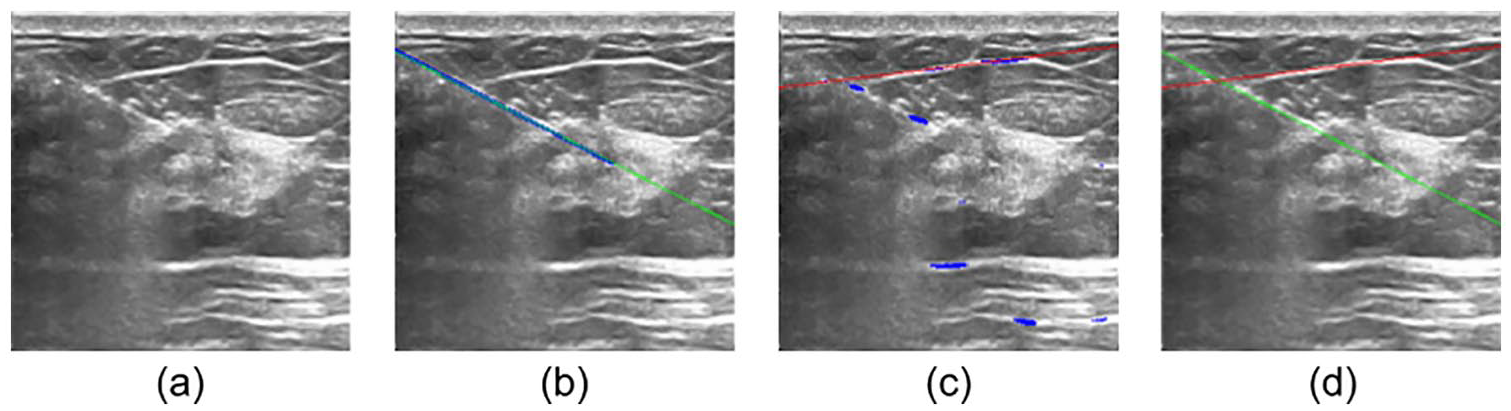
An incorrect result of needle segmentation using the proposed method. (a) Original ultrasound image. (b) The expert’s delineation (blue) with computed trajectory of the needle (green). (c) Segmentation result of the proposed method (blue) with computed trajectory of the needle (red). (d) The computed trajectories from (b) and (c) presented together.
The segmentation process may be disturbed by long bright elements presented in the breast tissue such as borders of the lobes. These structures may be incorrectly recognized as a needle, for example as in Figure 6.
An assessment of the segmentation results was conducted for the methods based on convolutional neural networks, that is the proposed method (PM) and the one by Lee et al. 17 We also compared the results with the method described by Hatt et al. 16 The following metrics were computed: global accuracy, accuracy, IoU, weighted IoU, and F1 score. The results for the experiments are summarized in Table 5.
Evaluation of the Needle Segmentation for the Proposed Method (PM), the Lee Method, and the Hatt Method.
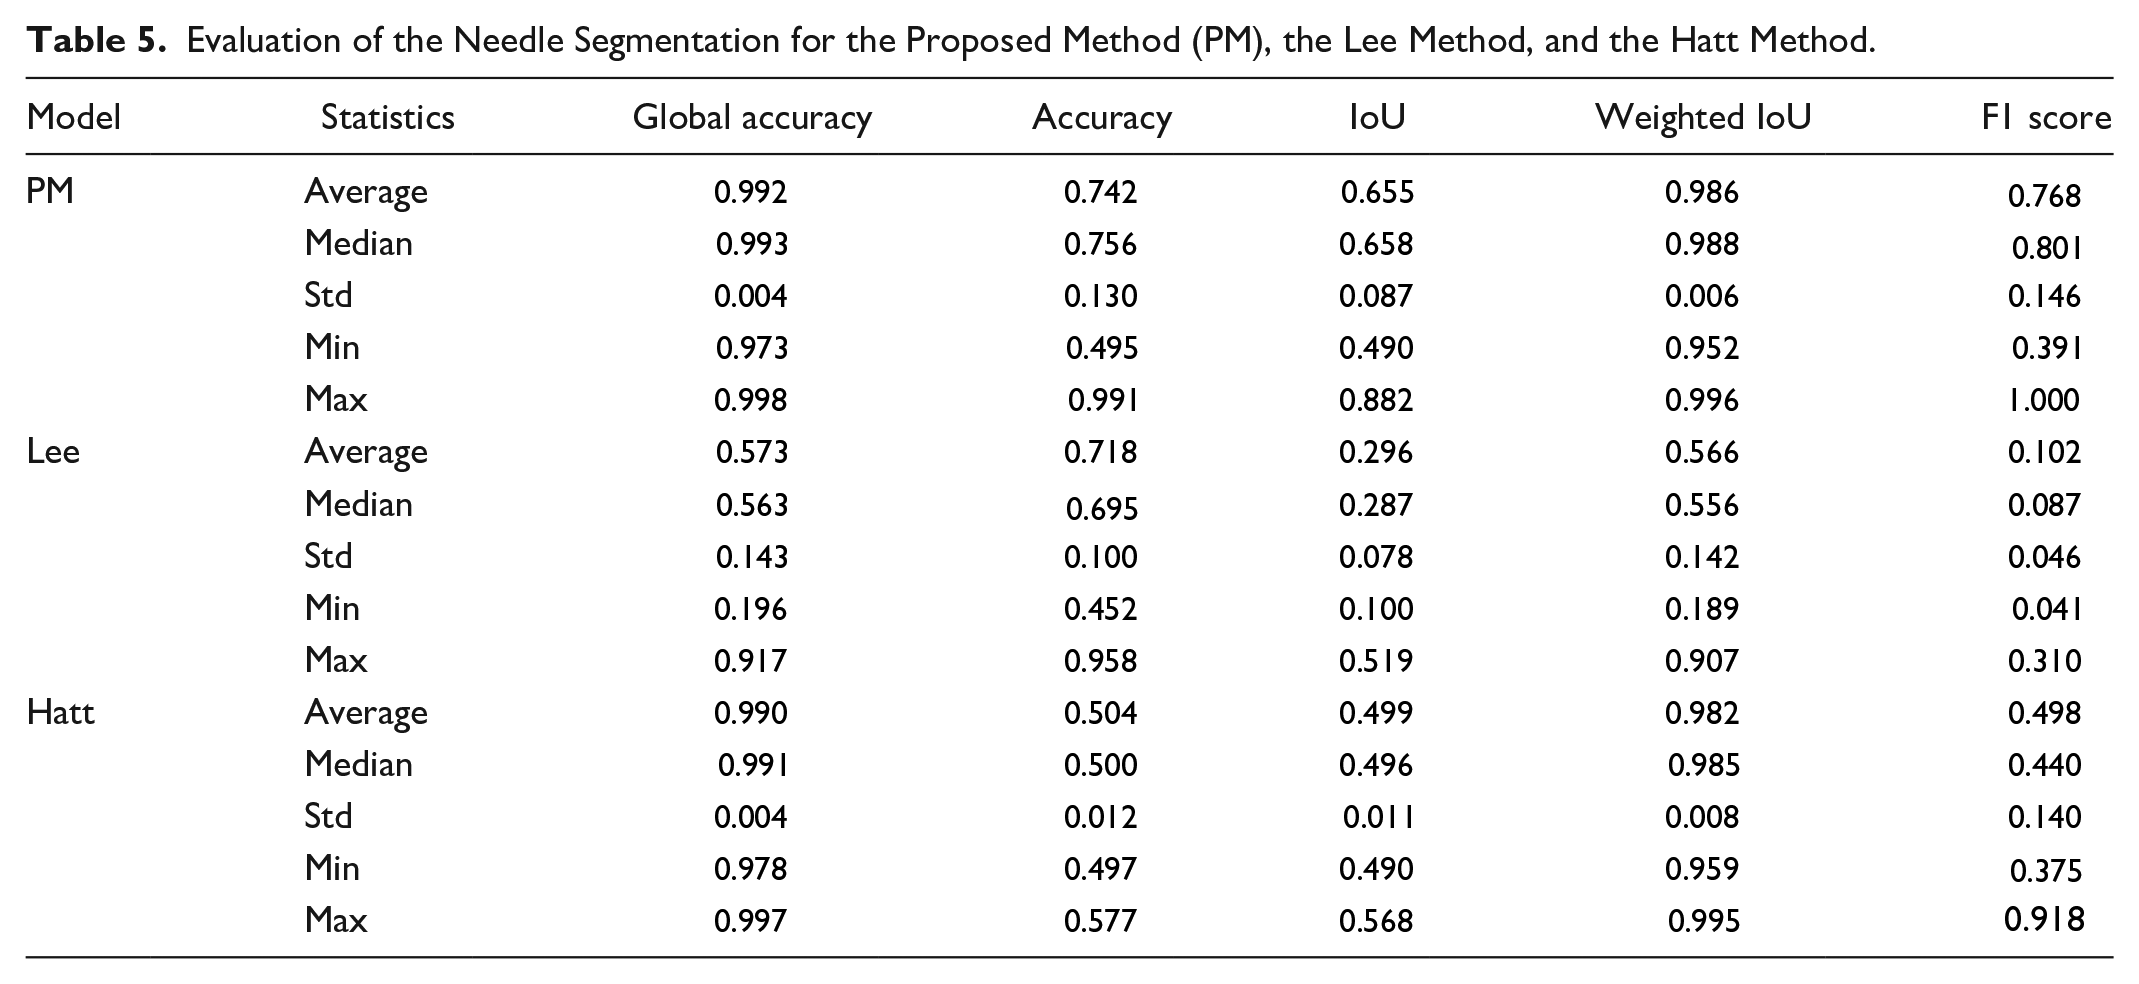
The global accuracy of the proposed method and the Hatt method are similar (0.992 ± 0.004 vs. 0.990 ± 0.004). The global accuracy for these methods are significantly higher than for the Lee method (0.573 ± 0.143). As the needle area is very little compared to the background, this result reflects primarily the background classification. On average, the region of the segmented needle represents 0.76% ± 0.38% of the ultrasound image. The relatively low value of the Lee method results from spilling the segmentation mask of the needle.
The accuracy does not differ significantly between the proposed method and the Lee one (0.742 ± 0.130 vs. 0.718 ± 0.100). In case of the Hatt method, the accuracy is lower than in other cases (0.504 ± 0.012). This parameter is a measure of all correctly classified pixels in the classes.
Much higher values of IoU for the proposed method than for the Hatt and the Lee method (0.655 ± 0.087 vs. 0.499 ± 0.011 and vs. 0.296 ± 0.078) prove lower amount of false positives and false negatives obtained by our method.
The weighted IoU for the proposed network is similar to the Hatt one (0.982 ± 0.008 vs. 0.986 ± 0.006) but we observed higher F1 score for our method (0.768 ± 0.146) than for the Hatt method (0.498 ± 0.140).
Significantly higher values of Weighted IoU and F1 Score for our and the Hatt methods than for the Lee one also indicate that the proposed method was trained properly and leads to correct results.
After proving the non-normality for all the analyzed parameters distributions using the Shapiro-Wilk test, we applied the Wilcoxon-signed rank test to compare the measures of the segmentation results between all three methods. The test showed that our method yielded significantly larger values for all the parameters described in Table 5 with
Results of the Needle Trajectory Detection
The average angle of insertion of the needle into the breast in the images of the database used is 70.61° ± 9.14°. Very similar values were recorded by Mwikirize et al. 18 in their research.
The needle localization success rate (NLSR),
Needle Trajectory Errors for the Proposed Method (PM), the Lee, and the Hatt Method. The Symbols are Explained in Section Evaluation Methods.
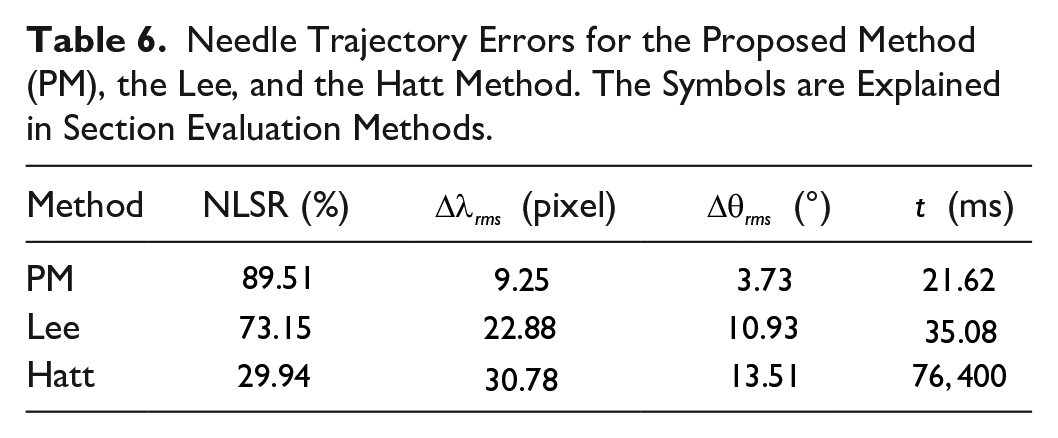
The average trajectory detection errors calculated for our method are 2.24 pixels and 1.29° for
Evaluation of the Needle Trajectory Localization Errors for the Proposed Method (PM), the Lee Method, and the Hatt Method.
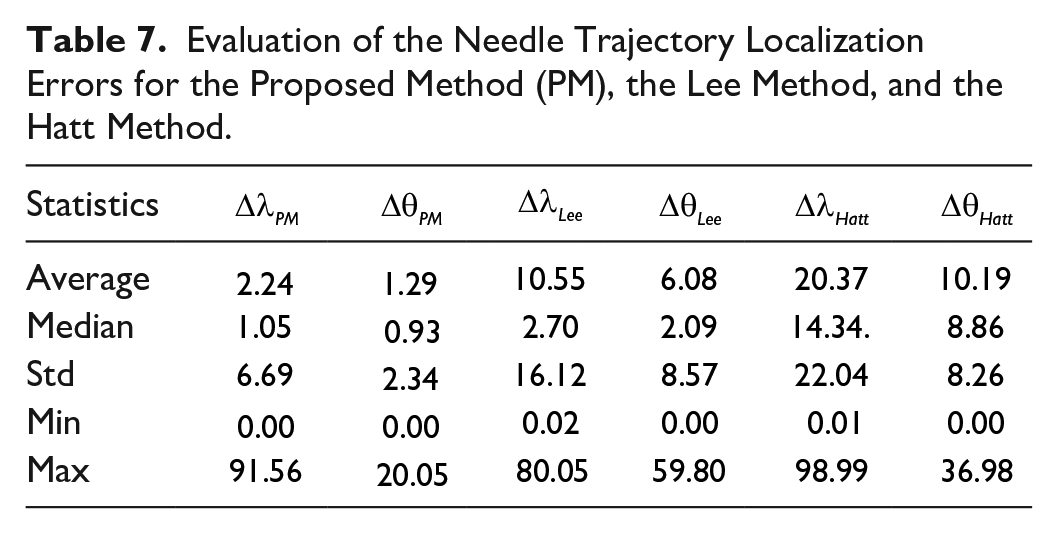
We performed a statistical analysis of the obtained results. Verification of normal data distribution was performed using the Shapiro-Wilk test that proved no normality. The Wilcoxon signed rank test was performed to verify differences in the determined values
Discussion
An automatic detection of a biopsy needle is a challenging task so numerous attempts have been made to address this issue. Nevertheless, all of them have some shortcomings.
After implementing the Lee method
17
and training it on our database, we received significantly lower segmentation values but higher final results of localization. The method was the same but databases were different. The results confirm the importance of providing database diversity. Similarly, the Groves method
14
was tested on a very uniform database. The authors used water-filled phantoms. Although the method yields good results, it is hard to judge how this would work with real images. The limitation of the Mwikirize method
18
is a restricted range of injection angles. This range was specified by the authors as 45° to 75°. In our database, we obtained an average injection angle equal to
A workflow for a needle trajectory detection based solely on its segmentation does not lead to success. The needle covers few pixels, so an under-segmentation or over-segmentation occurs very often. The under-segmentation is preferable as even the smallest segmented part of the needle is usually sufficient to compute needle trajectory using the Radon transform.
The presented method has some limitation. Although the segmentation process yields very accurate results for clean input images, it is sensitive to superimposed text, arrows, or lines as well as high-intensity borders from adjacent soft tissue or bone along the needle trajectory. They may interfere with needle visibility. Therefore, accurate needle localization remains an ongoing challenge at steep angles and deep insertions. 18 Reverberations artifacts from the needle also significantly decrease the quality of the results.
Moreover, during the process of puncturing the tissue, at the very first time, the needle cannot be recognized. Only when at least a few millimeters of the needle is visible, the method begins to detect it. The single image processing time is around 22 ms, which is sufficient for real-time implementation.
As the needle is not completely rigid, it may bend when insertion force is applied. In this situation, the proposed method computes the trajectory with a higher error that depends on the grade of the needle curvature. The same statement applies to the other methods.
Despite the difficulties indicated above, the presented method gives valuable results that exceed other solutions. This method may be beneficial in the future when the needle trajectory is recorded. If a real-time automated needle detection is implemented into the clinical workflow, one should expect such benefits as a decrease in the number of punctures, higher accuracy, or shorter procedure time.
In the paper, clinical data were collected during the ultrasound-assisted core needle breast biopsy. The dataset comprised various types of tumors, and its quantity is comparable to other researches depending on clinical data. Although there are researches based on larger databases, their images are acquired from phantoms. These datasets feature a significantly higher resolution of images, fewer artifacts, more homogeneous background. Phantom datasets are easier to be acquired than clinical ones, but they do not capture the real-world artifacts contained in clinical data and thus may cause CNNs to overfit if not trained properly.
Conclusion
This paper presents an automatic method for needle detection and segmentation in the ultrasound image during a core-needle biopsy. The high accuracy of the method and the processing rate encourage us to work further on eliminating current limits described in the Discussion. The method can be used online, during a procedure of core-needle biopsy.
Footnotes
Declaration of Conflicting Interests
The author(s) declared no potential conflicts of interest with respect to the research, authorship, and/or publication of this article.
Funding
The author(s) disclosed receipt of the following financial support for the research, authorship, and/or publication of this article: This research has been founded by the Silesian University of Technology, Faculty of Biomedical Engineering grants Nos. 07/010/BKM20/0048 and 07/010/BKM20/0049.