
Abstract
Wildfire risk maps have emerged as a prevalent yet contested scientific object in the United States and internationally. These maps, often a patchwork of bright reds and oranges, depict relative risk scores for different locations. Dozens of these maps from private companies and public agencies have proliferated in recent years, yet members of the public and scientists alike have posed questions about map accuracy: can the maps reliably depict the risk of such infrequent, high-consequence events? In this article, I examine these maps as a contribution to the Science and Technology Studies scholarship on the production of risk assessments. Though they appear orderly and neat, wildfire risk maps are the result of complicated, layered scientific decisions. Drawing on interviews with wildfire risk map producers, I analyze how these maps are socially constructed and materialize future risk. Almost universally, these map producers share a lack of confidence in their approaches to modeling wildfire risk because they view wildfire as unpredictable and risk modeling as faulty. How then do these actors determine what constitutes success or a lack thereof? I find that many, in their attempts to navigate indeterminacy, turn instead to personal knowledge of wildfire risk in the places they live.
Introduction
As climate change continues to reshape expectations of natural disasters, wildfires are of increasing global concern to governments and residents (McGrath 2025). Wildfires can be incredibly destructive, posing a threat to lives and property, yet they occur relatively infrequently and unpredictably compared to other natural disasters such as flooding. Scientific efforts to predict these high-consequence, high-uncertainty events, and the threat they pose to humans, are thus complicated (Robbins 2018), and scientific developments in this area are relevant to fields as wide-ranging as insurance and land use management. In this article, I identify and examine a new development in this domain of disaster governance occurring in the United States and internationally: the production of wildfire risk maps. I consider how wildfire risk maps in the United States have emerged as a contested, increasingly prevalent technological device.
Quantitative risk analysis is not a new technique, but its recent use in wildfire modeling has been expansive, and this is a noteworthy development for two reasons. The first is that the use of risk in wildfire modeling signals a change in the production of wildfire knowledge away from solely ecology, and toward consideration of human lives and properties. Prior decades of wildfire modeling have focused primarily on the ecological question of where future wildfires were likely to start and spread. Now, this legacy is being displaced by an interest in the anthropocentric consequences of wildfire. Most commonly, wildfire risk maps depict areas where a wildfire is likely to occur, and where people live. The outputs of such risk models—for example, the classification of a tax lot as “Extreme Risk”—appear to be useful, especially for planning officials and residents deciding where to live. But the dozens of risk maps currently available often display different risk scores for the same location. This is the second reason to study wildfire risk maps: an increasing number of risk models are being sold to private consumers and large financial institutions, and used in US federal programs, but recent studies indicate significant divergences in their risk scores for the same location (Chegwidden, Koerth, and Freeman 2024; Roston, Karra, and Kaufman 2024). Though wildfire risk maps promise to deliver useful information on the human consequences of future wildfires at scale, their varied outputs raise questions about the reliability of such models, especially as they are being embedded in key social and economic institutions.
In this article, I contribute to the Science and Technology Studies (STS) scholarship on how such quantitative risk assessments are produced. Though studies have begun to compare model outputs (Chegwidden, Koerth, and Freeman 2024; Roston, Karra, and Kaufman 2024), there is limited study of model production. In uncovering the layers that constitute wildfire risk maps, I find that wildfire risk map production is a high-stakes, public-facing case of scientific work in which map makers are confronted with troublesome unknowns. Almost universally, US wildfire risk map producers encountered in my research lack confidence in their approaches to modeling wildfire risk because wildfire is unpredictable and risk modeling is limited. And, ultimately, though significant calculative work is done to model wildfire risk, it is invisible when the output is a simple score, which makes risk maps difficult to assess. To address this problem, I find that somewhat surprisingly, many map producers turn instead to personal knowledge of wildfire risk in the places they live. I argue that, by invoking a kind of location-specific knowledge, mapmakers seek to resolve or manage the indeterminate problems of their models. For scholars of STS, this strategy has several noteworthy and novel features that do not align neatly with the existing concepts of knowledge and expertise: not only is this a kind of knowledge that is unwritten and specific to one place, but it is also invoked by scientists to evaluate and often reject the explicit facts of scientific models.
Risk Assessments, Mapping, Objectivity, and Expertise
This new moment for wildfire in the United States and internationally can be connected to broader legacies of risk scholarship, where the production of risk knowledge has aimed to solve a range of predictive problems. In fields as varied as epidemiology (Amelang and Bauer 2019) and consumer finance (Poon 2007), social scientists have studied the significant resources and effort expended to turn population-level data into individual risk scores.
A key concern in this body of literature is that risk assessments portray an apparent reliability and certainty. These probabilistic devices appear to objectively capture the world through the technical analysis of empirical data (Jasanoff 1998; Mennicken and Espeland 2019; Porter 1995; Tierney 1999; Weinkle and Pielke 2017), and to “promote an ahistorical understanding of…risk as if it were the natural attribute of a place” (Koslov 2019, 662). This depiction of certainty is pragmatic: risk assessments are meant to be used as prospective tools, enabling preparation for future disasters (Anderson 2010; Lakoff 2007; Mallard and Lakoff 2011). For instance, a county might use a risk map to shape its allocation of disaster preparation funding to high-risk neighborhoods.
Although they appear to reliably depict future threats, such models routinely rely on synthetic or proxy variables (Saltelli and Di Fiore 2023; Wynne 1992, 113). Indeed, Eyal (2019, 94) reminds us that at every turn, expert decisions about what to include in risk assessments render their outputs subjective “through and through”—that is, contingent on interpretations of what data to use, for example. This article takes up this processual angle, focusing on the labor of wildfire risk map production. What kinds of decisions make up the day-to-day practices of risk professionals? Unlike the scores more common in epidemiological or financial models of risk, the output of a wildfire risk assessment is a map, which invites an additional set of epistemic questions about how they are engineered. Specifically, maps can make messy phenomena like wildfires appear neatly bound (Neale and May 2020), constructed according to logics of objectivity (Monmonier 2006) and commensuration (Mennicken and Espeland 2019; Scott 1998). Indeed, there is a robust legacy of social scientific work on how such prospective maps enable particular visions of legibility, introduce epistemological issues of scale, and give rise to competing interpretations of time (Elliott 2021; Harris 2006; Koslov 2019). This article seeks to uncover the layers of wildfire risk maps, not only to empirically discover how they are made, but because dozens of risk maps are circulating in public arenas, with many debates about their reliability.
As risk modelers work to produce reliable maps for the public, they make choices about representing and communicating uncertainty. In this case, wildfire risk maps are largely produced for the general public, who are understood by my interlocutors as nonexperts. So, how do risk modelers navigate and make sense of uncertainty given the public-facing nature of their work? In fields similar to disaster risk, scientists have become skilled at delimiting the uncertainty in their public-facing work. Weather forecasters, for example, produce and communicate meteorological science that, like wildfire science, relies on analyzing many shifting, underlying model layers to make prospective claims (Fine 2007). Because of these many moving parts, which forecasters analyze in quick succession over the course of a workday, their work is highly discretionary (Fine 2007). In this case, weather forecasters succeed in managing uncertainty with the availability of ground truth data (a tornado, e.g., on a given day on which a tornado was predicted). But wildfire risk is one instance in which such ground-truth data is absent; there exists no empirically verifiable risk data.
This is because some types of unknowns are more readily managed than others. Uncertainty—and whether it can be managed using ample ground-truth weather data, for example—is contingent on the boundaries drawn around it (Wynne 1992). This is because of “intellectual closure,” the processes by which scientists collectively render their objects of study knowable through various analytic decisions (Wynne 1992, 113). Intellectual closure is routine and typical, and gives scientists tractable unknowns that can then be managed and reduced (Wynne 1992). But unknowns still lie beyond the scope of the research question and design at hand. So, there are some cases with particularly indeterminate scientific problems in which merely refining a model's inner workings is insufficient. This article presents a case in which risk mappers make sense of the indeterminacy of their models by leveraging alternative forms of personal, local knowledge. I describe how this use of personal, local knowledge differs from the kinds of tacit knowledge or lay expertise more commonly described by STS scholars (Collins 1974, 2010; Epstein 1995, 2023; Polanyi 1958).
Wildfire Risk Maps in the United States
While scientists at federal agencies in the United States and abroad have been researching wildfire behavior for many decades, their probabilistic models have been centrally focused on predicting the likelihood of wildfire and its intensity (Neale and May 2018; Rothermel 1972). This classic approach is typically termed wildfire hazard modeling. Wildfire risk modeling is thus a relatively new approach in this field, encompassing not just the likelihood of intense wildfire but also its consequences (Scott, Thompson, and Calkin 2013). In the United States, this move toward risk can be traced to wildfire legislation at the federal level.
In 2010, the adoption of a federal wildfire risk management strategy reoriented the priorities of several federal agencies from a purely ecological approach to one that took into account “human and ecological values” (Calkin et al. 2011, 40). 1 Previously, wildfire modelers had been more concerned with where future wildfires were likely to start and spread; they had not directly considered the human consequences of such fires. Now, with a risk approach, state and local officials could determine where to focus their wildfire management and prevention resources according to where such actions “minimize risk to human life and property” (Calkin et al. 2011, 60). In this move toward risk, modelers took as a starting assumption that wildfires will occur: it is not a matter of whether, but when a wildfire happens. While fire regime approaches are “measures of ecological potential” not yet realized (Calkin et al. 2011, 40), risk assessments depict a scenario in which a wildfire does occur.
Since this federal orientation toward risk, wildfire risk mapping has become a widespread sociotechnical object, produced by a varied set of actors for a wide range of settings. Any interested individual conducting an online search for wildfire risk maps can now encounter a handful of public maps from different public and private US institutions. 2 Wildfire risk information can be readily bought from private companies, and it can be freely accessed on several federally managed websites. Those maps that are public are typically colored according to relative risk levels and designed such that any online user can selectively pan across and zoom into specific locations. Another difference between hazard and risk lies in the intended audiences for each type of model. While hazard maps have been traditionally used by wildfire management experts in settings like prescribed burns or the management and suppression of wildfires, wildfire risk maps are often designed for a wider range of local officials, real estate companies, and the general public. As such, hazard maps typically only depict forested areas, whereas risk maps depict areas where there are human or other values at risk. One example of human consequences depicted in risk maps is the proportion of inhabitants aged 65 and over who live in a high-likelihood area.
Crucially, no two wildfire risk maps are identical. The same location might receive a different risk score on a map depending on who produced it. This is different from the mapping of flood risk because in 1969, the Federal Emergency Management Agency (FEMA) established the creation of flood insurance rate maps to be used by the National Flood Insurance Program (Elliott 2021). In the United States, FEMA's flood maps are the central source of flood risk knowledge and governance (via insurance) (Elliott 2021). On the other hand, wildfire risk maps have had a different evolution, resulting in little cohesion among mapping processes. Unlike FEMA's flood risk maps, the several dozen wildfire risk maps available are the product of different alliances between federal research scientists, local officials, marketing professionals, and private insurers across the country. These individuals work in federal agencies, private insurance companies, and academic research groups alongside a wide-ranging group of colleagues. Given this diversity of mapping processes, a single location can be mapped into different categories of wildfire risk.
Not all wildfire risk maps explicitly depict homes—some are more focused on vulnerable water sources, for example. But many worry that being mapped in a high wildfire risk location will raise the cost of home insurance and lower property values (Bittle 2022). This is the case even when wildfire maps are not explicitly tied to homes. In 2022, the Oregon state government published an online wildfire hazard map that quickly became the center of controversy. 3 Hundreds of Oregon residents contacted their local government offices with concerns about their homes (Bittle 2022). But the map did not actually take housing into account. The map had been confusingly labeled a risk map even though it depicted hazard: locations were assigned relative scores only according to their likelihood of wildfire, and not the physical or social realities of homes or households. Ultimately, facing pressure from a critical group of residents and from Republican legislators (many of whom initially supported the bill), the state withdrew the map (Bittle 2022; Profita 2022; Undo SB-762 2025). Though it was later republished, this time correctly labeled as a hazard and not a risk map (Oregon State University College of Forestry 2025), the blow to public trust had been dealt. The map was ultimately repealed for good (Davis 2025). This is one example in which a map produced to revise building codes was ultimately tied up in larger, swirling concerns about housing and risk.
Methods
This article examines the day-to-day work of wildfire risk modeling, drawing primarily on interviews with eighteen individuals producing wildfire risk maps in various institutions. The article also draws on an analysis of relevant documents such as technical risk assessment literature and marketing materials. Among the institutions studied were federal agencies, private insurance and consulting companies, as well as academic research groups. My main aim was to “follow the algorithm,” a strategy of identifying risk assessments across multiple sites and among their respective actors, that Amelang and Bauer (2019) model in their work on epidemiological risk scores. More specifically, the questions posed in interviews were guided by existing social scientific work in the study of epistemic cultures, risk, technology, and uncertainty (Knorr Cetina 1999; Neale and May 2018, 2020). From this literature, I developed questions about what constitutes a “good” map, and how such actors make sense of uncertainty in their work. 4
Formal interviews were conducted between June 2023 and March 2025. I recruited interviewees as follows. First, I conducted a comprehensive search for online wildfire risk mapping efforts in the United States that are publicly available and/or discussed online; from this search I identified over twenty-five unique mapping efforts. This search was complemented by informal conversations with individuals involved in wildfire management, wildland firefighting, and analysis of public discussion of maps, such as on blogs. 5 Where possible, I identified and contacted participants associated with these maps, either in cases where individuals’ names and contact information were published online, or through general “Contact Us” forms listed on websites.
My investigations indicated that, in the United States, there is a relatively small number of people working in this field. I strategized to include individuals from as many different maps as possible, to learn as much from different actors and their work as I could. I recruited participants via email, giving a brief description of my interest in wildfire risk maps, noting their role in wildfire risk mapping, and asking if they would be willing to speak with me about their work. Interviewees worked at federal agencies (n = 5), private companies in the home insurance industry or other structural asset risk areas (n = 4), or research consultants at different companies providing risk models to private and public entities (n = 9). Thus, the individuals producing wildfire risk maps are not part of a uniform institution, but rather actors spread across a variety of private and public organizations, each with different institutional infrastructures. Examples of formal titles of interviewees were: “Geospatial Analyst,” “Senior Risk Analyst,” and “Disaster Risk Analyst.”
Interviews were conducted virtually on Zoom (seventeen) or via telephone (one). Per IRB exemption, I obtained verbal informed consent. Audio alone was saved for transcription purposes. Identifying information has been excluded from interviewee quotes. All interviewee names are pseudonyms to ensure participant anonymity.
On average, interviews lasted 47 minutes. Questions focused on day-to-day job tasks; training, education, or important background knowledge for the job; any relevant stakeholders (such as funders or community members); the intended audience of the map (including how the interviewee might imagine someone using it); the process of the map production as it occurred from start to finish; the role of geographic regionality or locality, if relevant; decisions made about the calculation, assessment, and representation of uncertainty, accuracy, and scale; any relevant evaluation processes; how other wildfire risk maps are different; how other disasters are mapped; how risk is defined in their work; how success is measured; the availability of data and methods; operational hurdles, barriers, or other limitations; explanations for the recent prevalence of wildfire risk maps; explanations for the lack of a nationally recognized wildfire risk map; and imagined future directions.
I used qualitative coding software (Atlas.ti) to abductively code the interview transcripts. Abductive analysis, proposed by Timmermans and Tavory (2012, 168), focuses on the “creative hypotheses” that arise from “surprising evidence.” This approach is informed by key theoretical debates (such as how do experts manage uncertainty), but allows for novelty coming from the data at hand. Specifically, I developed codes from my transcripts according to main themes (these were similar to categories of interview questions, such as user considerations and definitions of risk), assessed consistencies or inconsistencies between transcripts, refined the codes, revisited my key pieces of literature, and developed main arguments, over the course of many iterations. Examples of codes that evolved over the course of this process include descriptions of what makes a good map and explanations for the prevalence of wildfire risk maps as a whole.
This article also draws on analysis of relevant scientific literature (such as technical research papers commonly cited by interviewees), private map marketing materials, and other documents pertaining to the production, deployment, and communication of wildfire risk maps. In addition, I attended in-person and virtual workshops hosted for individuals working in natural hazards prevention and mitigation, to understand how data are collected, analyzed, and communicated with respect to prospective disasters, including wildfire. Finally, I analyzed the content of many dozens of newsletters, blogs, and podcasts, following the conversation as it traveled among seasoned wildland firefighters, longtime residents, and other concerned parties in online, public venues. 6 Specifically, I identified common themes, including concerns about map granularity and public debates about trust in scientific experts and government officials. I then incorporated these themes into my participant interview guide.
Making Wildfires Knowable
In the United States, wildfire risk maps are produced by a small number of individuals. Of those people I interviewed, almost everyone knew of the same handful of prominent organizations and institutions producing maps, and even the same twenty or so individuals. Some individuals, especially those with careers spanning several decades, have worked at different institutions within this landscape, but for the most part, I observed little institutional movement. The people I interviewed worked in various government, nonprofit research, and private settings. Some worked for federal agencies that manage wildfire on public lands, while others worked at private companies that provide consulting services, and still others were independent contractors who sell their services to a wide range of clients in different industries, including insurance, academia, and real estate.
All interviewees were involved in the production of wildfire risk maps, although their job requirements and day-to-day tasks differed. Susan, 7 for example, works at a federal agency and is largely responsible for the entire process of the agency's map production, from choosing which factors to include in the model (e.g., historic rainfall) and which data sources and versions to source from, to running models and evaluating model output. Susan was assigned to this role to produce a map for internal use; however, the risk map was ultimately shared online with the broader public. Steven, on the other hand, manages several hundred employees at a private company that has helped produce wildfire risk maps for a wide range of clients among national, state, and local public organizations. Some of these maps are available online while some are not. Yet another interviewee, Alex, is a data scientist who works on a small team at an insurance agency; their maps are not available publicly online. Unlike Susan, Steven, and other interviewees, Alex's company produces wildfire risk maps that are used to sell insurance or reinsurance to the public or other insurance companies. Nonetheless, all interviewees understood their work to fall within the realm of wildfire risk assessment.
Wildfire risk is made knowable through a series of elaborate processes using tools from the geospatial, wildfire, and social sciences. To produce a model of wildfire risk, experts combine models of wildfire behavior predicting wildfire spread and intensity (which are themselves a bundle of models relying on weather, fuels, and other factors) with models of social consequences (e.g., predicting consequences to properties, or vulnerable populations). The work consists of many intermediate steps often undertaken over the course of several months to years; models and their outputs are typically evaluated in an iterative process and published (or disseminated to their clients) and updated periodically. In putting together their final maps, individuals and their colleagues typically relied on existing geospatial software (and its underlying aesthetic decisions), such as ArcGIS. In a single exception, the team at a consulting company included in this study also hired graphic design experts to communicate the wildfire risk conceptually.
This conceptual equation, presented in Figure 1 in a simplified format, was the universal definition of wildfire risk used by interviewees, and was referred to colloquially by experts at virtual and in-person workshops. In fact, some websites or public documents included their own versions of the equation, depicted colorfully with arrows pointing to the underlying models as shown in Figure 1. While some were more specific than others in tracing its origin—citing two well-known wildfire science papers from a federal research department—all interviewees took this equation as the basic starting point for their work. Most wildfire risk maps I reviewed for this article were published with documentation of the map production process; in a systematic analysis of these documents, I found that nearly all referenced the multipart (hazard and consequences) nature of wildfire risk modeling. This was the case across types of companies and among interviewees whose roles and responsibilities varied.
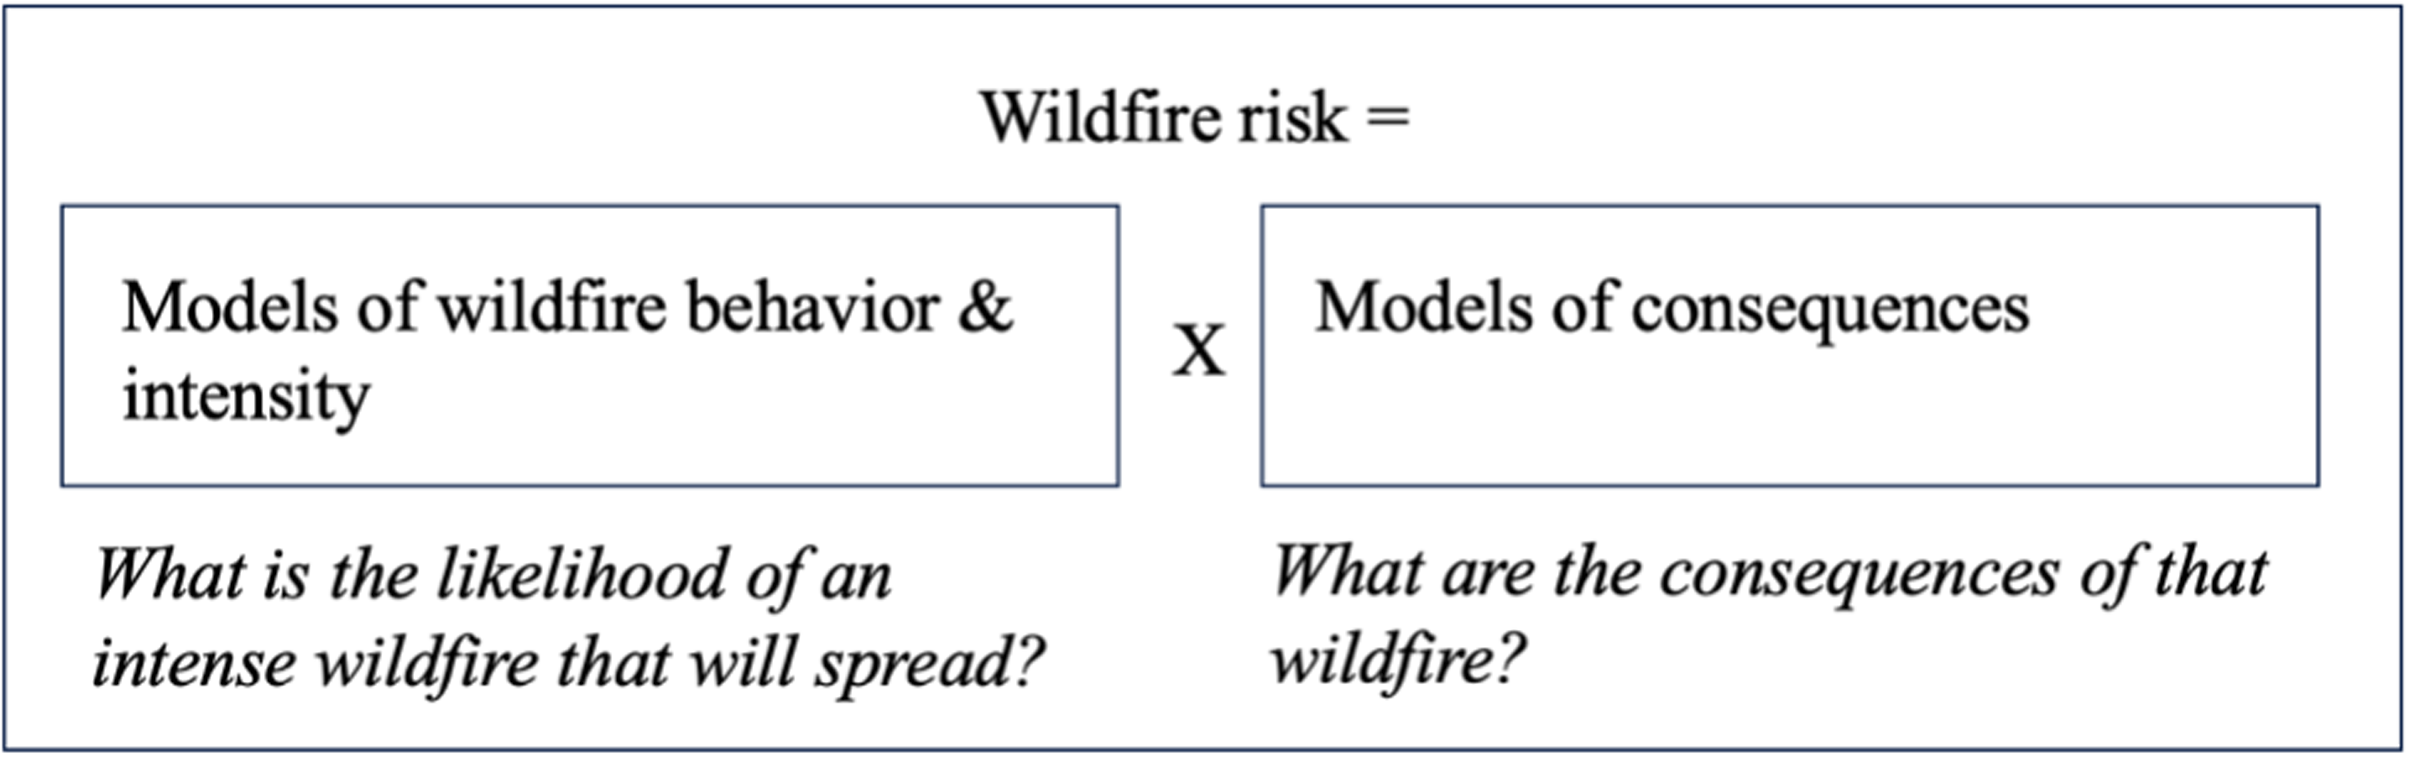
Wildfire risk. Author's simplified rendering of interviewees’ definition of wildfire risk—a synthesis of likelihood and consequences.
While all interviewees took this equation as a starting point for their work, they exercised discretion over which constitutive factors to use—which fire spread model to use for modeling wildfire behavior and intensity, for example. Map makers juggled these different decisions, knowing that different factors could change the course of their work. As a result of these dozens of decisions, wildfire risk maps often end up looking quite different from one another (e.g., one map may use census boundaries while another may use tax lots). Marie works at a government agency as a geospatial specialist and wildfire science expert. She has decades of experience working in remote-sensing methods for land management, a skill that underpins much of quantitative risk mapping. Her work has been incorporated into dozens of risk assessments in public and private settings. She explained, “[if] your objectives are a fine scale assessment, it's going to be expensive. So, there's all those considerations, but it can be expensive and take more modeling power.” The more ambitious one's model is in geographic area and granularity, the larger the computational drain and the longer it will take to run the model, Marie noted, but this choice is up to the scientist constructing the model. According to many interviewees, it is the classic approach to wildfire hazard modeling that is so time-intensive. In fact, in accompanying documentation, marketing materials, and interviews, model efficiency was referenced as a central distinction between private and public wildfire risk maps. Alex's company, like many private institutions working on predictive risk models for natural hazards, has been leveraging more recent machine learning approaches. Alex felt that machine learning could help solve some of these more classic problems: you know, [the classic approach] is good, but it's expensive to run that on a computer. And it does have limitations…So by using machine learning, we’re able to run 10,000 simulations pretty quickly and at a low cost. And we also believe we’re able to get better accuracy than what other models are producing right now.
Generally, interviewees felt that the more accurate a map was, the better and more useful it was. This may seem like an obvious point, but it is the main way interviewees made decisions about their work, as opposed to being informed by specific managerial deliverables or stakeholder interests. Brian writes grants for wildfire risk research alongside private, academic, and government stakeholders. As he put it, one can trust a map the more accurate it is: “what's nice about that [model] is that it's a little bit more accurate, there's a little bit more fidelity in how it actually quantifies the front end.” Another interviewee, Tony, owns a small, private research company that consults on wildfire and other natural hazard projects, providing climate models to clients. I remarked to him that after participating in several workshops and reviewing online risk products, I noticed a common theme to simply emphasize the role of data in risk model marketing materials. He chuckled at what he considered the obvious requirements for a good map: Well, of course, it's data-driven. It's a model. God, I hope it's data-driven. What else are you doing? You got Billy Bob up there on the hill with his finger in the air? Like, that's your data point?
A Shared Lack of Confidence
Despite a fundamental belief in the importance of robust data to inform map accuracy, another shared conviction among wildfire risk map producers is that a good map is actually quite hard to achieve. This is because wildfire is a tricky natural phenomenon to model, and wildfire risk map producers are limited in their risk modeling approaches. It was common for interviewees working across private and public institutions to describe these difficulties as an established fact in their area of work. These doubts were not the result of public discourse or top-down pressure but arose from two primary sets of concerns about wildfire as an unpredictable and therefore intractable phenomenon about which to predict future risk.
First, wildfire is erratic and unpredictable. Wildfire is a fundamentally difficult phenomenon to produce scientific knowledge about, according to interviewees. Tony located much of this difficulty in the contingencies of wildfire—even to experts like him who have been working in this field for several decades, it is difficult to sufficiently understand why and how one wildfire might die out and another might race down the neighboring hill: wildfire is an extreme event. Wildfire is a statistical outlier…driven by the 45 mile an hour wind event that came down the hill, and that happens once every five years. And we don’t have the statistical power. Our models may not actually be tuned to model those types of extremes. To me, wind is huge. And we’re not able to fully map wind—wind speeds that drive fire. I think those would be incredibly important in that type of smaller scale assessment, and I haven’t seen them include any of that information. I think that there's just some significant amount of stochasticity in the way that wildfire is, that no amount of models will ever actually be able to fully capture. We just don’t know enough. And I don’t know if there's a way to know enough.
The second set of concerns is understood to emerge from wildfire risk map producers being limited in their modeling capabilities. Because of wildfire's erratic and unpredictable behavior, many wildfire risk map producers felt that their modeling approaches were also faulty. As these actors undertook the complicated task of pairing the two components of likelihood and consequences, many described the inevitability of uncertainty propagated through their models. In fact, interviewees spoke more about examples of poorly produced wildfire risk maps than they did of accurate ones. Many noted that insufficient data meant that scientists were often accounting for absences or gaps in their work. After patiently walking me through the many steps that constitute a typical wildfire risk model, Tony paused and acknowledged, Every time you do that, to fill in that gap, that missing set of information, you’re bringing your own bias and your own error from the process that you create. So, everyone's creating their own assumptions. You’re propagating two sets of uncertainty and unknown things in the future. And so it's not surprising to me that the end maps are totally different, right? We always say a model is a model. And it's only accurate to the date that it was actually published. It doesn’t capture a fire that happened yesterday, or it doesn’t capture a mitigation measure that happened on a house down the street, so there is absolutely a wide margin of error for the models.
In addition to propagated error, wildfire risk map producers identified concerns with the end format of their models. While the underlying model error can be known and assessed with methods such as sensitivity analyses (mentioned by a handful of interviewees), risk scores cannot. By the time that a wildfire risk score is produced, all the messiness of its underlying layers appears to fall to the wayside. All of the risk maps I analyzed used an ordinal scoring system to neatly characterize clean distinctions between low, medium, and high risk (or varying scales). In the case of insurance (according to interviewees working in this area), a property might be assigned a score of negligible risk or high risk, similarly employing ordinal categories.
The format of these relative scores introduces epistemic concerns. Kathryn is an expert with several decades of experience independently consulting on local and regional wildfire risk assessments, as well as consulting on models for larger and more collaborative wildfire risk maps. She noted, when you sandwich it all back together to get a risk score or risk rating, you’re intentionally saying, I’m going to generalize this piece, this piece, this piece, and put one number, a nominal rating associated with it. And then you lose the ability to identify what the driver of that [rating] is, right? Is it because there's a high likelihood of fire? Is it because we expect high intensities if a fire does occur?…So you almost want to be able to know the parts along with the aggregate information as a decision-maker. Which is, of course, so incredibly difficult to put on a map.
I have discussed these sources of problems—wildfire as erratic and unpredictable, and risk modeling as limited—in two parts to demonstrate that even if one were resolved (e.g., if wildfire were perfectly easy to model), wildfire risk map producers would still lack confidence in their work.
And according to Jordan, these two components are even more complicated in light of climate change: I think one of the changes that we’re seeing is, I don’t really consider “Negligible [Risk]” to actually be negligible anymore…I definitely think that climate change is going to be an increasingly driving force in the way that wildfires present in the United States and around the world.
Personal Verification
Despite these two main sources of concern, interviewees nonetheless felt that they could identify what constitutes map accuracy. Strikingly, the most common strategy interviewees employed was to use the map (if publicly available or they had access) to search for where they lived. Several interviewees described this tactic. Evelyn mentioned one map by name (redacted here for the sake of anonymity), noting that it had falsely categorized her address as low risk: But I would strongly argue that the level of accuracy with some of those models is open to discrepancy. And I mean, [redacted]…I would say that their fire map is not accurate. And unfortunately, it conveys a false sense of security, because I’ve typed in my own address, and I know I live in a risk area, and it came back that I was fine. So that's what worries me, is that some of the private efforts are less worried about being really true to the science in trying to capture the best product, and more just trying to crank stuff out. And so it creates a challenging situation, because people see that [redacted] map, and they can click on their property and think, “Oh, wow, look at that. It's fine scale.” And most of us that have looked at that product and checked our neighborhoods or our houses—it's way off base. All I know is whenever I look at that stuff, I go and look at my house and other houses that I know…I don’t know why anybody bothers to produce that stuff. It's so bad. We don’t know about individual houses all that much without doing a site visit or without even looking at satellite imagery. That's really hard.
What is it about these places about which interviewees can derive so much knowledge? Kathryn was specific about the type of place-based information she uses to assess her own personal wildfire risk, gesturing toward the window visible in the background of our virtual conversation. Well, at my given location, for example, in Montana, my house, you know, I’m not going to see wildfire. But I have a mountain to the east and a mountain to the west. And there is a really high potential that either of those could experience fire, and then there could be some [fire] spread and embers lofted that put my home at risk. And so when we look at a more generalized risk map, my house would have that kind of information associated with it. So there's a bit of a disconnect. [The insurance company's risk score] was based on [the question of], “What's the brush score around your house?” That's [a] very small component, that defensible space. You got to look at my back 40 [acres]. You’ll have to look at historic occurrence. So, as a company, I have all this data readily available to me, and I would look at that and [ask,] is there risk associated with my property? Absolutely, I would say it's moderate risk. Local defensible space can mitigate some of it. Can’t really mitigate what's out there in the landscape, because it's next to the National Forest. So it's really dependent on what activities they do…But [the insurance company] rated it as extreme risk.
Indeterminacy in Wildfire Risk Maps
On the surface, interviewee concerns about the fidelity of wildfire risk maps are consistent with what Neale and Weir (2015) call “instrumental” scientific uncertainties: “uncertainties [that] emerge from the limitations of a given apparatus, heuristic or theory used to calculate the probability and consequences of hazard events” (Neale and Weir 2015, 260). Scientific experts producing wildfire risk maps today are in agreement with existing wildfire behavior scholarship that fire behavior simulation tools are limited in their representativeness and their predictive function (Neale and Weir 2015). In this article, I present empirical data on how wildfire risk map producers in the United States encounter and manage what appears to be instrumental uncertainty in their work. But wildfire risk map producers are faced with a greater problem, which they attempt to reconcile using personal, local knowledge of wildfire risk. These strategies do not seek to revise the models themselves but rather turn to another form of knowledge derived from personal experiences of a place.
I argue that this is because the problem they are faced with—a set of concerns that wildfire is erratic, and their risk modeling is insufficient—is actually a case of indeterminacy, not simply instrumental uncertainty. According to Wynne (1992, 116), scientific experts regularly draw boundaries around their object of study: “Science can define a risk, or uncertainties, only by artificially ‘freezing’ a surrounding context which may or may not be this way in real-life situations. The resultant knowledge is therefore conditional knowledge, depending on whether these pre-analytical assumptions might turn out to be valid.” Indeed, as noted above, Tony and several interviewees were concerned about the assumptions made in their models. Wynne’s (1992) distinction between uncertainty and indeterminacy is important here: in order to decrease uncertainty, scientists commonly strive for more refined methods or approaches; the solution to uncertainty lies entirely within the model's existing logic (or “freezing” (116)). But Wynne (1992) argues that efforts to do so fail to address the sources of unknowns that lie outside the parameters of the problem. In the case of wildfire risk, interviewees asserted that there are characteristics of wildfire that are fundamentally unknowable, such that risk models will likely never approach sufficient accuracy to be useful—Jordan doesn’t “know if there's a way to know enough,” as mentioned above. Even if risk models could be rendered more statistically robust, they would still do so by “artificially ‘freezing’” (Wynne 1992, 116) wildfire in a way that is at odds with how interviewees actually understand it: through personal knowledge of where they live.
Expertise and the Invocation of Personal and Local Knowledge
What kind of knowledge is this, exactly? When considering their own neighborhood or location, many interviewees had immediate and strong reactions about a given map's accuracy. This knowledge is layered—it is derived from a hyperlocal place (such as the mountains outside of Kathryn's window), and it combines temporal and ecological considerations (the likelihood of future fire) with human ones (whether Kathryn and her home are in danger). The knowledge is also highly specific. As Gieryn (2018, 176) notes, “Sometimes…the conditions of truth-making are present at just one location—you need to be there, and being there is convincing.” Indeed, interviewees did not reference work they have done to fire-proof their property, nor building codes they have memorized, but that they intimately know the risk by virtue of living there. Many called upon knowledge of places where they or their families have lived for several decades, indicating that such knowledge is accrued over time: “uniqueness is not an inherent or permanent feature of a place, but rather a contested and hard-won achievement” (Gieryn 2018, 176). One's local neighborhood or home becomes what Gieryn (2018) terms a “truth-spot,” with greater veracity than the results of highly technical models. While ordinal risk scores cannot be verified at the level of households, this alternative knowledge can; being there is enough, as Gieryn would note.
This invocation of personal, local knowledge challenges existing literature on knowledge and expertise in three ways. First, like tacit knowledge, this knowledge is unwritten and contextual (Polanyi 1958). However, when scholars of tacit knowledge have examined its invocation by scientific experts, they have elucidated cases in which scientific goals are achieved with the productive application of tacit knowledge (Collins 1974, 2010). These findings have articulated the essential role of tacit knowledge in such endeavors: it “lets scientists understand each other” (Collins 2010, 1). But, this is a case in which personal, local knowledge conflicts with the explicit outputs of a risk model and cannot be readily taught to other scientists to enable any kind of cohesive scientific knowledge. It also need not be exclusively held by formal experts: one can reasonably expect that anyone living in a wildfire-prone place might accrue this type of local, personal knowledge of their risk. Second, following this line of thinking, this knowledge appears to resemble that associated with lay expertise, in that it is alternative to a kind of knowledge produced by formal experts, and often includes experiential claims (Epstein 1995, 2023). But, in this case, I find this knowledge among formally credentialed experts, who actively distinguish between their technical training and this personal, place-based knowledge. Third, this knowledge is distinct from the embodied knowledge that wildland firefighters possess about the ecological conditions of fire; such embodied knowledge is gathered by sensing changes in humidity or wind, and can be taught to those unfamiliar with wildfire (Thomas 2022). My interlocutors in this study did not reference any particular experiences with wildfire as the basis for this alternative knowledge. And unlike the fire behavior analysts who call on embodied sources of experience with fire to manage their professional relationships and position themselves as reliable, adept colleagues (Neale and May 2020), the map producers I interviewed were not able to convert this kind of alternative knowledge into professional credibility among their peers, precisely because it highlighted the fundamental indeterminacy of their work, thereby potentially questioning the credibility of their tools.
Conclusion
In this article, I have depicted a common strategy for reconciling indeterminacy in wildfire risk among experts producing wildfire risk maps: invoking one's personal, local knowledge of risk. Wildfire risk map producers spend their careers doing extensive, calculative mapping work to make risk knowable. But their work is troubled because of indeterminacy: there are fundamentally unknowable features of wildfire, and their modeling tools are limited. In this article, I depict a solution that may be surprising to STS scholars of expertise, but one that was described to me in almost obvious terms: of course, people living in wildfire-prone places know about their risk. Interviewee homes and neighborhoods function as truth-spots from which interviewees source accurate information about future wildfires. This is a kind of knowledge that is unwritten, location-specific, and invoked by scientists to contest the explicit facts of scientific models. One might expect to find this type of knowledge among anyone living in a wildfire-prone location. But because it is so specific to place, the knowledge is also uncontestable and unteachable—you have to live there too.
These findings point to two fruitful directions for further research—the character of indeterminacy in an era of climate change and disaster risk, and the variability in experts’ use of personal, local knowledge. When asked about the future of wildfire risk mapping in the coming years, many mapmakers were skeptical that this intractable issue of indeterminacy would be resolved. This is especially the case when considering climate change: merely improving the existing modeling approaches to wildfire would be insufficient to handle unknown, future climatic changes. Future research might examine this issue in wildfire and also other types of natural disasters, where climate change indeterminacy is likely also a concern. Furthermore, future scholarship should broaden its investigation of the invocation of local knowledge by scientists, particularly when it is used to question formal models. Additional cases can help illuminate how and when the use of personal, local knowledge is at odds with, complementary to, or capable of functioning alongside experts’ formal training. Future studies might identify cases in which local knowledge perhaps becomes a kind of hidden qualification for the production of formal risk models, or perhaps cases in which scientists attempt to make such unwritten, highly specific local knowledge more portable or translatable among their expert peers. Such studies expanding the STS scholarship on knowledge and expertise are also increasingly relevant as these risk models become embedded in private and public systems of governance.
Footnotes
Acknowledgments
I would like to thank the anonymous reviewers and ST&HV editors for their feedback and suggested edits. This article also greatly benefited from insights and feedback from Steven Epstein, Wendy Espeland, Vineet Xie-Gupta, Lawrence Chillrud, and participants of Northwestern's Culture, Urban & Community, and Problem-Solving workshops, and Science in Human Culture Program. Finally, I am deeply grateful to my interviewees and key informants, for sharing their time and expertise.
Ethical Approval and Informed Consent Statements
Study protocol STU00219405 was reviewed by the Northwestern University Institutional Review Board (IRB) and determined to be exempt from further IRB review. Participant-informed consent was verbally given to the author.
Funding
The author disclosed receipt of the following financial support for the research, authorship, and/or publication of this article: The author received funding from the Northwestern University Sociology Department Alumni Funds for Second-Year Paper research.
Data Availability Statement
The data collected for this study are not available to preserve interviewee privacy and anonymity.