
Abstract
Two groups of adolescents (N = 114), 61 identified-gifted adolescents (M = 22, F = 39) and 51 vocational school adolescents (M = 27, F = 26), were compared on the Overexcitability Questionnaire. Each of the five Overexcitability (OE) scores—Psychomotor, Sensual, Imaginational, Intellectual, and Emotional—was subjected to a two-way ANOVA by classification and gender. Any statistically significant interaction effect was further analyzed by testing the group means with six two-group comparison tests. The analyses produced the following results: (a) Differences among the Psychomotor, Sensual, and Emotional OE means were not statistically significant, and (b) the Imaginational and Intellectual OE means of the gifted male students were significantly higher than the means of the vocational female students, vocational male students, and gifted female students. The effect sizes were classified as large. A qualitative textual analysis was also conducted. The results were compared with another study of the same gifted population that used the Overexcitability Questionnaire-II.
Keywords
One of the emerging ideas about high-IQ students has been that they are more sensitive and intense than students who do not have high IQs (O’Connor, 2002; Silverman, 1993). This idea seems to have come about with the unfolding awareness of the work of Kazmierz Dabrowski. Dabrowski was a Polish psychiatrist who postulated the theory of positive disintegration (Dabrowski & Piechowski, 1977). This theory includes the presence of Overexcitabilities (OEs). OEs are thought to contribute to a person’s ability to reach successively higher levels of development. According to his major translator, Michael Piechowski (1975, 1979, 1991, 1992), Dabrowski saw these OEs as a higher form of adjustment on a continuum of levels of adjustment (Dabrowski, 1964, 1967; Dabrowski & Piechowski, 1977). “To varying degrees, these five dimensions give talent its power,” said Piechowski (1997, p. 366).
The OEs are Psychomotor, Sensual, Imaginational, Emotional, and Intellectual. Piechowski (1991) described them this way:
Psychomotor OE—an augmented capacity for being active and energetic – expressed as movement, restlessness, drivenness;
Sensual OE—an enhanced differentiation and aliveness of sensual experience;
Intellectual OE—avidity for knowledge and the search for truth—expressed as discovery, questioning and love of ideas and theoretical analysis;
Imaginational OE—the power of thought creation—expressed through vividness of imagery, richness of association, liking for the unusual, and a facility for dreams, fantasies, and inventions;
Emotional OE—the heart—recognized in the great depth and intensity of emotional life expressed through a wide range of feelings, attachments, compassion, heightened sense of responsibility, and scrupulous self-examination. (p. 287)
These OEs have also been called sensitivities and intensities. Dabrowski (1972) thought they were interwoven and that what Mendaglio and Tillier (2006) called “The Big Three”—Intellectual OE, Emotional OE, and Imaginational OE—were particularly crucial, especially for high-level development. They stated, “The greatest support for the claim that gifted persons manifest the profile of elevated Imaginational, Intellectual, and Emotional OEs—The Big Three—with depressed Sensual and Psychomotor OEs is found in the studies with adult participants” (Mendaglio & Tillier, 2006, p. 78). They went on to note that these three OEs seemed also to be more manifest in artistic and creative adults.
The presence of OEs seems to lead to difficulties in development, as well. Piechowski (1991) said that the “stronger these Overexcitabilities are, the less welcome they are among peers and teachers (unless they, too, are gifted)” (p. 287). The belief goes that children who experience life with such intensity are often made to feel weird, strange, different, and embarrassed. They often learn to squelch their reactions before they are squelched by their peers, their teachers, and even, sometimes, their parents (Daniels & Piechowski, 2008; Piechowski, 2006).
Reviews of the literature (see Mendaglio & Tillier, 2006; Pyryt, 2008) have noted that few studies have been conducted comparing OEs between groups who have been identified as gifted and those who have not been identified as gifted with either the first instrument to measure OEs, the Overexcitability Questionnaire (OEQ; Lysy & Piechowski 1983), or the more recent Overexcitability Questionnaire-II (OEQ-II; Falk, Lind, Miller, Piechowski, & Silverman, 1999; Falk, Piechowski, & Piirto, 2000). As such, there is also a dearth of comparative studies among adolescent populations. The present study seeks to address that lack. The present study compares OE scores on the older instrument, the OEQ, between identified-gifted adolescents and adolescents from a vocational high school who have not been identified as gifted. It also contains a textual comparison of responses of each group.
The OEQ
The OEQ was developed by Piechowski (1979) as a way of assessing the five forms of OE in Dabrowski’s theory of emotional development (Dabrowski, 1964, 1970; Dabrowski & Piechowski, 1977). Dabrowski thought the OEs were innate and the presence of great intensity indicated greater developmental potential (Miller & Silverman, 1987; Piechowski, 1975). Developmental potential assumes that individuals with certain OEs, most notably Intellectual OE, Imaginational OE, and Emotional OE, along with certain dynamisms, which are “autonomous inner forces” (Mendaglio, 2008, p. 18), have the potential to develop to the highest levels, Levels IV and V of the hierarchy in the Dabrowski theory of positive disintegration. Level IV is Organized Multilevel Disintegration, and Level V is Secondary Integration. Because this study deals only with the OEs, we will not discuss the theory further.
Originally a 41-item open-ended questionnaire, the OEQ was refined and published as a 21-item questionnaire by Lysy and Piechowski (1983). A technical manual was developed (Falk & Piechowski, 1991; Falk, Piechowski, & Lind, 1994). The OEQ used in the present study consisted of 21 open-ended questions designed to elicit responses indicating the responder’s relative intensities in each of the five OEs.
Here we summarize pertinent studies that used the OEQ. Recently, Falk and Miller (2008) summarized 21 studies using the OEQ (Ackerman, 1997, 1998; Ammirato, 1987; B. J. Beach, 1980; Bouchet & Falk, 2001; Breard, 1994; Buerschen, 1995; Calic, 1994; Ely, 1995; Falk, Manzanero, & Miller, 1997; Gallagher, 1986; Hazell, 1984; Jackson, 1995; Lysy & Piechowski, 1983; Miller, Silverman, & Falk, 1994; Piechowski & Colangelo, 1984; Piechowski & Cunningham, 1985; Piechowski & Miller, 1995; Piechowski, Silverman, & Falk, 1985; Schiever, 1985; Yakmaci-Guzel & Akarsu, 2006). They rank-ordered the OE findings in terms of strength of the OEs. Strength is defined as how closely the responses concur with the OEQ rating protocol or, in the OEQ-II, how high the number was on a scale of 1 = low strength to 5 = high strength. The OEs were, from strongest to weakest, (a) Emotional, (b) Intellectual, (c) Imaginational, (d) Psychomotor, and (e) Sensual. Earlier, Ackerman (1997), in reanalyzing 13 studies, found the same.
Several studies with adolescents and OEs have been conducted. In one of the only comparison studies between identified-gifted adolescents and those not identified as gifted, Ackerman (1993, 1997) studied 42 high-IQ adolescents and 37 comparison adolescents in Canada. These adolescents showed marked Psychomotor OE, besides the expected Intellectual OE and Emotional OE. Using the Ackerman data, another study compared identified-gifted Ohio adolescents with the Canadian adolescents. Ohio visual arts–, theater-, and creative writing–talented adolescents scored higher on Imaginational OE than did the gifted Canadian adolescents in the Ackerman (1993) study (Piirto, Cassone, Ackerman, & Fraas, 1996). A preliminary version of the present study was conducted (Piirto, Beach, Cassone, Rogers, & Fraas, 2000). The previous study found a significant difference in Intellectual OE, with no difference in the other OEs. The present study added more identified-gifted males and reanalyzed the data.
In a descriptive study without a comparison group, Piechowski and Colangelo (1984) studied 49 adolescents using the OEQ. The results suggested that gifted adolescents and adults as a group can be characterized by Imaginational, Emotional, and Intellectual OE. Schiever (1985) found that Imaginational, Emotional, and Intellectual OE differentiated between “high creative” and “low creative” seventh- and eighth-grade students, identifying low and high creative students using their scores from the Something About Myself (SAM) portion of the Khatena-Torrance Creative Perception Inventory (Khatena, 1977). Ely (1995) also used the OEQ to distinguish between intellectually and creatively gifted junior high school students.
Ongoing descriptive studies are yielding information about specific groups with regard to the validity of the OEQ as a means of assessing intensity in the five areas. Studies of visual artists (Calic, 1994; Falk et al., 1997; Manzanero, 1985; Piechowski et al., 1985) have shown that they have high Imaginational OE scores. In Piechowski and Cunningham (1985), the researchers studied 13 people interested in artistic pursuits in music, film, writing, and visual arts, administering the OEQ. Although this study was done before the scoring levels of intensity were developed, the artistically interested adults showed a marked intensity in Imaginational OE, with Emotional OE and Intellectual OE similar to those high-IQ populations studied previously (Silverman & Ellsworth, 1981).
Studies of high-IQ adults have shown that Intellectual OE is dominant (Piechowski et al., 1985). Miller et al. (1994) compared 45 high-IQ adults and 42 graduate students on both the OEQ and its companion instrument, the Definition Response Instrument (DRI; Falk & Miller, 2008) that measures levels of development in the Dabrowski theory of emotional development hierarchy. Adults were found to have higher potential for emotional development, with women higher in Emotional OE and men higher in Intellectual OE.
Other studies used the OEQ in a qualitative way. Flint, Schottke, Willmore, and Piirto (1997) read 100 OEQs for themes in the lives of talented adolescents. This reading yielded five overarching themes: hypersensitivity, God, life in other forms, a love of performing, and a propensity to challenge themselves and others. L. Beach (2003) did a qualitative study of five students who had scored above three standard deviations above the mean on the OEQ. She did case studies on the students 5 years after they had taken the OEQ and also included their scores on the High School Personality Questionnaire (HSPQ; Cattell, Cattell, & Johns, 1984), the Myers-Briggs Type Indicator (MBTI; Myers & McCaulley, 1985), and the Rokeach Values Survey (Rokeach, 1983). In three 1.5-hr phenomenological interviews (Seidman, 1998) with each participant, she found that they retained their intense natures, and several had experienced difficulties with drugs, college, and employment in the 5 years. The highest scorer, however, was an honors student at a small private university, with ambitions to be a writer and philosopher. Piirto conducted taped interviews to follow-up on written responses to the OEQ, of talented adolescents at a musical theater intensive in the late 1980s, and published some of the responses (Piirto, 1992, 1998, 1999, 2002, 2004, 2007).
Research Paradigm
Mixed methods research often triangulates quantitative and qualitative approaches to data presentation and evaluation. Denzin (1978) said triangulating between methods reduces the bias present in using only one method, so that “the result will be a convergence upon the truth about some social phenomenon” (p. 14). Such triangulation helps the researcher have confidence in the results and to uncover contradictions that may arise when speaking of theories. Onwuegbuzie and his colleagues have delineated several types of mixed methods research and ways to analyze data (Onwuegbuzie & Collins, 2007; Onwuegbuzie & Leech, 2007; Onwuegbuzie & Slate, 2005; Onwuegbuzie & Teddlie, 2004). Some researchers (Darlington & Scott, 2002; Glatthorn, 2005) characterized mixed methods studies by the primary analysis followed by the secondary analysis. The present study is quantitative first, qualitative second. The quantitative data, however, were obtained in a qualitative manner through evaluation by trained interraters, so the present study could perhaps more accurately be characterized as qualitative-quantitative-qualitative.
The present study involved a quantitative two-way ANOVA of student responses to the open-ended questions of the OEQ, scored by a team of raters. Textual analysis was then used on the responses to illustrate the richness of the data for both groups.
Purpose of Study and Participants
Participants
Two groups of adolescents (N = 114) including 61 identified-gifted adolescents (M = 22, F = 39, mean age 15.9) and a group of 51 adolescents who attended a vocational high school (M = 27, F = 26, mean age 16) were compared. The gifted adolescents were identified according to the Ohio Rule for the Identification of Gifted Students (Ohio Revised Code 3324.01-.07 [law], Ohio Department of Education, 1999; Ohio Administrative Code 3301-51-15 [rule]; Ohio Department of Education, 2008), which has four categories of giftedness: (a) superior cognitive, (b) specific academic, (c) creative thinking, and (d) visual and performing arts. In all, 95% of the identified-gifted students qualified by Category (a) or Category (b). The gifted adolescents were 10th and 11th graders attending a state-funded Ohio Summer Honors Institute at a small north central Ohio liberal arts college, and they came from 35 of the 88 Ohio counties. The vocational students, who were 11th graders, were from one county and none were identified as gifted by the Ohio Rule. The Ohio Rule for the Identification of Gifted Students specifically says that students in vocational schools do not qualify for identification (Ohio Revised Code 3324.01-07). Thus, using the state definition of giftedness and talent, it will be assumed that the comparison students were not identified as gifted by the Ohio Rule. All students were administered the OEQ.
The students at the vocational school attended during their junior and senior years. To attend, they met the graduation requirements for freshmen and sophomores as set by their high schools. This means that they should have completed courses in English, Social Studies, Math, Science, Physical Education, and Health. Students deficient in required credits attended summer school, were privately tutored, or took correspondence courses to meet graduation requirements. The vocational school had an Academic Assistance Area and Student Assistance Center where students could receive help with all academic courses.
The career center/vocational school that the comparison students attended offered 29 programs in areas including business, construction, education, health, and hospitality. The students were in an academic class, 11th-grade English, which drew from all the specialties.
Each of the students who participated in this study received an OE score for each of the following five OEs: (a) Psychomotor OE, (b) Sensual OE, (c) Imaginational OE, (d) Intellectual OE, and (e) Emotional OE. Each questionnaire was scored by two trained raters who independently scored each question without knowing whether the questionnaires were completed by vocational or gifted students. Raters had received intensive training until their interrater reliability reached more than 90%. The possible score for each question ranged from 0 = no presence to 3 = high presence. Each of the five OEs was formed by summing its 21 questions. The average of the two raters’ scores was included in the data set unless a large difference existed between their scores. When such a case arose, the section of the questionnaire in question was rated by a third trained rater. The two most similar scores were averaged, and that average was included in the data set.
The purpose of this study was to determine whether the mean scores on five sections of the OEQ (i.e., Psychomotor, Sensual, Imaginational, Intellectual, and Emotional) differed among the four groups of students—vocational female, vocational male, gifted female, and gifted male. The high-scoring responses were then placed onto a table and were discussed textually, to illustrate similarities and differences between the groups.
Method
Hypotheses
Because the students were identified by their gender and classification, three null hypotheses were constructed for each of the five OEQ scores.
For example, the three null hypotheses for the Psychomotor scores were as follows:
1H0: The mean Psychomotor scores do not differ between the vocational and gifted students.
2H0: The mean Psychomotor scores do not differ between the female and male students.
3H0: An interaction effect does not exist between student classification and gender when accounting for the variation in the Psychomotor scores.
Four additional sets of three null hypotheses were posed for the four remaining OEQ scores. Thus, a total of 15 null hypotheses were posed in this study.
Analytical Procedures
Each set of three null hypotheses was statistically tested through the use of a two-way ANOVA. It should be noted that because we were interested in the results for each of the five OE scores rather than an underlying hypothetical construct of the composite set of the dependent variables, univariate analyses rather than multivariate analyses were conducted (Newman & Benz, 1987; Thompson, 1999).
Three points should be noted regarding the two-way ANOVAs used in this study. First, our focus was placed on determining whether differences existed between the means of any two groups rather than the differences tested by simple main effects tests. Thus, six two-group comparison tests were conducted for any statistically significant main effect or interaction effect rather than simple main effects test often conducted when significant interaction effects exist.
Second, the statistical tests of the main effects and the interaction effect for each of the five OEQ scores were conducted at the .05 level. Each of the two-group comparison tests, however, was conducted at the more conservative alpha level of .01 in an attempt to control for inflated Type I error rates caused by multiple statistical testing.
Third, because the number in the four cells of the analysis (i.e., vocational female, vocational male, gifted female, and gifted male) were unequal, specific concern was given to whether the group variances were equal or unequal in the two-way ANOVAs. As noted by Glass, Peckham, and Sanders (1972), unequal variances and unequal (or disproportional) cell sizes may seriously affect the actual alpha level versus the nominal alpha level. Thus, as part of each two-way ANOVA, a statistical test of the homogeneity of group variances was conducted with Levene’s Test. If the F test value produced by Levene’s Test was significant at the .05 level, two courses of action would be considered. First, various transformations would be applied to the dependent variable. If a given transformation produced a nonsignificant F test under the Levene’s Test, those transformed scores would be used in the analysis. If none of the transformations produced the desired result (i.e., homogeneity of group variances), however, a second course of action would be taken. That is, students would be randomly deleted from the sample to produce proportional cell sizes. As discussed by Glass et al., unequal variances in a condition of equal (or proportional) cell sizes have only a very slight effect on the actual alpha level.
In addition to the various statistical tests conducted in this study, effect sizes were calculated for each main effect, interaction effect, and two-way comparisons. The effect sizes were measured with partial η2 values. The partial η2 values were classified as either small, moderate, or large according to criteria presented by Green, Salkind, and Akey (1997). That is, the partial η2 values less than .06 were classified as small, partial η2 values greater than or equal to .06 but less than .14 were classified as moderate, and partial η2 values greater than or equal to .14 were considered large. In addition to classification of the effect sizes, each effect size of a statistically significant main effect, interaction effect, or a two-way comparison test was compared with the effect sizes in a study (Piirto, Montgomery, & May, 2008) using the more recent OEQ-II, which uses a 5-point Likert-type scale and is less cumbersome to score.
Results
Quantitative Results
Test of variances and descriptive statistics
A review of each of the F tests produced by Levene’s Tests of the Psychomotor variances (p = .57) and Sensual variances (p = .11) revealed that the differences among the group variances were not statistically significant. Thus, these dependent variables were not transformed, nor was the total sample size reduced for the analyses of these variables to produce proportional gender-by-group cell sample sizes. The entire sample of 114 participants was used in the two-way ANOVAs of those two types of scores. The sample sizes and the descriptive statistics for the Psychomotor and Sensual scores are listed in Table 1.
Descriptive Statistics for the OE
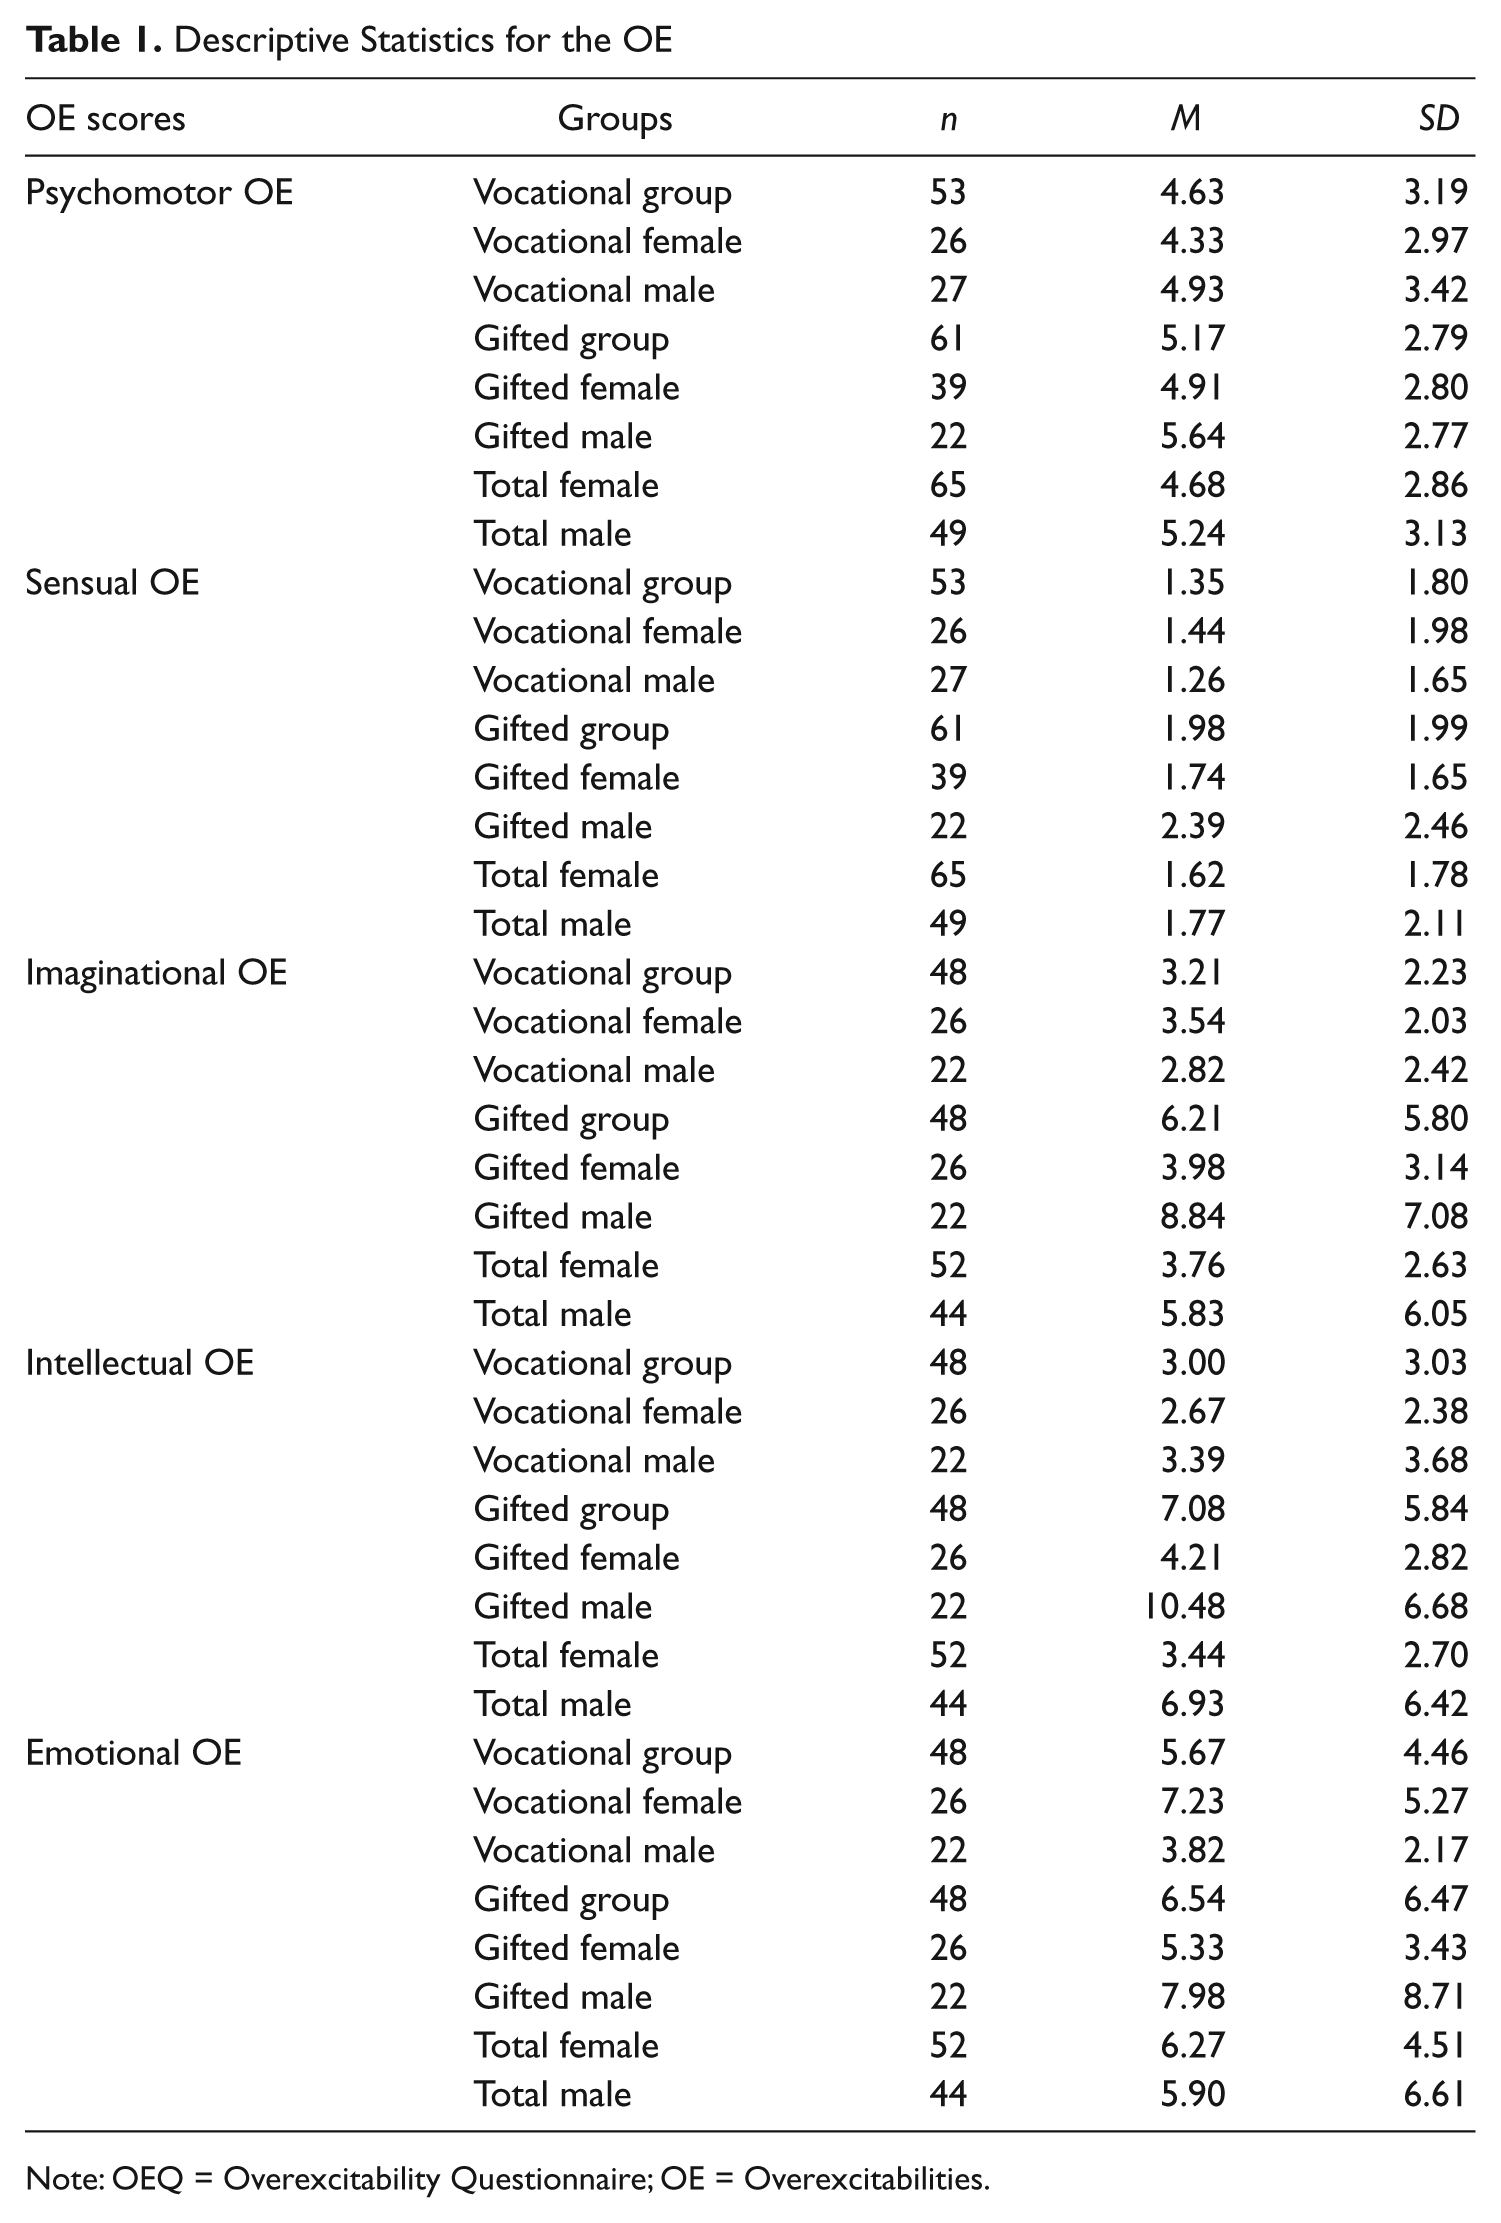
Note: OEQ = Overexcitability Questionnaire; OE = Overexcitabilities.
A review of the F tests produced by the Levene’s Tests of the group variances for the Imaginational scores (p < .01), Intellectual scores (p < .01), and Emotional scores (p < .01) indicated that the differences among the group variances were statistically significant. Various types of transformations of these three types of scores did not result in nonsignificant F tests of the differences in the variances. Thus, two-way ANOVAs for these three types of scores were applied to a reduced sample. Specifically, 5 vocational male students and 13 gifted female students were randomly deleted from the sample to produce a sample containing 26 vocational females, 22 vocational males, 26 gifted females, and 22 gifted males. These random deletions produced proportional cell sizes. A review of the Levene’s Tests of group variances for the Imaginational, Intellectual, and Emotional scores conducted using the reduced data set revealed that the differences among the group variances remained statistically significant for each of these three OE scores. The proportional cell sizes, however, would minimize the impact of these heterogeneous variances on the F tests conducted for the three OE scores. The descriptive statistics for the Imaginational, Intellectual, and Emotional scores are listed in Table 1.
Psychomotor scores
The results of the two-way ANOVA for the Psychomotor scores are listed in Table 2. The F test of the interaction effect between student classification and gender was not statistically significant (F = 0.01, p = .91). Because the interaction effect was not statistically significant, the statistical tests of the student classification and gender main effects were examined. Neither the F test of the student classification main effect (F = 0.92, p = .34) nor the gender main effect (F = 1.35, p = .25) was significant. Thus, differences among the Psychomotor mean scores of the groups were not statistically significant. The partial η2 values for the interaction effect, the student classification main effect, and the gender main effect were .01 or less, which are classified as small.
Two-Way ANOVA Results for the Five OEQ Scores
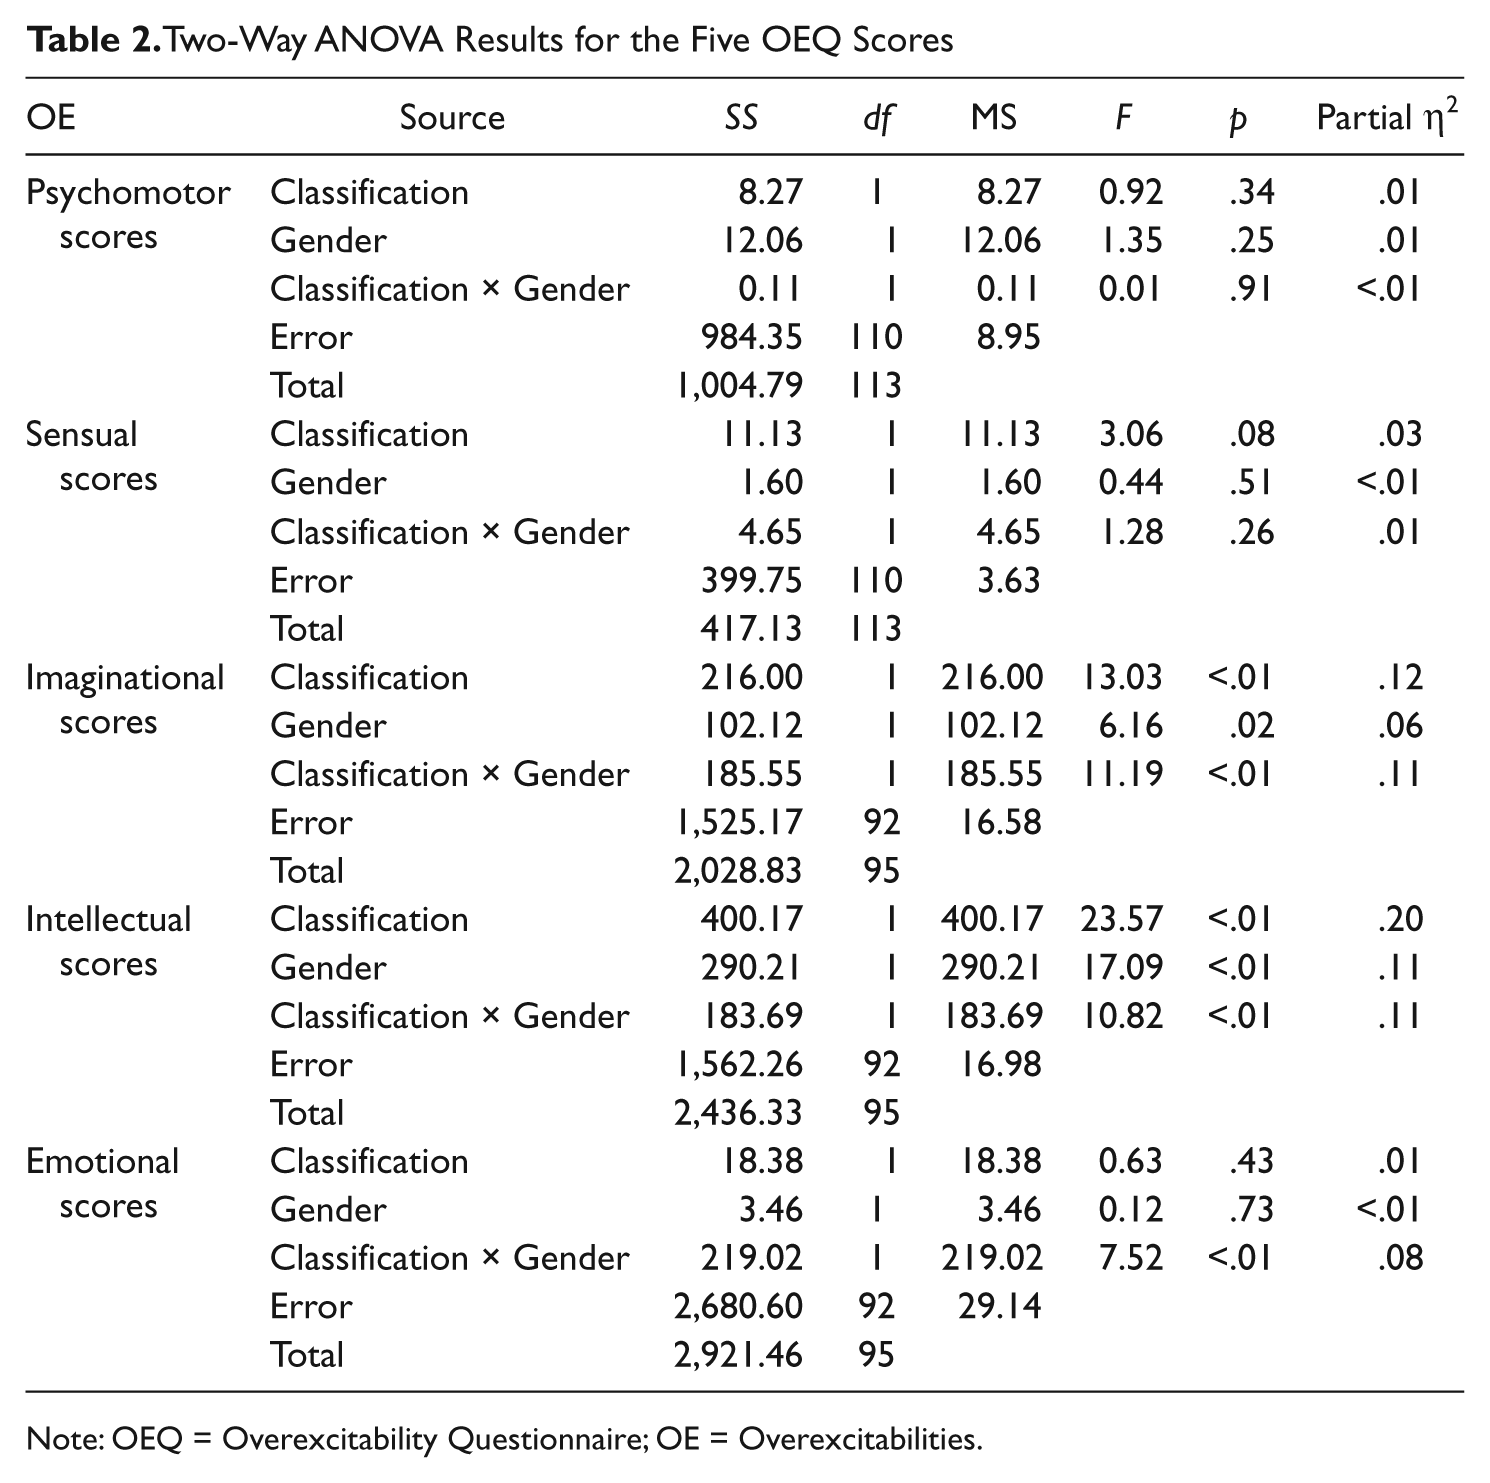
Note: OEQ = Overexcitability Questionnaire; OE = Overexcitabilities.
Sensual scores
The F test of the interaction effect between student classification and gender for the Sensual scores was not statistically significant (F = 1.28, p = .26), and its effect size (partial η2 = .01) was classified as small (see Table 2). Based on this result, the statistical tests of the student classification main effect and gender main effect were examined. The F tests of the student classification main effect (F = 3.06, p = .08) and the gender main effect (F = 0.44, p = .51) were not statistically significant. Thus, the differences among the Sensual mean scores of the groups were not statistically significant. The partial η2 value for the interaction effect was .03, whereas the partial η2 square values for the gender main effect and interaction effect were .01 or less. All three partial η2 values were classified as small.
Imaginational scores
The F test of the interaction effect (F = 11.19, p < .01) for the Imaginational scores was statistically significant (see Table 2). Its effect size (partial η2 = .11), which was classified as moderate (see Table 3), was larger than all but one of the effect sizes reported by Piirto et al. (2008). Because this interaction effect was significant, the statistical test results of the main effects were not interpreted, but rather the interaction effect was plotted and the six two-group comparisons of group means were conducted.
Comparison of Partial η2 With Two Studies
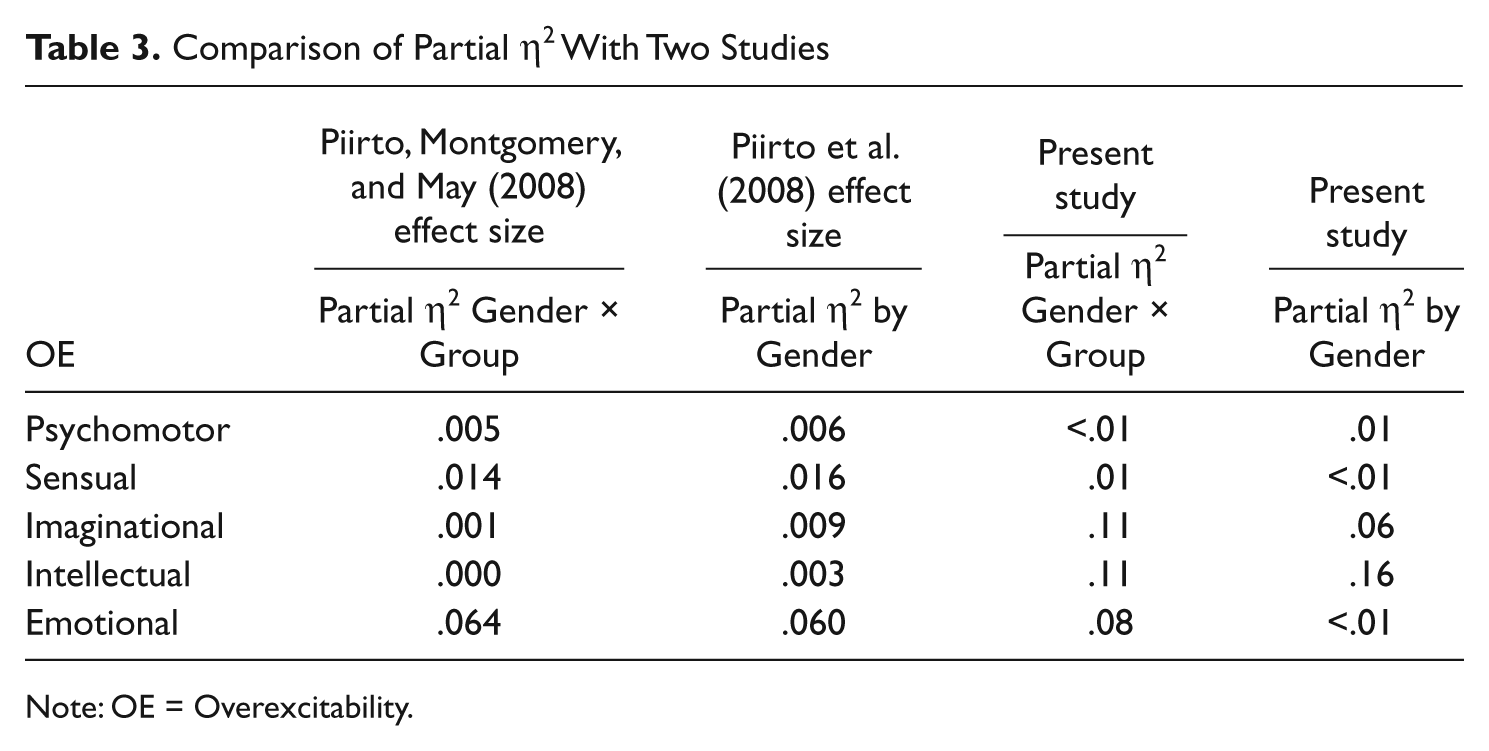
Note: OE = Overexcitability.
The interaction effect between student classification and gender is plotted in Figure 1. A review of the six two-group comparison test results, which are listed in Table 4, revealed that the Imaginational mean of the gifted male students (M = 8.84) is significantly higher than the Imaginational means of the vocational female students (M = 3.54), vocational male students (M = 2.82), and the gifted female students (M = 3.98) at the .01 alpha level. The differences between the means of the female students, vocational male students, and the gifted female students, however, were not statistically significant.
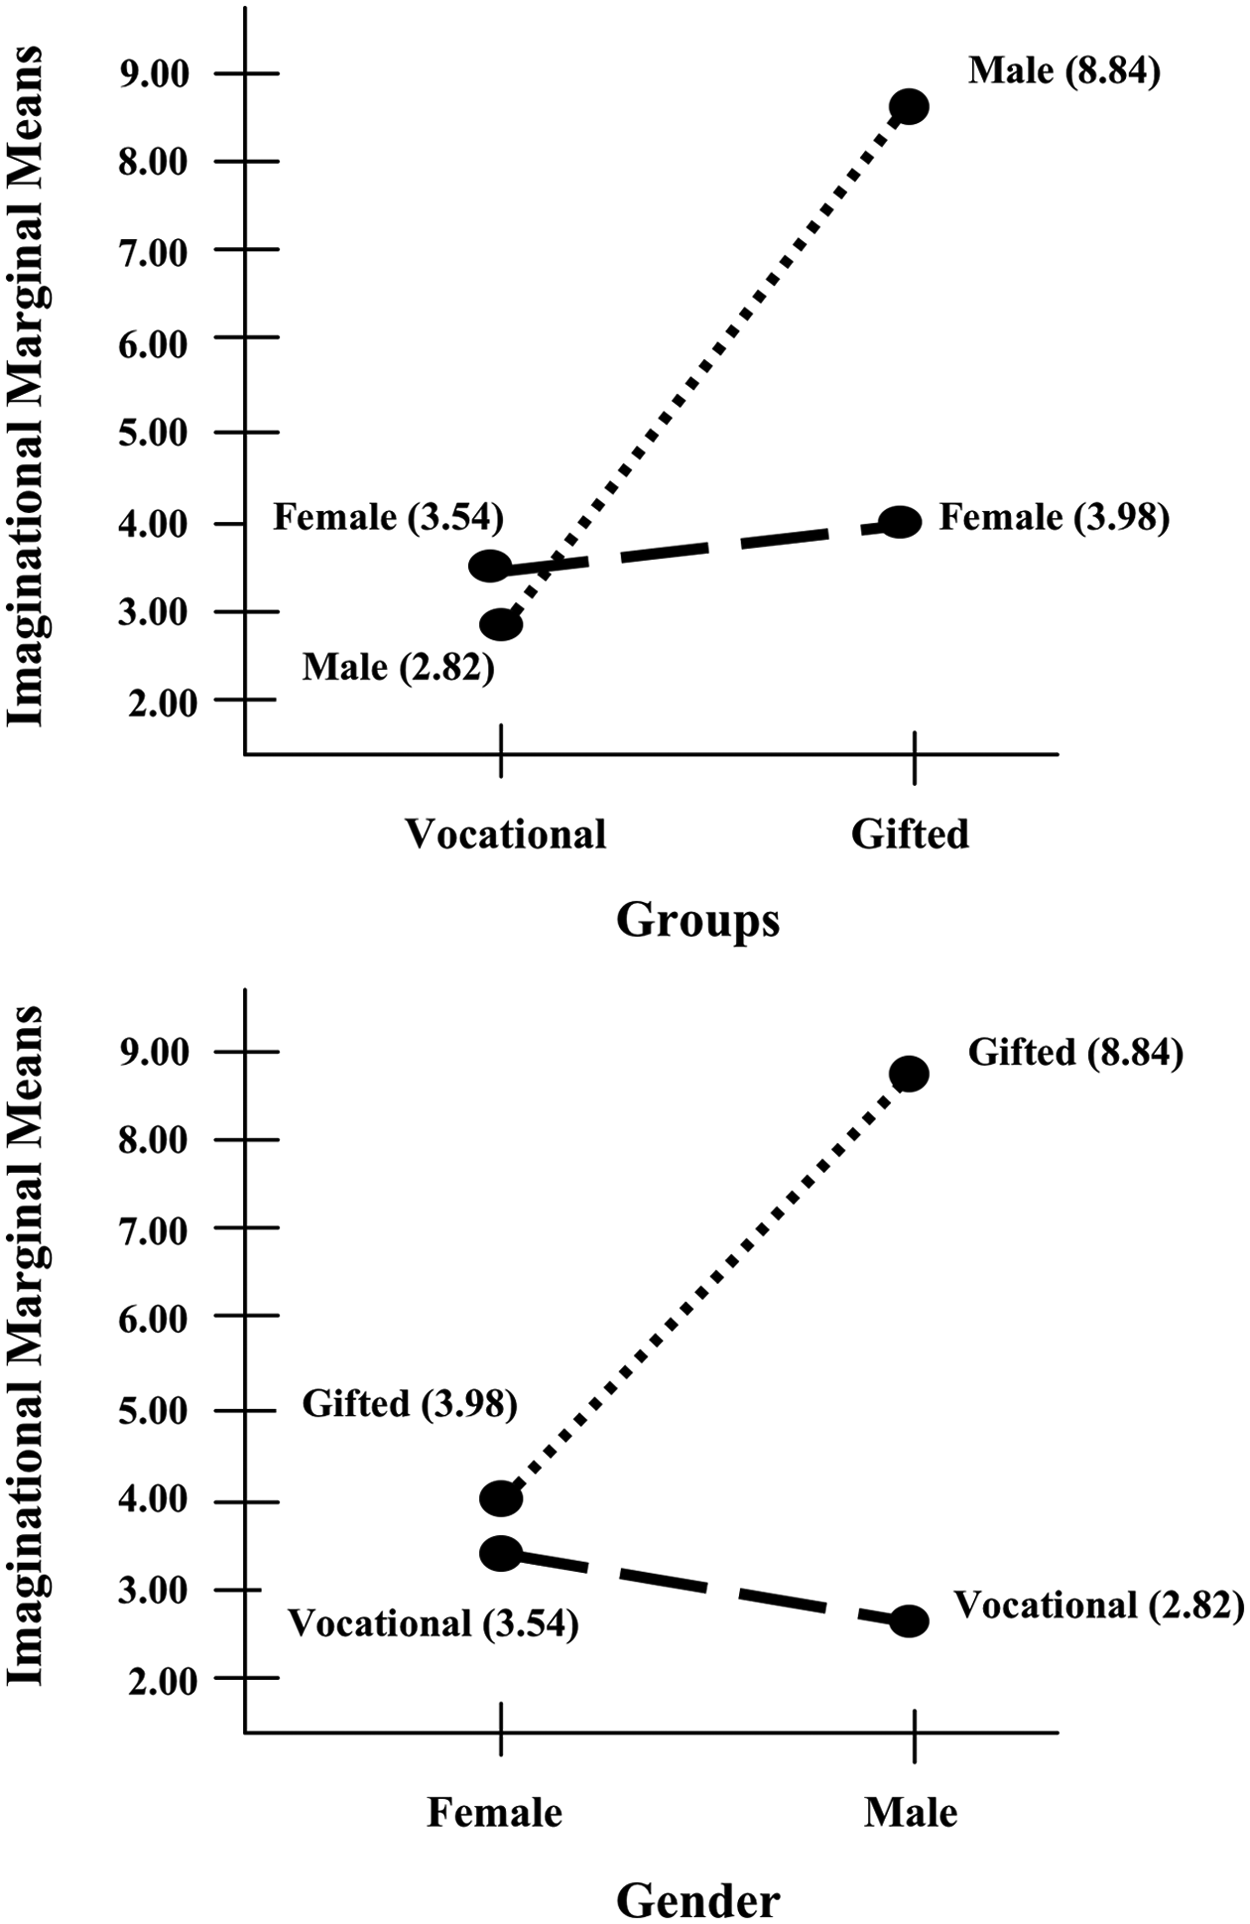
Imaginational interaction effect
Two-Group Comparison of Group Means
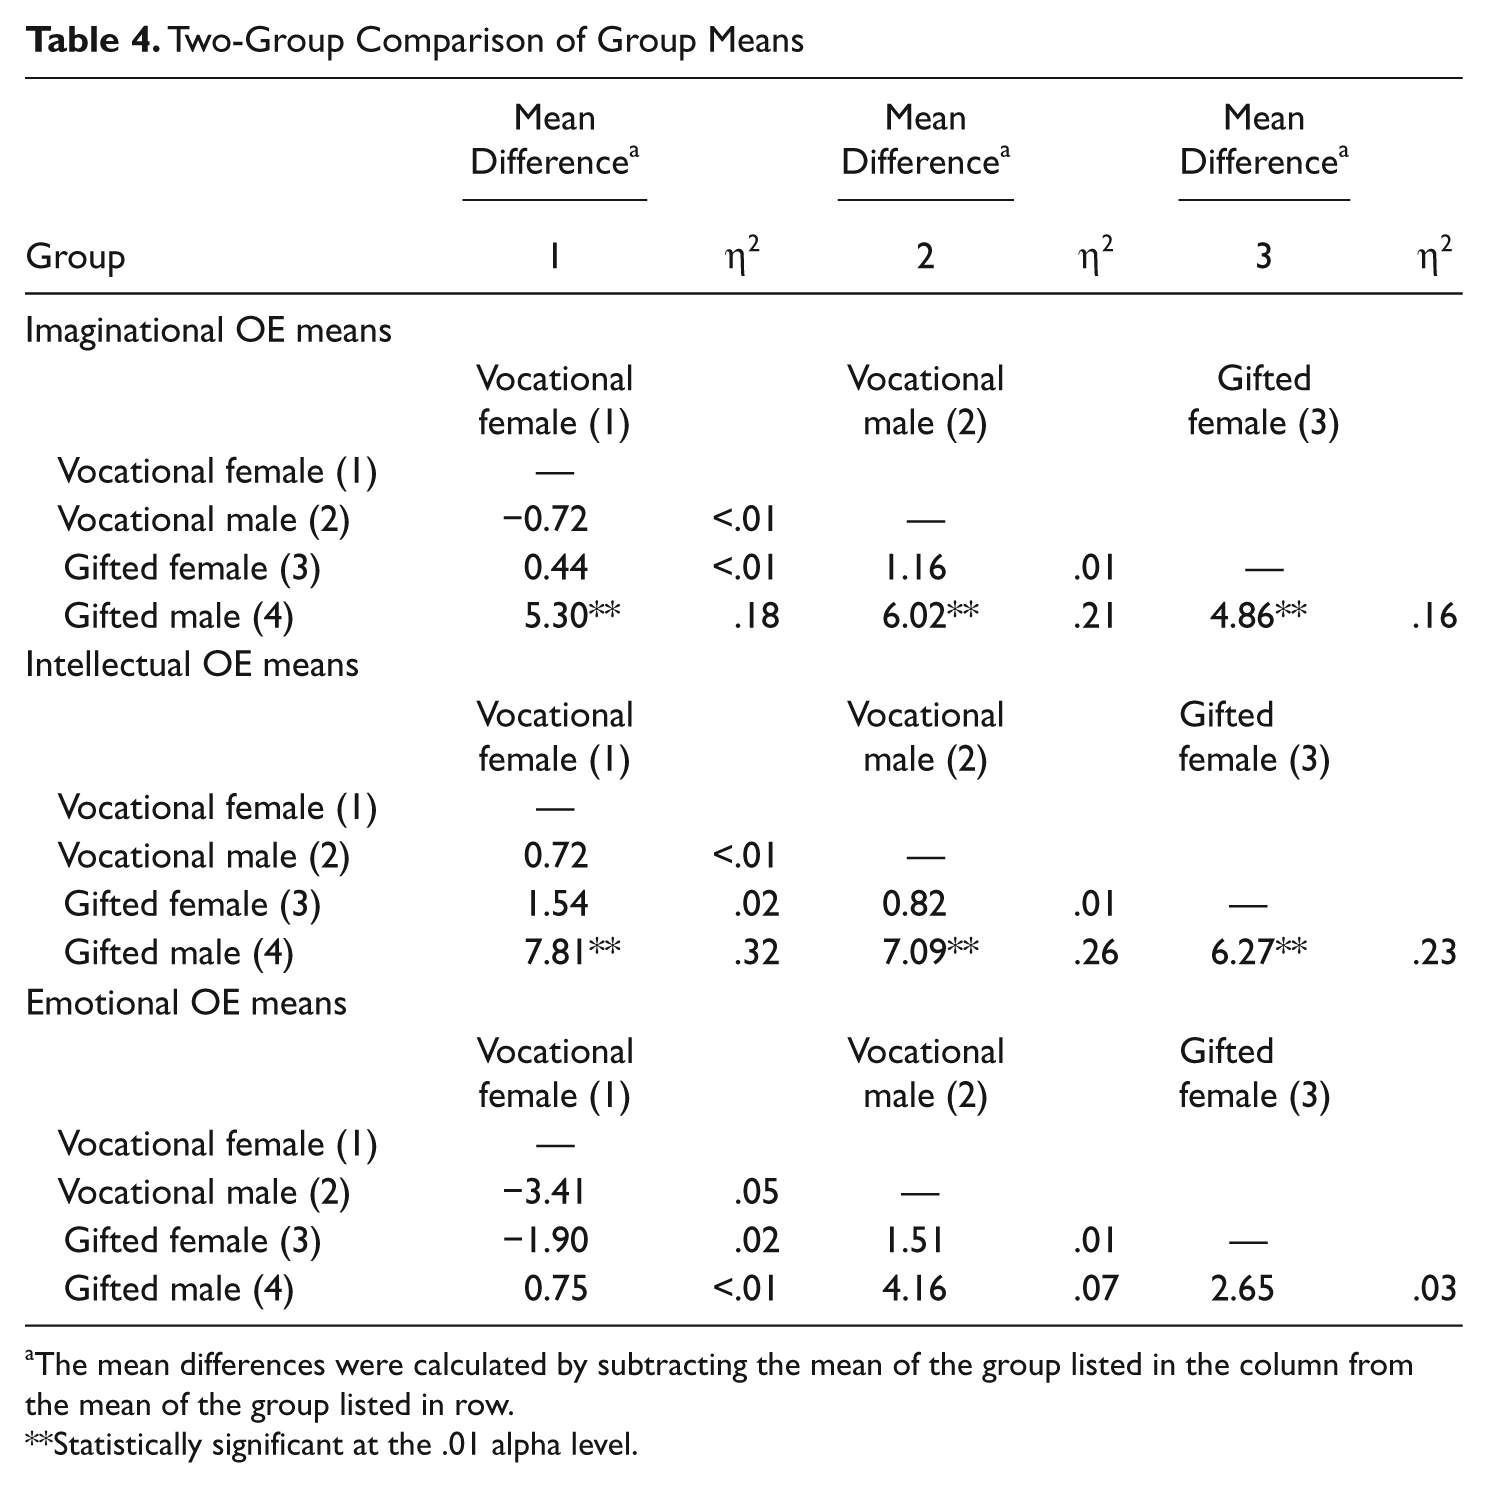
The mean differences were calculated by subtracting the mean of the group listed in the column from the mean of the group listed in row.
Statistically significant at the .01 alpha level.
The partial η2 square values for the differences between the Imaginational mean of the gifted male students and the Imaginational means of the female students, vocational male students, and the gifted female students were .18, .21, and .16, respectively (see Table 4). These effect sizes were classified as large, and they exceeded all of the effect sizes reported by Piirto et al. (2008).
Intellectual scores
The F test of the interaction effect between student classification and gender (F = 10.82, p < .01) for the Intellectual scores was statistically significant (see Table 2), and its effect size (partial η2 = .11) was moderate—larger than all but one of the effect sizes reported by Piirto et al. (2008). Once again, because this interaction effect was significant, the statistical test results of the main effects were not interpreted, but rather the interaction effect was plotted (see Figure 2), and the six two-group comparison tests were conducted (see Table 2).
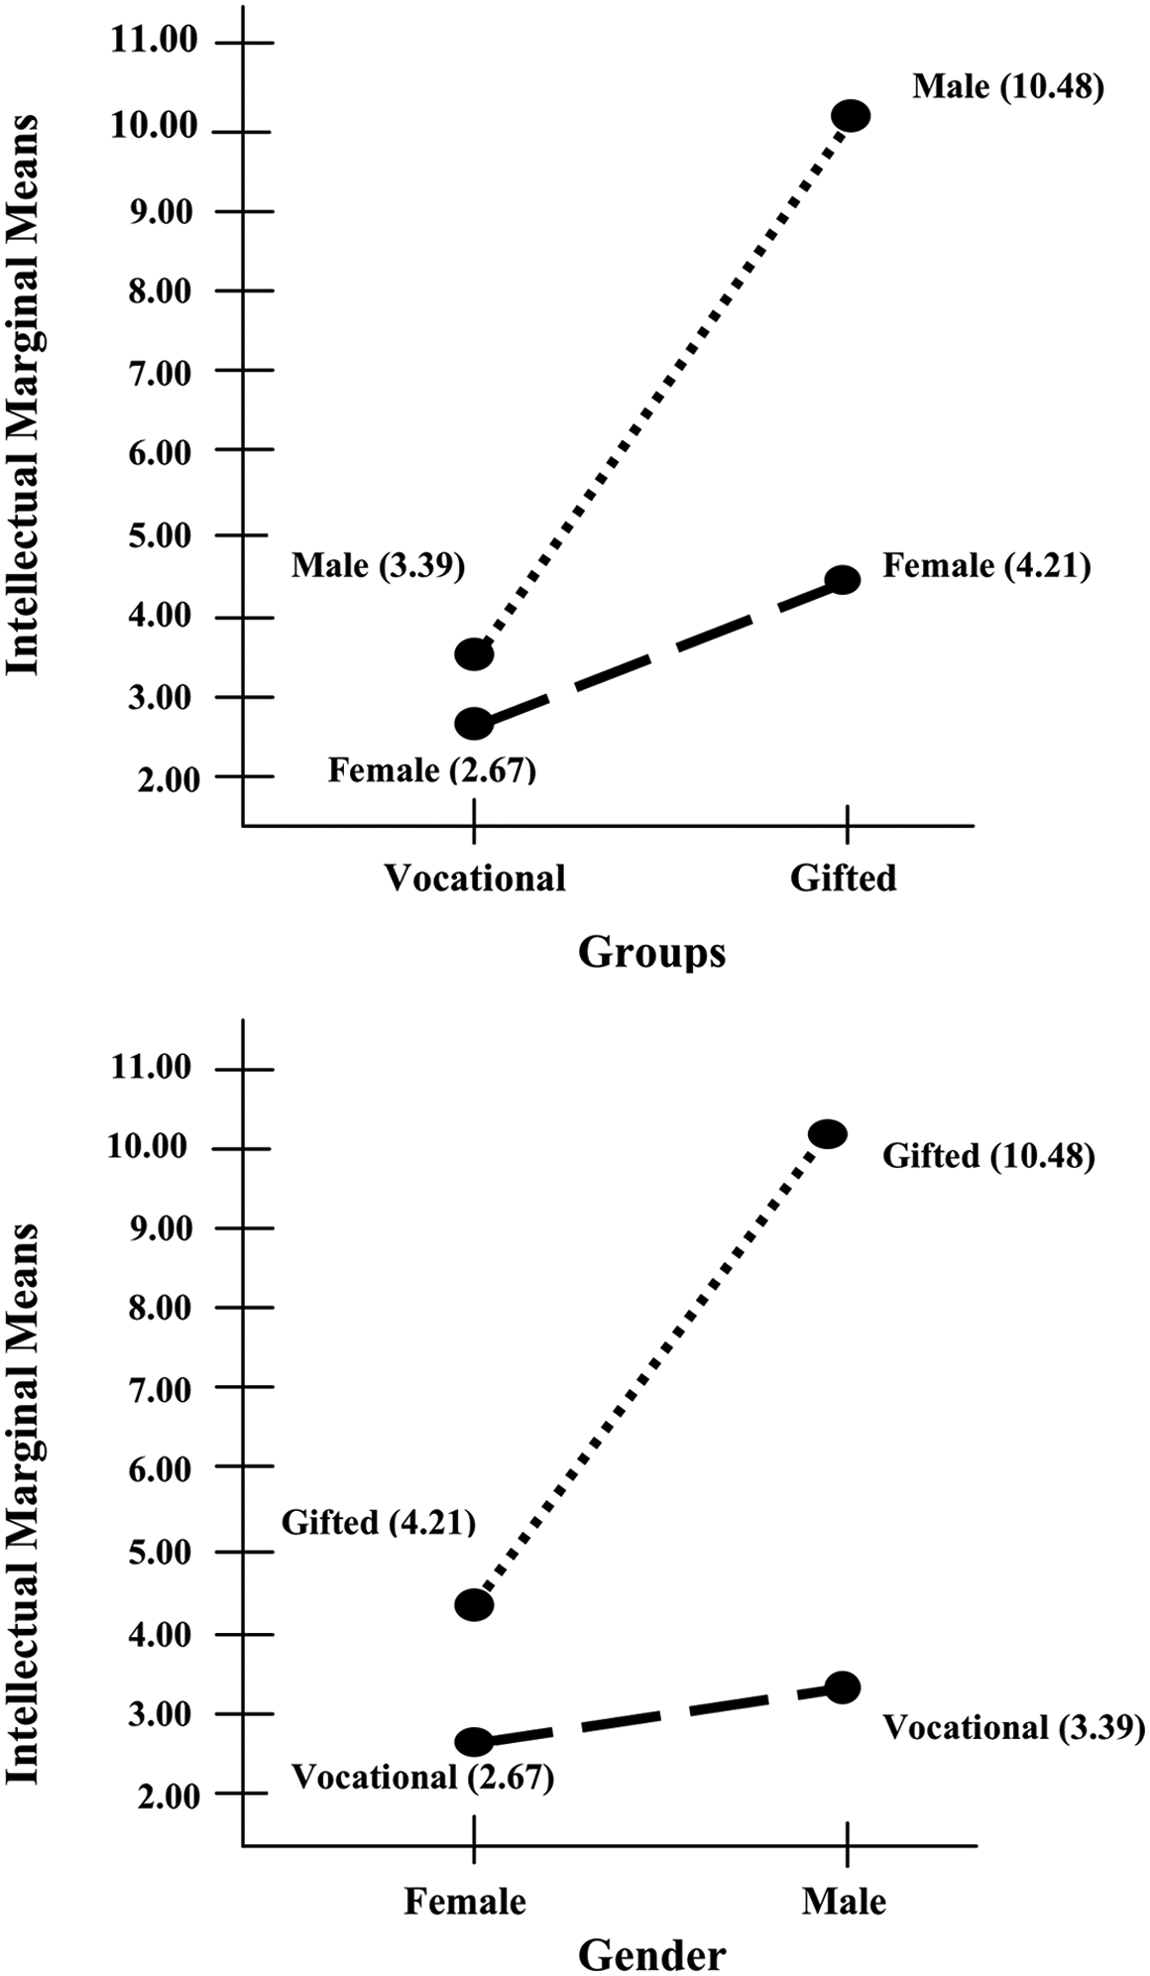
Intellectual interaction effect
Emotional scores
An examination of the six two-group comparison tests of the Emotional means revealed none of the differences among the group Emotional means was significant at the .01 level. In spite of the fact that the interaction effect was statistically significant at the .05 level, the differences among the Emotional means of the vocational female students (M = 7.23), vocational male students (M = 3.82), gifted female students (M = 5.33), and gifted male students (M = 7.98) were not statistically significant at the restricted .01 alpha level. See Figure 3 for the interaction plots. The effect sizes for these differences (see Table 4) were classified as small.
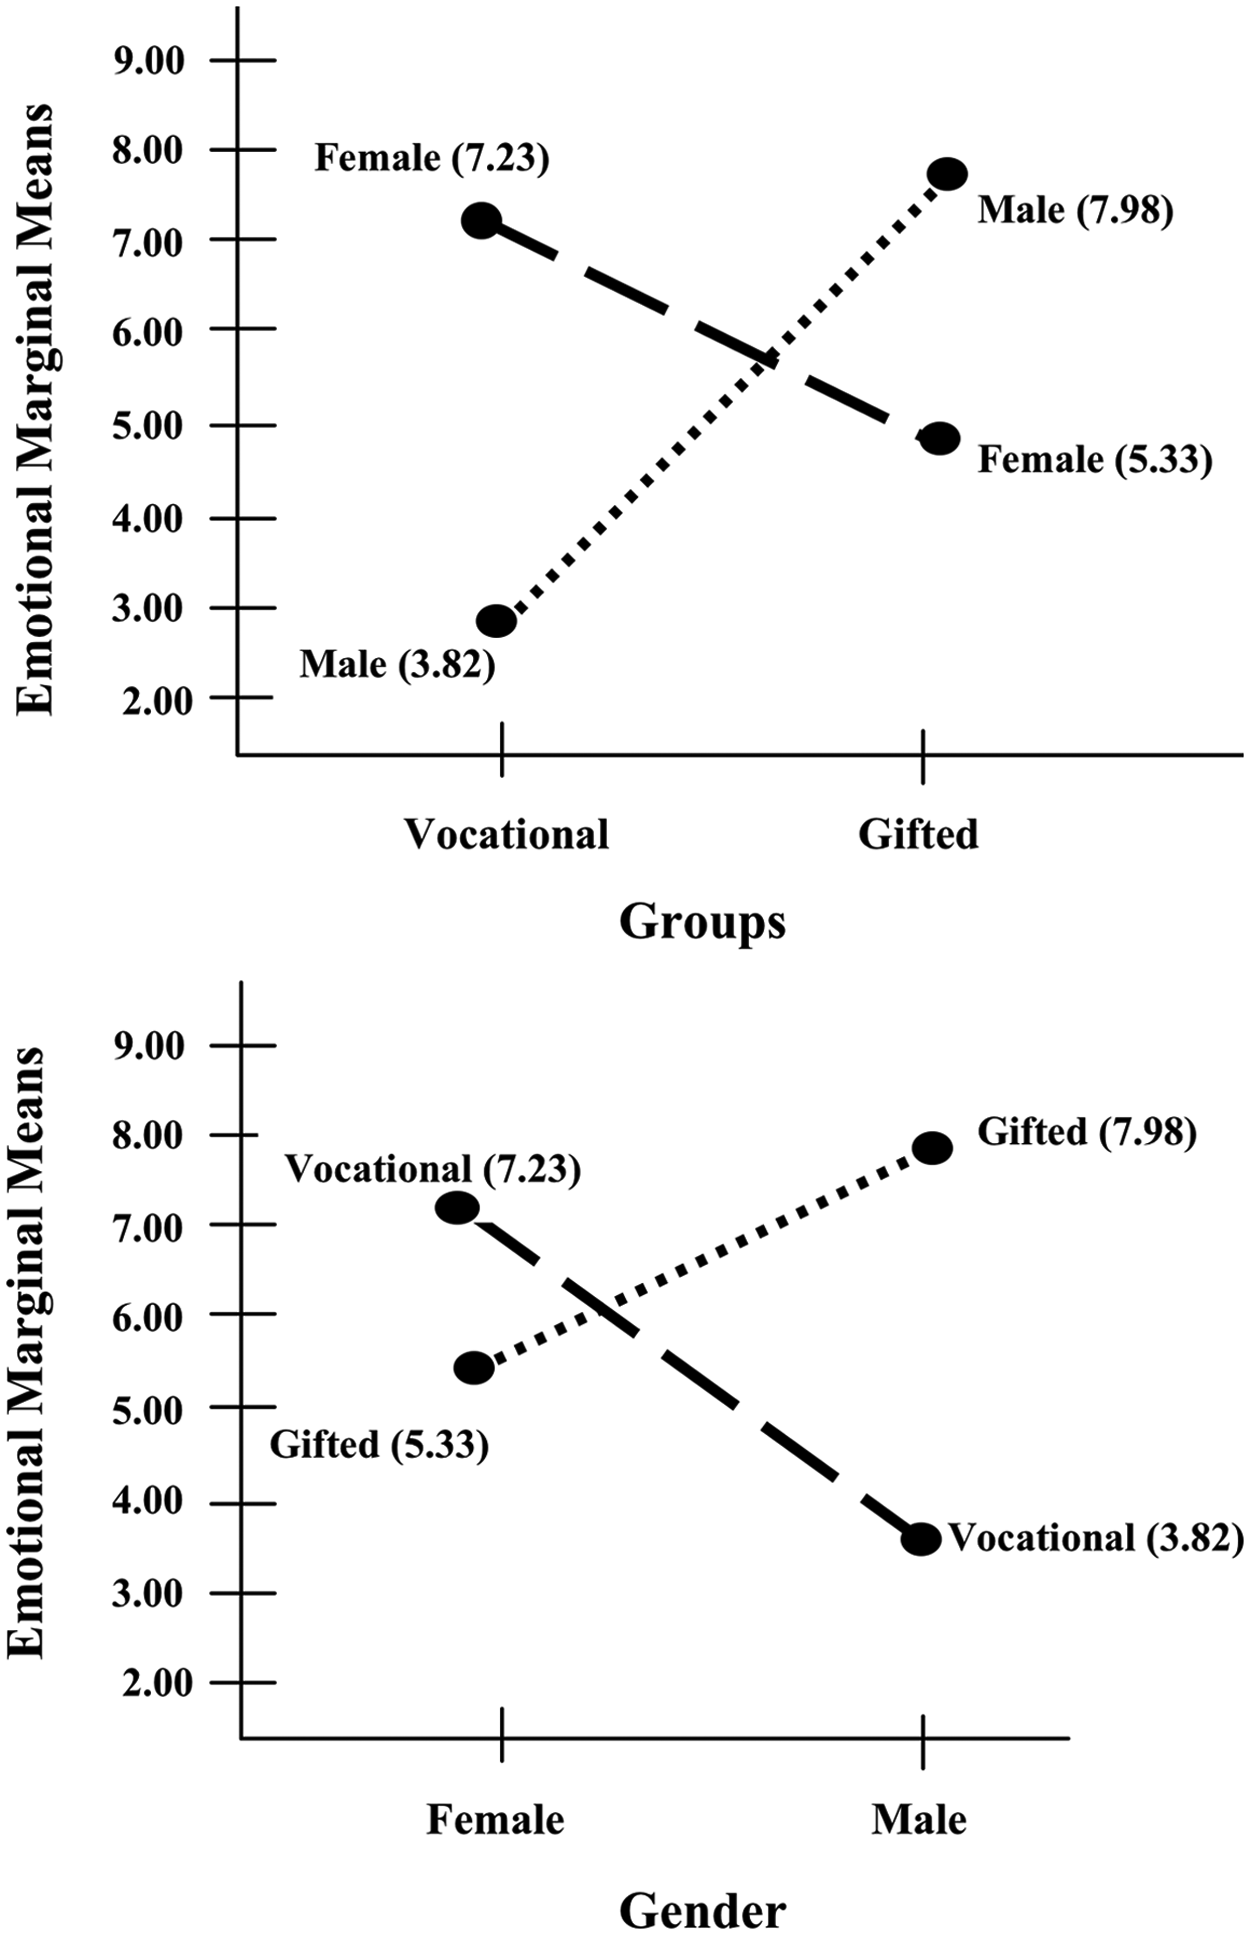
Emotional interaction effect
Qualitative Analysis
The qualitative analysis was textual (Fairclough, 2003). That is, we analyzed and commented on purposively selected vocational and gifted student responses. One response rated as a 3 (the highest) by a vocational student and one rated as a 3 by an identified-gifted student were selected for each question to illustrate the similarities and differences. Textual analysis considers the very words that are used, as well as the topics. Because the students were all responding to the same open-ended questions, and because their scores were the same, some comparison of content based on aspects other than intensity could be made. This examination revealed many similarities between the two groups’ answers to the 21 questions on the OEQ. Differences seemed to indicate differences in social class and social milieu. In response to the question, “What kinds of things get your mind going?” the identified-gifted adolescents were apt to answer with reference to books they had read; for example, “When I read transcendental works by Emerson and Thoreau, they get my mind going. The way they question the way of life makes me think a lot.”
Vocational high school adolescents were more likely to answer this question in ways emphasizing a rural outlook: “When I work on tractors. When I get a problem and have to solve it, how to fix it. Also when I am working on the farm and I come to a problem where it takes thought to fix it.” Both groups of students liked their boyfriends and girlfriends, liked sports (though the gifted and talented liked sports such as football and soccer and the vocational students liked sports such as motocross and tractor pulls), wanted happy families, and liked to spend time with their friends. Vocational students were more likely to make spelling and grammatical errors (which have been corrected in Table 5), and gifted students were more likely to use multisyllabic words.
Illustrative High-Scoring Responses to the OEQ for Identified-Gifted and Vocational Adolescents

Note: OE = Overexcitability.
Discussion
Discussion of Between-Group Differences
In comparing these results with the theoretical discussions about OEs (i.e., that those who are gifted are more intense, having high OEs), the presence of significant group differences in Intellectual, Imaginational, and Emotional OE were expected. However, using the strict .01 criteria for significance, no group differences were found. Thus, the presence of the Big Three in gifted adolescents was not confirmed. The only other empirical comparison study of adolescents using the OEQ, Ackerman’s (1997) study, found a difference in Psychomotor OE in two groups of Canadian adolescents, but also no difference in Intellectual OE. Thus, it cannot be definitively stated that identified-gifted adolescents are higher in Intellectual, Imaginational, and Emotional OE than those who are not identified as gifted.
Theoretical Meaning of the Present Study
Falk and Miller (2008) stated that the 19 studies they cited that used the OEQ included a total of 1,051 participants. The present study adds 114 to that number (1,165). This is a relatively low number of participants on which to confirm a theory, and the conflicting findings from the two available comparison studies of adolescents, the present study and the Ackerman (1997) study, indicate that as of yet there is no empirical confirmation of the Big Three OE hypothesis.
However, the present study’s findings must be treated as preliminary because of the small number of participants in the comparison groups. Onwuegbuzie and Slate (2005) recommended at least 80 participants in each comparison group for quantitative findings to have explanatory power. Because the present study did not have that number in each comparison group, it perhaps should be considered a pilot study or an interesting comment on the theory of Overexcitabilities, the Big Three, and the presence of intensity in gifted populations. It is worth noting, however, that the present study is the largest comparison study conducted to date using the OEQ with two different groups.
The assertion that people identified as gifted and talented are more likely to display higher OEs than people who are not identified as gifted and talented or intensities in all five areas—Sensual, Psychomotor, Imaginational, Emotional, and Intellectual—was also not confirmed by this study. Vocational high school students as indicated in this study, also displayed such intensities, and Table 5 indicates more similarities than differences in intense (score of 3) replies. Whether the identified-gifted and talented high school students were “truly” gifted and whether the not-identified vocational students were “perhaps truly” gifted does not apply here, for the working definitions in this article have used the state definitions, which are situational and political. It might be interesting to speculate that these results show that the vocational students were gifted, though unidentified, but that speculation is beyond the working definitions in this study. The state of Ohio has mandatory identification in all school districts, and so whether some of the vocational students were missed in the identification process is possible, but unlikely.
For now, it seems the assertion that gifted and talented students have greater Intellectual, Emotional, and Imaginational intensity than those who are not identified as gifted and talented does not hold.
Discussion of Gender Differences
Differences within the identified-gifted group
Identified-gifted boys were significantly higher than identified-gifted girls in Intellectual OE. This is surprising. This finding differs from the findings in the international study (Piirto et al., 2008), where there were no international significant differences nor differences within the U.S. gifted group. The latter study used the OEQ-II. Identified-gifted boys in the present study were also higher than gifted girls in Emotional and Imaginational OE, though the results were not significant given the .01 threshold requirement. Gifted girls were similar to vocational boys or girls, even in Intellectual OE. (See Table 2 for a comparison of means and Figures 1, 2, and 3 for a visual display of the differences.) There were no differences between the identified-gifted boys and identified-gifted girls in Sensual and Psychomotor OE.
Differences within the vocational group
Vocational boys and vocational girls showed no differences in any of the five OEs.
Further discussion
What should we make of these differences? Do gifted males more fit the popular belief that gifted people show more intensity, OE, and the like? Because the OEs are theorized to be innate, biological, or “Original Equipment,” in Piechowski’s view (M. Piechowski, personal communication, July 1989), the gender difference within the gifted population is even more interesting. For now, it seems the identified-gifted adolescent females do not show marked intensities.
How Dabrowski developed his theory about the presence of OEs was described by Piechowski (2008). Dabrowski used his clinical practice to define his hierarchical theory of levels of development. The theory was confirmed with case studies of both genders. Piechowski himself conducted much of the analysis of 6 clinical cases (3 males and 3 females) plus the diaries and biographical materials of Antoine de St. Exupéry, which had been distilled from an initial group of 81 cases. Piechowski analyzed these 7 cases in great detail for levels of development, and then “I read the material over again for the presence of Overexcitabilities” (p. 48). Thus, it cannot be said that Dabrowski’s original theorizing ignored females.
The lack of differences between the genders in Emotional OE is also interesting. Whereas the Miller et al. (1994) study indicated more Emotional OE in females of college age and adults, the present study did not show that. This is an intriguing question that would seem to call for more research. Do females possess greater Emotional OE? This study says “no,” at least not for identified-gifted 10th and 11th graders.
Effect Size Comparison and Discussion
A comparison study conducted with an international population using the OEQ-II (Piirto et al., 2008) and the present study showed small effect sizes for the presence of OEs (see Table 3). The present study indicated much higher effect sizes. Because the present study was of two groups, one of which was identified as gifted and the other not identified, these results are to be expected, given the theory that the gifted show higher OEs. The 2008 study compared two groups of gifted students, one Korean and one from Ohio, United States. Because the 2008 study contained a larger N, it might be viewed as more reliable and, again, serve to confirm that the presence of OEs in gifted populations holds true across international borders.
Uses of the OEQ
At this time, it seems that the question among researchers in the 1990s about whether the OEQ could be an alternative means of identifying giftedness is answered. The OEQ is cumbersome to score and analyze. Just scoring and entering the data for this small study took months. Given its labor intensiveness, we would not recommend the OEQ be used for gifted identification, especially given the conflicting results between the Ackerman (1997) study and the present study, and because there are so few comparison studies extant.
The OEQ may, however, be used as an observational tool to explore developmental potential of students and adults. Responses are often colorful, vivid, and indicative of passion and intensity. Piechowski (2006) used such rich and thick material as given by respondents to the OEQ in describing the OEs as manifest in many children and adolescents. The present study also includes such material, which illustrates the presence of intensity in adolescent populations.
The OEQ has also been explored as a means of alternative assessment of minorities and as a vehicle for identifying students who are creative (Breard, 1994; Domroese, 1994; Piirto, Cassone, & Fraas, 1996). Mendaglio and Tillier (2006) asserted that adults who were creative seemed to score higher on the Big Three OEs, but few studies comparing particularly creative students with noncreative students (whoever those may be) have been done (cf. Ackerman, 1999). At this time, the OEQ might serve as a vehicle for exploring the intensities of creative people or minority populations, but again, it should not be used to select creative people or minority populations for gifted programming.
People who like to write might find the OEQ an instrument much to their liking. The structure of the instrument and the direction of the questions have given some of my students a framework for describing their own students. Others have given one question per day as a writing prompt. For example, one high-IQ adolescent, in answering the question, “How often do you carry on arguments in your head?” seemed to have fun with humor and played with multiple personalities as he said,
We never argue inside my head. Well . . . almost never. A few times we have argued about why we never argue, and once all 5 of us argued about how there were really 10 of us, but that was over as soon as the other 20 of us showed up. Oh, and just yesterday we had an argument about what a smartass I am, but obviously I won, because I am still one as I write this answer.
There is a need for further studies. The OEQ-II seems to have superseded the OEQ, probably because of its ease of administration and scoring. In another study, Piirto (2010) recommended the OEQ-II use a Likert-type scale of 7 rather than its present range of 5 to give more subtlety in the choice of responses. Studies using the OEQ-II with such a scale should be conducted, and comparisons made between the two instruments.
However, the OEQ does have its uses, and although cumbersome to administer and to score, its rich data (see Table 5) provide insights not gained from the OEQ-II. The OEQ-II certainly is easier to administer and score. 1
Footnotes
The authors declared no potential conflicts of interest with respect to the research, authorship, and/or publication of this article.
The authors received no financial support for the research and/or authorship of this article.