
Abstract
From a sample of 1,242 third graders, prospective twice-exceptional students were selected using reading and math curriculum-based measures (CBMs), routinely used in Response to Intervention (RtI). These prospective twice-exceptional students were compared with non-twice-exceptional peers with similar strengths in either math or reading on CBMs and an end-of-year high-stakes achievement test. Students (both potentially twice-exceptional and not) who are potentially gifted in reading based on CBM performance did not differ significantly on the end-of-year outcomes in reading (p < .05); rather, students in both groups performed equally high. However, twice-exceptional students who are potentially gifted in math performed significantly lower on both end-of-year math and reading outcomes than non-twice-exceptional peers. Most of the end-of-year math subtest scores were negatively affected by the prospective twice-exceptional students’ deficits in reading, even though their math CBM scores placed them into a category representing giftedness in math. Implications for screening for twice-exceptionality are discussed.
Keywords
Results of state-mandated assessments have become increasingly important because of their impact on students, teachers, and schools (Bolt & Thurlow, 2004; No Child Left Behind Act [NCLB], 2002). Information garnered from these tests is often used for the evaluation of student progress, as well as for the determination of appropriate interventions for those experiencing a variety of academic difficulties, from those with learning disabilities to gifted students who need a greater degree of challenge and differentiation in the general education classroom. However, little is known about how twice-exceptional children perform on these important measures. Twice-exceptional is a term used to characterize students who simultaneously experience giftedness and one or more disabilities, including physical disabilities, emotional/behavioral disorders, attention-deficit/hyperactivity disorder (ADHD), autism spectrum disorder, or learning disabilities (Brody & Mills, 1997; Moon & Reis, 2004). In this causal-comparative study, we focus on the intersection of giftedness (as operationalized by high achievement in either math or reading) and learning disabilities. More specifically, we examine the performance of prospective twice-exceptional students on high-stakes, state-mandated tests relative to high-performing peers. Non-twice-exceptional peers are matched based on similarly high performance in either math or reading on curriculum-based measures (CBMs), used as screeners for potential giftedness, yet having a relative weakness in the opposing subject area.
Identification of Twice-Exceptionality
Although gifted students who are also designated as having a specific learning disability (SLD) represent the largest subgroup of twice-exceptional students, relatively few empirical research studies have been conducted to investigate the effects of twice-exceptionality on academic performance (Foley Nicpon, Allmon, Sieck, & Stinson, 2011; Lovett & Sparks, 2013). Even so, the scant literature is clear on this point: Twice-exceptionality in students presents unique challenges in terms of identification of both giftedness and learning disabilities. These challenges are often due to the variability in twice-exceptional students’ performance across subjects or the tendency for giftedness to obscure the need for a learning disability diagnosis (and vice versa). This phenomenon, called masking, is perhaps the most problematic aspect of identifying twice-exceptionality (Baum, 1990; Brody & Mills, 1997; Moon & Reis, 2004).
Baum (1990) identified three twice-exceptional groups that experience this masking effect: (a) students identified as gifted who exhibit difficulties in school and may be considered underachievers, (b) students identified as having a learning disability whose giftedness may not have been recognized or addressed due to average or low achievement in one or more academic areas, and (c) students identified as neither having a learning disability nor displaying giftedness due to abilities and disabilities masking each other. Although students appear to be achieving at an average level academically or seem to be getting by in the classroom, their performance may be far above or below that which would be predicted from their overall intellectual ability level.
In early grades, twice-exceptional students may be able to successfully compensate for academic weaknesses stemming from their learning disability. Strong cognitive abilities and metacognitive skills may allow them to effectively monitor, evaluate, and support their academic efforts, even in areas of weakness (Hannah & Shore, 2008). Thus, they may be overlooked for special education eligibility and are often noted as performing at, or slightly above, the level of their peers in the classroom (Brody & Mills, 1997). Eventually, as these students progress through school, their learning-disability-related challenges may become more difficult to overcome due to the increase in academic intensity and load. Consequently, if twice-exceptional students are identified at all, they tend to be recognized as twice-exceptional in the upper grades or in college (Ferri, Gregg, & Heggoy, 1997; Ruban & Reis, 2005).
Masking also limits the number of twice-exceptional referrals for gifted education, which is considered fundamental to the success of twice-exceptional students (Baum & Owen, 2004; Trail, 2010). Bianco (2005) confirmed that teachers are unlikely to recognize twice-exceptional students as gifted, just as they are unlikely to recognize twice-exceptional students as having a SLD. For example, in Project 2 Excel, an educational support program for twice-exceptional students, many teachers in general education, mixed-ability classrooms were surprised when researchers reported that their classroom contained a twice-exceptional student, often because the student appeared academically average rather than gifted (Rogers, 2011). Furthermore, student frustration related to unidentified strengths and weaknesses may lead to behavioral or social-emotional difficulties. Reis, Neu, and McGuire (1995) found that half of the postsecondary gifted students with learning disabilities they surveyed had sought out counseling for social and emotional problems, ranging from mild depression to contemplating suicide. Many discussed experiencing feelings of shame in knowing that they were smart while continuing to perform below their potential while in school.
Because the diagnostic picture is complex for twice-exceptional students, and because their learning disability may affect performance on cognitive testing, more comprehensive, sophisticated techniques should be used in the evaluation of this population for gifted services (Assouline & Whiteman, 2011; Brody & Mills, 1997; Nielson, 2002). Experts have contributed assessment recommendations; for example, Assouline, Foley Nicpon, and Whiteman (2010) recommended relying on a global index of intellectual ability, the General Ability Index, from the Wechsler Intelligence Scale for Children-IV (Wechsler, 2003). This is not influenced significantly by working memory and processing speed, unlike a more comprehensive Full-Scale IQ, which is affected by these abilities. Less is known, however, about how twice-exceptional status can affect variability on standardized achievement testing. This is important, especially because high-stakes tests of achievement are sometimes used for screening and/or identification of giftedness and learning disabilities and the determination of grade promotion (Bolt & Thurlow, 2004; Reis & McCoach, 2000).
High-Stakes Testing
Although definitions and characteristics of SLD vary by source, most experts agree that students with a SLD demonstrate deficits in academic achievement that cannot be attributed to factors such as global intellectual disabilities, lack of visual or auditory acuity, and inadequate instruction (American Psychiatric Association, 2013; Individuals With Disabilities Education Improvement Act [IDEA], 2004). As part of the diagnostic/prescriptive/monitoring process, these students are required to participate in state-mandated high-stakes tests (tests with important consequences for the test taker), as specified by IDEA and NCLB. By including students with specific learning disabilities in these high-stakes tests, schools gather valuable information that can be used to track their progress and improve educational outcomes (Elliott, McKevitt, & Kettler, 2002). Although it is important that students with SLDs participate in annual high-stakes tests, results may be misleading if the tests are less than comprehensive or are administered without appropriate accommodations.
Although researchers have investigated the extent to which SLDs can influence test performance, there is little in the present literature to address how twice-exceptionality manifests itself in high-stakes testing. This situation is confounded because unidentified twice-exceptional students are not allowed appropriate accommodations during standardized assessments.
Test Accommodations
Ideally, standardized tests provide an independently valid assessment of academic achievement for all students (Myen, Poggio, Seok, & Smith, 2006). In reality, students’ learning disabilities may confound accurate measurement of achievement, especially when tests measure not only the constructs for which they were intended but also construct-irrelevant factors such as the ability to understand and process a question or to effectively provide an answer (Helwig, Rozek-Tedesco, Tindal, Heath, & Almond, 1999; Parkes, Suen, Zimmaro, & Zappe, 1999). Reading achievement is an example of a factor that can influence test performance, even when a test is designed to measure a seemingly unrelated construct, such as math skills (Clements, 1980; Newman, 1977; Smith, 1994). Although we would expect a learning disability in reading to be reflected in a lower score on a reading portion of a standardized test, the influence of a learning disability in reading on a math portion of a test can contribute to an underestimation of math achievement if the math items contain reading content. Students with learning disabilities also have been shown to have a high incidence of deficits in processing speed and reading-related skills, such as phonological processing and reading fluency (e.g., Mather & Wendling, 2005), which may negatively affect performance on high-stakes tests across subject domains.
Another unintended construct that has the potential to influence students’ standardized test performance is general test-taking skills. Students with learning disabilities have been shown to have poorer test-taking skills than students without learning disabilities (Scruggs, Bennion, & Lifson, 1985; Scruggs & Lifson, 1986; Scruggs & Marsing, 1988; Scruggs & Mastropieri, 1988). Although the influence of learning disabilities on students’ test performance has been studied widely, little is known about how these consequences are influenced by the additional interaction of giftedness (i.e., twice-exceptionality).
Once a learning disability has been identified, subsequent testing should be administered with appropriate accommodations to ensure that the tests are measuring the intended construct, reducing the negative impacts of the learning disability on test performance (Thompson, Blount, & Thurlow, 2002). Reasonable accommodations include adjustments that are required to ensure a valid assessment for the individual, without changing the nature of the constructs being measured (Weston, 2003). The types of test accommodations for which students with learning disabilities are eligible vary widely from state to state and may include modified tests, extended time to complete tests, altered testing conditions, or other forms of nonstandardized administration (Bolt, Krentz, & Thurlow, 2002; Lai & Berkeley, 2012).
A review of studies on the use of accommodations for students with learning disabilities in math during otherwise standardized assessments revealed that these commonly used accommodations did not give the students with learning disabilities an advantage on the tests but simply allowed the tests to measure the constructs for which they were intended (Lindstrom, 2010). Some of the studies analyzed in this review offered evidence that testing accommodations give a differential boost to students with learning disabilities (Elliott, Kratochwill, & McKevitt, 2001; Ketterlin-Geller, Yovanoff, & Tindal, 2007; Weston, 2003). A differential boost describes the difference in improvement between students with and without disabilities when an accommodation is used (Phillips, 1994). The presence of a differential boost indicates that the accommodation is interacting specifically with the learning disability to improve the accuracy and fairness of the assessment (L. S. Fuchs & Fuchs, 2001; L. S. Fuchs et al., 2000).
Although testing accommodations help ensure a valid standardized assessment, accommodations are available only after a learning disability has been identified. This can become a “catch-22” situation, given that the learning disabilities of twice-exceptional students are often unrecognized. Consequently, many twice-exceptional students sit for high-stakes standardized tests without compensatory accommodations in place. If twice-exceptional students are not getting services in the classroom or accommodations during tests, their performance on achievement tests may underestimate their true academic progress, perhaps in the areas in which their disabilities are most salient. Alternatively, these areas of weakness may limit a twice-exceptional student’s performance on his or her strongest subjects. Furthermore, “the literature and anecdotes that parents and teachers share suggest a critical need for programming for” twice-exceptional students (Yssel, Margison, Cross, & Merbler, 2005, p. 42). Therefore, it is of utmost importance for teachers and administrators to have an accurate understanding of how learning disabilities in twice-exceptional students might influence measures of their academic achievement.
Introduction of a New Paradigm
IDEA (2004) changed the systematic identification and intervention procedures of students with learning disabilities for school systems that adopt a Response to Intervention (RtI) model, as opposed to the much-criticized aptitude-achievement discrepancy model. RtI is designed to assess and monitor all students, using CBMs early in the school year and to monitor at-risk students often throughout the year. RtI allows educators to target students who are at risk, often defined as those performing in the lowest 10% to 25% relative to peers in their grade. These lowest performing students then progress through multiple assessments designed to monitor their progress and a series of interventions within tiers. Typically, if a student fails to make adequate progress within these tiers and competing diagnoses can be ruled out, he or she may be identified as having a SLD; alternatively, some systems may require additional testing after failing to make adequate progress in the last tier to determine the presence of a processing deficit, one that can be linked to the academic limitation(s) of the student. One commonly used method for identifying students who fail to make adequate progress is to identify students who perform within the lowest 10% after receiving scientifically based interventions within the tiers, and whose rate of progress is less than that of students whose rate of progress is at the 25th percentile (D. Fuchs, Fuchs, & Vaughn, 2008).
Although many school systems across the country have adopted the RtI model, researchers have expressed concern that it is not responsive enough to screen for twice-exceptional status (Adams, Yssel, & Anwiler, 2013; Crepeau-Hobson & Bianco, 2011; McCallum et al., 2013; Postma, Peters, Gilman, & Kearney, 2011). That is, although the CBMs used within the RtI model can operationalize below-average performance, these measures are not typically used to identify above-average performance that characterizes gifted or twice-exceptional students. Furthermore, the RtI method relies heavily on classroom teachers—who may not be trained to look for signs of twice-exceptionality in their classrooms—to monitor academic progress using the CBMs. They may view a twice-exceptional student as bright but lazy and may be less likely to consider other twice-exceptional characteristics such as uneven cognitive and academic performance (Baum, 1990; Postma et al., 2011).
RtI data are often used in schools to screen for SLDs, and in recent years, methods have been developed to use RtI data to screen for giftedness (Brown, 2012; Carey, 2012; Rollins, Mursky, & Johnsen, 2011). In fact, the RtI approach has been hailed as a promising fit for twice-exceptional students, due to early intervention strategies and a multifaceted approach to both strengths and weaknesses (Pereles, Omdal, & Baldwin, 2009). However, as currently implemented, RtI data are not used to screen twice-exceptional students, although there is potential to do so based on the copious data generated by early and universal screening measures (Robinson & Stein, 2013).
For example, McCallum, Bell, and colleagues (McCallum, Bell, & Coles, 2012; McCallum et al., 2013) recently presented a model for screening for twice-exceptional status within the RtI paradigm. They used psychometrically robust CBM instruments, Monitoring Instructional Responsiveness: Reading (MIR:R; Bell, Hilton-Prillhart, McCallum, & Hopkins, 2011) and Monitoring Instructional Responsiveness: Math (MIR:M; McCallum, Hopkins, Bell, & Hilton-Prillhart, 2011), that are group-administered and produce scores reflecting multiple elements of both reading (e.g., fluency and comprehension) and math (e.g., computation, mathematical reasoning). These researchers used the MIR:R and MIR:M to identify students who performed at the upper extreme in reading but in the at-risk range in math (i.e., there was a significant discrepancy). Next, they identified another subset of students who performed at the upper extreme in math but in the at-risk range in reading. Both groups were characterized as potentially twice-exceptional. Percentages of students changed as a function of different criteria for both at-risk status and giftedness, and some percentages conformed to rates consistent with current twice-exceptional population estimates (Idaho Department of Education, 2010; Lovett & Sparks, 2013; Trail, 2010; Wormald & Vialle, 2011). However, their data relied on the MIR:R and MIR:M measures to screen twice-exceptional status but did not address how twice-exceptional students’ performance compares with their non-twice-exceptional peers on external measures such as high-stakes tests.
Purpose
Given the limited research that explores twice-exceptional students’ performance on high-stakes, state-mandated tests, there is a need to continue this line of research and to investigate the performance of prospective twice-exceptional students relative to non-twice-exceptional peers. In this study, we compared reading and math scores from the Tennessee Comprehensive Achievement Program (TCAP; Tennessee State Department of Education, 2012) of prospective twice-exceptional students (identified by scores on the MIR instruments, specifically higher reading vs. math scores or higher math vs. reading scores) and non-twice-exceptional students with similarly high MIR scores (on the highest academic area). Because of a masking effect, we predicted that mean composite TCAP math scores of prospective twice-exceptional students would be significantly lower than those of their non-twice-exceptional peers who have similarly high MIR:M (Math) scores. In the same way, we predicted that mean composite TCAP reading scores of prospective twice-exceptional students would be lower than those of their non-twice-exceptional peers with similarly high scores from MIR:R (Reading). In addition, because MIR and TCAP instruments operationalize math and reading performance differently, MIR scores may not predict end-of-year TCAP scores for prospective twice-exceptional students.
Method
Procedures
Participants
Participants included 1,242 third-grade students (53% female and 47% male, 95% Caucasian, and 59% considered economically disadvantaged) from a large school district, including eight elementary schools in the Southeastern United States.
As part of implementation of RtI within the district, students were administered reading and math universal screeners (CBMs) across 3 years. Each third-grade cohort was given three universal screeners; the first was given at the beginning of each school year, the second was given in the middle of each school year, and the third was given at the end of each school year. Students also completed math and reading statewide achievement tests at the end of each school year.
Instruments
MIR
The MIR:R and MIR:M are group-administered CBMs given silently for 3 minutes each. On the MIR:R, students are required to read both narrative and expository graded passages containing no punctuation and to draw a line after each idea or sentence. The MIR:R yields a score that takes into account reading fluency and reading comprehension. Reading fluency is a function of how many ideas a student attempts (i.e., marks with a slash), and reading comprehension is a result of the percentage of ideas attempted that each student marked correctly. On the MIR:M, students are required to complete math operation problems with minimal reading required. In addition, the MIR:M includes both a math calculation composite and a math reasoning composite that are summed to create a total math composite.
Designed to be used as curriculum-based assessments in a comprehensive RtI program, reliability and validity estimates are available for both the MIR:R (Hilton-Prillhart, 2011) and the MIR:M (Hopkins, 2010). Alternate-forms reliability estimates were obtained throughout the school year rather than in immediate succession. As expected, reliability decreased as the length of time between administrations increased. Average alternate-forms reliability for the MIR:R was .75. This coefficient includes comparisons of administrations across the year, with administrations given closer in time having significantly larger coefficients than .75. Validity estimates using reading CBMs yielded correlation coefficients ranging from .43 to .86. A validity comparison with the AIMSweb© Maze (Shinn & Shinn, 2002) produced a median estimate of .55 for third grade (Hilton-Prillhart, 2011). In addition, a stepwise regression analysis showed that AIMSweb© Maze did not significantly increase the MIR:R’s prediction (R2 = .37) of Star Reading Scores (Advantage Learning Systems, 1997). Similarly, the MIR:M had alternative-forms reliability ranging from .59 (Probe 1 with Probe 11) to .80, with administrations closer in time resulting in larger coefficients. Specifically, across the probes, alternate-forms reliability estimates of two successive probes ranged from .71 to .80. Estimates from comparisons with other math CBMs yielded correlation coefficients ranging from .58 to .75 (Hopkins, 2010). Concurrent validity estimates with the Monitoring Basic Skills Progress (MBSP; L. S. Fuchs, Hamlett, & Fuchs, 1999) and Star Math (Advantage Learning Systems, 2002) were .61 and .65, respectively.
Statewide achievement assessment
At the end of each school year, students were given the TCAP, a criterion-referenced, statewide assessment of academic skills and achievement in math, reading, social studies, and science. Reliability coefficients are reported as ranging from .95 to .96 (Miller, DeLapp, & Driscoll, 2007). Each academic area yields a scale score ranging from 600 to 900. Scale scores from each area resulted in a placement into four achievement categories: Below Basic, Basic, Proficient, and Advanced. Students who score in the Proficient and Advanced ranges are said to have reached proficiency. Scores ranging from 600 to 708 for reading and from 600 to 702 for math are considered Below Basic, scores from 709 to 759 for reading and from 703 to 754 for math are considered Basic, scores from 760 to 796 for reading and from 755 to 790 for math are considered Proficient, and scores from 797 to 900 for reading and from 791 to 900 for math are considered Advanced. In addition, each academic area is comprised of subscales with scores ranging from 0 to 100. According to the Tennessee State Department of Education (2012), this score, the Reporting Category Performance Index (RCPI), is the number of questions, out of 100, that each student would be expected to answer correctly, based on the percentage of problems the students correctly answered in a particular subtest. Reading is comprised of the following nine subscales: Language, Vocabulary, Writing and Research, Communication and Media, Logic, Information Text, Literature, Reading Composite, and Language Arts Composite. Math is comprised of the following five subscales: Mathematical Processes, Number and Operations, Algebra, Geometry and Measurement, and Data Analysis, Statistics, and Probability.
Data Analyses
For this study, the first universal screener was used because of the approximately equivalent administration time (mid- to late September) across all 3 school years. In addition, because universal screeners (CBMs) are meant for all students and because they offer the earliest opportunity for educators to identify strengths and weaknesses for further monitoring, they provide critical information within a RtI framework. Across the 3 years, 1,242 third-grade students (n = 414 for Year 1, n = 419 for Year 2, and n = 409 for Year 3) had scores on both the first universal screener and the end-of-year TCAP. To account for possible cohort differences, students’ MIR:R and MIR:M scores were separately converted, by year, to standard scores with a mean of 100 and a standard deviation of 15. To maintain consistency of comparison, the same procedures were used with the TCAP reading and math scaled scores.
To identify students with a significant strength in reading or math and who may be potentially gifted, students with a standard score greater than 115 (>84%) on the MIR:R and MIR:M were identified; those who might also have a SLD were identified based on a reading or math weakness (see McCallum et al., 2013). These procedures allowed us to identify students who not only have a normative strength in one academic area but also have a weakness in another. Specifically, to identify students who had a significant ipsative weakness (intraindividual weakness), each MIR measure was regressed onto the other MIR measure, and unstandardized predicted scores were saved. We then calculated the standard error of the estimate (SEe) using the following equation:
Next, we subtracted the observed score from the predicted scores. If the difference between the predicted score and observed score for a given student was greater than the SEe, that student was identified as having a weakness in that academic area relative to the predicted score. By using the predicted score, we were able to account for regression toward the mean. Furthermore, the SEe allowed us to identify students whose scores were below the average error range. We chose these criteria because this is a procedure meant to identify students who are potentially twice-exceptional. Students with an academic strength (SS ≥ 115) in one area and a personal weakness in the other academic area (predicted-observed > SEe) were identified as potentially twice-exceptional. Of the total sample, 197 students were identified with a reading strength, and 212 students were identified with a math strength. Students not identified with a reading or math strength were eliminated for comparative analyses. In total, 327 students had an academic strength in at least one of the two academic areas (n = 108 for Year 1, n = 112 for Year 2, and n = 107 for Year 3). Peer comparison groups were formed by selecting students with similar strengths in the higher subject area (i.e., reading or math) but no significant weakness in the other subject area.
Results
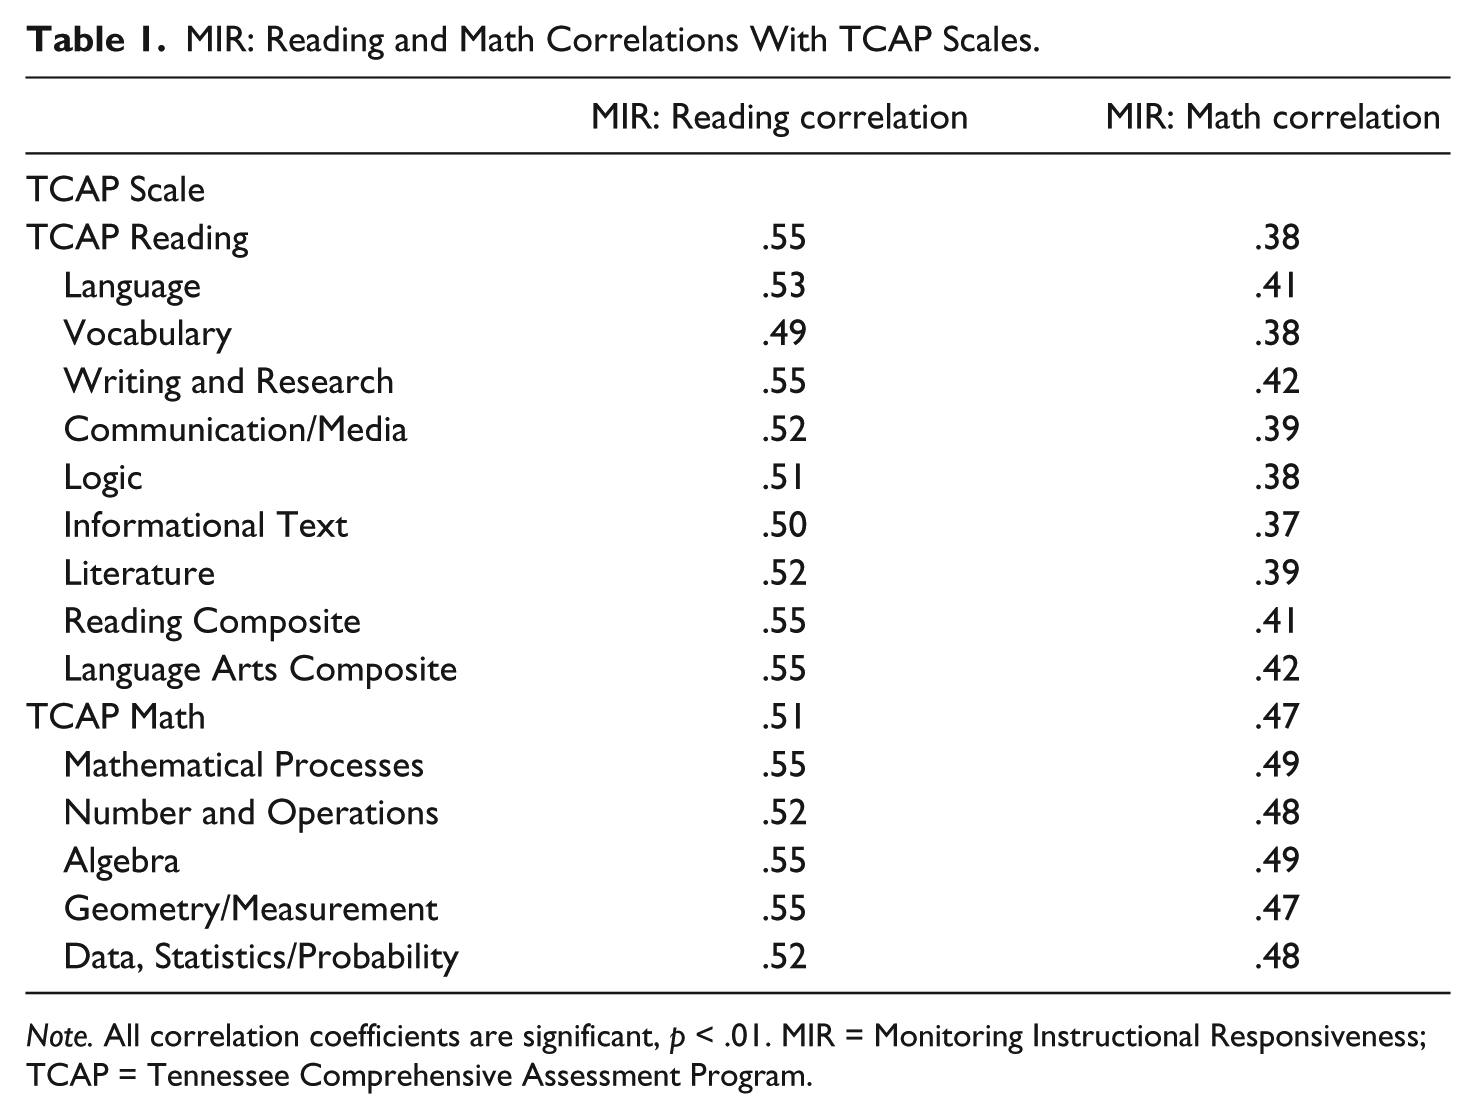
Descriptive and inferential data, including intercorrelations between MIR and TCAP scales, and means, standard deviations, and effect sizes of prospective twice-exceptional and non-twice-exceptional peers, are shown in Tables 1, 2, and 3. As is apparent in Table 1, all intercorrelations among the MIR and TCAP scores are statistically significant, revealing moderately strong relations among the two instruments. For example, the MIR:R correlation with TCAP Reading Composite (r = .55) and the MIR:M correlation with TCAP Math Composite (r = .47) are considered to be medium to large (Cohen, 1988) and are typical of relations among academic measures found in other studies (e.g., Woodcock, McGrew, & Mather, 2001, 2007). Also, almost 6 months elapsed between administration of the MIR probes and the TCAP, which negatively affected the magnitude of these correlations. Nonetheless, correlations of this magnitude between a screening instrument and a criterion will lead to considerable error in selection. Consequently, if educators are inclined to use high-stakes measures such as TCAP as criterion variables and CBMs as predictors, a liberal cut-score at the screening stage is recommended to ensure fewer false negatives. Our perspective is that this procedure offers only a starting point in the process of identification, and multiple sources of data, including knowledge of available services, will be required to optimally satisfy the decision-making process.
MIR: Reading and Math Correlations With TCAP Scales.
Note. All correlation coefficients are significant, p < .01. MIR = Monitoring Instructional Responsiveness; TCAP = Tennessee Comprehensive Assessment Program.
Mean Differences of High-Performing Math Students With and Without a Reading Weakness.
Note. ES = effect size; MIR = Monitoring Instructional Responsiveness; TCAP = Tennessee Comprehensive Assessment Program.
Based on converted standard scores.
Expected number of problems correct out of 100.
Hedges’s g—Pooled standard deviation corrected for sample size.
Mean Differences of High-Performing Reading Students With and Without a Math Weakness.
Note. ES = effect size; MIR = Monitoring Instructional Responsiveness; TCAP = Tennessee Comprehensive Assessment Program.
Based on converted standard scores.
Expected number of problems correct out of 100.
Effect size.
Of note, the relations shown by the correlation coefficients between the MIR and TCAP scores reveal an unexpected pattern. That is, not only did the MIR:R scores correlate more highly (than MIR:M) with all of the TCAP reading scores as expected, but they also correlated more highly with the TCAP math scores. These scores raise a question about the overlap in content between the two instruments, and specifically, what elements within the two scales might lead to this pattern. Subsequent analyses address this question.
Math Strength
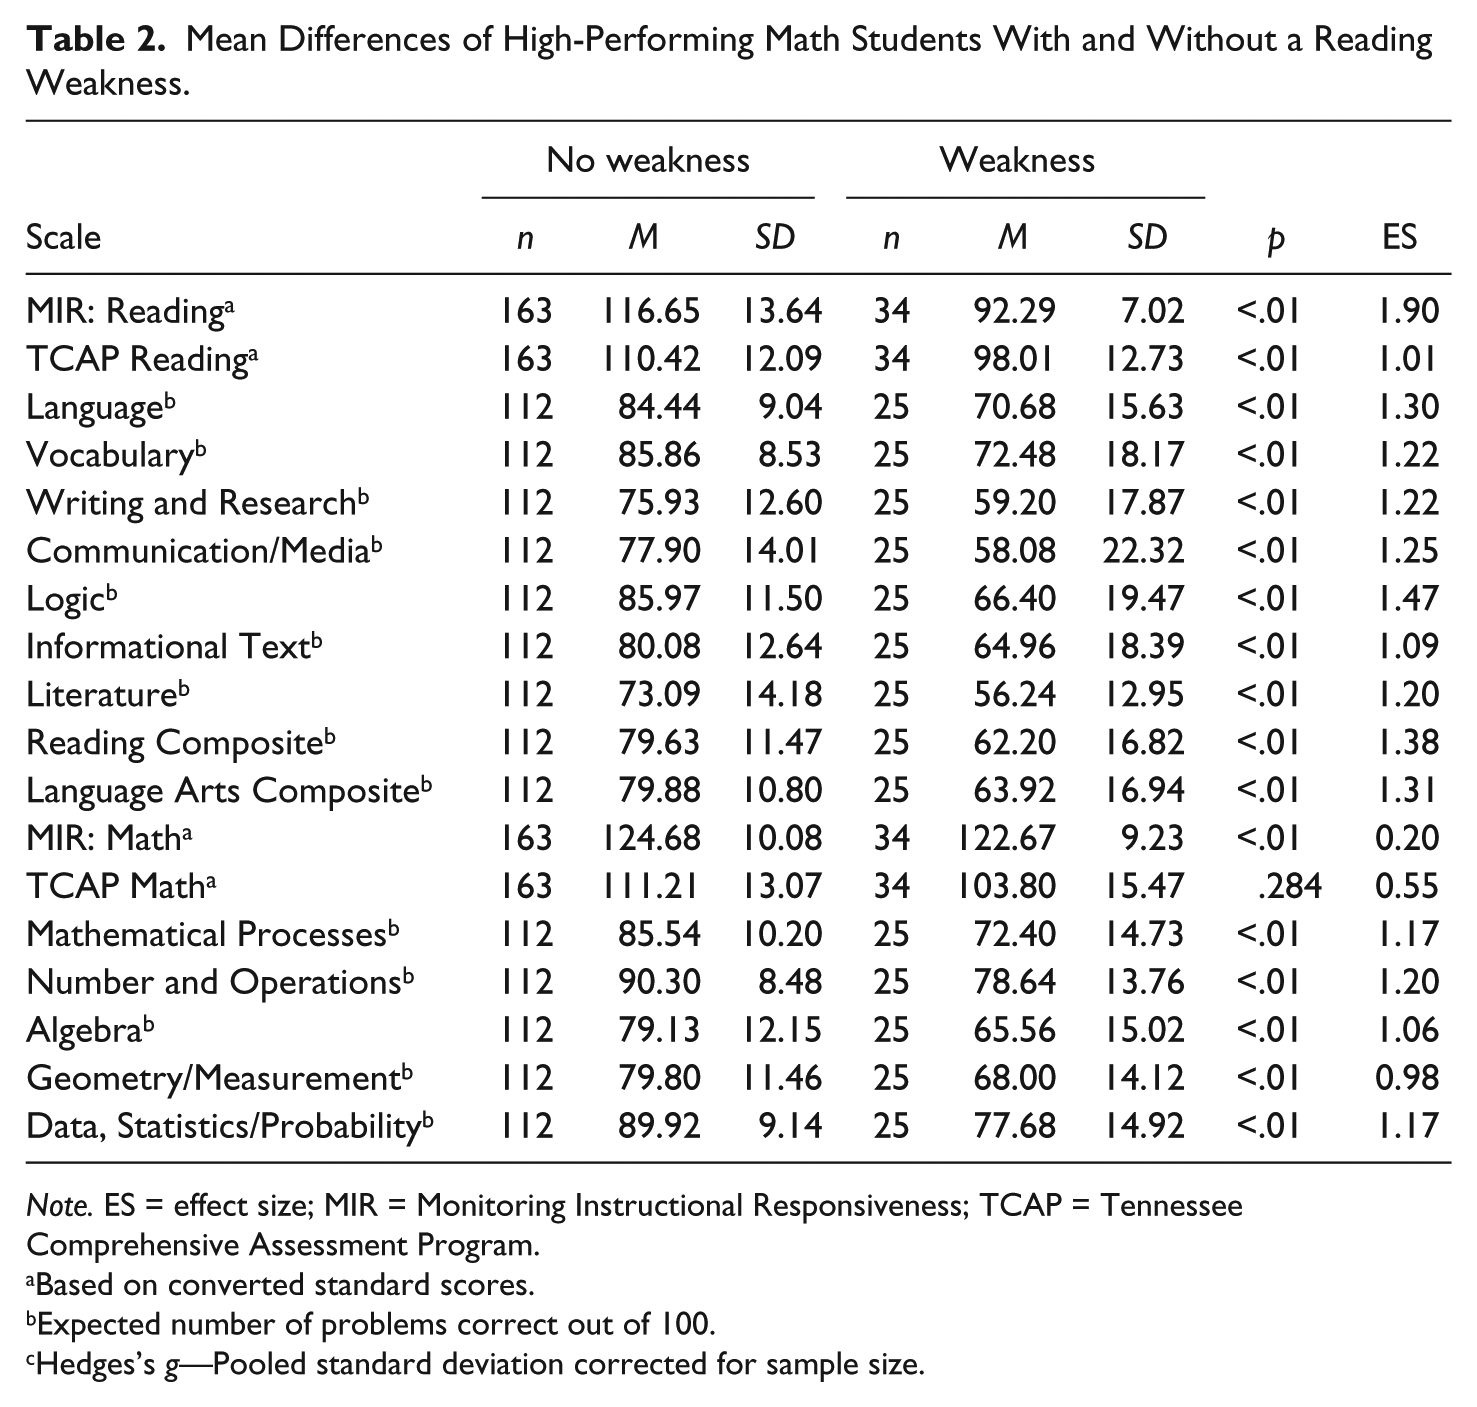
Table 2 displays the mean differences on each scale between students who were identified with strength in math and no reading weakness and those displaying a strength in math but with a reading weakness (potentially twice-exceptional), based on MIR:R and MIR:M scores. Of the 197 students identified with a significant math strength, 34 (16%) were identified with a reading weakness. The students displaying no reading weakness had an average reading score of 116.65 (SD = 13.64) and an average math score of 124.68 (SD = 10.08). The group displaying a reading weakness had an average reading score of 92.29 (SD = 7.02) and an average math score of 122.67 (SD = 9.63). As expected, reading differences between the groups were significant, t(93.65) = 15.14, p < .001, whereas the math differences were not significant, t(195) = 1.07, p = .284.
The patterns of scores on the TCAP were similar, and TCAP reading composite scores were similar to the MIR:R scores for both groups. Specifically, the group displaying no reading weakness had an average score of 110.42 (SD = 12.09), whereas the average score of those with a reading weakness was 98.01 (SD = 12.73); this difference was significant, t(195) = 5.39, p < .001. A chi-square test was conducted to determine whether the percentage of students in each of the four reading achievement categories (Below Basic, Basic, Proficient, and Advanced) differed between the two groups. The relationship was significant: χ2(3, 197) = 16.124, p < .001, with 71.8% of the students with no reading weakness scoring in the top two achievement levels, Proficient and Advanced, compared with only 41.2% with a reading weakness. Further comparisons were conducted on each of the nine reading subscales of the TCAP (see Table 2) with the students displaying a reading weakness scoring significantly lower across all nine subscales with effect size estimates ranging from 1.09 to 1.47.
Although the two groups did not differ on the MIR:M, the two groups earned significantly different full-scale math TCAP scores. Specifically, the group without a reading weakness earned a higher average math TCAP score (M = 111.23, SD = 13.07) than did those in the reading weakness group (M = 103.80, SD = 15.47). This difference is statistically significant, t(195) = 2.91, p < .01. Achievement category comparisons indicated significant differences between the two groups, χ2(3, 197) = 19.232, p < .001; 82.9% of the students showing no reading weakness scored in the top two achievement levels, Proficient and Advanced, compared with only 50% of those with reading weakness. Additional comparisons of the two groups’ performance on the five math TCAP subscales indicate that the two groups performed differently across each with effect sizes ranging from 0.98 to 1.20.
Reading Strength
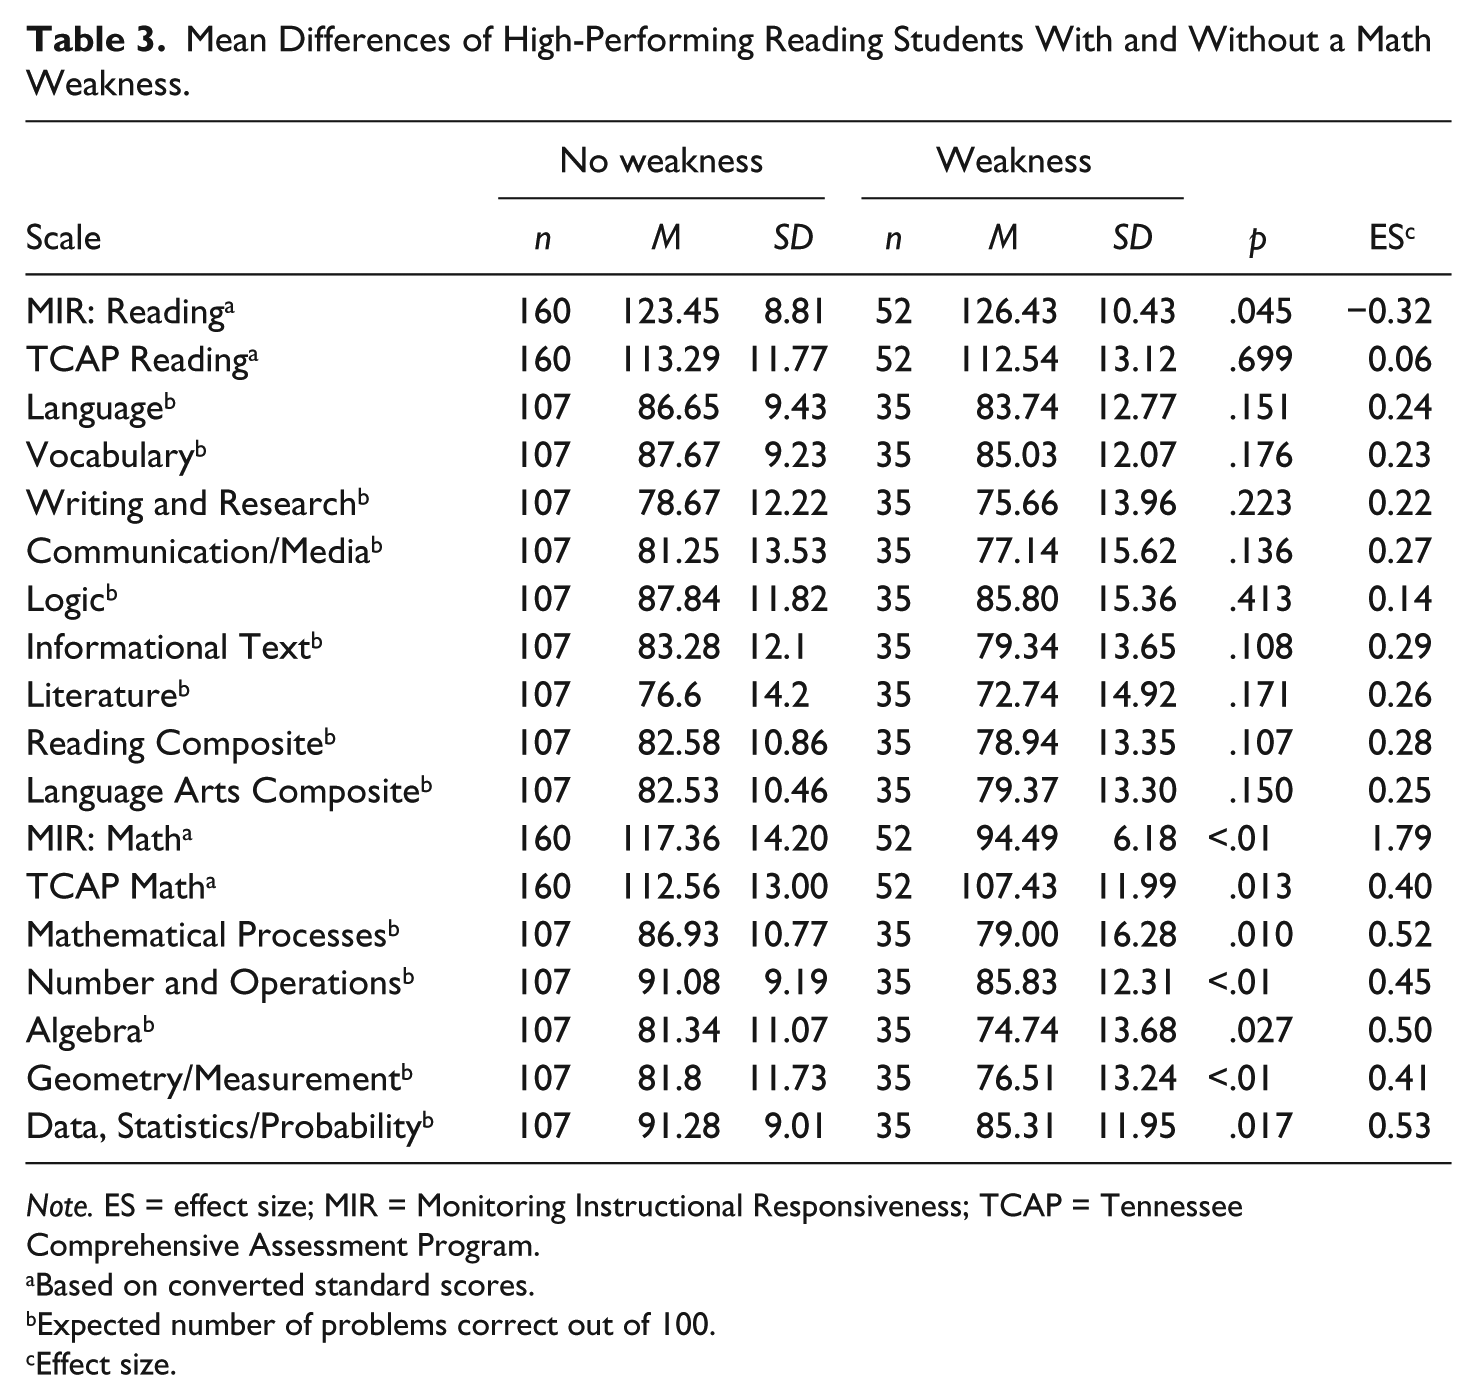
Table 3 displays the means on each scale of those students with a reading strength and no identifiable math weakness and students with a reading strength and an identified math weakness (potentially twice-exceptional). Of the 212 students identified as having reading strength, 52 (24.5%) displayed a math weakness. Students not displaying a significant reading weakness earned an average math score of 117.36 (SD = 14.20) and an average reading score of 123.45 (SD = 8.81). Students displaying a math weakness achieved an average math score of 94.49 (SD = 6.18) and an average reading score of 126.45 (SD = 10.43). Not surprisingly, the students with a math weakness had a significantly lower math score, t(193.39) = 16.20, p < .001, than the students who displayed no math weakness. On the contrary, students with a reading strength and no math weakness had a significantly higher reading score, t(210) = −2.020, p < .05, than those students displaying a math weakness.
Comparison of scores between the two groups indicated that there was no significant difference between TCAP reading scores, t(210) = −0.39, p = .699; the group displaying no math weakness had an average reading score of 113.29 (SD = 11.77) and the math weakness group had an average reading score of 112.54 (SD = 13.12). Membership in the reading achievement categories did not differ as a function of reading weakness, χ2(3, 212) = 1.419, p = .701, with both groups relatively equally represented in each of the four categories. Additional analysis indicated that there were no significant differences across each of the nine subscales of the reading portion of the TCAP. Although not statistically significant, the group identified without a math weakness had slightly higher average scores across each domain, with effect size estimates ranging from 0.14 to 0.28.
As anticipated, comparison of scores on the math TCAP yielded significant differences, t(210) = 2.518, p < .01; the students who displayed no math weakness had a higher average math score of 112.56 (SD = 13.00) compared with those within the math weakness group who earned an average math score of 107.43 (SD = 11.99). A comparison of the achievement categories indicated nonsignificant differences, χ2(3, 212) = 4.899, p = .179, when comparing the four categories. However, a significant value was obtained when the top two achievement categories were compared with the bottom two achievement categories, χ2(1, 212) = 4.831, p = .028; 86.2% of students without a math weakness were in the top two categories compared with only 73.1% of those displaying a math weakness. Further analysis of the TCAP math scales revealed significant differences between the groups, with effect size estimates ranging from 0.40 to 0.53.
Discussion
Twice-exceptional students experience unique academic strengths and weaknesses, but these characteristics are often difficult to identify (Brody & Mills, 1997; Flanagan, Ortiz, & Alfonso, 2007; Lovett & Sparks, 2013; McCoach, Kehle, Bray, & Siegle, 2001; Moon & Reis, 2004). Increasingly, practitioners may be expected to screen or identify twice-exceptional students within a RtI framework, which typically requires use of CBMs and may also be informed by end-of-year, high-stakes tests. Results from this study provide information about the relations between CBM measures of reading and math and end-of-year, standardized, high-stakes tests of achievement for students who may be twice-exceptional. Evidence is also provided for a masking effect of reading skills on math achievement scores in prospective twice-exceptional students.
In general, CBMs have been shown to predict end-of-grade, standardized testing in the general population moderately well (Keller-Margulis, Shapiro, & Hintze, 2008; Reschly, Busch, Betts, Deno, & Long, 2009). Correlation coefficients from this study provide additional support for this generalization. All of the coefficients defining the relationship between MIR:R and MIR:M and TCAP scales were statistically significant and typically moderately strong. These results are particularly relevant for twice-exceptional students, given that McCallum et al. (2012; McCallum et al., 2013) used the MIR CBMs to empirically screen for twice-exceptionality and identified prospective twice-exceptional students through an analysis of math–reading or reading–math discrepancies in students within the operationalized gifted range in either subject area.
Current results extend the work of McCallum, Bell, and colleagues by identifying possible twice-exceptional students using MIR:R and MIR:M probes, then comparing them with non-twice-exceptional peers with similar strengths in either math or reading. Using these criteria to define twice-exceptional status, potentially twice-exceptional students made up 16% of the math strength group and 24.5% of the reading strength group. Students (both prospective twice-exceptional and non-twice-exceptional) in our sample who are potentially gifted in reading according to MIR:R did not significantly differ in TCAP outcomes in reading but performed in a similarly high manner; on the contrary, twice-exceptional students who are potentially gifted in math performed at a significantly lower level in both TCAP math and reading. Most of the end-of-year math subtest scores were negatively associated with the twice-exceptional students’ deficits in reading, even though their math MIR:M scores placed them into a category representing giftedness in mathematical ability. It appears that having a weakness in reading, or potentially a learning disability in this area, significantly and detrimentally affects math performance on the standardized tests of achievement used in this study (i.e., the TCAP). Reading deficits may mask gifted students’ (and particularly twice-exceptional students’) strength in mathematics on instruments used by teachers, school psychologists, and other educators. Our results are consistent with prior research on masking, particularly the group of students in which giftedness is masked by a learning disability (Baum, 1990; Crepeau-Hobson & Bianco, 2011; Trail, 2010).
Clearly, a moderating effect of reading on math performance exists and is likely related to the higher language loadings on the TCAP items (as compared with the MIR:M), presenting greater challenges for students with reading difficulties. Thus far, little research is available addressing this phenomenon, but it is understood that aspects of reading, such as comprehension, are correlated with math problem-solving ability (Abedi & Lord, 2001; Aiken, 1972; L. S. Fuchs & Fuchs, 2002), and, in fact, reading is embedded in many math problems, particularly those that tap higher order math reasoning. Given this situation, the discrepancy between performance of prospective twice-exceptional students (with strengths in math and deficits in reading) and their non-twice-exceptional peers (with similar strengths in math) may be explained by the different operationalizations of math used in this study and in many school settings. Although the MIR:M requires no reading and is designed to be an efficient CBM measure of math calculation skills and math reasoning, TCAP items, and presumably those from other high-stakes tests, include multistep, word-based problems, often containing irrelevant details or indirect language (Parmar, Cawley, & Frazita, 1996). Solving multistep problems that require reading fluency and comprehension skills may be affected by processing speed, abstract reasoning, and working memory. The following items from the TCAP reveal the confounded nature of the items and show the extent to which reading skills are needed to complete the items. These math problems were taken from a Grade 3 TCAP Practice Test published on a state department of education’s website:
There are 273 first-grade students and 204 third-grade students at West Elementary School. How many more first-grade students than third-grade students are at this school? 61 69 71 79
Thomas saw crabs at the beach. He saw a total of 80 legs on these crabs. Each crab had 10 legs. The equation below can be used to find the number of crabs Thomas saw.
10 × ___ = 80
How many crabs did Thomas see? 7 8 700 800
Because operationalizations of math that require reading may yield different scores than those that do not, educators must decide in advance their assessment goals and choose tests accordingly. Tests that assess only math operations and contain no reading and tests that assess math reasoning that include math language but do not require reading are not better than tests that require math and reading. But the two item types are likely to produce different results.
Implications
These results are important to consider when evaluating students who may be gifted and may also have a learning disability. Those who are responsible for making decisions about screening and identifying twice-exceptional students should be aware of the characteristics and limitations of the instruments they utilize. Not all tests of math operationalize math in the same manner. This disconnect is sometimes referred to as the jingle–jangle phenomenon, and is not uncommon, for a variety of reasons (Pedhazur & Schmelkin, 1991). For example, some math tests are more inclusive than others, assessing not only calculation but also quantitative reasoning, seriation, geometry, and so on. The same is true for the area of reading and other academic areas. Consequently, best practice requires consideration of multiple operationalizations of target areas when possible. This safeguard may reduce the likelihood that test scores include construct-irrelevant variance and prevent the sort of masking we demonstrate in this study (i.e., deficits in reading that significantly confound or mediate a twice-exceptional student’s giftedness in math).
Parents and teachers should be aware of how twice-exceptionality, particularly in regard to gifted students with learning disabilities, can manifest itself in the classroom. This begins with the recognition and acceptance that it is possible for students to display traits related to both giftedness and a learning disability simultaneously. Ruban and Reis (2005) summarized characteristics of gifted students with learning disabilities that parents and teachers, who interact with their students on a daily basis, may find particularly helpful in terms of identification of twice-exceptional status. For example, in addition to advanced vocabulary, analytic abilities, creativity, problem-solving, task-commitment, or reasoning capabilities, twice-exceptional students may display learned helplessness, disruptive behavior, hypersensitivity, low self-esteem, or the inability to set realistic goals for themselves. It should be noted if an otherwise talented student is experiencing particular frustration with his or her inability to master a certain academic skill or displaying signs of depression or apathy (Brody & Mills, 1997; Trail, 2010). A strengths-based model of intervention is recommended for twice-exceptional students, maintaining a balance between attending to a child’s giftedness and maintaining a challenging curriculum, yet also remediating and compensating for deficits (Crepeau-Hobson & Bianco, 2011).
These results also have implications when considering accommodations for twice-exceptional students. The need to be aware of the possibility of test demands in math to be negatively affected by reading skills is increasingly critical as states implement achievement tests designed to measure mastery of Common Core State Standards (Common Core State Standards Initiative, 2012). That is, math test items may include increased vocabulary and verbiage. In an effort to emphasize problem-solving skills, increased rigor, and ability to show evidence for answers, math assessments may also be tapping reading skills as well as memory and attention skills. Furthermore, students who are underperforming on high-stakes testing may need not only test accommodations in the most obvious area of need but also in other areas, depending on the characteristics of the items used in the evaluation process.
Comprehensive, sophisticated techniques should be used in the evaluation and identification of students with twice-exceptional characteristics to prevent mono-operation bias, a term used originally by Campbell and Stanley (1963) to refer to underrepresentation within a research context. The same problem exists when constructs are assessed using items that do not adequately capture the constructs in question. This is a particular problem within the RtI model if schools use CBM tools that assess only one aspect of an academic construct such as reading fluency or math calculation. Although CBMs often provide an efficient assessment, they may not provide a comprehensive assessment of a particular construct, particularly when the operationalization is multifaceted, as is the case with TCAP math. This has also been true in the area of reading, which has too often been assessed using only oral fluency measures, rather than CBMs that are sensitive to comprehension as well, such as the MIR:R.
Finally, accommodations for high-stakes assessments may be necessary for students struggling in reading, even in their areas of potential giftedness, such as math. Although the utility and appropriateness of various test accommodations have been called into question, certain accommodations such as extended time and oral administration may be helpful (Bolt & Thurlow, 2004; Sireci, Scarpati, & Li, 2005; Thompson et al., 2002). More empirical research is needed, especially with twice-exceptional populations, to determine the appropriateness of such accommodations.
Limitations and Future Directions
Limitations of this study include geographic restriction to the Southeast, the sample size of potential twice-exceptional students, and the rather typical but somewhat limited psychometric properties of the CBM instruments. Because of the small sample, the experimental nature of MIR for operationalization of twice-exceptional status, and medium correlations between MIR:M and TCAP, we recommend using a liberal cut-score for screening giftedness/achievement in either reading in math and, ultimately, consideration of additional sources of data for identification, a practice we recommend to others who may use similar procedures for screening prospective twice-exceptional status. This practice ensures selection of more false positives than false negatives at the screening stage, an outcome most practitioners can accept.
More research is needed to determine the extent of masking in twice-exceptional populations. Also, this research may be extended to non-twice-exceptional students, whose deficits in reading not only adversely affect their math scores but may also negatively affect other subjects such as science and social studies. Future efforts should focus on applying quasi-experimental design approaches to isolate previously identified twice-exceptional students and compare their performance in RtI math and reading probes, as well as math and reading scores on other standardized tests. For example, various grade levels may be affected differently by high-stakes testing situations.
Conclusion
Twice-exceptionality presents itself in a variety of ways and may include disabilities that coexist with giftedness ranging from dyslexia to physical disabilities. Gifted students who are also designated as having a SLD represent the largest group of twice-exceptional students, and these students were the focus of this study. If RtI data are used for screening twice-exceptional status, we recommend using liberal criteria for screening because twice-exceptional students may be easily overlooked and consequently underidentified due to a masking effect (Baum, 1990; Moon & Reis, 2004). Results of this study confirm the masking effect for elementary-age students who have potential giftedness in math, but struggle and may have a learning disability in reading. Even at the highest level of math achievement, as measured by the MIR:M CBM, the overall math and math subtest scores on a high-stakes, standardized test of achievement were significantly different, with only 50% of the potentially twice-exceptional students exhibiting a strength in math at the proficient or advanced levels. Best practice requires that twice-exceptional students be evaluated using a comprehensive system of evaluation and identification.
Importantly, those who rely on high-stakes tests should be aware that scores on a math test will be a function of item type. Math operations are frequently assessed using math computation problems with no reading required, although some tests have written instructions. Furthermore, because language is inherent in math reasoning and problem solving, these skills are more difficult to assess without using words, which is why prominent individual norm-referenced achievement tests rely on oral administration of math reasoning subtests. When examinees must read math reasoning problems, as is the case with the TCAP and many other group norm-referenced achievement tests, level of reading skill will influence performance on math reasoning, even though the examinee may understand the math concepts being assessed. Predictions in either direction based on two different operationalizations of math (one test requiring reading vs. the other not requiring reading) will be reduced (as is the case in this study) when compared with predictions obtained from two instruments with homogeneous item types. Predictions based on mixed item types require cautious interpretation, especially for twice-exceptional examinees.
Finally, in this study, we describe one strategy that may be used to screen for prospective twice-exceptional status (i.e., students who manifest giftedness in either reading or math and who may also have a learning disability in one of these two areas). We recognize that this strategy is capable of screening only a limited percentage of twice-exceptional students, and that some twice-exceptional students will be missed when this procedure is implemented. Students may have a SLD in an area not assessed by MIR (e.g., written expression). In addition, we used only composite MIR scores in reading and math. It is possible to obtain reading fluency and comprehension scores from MIR:R; similarly, it is possible to obtain math calculation and math reasoning scores from MIR:M. All four may be considered independently for determination of a SLD. We encourage educators to consider this strategy as a beginning point because of its efficiency (i.e., the data are already available in many school systems), and then consider additional sources of both within-child and external variables, including available services before rendering identification decisions.
Footnotes
Declaration of Conflicting Interests
The authors declared no potential conflicts of interest with respect to the research, authorship, and/or publication of this article.
Funding
The authors received no financial support for the research and/or authorship of this article.