
Abstract
Self-assessments utilizing designated, objective standards are critical in program evaluation. Although 2013–2014 Texas policy mandated districts self-assess their gifted programs using the community and student engagement performance rating system, little is known about how districts determined their self-assessment ratings. Following gifted program evaluation guidelines from the Texas State Plan for Gifted/Talented Students and the National Association for Gifted Children Pre-K–Grade 12 Gifted Programming Standards, researchers used logistic ordered regression to examine Texas districts’ 2014–2015 locale, proportional representation, and budgetary allotments in relation to gifted program self-assessed performance ratings. Results indicate proportional representation of Black and Hispanic students in gifted programs did not influence school district self-assessed ratings. On the contrary, locale, proportion of Black and Hispanic students to the overall district population, and budget allocation did relate to self-assessed ratings of gifted programs. Future research directions and implications for the use of self-assessments within gifted program evaluation are discussed.
Evaluation is critical to the design, implementation, maintenance, and justification of education programs; it provides a means for accountability. In gifted education, where program evaluation is not federally mandated and the need for the field is continually challenged, scholars argue that programs for gifted and talented students should not be implemented without evaluation (Rimm et al., 2018). Furthermore, scholars postulate that engaging in self-evaluation using designated, objective standards to examine what is working and what can be improved upon is a key component in the process of program implementation (Borland, 2003; Callahan, 2004, 2009, 2017; Friedman-Nimz, 2012; Speirs Neumeister & Burney, 2012; Worrell & Erwin, 2011). In the absence of federal standards, the National Association for Gifted Children (NAGC, 2010, 2019) 1 Pre-K–Grade 12 Gifted Education Programming Standards (Gifted Education Programming Standards) represent an evidence-based consensus of the field and provide an opportunity for consistency in state and local program self-evaluation (Friedman-Nimz, 2012). Similarly, the Texas Education Agency (TEA, 2009, 2019b) 2 developed the Texas State Plan for the Education of Gifted/Talented Students (Texas State Plan) as a standard metric to guide school districts in the development and assessment of local Texas gifted education programs.
From 2013–2018, Texas state policies mandated independent school districts to self-evaluate their gifted programs and, in alignment with the suggested resource of the Texas State Plan (TEA, 2009, 2019b), consider the demographics of their gifted programs and create district policies for funding their gifted program. State policy recommends districts use the guidance outlined in the Texas State Plan, but the final decisions for determining evaluation criteria and rating performance were left to designated school district committees. Thus, district committees could create their own criteria for evaluation, use the state plan for gifted education as a guideline, or use a combination of their own criteria and the state plan. Unique district characteristics, such as demographic disparities, funding issues, and district locale (e.g., rural districts with fewer allocated resources), could contribute to how districts rated their gifted programs.
Stakeholders, including educators, scholars, and advocates, must understand policy, including how educational policy reflects social policy, to build support and establish programs for gifted students (Gallagher, 2015; Lord & Swanson, 2016). Current research on gifted education policy is scarce (Plucker et al., 2017), and new research on policy and its effects must be conducted to provide guidance for advocacy and policy initiatives at local, state, and national levels (Gallagher, 2008). Due to the lack of current research on implementing state-mandated self-assessed performance ratings in gifted programming and insufficient evidence of effective program evaluation (Robinson et al., 2007, 2014), stakeholders searching for evidence-based recommendations will find fragmented and nonexistent information to guide their decisions. Furthermore, no research has been conducted on how demographic representation, funding, and location of a district relate to self-assessed performance ratings of gifted programs.
In alignment with Texas’ recommendations in the Texas State Plan (TEA, 2009, 2019b), we sought to explore the relationships among locale (i.e., urban, rural, suburban, town), funding allocations (i.e., percent of budget for gifted programs), total district proportional representation of traditionally underserved students (i.e., Black and Hispanic students), and gifted program proportional representation of Black and Hispanic students, to self-assessed performance ratings (i.e., 1–4) assigned by Texas school districts in the 2014–2015 school year.
Purpose and Objectives
Plucker et al. (2017) advocated for the need for new research related to gifted education policy to provide insight into the effectiveness of policies and gifted programs. To address gaps in the literature regarding how specific gifted education policies are enacted within states, we sought to examine gifted education policies within the state of Texas in relation to funding and demographic representation. Understanding the relationship between funding, representation, and locale could broaden perspectives on factors that influence performance ratings of gifted programs in the state of Texas, as well as in other states. The purpose of the current study was to examine the policies related to the Texas’ performance rating accountability system for its gifted education programs and explore how these performance ratings relate to differences in locales, budgetary allocations, and demographic proportionality that are within the specific guidelines set out by the Texas State Plan (TEA, 2009). The following research questions guided our inquiry:
Literature Review
Gifted Education Program Evaluation
All educational programs must be held accountable to their communities for implementing effective services and using resources efficiently through objective evaluation (Callahan, 2017; Rimm et al., 2018). In the field of gifted education, where there is a long history of disagreement in what constitutes best practices and there are no federal standards to use in evaluation and accountability systems, the NAGC created a series of objective, research-based standards in collaboration with other national organizations to provide a common resource for policy makers and local school districts to use for program development and implementation, advocacy, and consistency in the field (Friedman-Nimz, 2012; Johnsen, 2014). NAGC (2010, 2019) recommended gifted program evaluators use the Gifted Education Programming Standards, which include standards in the areas of learning and development, assessment, curriculum planning and instruction, learning environments, programming, and professional development, to “evaluate all aspects of their programs and set benchmarks for improvement” (Johnsen, 2012, p. 4).
In regard to fiscal transparency and accountability for gifted education, Baker and McIntire (2003) suggested states should consider policies to require annual evaluations that consider state school finance policies in terms of “equity and adequacy of resources for gifted education” (p. 8). Guidelines for financial accountability are evident in the NAGC (2010, 2019) Gifted Education Programming Standards and the Texas State Plan (TEA, 2009, 2019b), which suggest districts self-evaluate how they track allocation of funds for gifted programs. In the 2010 NAGC Gifted Education Programming Standards, Standard 5.4, specific to resources, states that gifted and talented students should “participate in gifted education programming that is adequately funded to meet student needs and program goals” and that administrators need to “track expenditures at the school level to verify appropriate and sufficient funding for gifted programming and services” (NAGC, 2010, p. 7). Related to demographic representation of students, Standard 2.3 states, “students with identified needs represent diverse backgrounds and reflect the total student population of the district,” and Standard 2.3.2 states that educators need to “understand and implement district and state policies designed to foster equity in gifted programming and services” (NAGC, 2010, p. 2). The implementation of such standards is largely dependent upon how states and individual districts choose to integrate these standards in local policies, if they choose to at all (NAGC & Council for State Directors of Programs for the Gifted, 2015).
Texas Gifted Education Policies and Program Evaluation
In 2012, following policy changes brought by the end of the No Child Left Behind (2011) era, the Texas Legislature (29 U.S.C. § 123) mandated that all public school districts evaluate their gifted education programs and report their evaluations to the state (House Bill 5, 2013/2019; TEA, 2019a). Implemented in the 2013–2014 academic year, House Bill 5 required school districts to evaluate district and campus performance in community and student engagement across eight categories: fine arts, wellness/physical education, community/parent involvement, workforce readiness, English acquisition programs, digital learning, drop-out prevention, and, finally, gifted education. For gifted education, the policy recommended districts use the Texas State Plan or the Texas Performance Standards to determine the criteria for defining the state provided 4-point scale (exemplary, recognized, acceptable, and unacceptable; House Bill 5, 2013/2019).
Using guidance from the Texas State Plan, districts were to show compliance in ensuring “students from all populations in the district have access to assessment, and if identified, services for the gifted/talented program” (TEA, 2019b, p. 16). Standard 1.6E of the Texas State Plan outlines that a district may reach an exemplary performance rating if “the population of the total district is reflected in the population of the gifted/talented services program or has been for two (2) of the past three (3) years” (TEA, 2009, p. 6). This guideline underscores the salience of equitable student demographics and leads districts to consider how to improve educational equity within their gifted programs. Current literature within gifted education discusses demographic proportionality in relation to gifted programs (e.g., Peters et al., 2019); however, there is no literature to support whether greater proportionality is related to how districts perceive the performance ratings of their gifted programs or whether greater demographic proportionality equates to more positive views of their gifted programs. In addition, the individual relationships of how budgetary allotments for gifted education and location of a district may influence the district perception of a gifted program are unclear.
Local Control in Texas
In Texas, where there were 1,024 independent school districts during the time frame of this study (TEA, 2019c), it is difficult to create an accountability system that can be equitably implemented across all districts. Texas has employed various levels of local control since the inception of its education system and the establishment of independent school districts in the late 1800s (TEA, n.d.). As the structure of the TEA was updated in 1995 with “substantial power” and more freedom granted to the local level of independent school districts (Williams, 1996, pp. 903–904), Texas has continued to use local control and school districts have a significant role in the state accountability system, which extends to gifted education.
Local school districts are able to decide how they will meet the mandates for an identification process and established program for gifted students by creating their own policies for student identification, student assessment, service design, curriculum and instruction, and professional development. An example of local control in practice is House Bill 5 (2013/2019), which requires districts to assess and rate their performance using locally determined criteria. Texas did not require districts to report the criteria used to determine their self-assessed performance ratings for any of the eight designated categories (including gifted education), and there was no regulation process to ensure districts used recommended or other available resources (e.g., Texas State Plan, Gifted Education Programming Standards). Thus, Texas districts designed and implemented their self-assessments with little guidance and without oversight from the state.
Locale
The diversity of resources and opportunities for gifted programming across locales has long been a topic of interest in gifted education (Rimm et al., 2018). In Texas, where locale varies drastically and local school districts have great authority in interpreting and implementing policy, research has historically found inequitable access between locales in gifted programming opportunities (e.g., Kettler et al., 2015). The differences in available resources and access to opportunities are noticeable across locales, but the discrepancies are particularly evident between rural and suburban districts (Hodges et al., 2018). Prior research has found access to resources, such as funding and staffing, to be the main causes of inconsistencies in gifted programming between locales, and gifted programming in rural districts “appear to be greatly disadvantaged” (Rimm et al., 2018, p. 282).
Rurality is complex and difficult to define (Corbett, 2016; Rasheed, 2020), and researchers choose to utilize definitions based on a variety of characteristics (e.g., governmental agency designations, school size). Kettler et al. (2016) conceptualized educational settings as a “subjective concept,” that is, “qualitatively different” (p. 247) than experiences from other locales (i.e., suburban, urban), and others advised researchers to avoid generalizing rurality and rural education (Azano et al., 2017; Coladarci, 2007). We recognize that rurality could be conceptualized differently to understand individual differences and complexity associated between rural designations (e.g., school size); however, the National Center for Education Statistics (NCES) definition was sufficient for our analysis. NCES designates four categories for locales (i.e., rural, town, suburban, urban) and defines rurality as determined by population size and distance from urban clusters. This commonly used federal definition will allow for comparison with research from other scholars (NCES, 2017).
Rurality in Gifted Education
Floyd et al. (2011) contended that gifted students from rural communities have “unique needs and circumstances that often are ignored by educational policy and educator preparation programs” (p. 28). Scholars have emphasized these complexities of rural gifted education and the disparities between rural and nonrural gifted services in reviews of rural gifted research (Azano et al., 2014; Colangelo et al., 1999; Howley et al., 2009; Lawrence, 2009; Rasheed, 2020). Rural schools often lack access to resources (e.g., funding, educational resources), are isolated geographically (e.g., distance from universities, libraries, cultural centers), and experience difficulty in hiring quality personnel (e.g., educators, administrators). Thus, rural gifted students may have fewer opportunities to participate in gifted or advanced academic programs (Azano et al., 2014; Burney & Cross, 2006; Floyd et al., 2011; Gentry et al., 2001; Kettler et al., 2016; Schafft, 2016). Disproportionate funding and staffing in rural schools have been found to be indicative of insufficient resource allocation to support gifted programs and further reveal the disparate economic needs of students from diverse geographic areas and populations (Puryear & Kettler, 2017). Comparable with other locales (i.e., town, suburban, urban) within the state of Texas, rural districts have been found to have a slower rate of declining budgetary allocations due to less overall funding (Hodges et al., 2018). Such disparity in funding could create fewer choices and extent of available options, exacerbate demographic underrepresentation of gifted students (e.g., Kettler et al., 2015; Rasheed, 2020), and contribute to how a district assesses their gifted programs.
Funding
Prior to 2019, Texas provided weighted funding for gifted programs to public school districts. For a few decades, the funding model has been a weighted system as “state supplemental aid . . . allocated on a per student basis where the amount of aid is based on the funding weight associated with each student” (Baker & McIntire, 2003, p. 2). In Texas, students identified as gifted were counted as 1.12 students (instead of 1), which means a district would receive 12% additional aid times their base allotment per identified pupil, capped at 5% of the district’s total student population (TEA, 2013). In addition to the allocated funding, districts were required to adopt a policy in regard to how they used funds directly related to supporting the needs of gifted and talented students within specific school district programs (House Bill 3, 1995/2019; TEA, 2009, 2019b). More recently, Hodges et al. (2018) analyzed Texas public school financial data to assess the influence of the Great Recession of 2008 and subsequent cuts in education expenditure on gifted education spending. They found that school districts were affected by a reduction in spending on gifted education. Even prior to the recession, budgetary allocations toward gifted education programming trended downward in Texas school districts (Hodges, 2018). Because Texas school districts are required to self-assess their gifted programs, little is known about how budgetary allotments (i.e., funding), or lack thereof, are related to self-evaluated performance ratings.
Proportionality and Representation in Gifted Education
The historical underrepresentation of culturally, linguistically, economically, and ethnically diverse students within gifted and talented programs requires systemic evaluation of policies to help mitigate continued disparities in access (Ford, 2014; Ford & Whiting, 2007; Siegle et al., 2016). Although there are countless reasons underrepresentation and achievement gaps persist (National Education Association [NEA], 2019), scholars postulate that factors related to achievement gaps, structural biases within educational policies and practices, and a national history associated with “racism, ethnocentrism, classism, and lingualism” have contributed to barriers to equitable access (Mun et al., 2020, p. 10).
Achievement gaps have persisted into disparities in the advanced level performance of student groups (i.e., Black, Hispanic, Native American, Asian, White), or excellence gaps (Plucker et al., 2010; Plucker & Peters, 2016), which exist despite national initiatives to reduce K–12 achievement gaps for underperforming student populations (i.e., No Child Left Behind). Excellence gaps are exacerbated by identification and admission systems for gifted and talented programs, such as scores from achievement and standardized tests (Worrell & Dixson, 2018) and two-phase nomination processes (McBee et al., 2016). The NAGC (2010, 2019) Gifted Education Programming Standards address the importance of equitable representation of student groups, but the 2009 Texas State Plan has notable brevity in addressing diversity and student outcomes within gifted programs (Johnsen, 2011, 2012). Texas policy dictates that all independent school districts must identify students to participate in gifted education programs and provide open access to identification for all populations within their school districts (TEA, 2009, 2019b); however, an identification gap still remains within the state of Texas between students who are Asian or White (who are consistently well identified) and students who are Black, Hispanic, or Native American (who are consistently underidentified) (Lamb et al., 2019).
Recent research has analyzed proportionality of student demographics in gifted programs in an aim to increase equitable opportunities for underrepresented populations in gifted education. Following work by Yoon and Gentry (2009), Peters et al. (2019) examined demographic proportionality in relation to state-mandated gifted identification policies and found that state-mandated gifted identification does not always equate to demographic proportionality of gifted programs, concluding that other factors relating to policy evaluation within states need further examination. It is worth noting that greater rates of proportional identification do not necessarily translate to educational equity, nor do we know whether demographic proportionality is related to more favorable ratings of gifted programs within school districts.
Method
Data
Following guidelines for using public data (Hodges, 2020), data were acquired for this study from four sources and then aggregated into a single dataset. Student enrollments were obtained from the Office for Civil Rights (2016) data depository, school district locales from the NCES (2017), Texas school district financial information from the TEA (2019c) website, and Texas school district self-assessed performance ratings through a freedom of information request made to the TEA using a Public Information Request. The requested data include self-assessment performance ratings for all eight categories: fine arts, wellness/physical education, community/parent involvement, workforce readiness, English acquisition programs, digital learning, drop-out prevention, and gifted education. The dataset includes information on all 1,024 school districts in the state of Texas for the 2014–2015 academic calendar year.
Variable Description
District Performance Rating
This is the dependent variable of the study. The TEA (2019a; House Bill 5, 2013/2019) required districts to self-evaluate and assign to the district and each campus a performance rating of exemplary, recognized, acceptable, or unacceptable for performance in community and student engagement. We converted this variable to a ranked numeric scale, where exemplary was coded as 4, recognized as 3, acceptable as 2, and unacceptable as 1.
Locale
We used the NCES (2017) Local Education Agency Locale Codes as our basis to determine school district locale. We used the aggregated locales for this analysis (Rural = 4, Town = 3, Suburban = 2, Urban = 1). We assigned each school district their associated NCES locale code. Rural is the baseline variable for this analysis.
Funding
This variable is the school district reported percentage of the school’s budget allocated to gifted programming. This is a continuous variable that ranges from 0 to 1.
Proportionality
Proportion of Students who are Black
This variable describes the total proportion of students who are Black in the school district’s total school population. To obtain this variable, we divided the number of students who are Black by the total population of the district. This is a continuous variable that ranges from 0 to 1.
Proportion of Students who are Hispanic
This variable describes the total proportion of students who are Hispanic in the school district’s total school population. To obtain this variable, we divided the number of students who are Hispanic by the total population of the district. This is a continuous variable that ranges from 0 to 1.
Representation Indices
Representation of Students who are Black
We calculated this variable by obtaining the proportion of students who are Black within a school district’s gifted program and dividing that proportion by the proportion of students who are Black within the same school district’s general population (Peters et al., 2019). This is a continuous variable, and values for this variable cannot be negative.
Representation of Students who are Hispanic
We calculated this variable by obtaining the proportion of students who are Hispanic within a school district’s gifted program and dividing that proportion by the proportion of students who are Hispanic within the same school district’s general population (Peters et al., 2019). This is a continuous variable, and values for this variable cannot be negative.
Analysis
The data used in this analysis comprise the population of all 1,024 public school districts in Texas during the 2014–2015 academic school year. We used a descriptive framework rather than an inferential framework for the analysis. We are not making statistical inferences, nor are we confirming a set of hypotheses (McBee & Field, 2017). In summation, in an inferential framework, an inference is made based on a preconceived hypothesis about a population using a statistic that is extracted from a sample of the same population. Instead, we include all public school districts in our analyses, using the entire population of Texas public school districts. We are not estimating the reported self-ratings based on a hypothesis; we are describing them based on an exploratory analysis of a population. As such, our analysis is descriptive (in that we are describing the parameters) rather than inferential (in that we are not inferring what the parameters are).
Given this framework, we conducted a means comparison of school districts’ reported self-ratings of nongifted programs to their gifted programs. Following this, we conducted a regression analysis of school districts’ reported self-ratings of their gifted programs. Reported critical statistics should be interpreted as indicating coefficient stability and not as providing evidence of statistical significance. Critical values greater than 2 indicate a stable beta coefficient and indicate lower levels of variance across a population (Faraway, 2016).
Our dependent variable was district self-assessed performance ratings of their gifted education program. Our independent variables were as follows: (a) the locale of the school district, (b) the proportion of students who are Black in the district’s general student population, (c) the proportion of students who are Hispanic in the district’s general student population, (d) the representation of students who are Black in the district’s gifted program, (e) the representation of students who are Hispanic in the district’s gifted program, and (f) the percentage of a district’s total budget allocated to their gifted education program. Note that representation is defined as the proportion of students in a group identified as gifted divided by the proportion of those students in the general population. Our model is the following:
Because our dependent variable is an ordered categorical variable, an ordered logistic regression was used in the analysis (Fullerton, 2009).
Model Rationale
Scholars in gifted education have extensively studied three variables when examining school districts: locale, representation, and spending. In research on Texas school districts and gifted programming, researchers found differences among school districts based on those districts’ locales (Hodges et al., 2019; Kettler et al., 2015). For example, rural districts allocated fewer resources to gifted education programs than nonrural districts.
The representation of students who are Black or Hispanic in gifted education programs is of critical importance to scholars in gifted education (Goings & Ford, 2018; Hodges et al., 2018; Lamb et al., 2019; Peters et al., 2019). Furthermore, the guidelines recommended by the state for district performance evaluation criteria include representation, which is a criterion wherein scholars and policy makers overlap (NAGC, 2010; TEA, 2009, 2019b). We have defined representation using a Representation Index as described by Yoon and Gentry (2009).
Finally, we included district funding on gifted education as a variable within the model. Scholars have extensively studied Texas’ funding model for gifted education (e.g., Baker, 2001a, 2001b; Baker & McIntire, 2003; Hodges et al., 2018; Kettler et al., 2015). Evidence from prior research suggests that locale and demographics are intertwined with school funding for gifted education programs (Hodges, 2018; Kettler et al., 2015). To allow for easier comparisons with previous literature, we used the percentage of district budget allocated to gifted education as our funding variable.
Visual Representations
A final step in our analysis was to visually analyze the relationships between district self-ratings and each of our variables of interest. To do so, we used a plot referred to as a raincloud plot (Allen et al., 2019) and a stacked bar plot. We used a raincloud plot to analyze continuous variables. The “cloud” portion of the plot is the density plot and shows the distribution of the data. The stacked bar plot shows the median of the distribution along with the first and third quartiles. Finally, the raw data are shown through a jittered plot in which observed values are plotted on an x-axis and then an amount of noise is added for each value with respect to the y-axis (i.e., jittering). This noise allows for multiple observations of the same (or near same) value to be viewed. Raincloud plots are a concise way to display the underlying distribution, centrality, and raw data for a variable. Using this method allows us to showcase the differences between the distribution of our variables of interest by district self-rating. Finally, we used a stacked bar plot to examine the categorical variable (locale).
Additional Analysis
During the review process of this article, a reviewer suggested we explore an additional analysis that included the interaction between funding and locale. The model run in the additional analysis was as follows:
In this model, rural locale is still used as baseline.
Results
Of the 1,024 public school districts in Texas, 10 had missing data and were excluded from the analysis. The average rating across all assessment categories was 3.22 out of 4. Of all assessed categories, districts rated their gifted programs, on average, the lowest (M = 2.95, SD = 0.78). In contrast, wellness and physical education programs were rated the highest (M = 3.39, SD = 0.67). The effect size mean difference (Cohen’s d) between reported gifted program ratings and wellness and physical education programs was calculated to be 0.61.
In describing our results, we use the term Exp (b) to denote the coefficients derived from our ordered logistic regression model. This term denotes the fact that we are reporting the exponentiated beta coefficient. We use Exp (b) to make interpretation of the coefficients easier as exponentiated beta coefficients can be described in terms of percentage likelihood (e.g., a coefficient of 1.5 can be interpreted as
Research Question 1: Locale
Rural school districts were used as the baseline in the regression. The results of the regression showed that rural school districts, on average, rated their gifted programs the lowest out of all locales. Suburban, Exp (b) = 2.93, SE = 0.22, t = 4.97; Town, Exp (b) = 1.41, SE = 0.16, t = 2.09; and Urban, Exp (b) = 3.63, SE = 0.26, t = 5.02, locales all were more likely to rate their programs higher than rural locales. In other words, suburban and urban locales are both roughly 3 times as likely to rate their gifted programs one rating higher than rural locales. Figure 1 shows a stacked bar plot of the distribution of district self-ratings by locale. Visually, there is a distinct difference in the distribution of self-ratings between rural/town locales and urban/suburban locales.
Stacked bar plot showing distribution of ratings by locale.
Research Question 2: Funding
Districts that allocate greater portions of their budget on their gifted programs are more likely to rate their gifted programs highly, Exp (b) = 1.12, SE = 0.05, t = 2.11. In other words, for every percent of the total budget that a district allocates, that district is 12% more likely to rate their district one category higher. Figure 2 shows a raincloud plot of the distribution and centrality of budgetary allocations by district self-rating. The visualization provided in this plot shows evidence of the relatively weak relationship between budgetary allocations and district self-ratings.
Raincloud plot depicting the distribution and centrality of the percentage of school Texas districts’ budget allocated to gifted and talented programming by gifted program self-rating.
Research Question 3: Demographics
Districts that were composed of large populations of students who are Black or Hispanic were far more likely to rate their gifted programs lower than districts of different demographic compositions. The proportion of students in a district who are Black, Exp (b) = 0.08, SE = 0.65, t = 3.95, had a greater influence on ratings than the proportion of students who are Hispanic, Exp (b) = 0.18, SE = 0.27, t = 6.32, while there was a greater amount of variance across school districts with a higher proportion of students who are Hispanic. Note that these beta coefficients should be interpreted on a 0 to 1 continuous scale, where 1 corresponds to a district that is 100% composed of students from the associated group. In other words, a school district with a population of 50% students who are Black is 20% less likely to rate their gifted program as high as a district with a population of 40% students who are Black (e.g., 0.08 × 10 = 0.8; 1 – 0.8 = 0.2). Figures 3 and 4 show raincloud plots of the distribution and centrality of demographics for students who are Black or Hispanic by district self-rating. The distribution of students who are Hispanic or Black shows a strong visual relationship with district self-ratings. This provides further evidence that the relationship between district demographics and district self-ratings is statistically and practically meaningful.
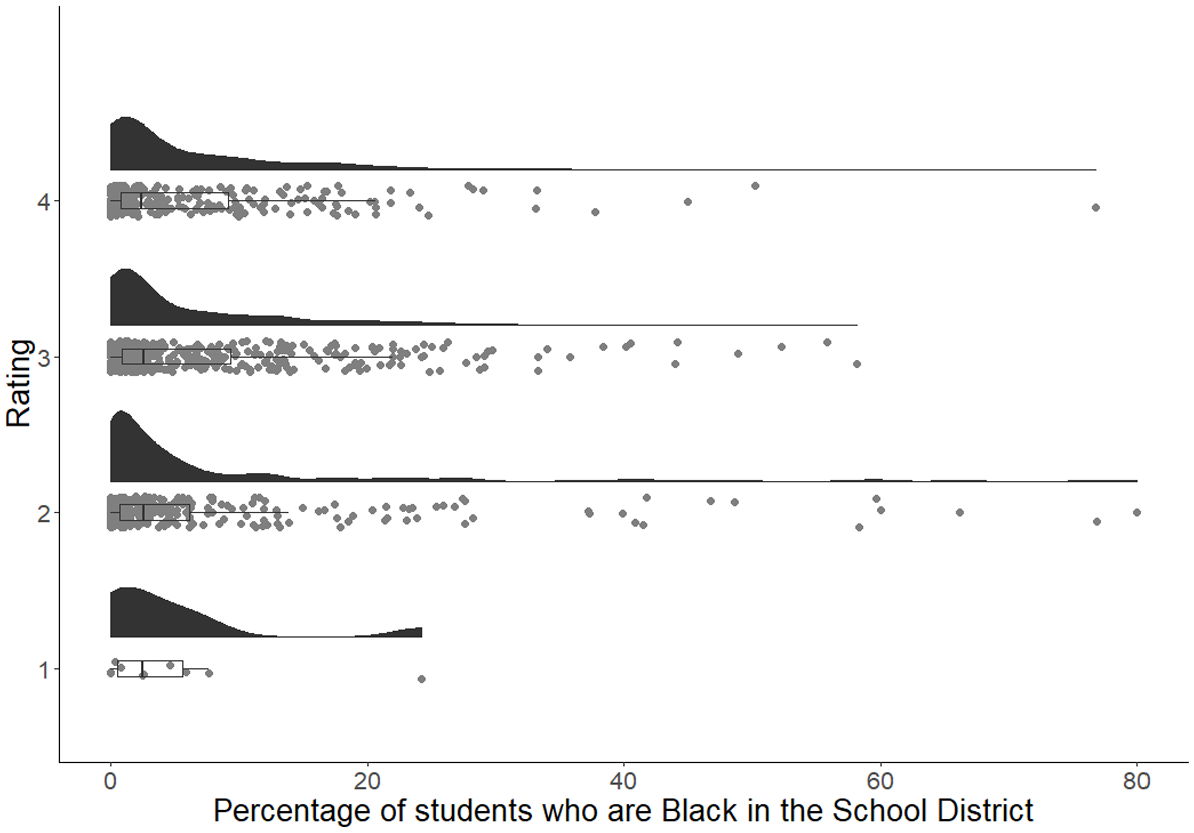
Raincloud plot depicting the distribution and centrality of the percentage of students who are Black in a school district’s general population by gifted program self-rating.
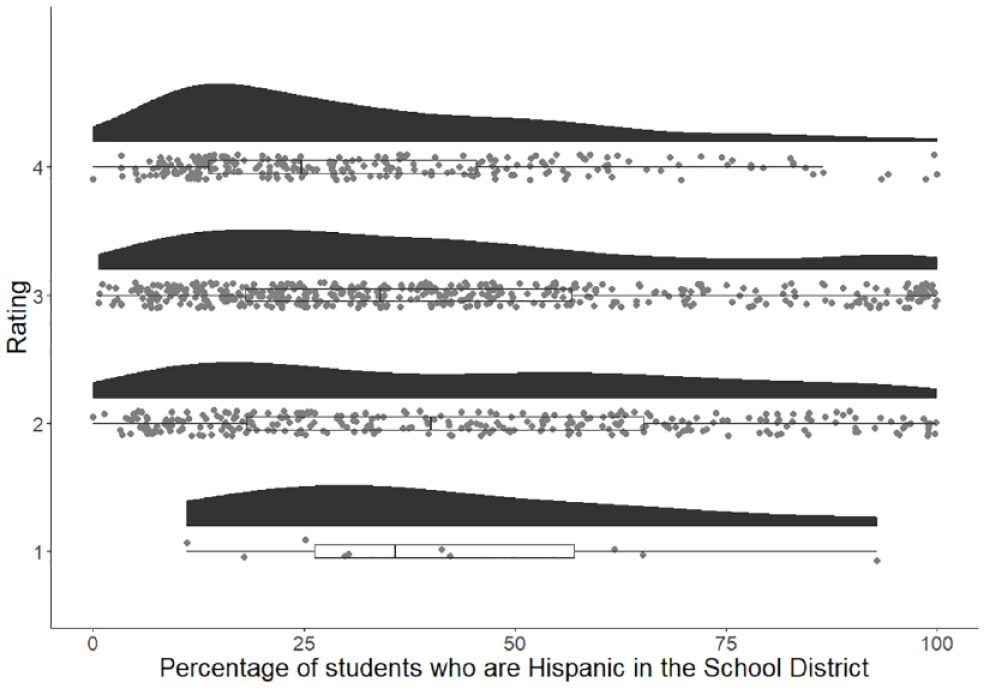
Raincloud plot depicting the distribution and centrality of the percentage of students who are Hispanic in a school district’s general population by gifted program self-rating.
Research Question 4: Representation
The representation of students who are Black or Hispanic in gifted education programs was not meaningfully related to a district’s self-rating. The regression coefficient for students who are Hispanic was positive, Exp (b) = 1.01, SE = 0.11, t = 0.11, whereas for students who are Black, the representation was negative, Exp (b) = 0.98, SE = 0.03, t = 1.02. In both cases, neither coefficient was stable. This suggests a high amount of variance across school districts in the state. In other words, there is no clear relationship between how a district rates its gifted program and how well it proportionally identifies students who are Black or Hispanic. Figures 5 and 6 show raincloud plots of the distribution and centrality of representation indices by district self-rating. The plots visually demonstrate that the districts who identified no students who were Black or no students who were Hispanic also have a skewed relationship between representation and district self-ratings.
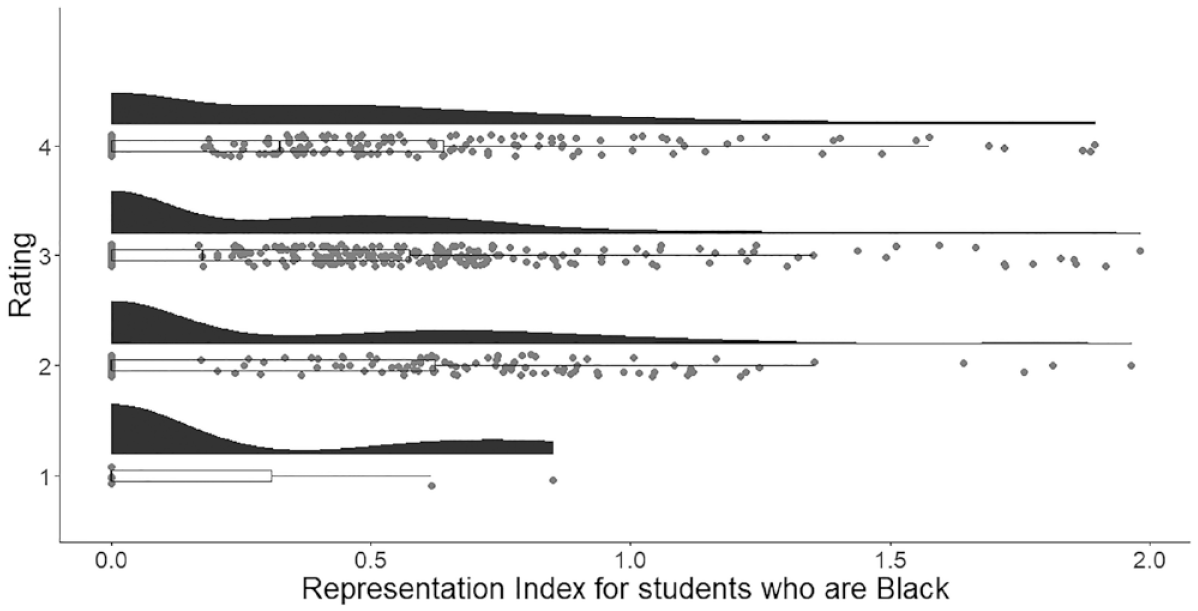
Raincloud plot depicting the distribution and centrality of the Representation Index for students who are Black by gifted program self-rating.
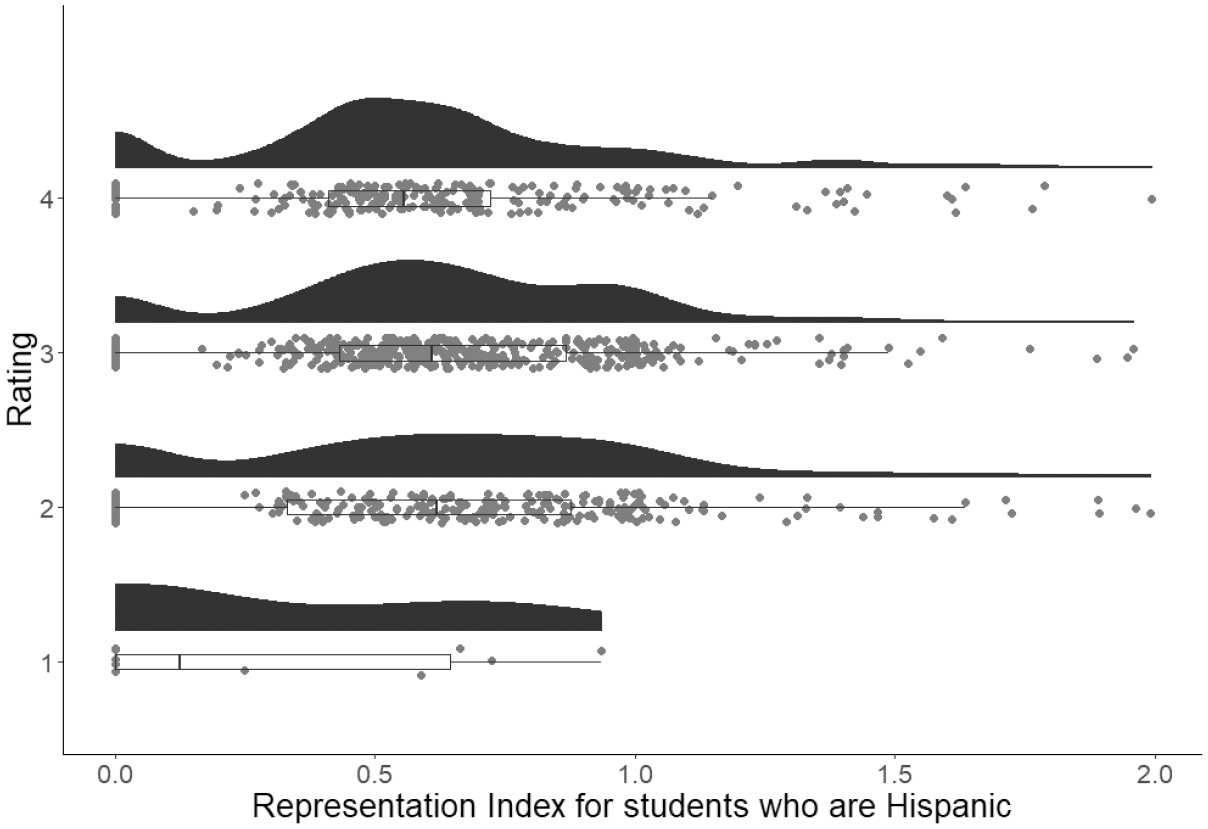
Raincloud plot depicting the distribution and centrality of the Representation Index for students who are Hispanic by gifted program self-rating.
Additional Analysis
In our additional analysis, we included an interaction between locale and funding. As an interaction is included within the regression, the interpretation of the main effects differs. The regression coefficients for Suburban, Exp (b) = 1.41, SE = 0.28, t = 4.98; Town, Exp (b) = 0.60, SE = 0.21, t = 2.82; and Urban, Exp (b) = 1.83, SE = 0.31, t = 5.97, were smaller with the inclusion of the interaction. Furthermore, the coefficient for funding, Exp (b) = 0.41, SE = 0.11, t = 3.86, indicates a positive relationship between rural school districts and funding. In comparison, the interaction coefficient for Suburban, Exp (b) = ‒0.37, SE = 0.15, t = 2.41; Town, Exp (b) = ‒0.34, SE = 0.16, t = 2.17; and Urban, Exp (b) = ‒0.50, SE = 0.15, t = 3.43, was comparatively smaller.
Discussion
The purpose of this study was to explore the individual relationships of locale, demographic proportionality, and representation (i.e., students who are Black or Hispanic), and the percentage of budget allocated for gifted programs to districts’ self-assessed performance ratings of their gifted programs in the state of Texas. Despite the freedom districts were given to design, conduct, and report ratings for nine required categories on a 4-point scale, gifted education (on average) received the lowest self-assessed ratings across the state. As a point of comparison, a mean comparison test revealed that Texas school districts self-rate their wellness and physical education programs higher than their gifted programs; thus, districts may view their wellness and physical education programs more favorably than their gifted programs. Overall, findings indicate that proportional representation of Black and Hispanic students in gifted programs did not influence school district self-assessed performance ratings. However, locale, proportion of Black and Hispanic students to the overall district population, and budget allocation did relate to self-assessed performance ratings of gifted programs. More details are discussed below.
Texas Gifted Education Policies and Program Evaluation
In the 2014–2015 school year, Texas gifted education policy required districts to self-assess their own performance and determine ratings. Districts were required to adopt a policy on usage of funds to support their gifted and talented programs (House Bill 3, 1995/2019; TEA, 2013) and were provided with guidance from the Texas State Plan in regard to providing assessments for gifted and talented services accessible to all populations within their school district (TEA, 2009, 2019b). Decisions about education programming design and implementation in Texas are primarily the responsibility of school boards and locally determined committees within independent school districts. Districts were not required to report the criteria they used to self-assess their programs, so the current analysis could not account for districts’ specific assessment and rating processes. The statewide implementation of performance ratings used for program evaluation within Texas makes interpretation of individual district ratings incredibly difficult. Prior research has found that even when states mandate gifted program evaluation, the response to evaluation standards is weak and inconsistent (NAGC, 2015; Robinson et al., 2014). This form of statewide program evaluation renders the majority of our findings nearly uninterpretable due to the variety of interpretations that each school district could make for their own gifted programs. Ultimately, we do not have a definitive answer for how or why districts rated themselves the way they did. Although the evaluations used in this study were required by the state, local district committees were the ones who were motivated in determining criterion and assessing practices possibly for either program improvement or program protection for their intended audience (i.e., TEA), and this could have influenced their eventual self-assessed rating (Callahan et al., 1995; Rimm et al., 2018).
What is known is how districts rated their gifted programs in comparison with other programs (i.e., physical education) and how performance ratings related to the location of the district, financial records, and student demographics. Notable within our study was that Texas school districts did not rate their gifted programs as highly as they rated other programs offered. It is possible that districts may have placed more emphasis on conducting data-driven self-assessments for federally supported initiatives, like the performance category of wellness and physical education (e.g., Every Student Succeeds Act, 2015), while the main audiences for the gifted program performance category were state and local agencies. Despite the lower average ratings for gifted programs in comparison with average wellness and physical education program ratings, average performance ratings for gifted programs were still favorably rated within the range of acceptable to recognized (M = 2.95). Under the state accountability policy, district administrators may have had indirect incentives to report high ratings (e.g., continued state and local funding, favorability with the state, approval from district school boards, community support, teacher retention, student retention; Rimm et al., 2018). However, without further inquiry into the reasoning local districts used for their self-assessed ratings, we do not know for certain the determinants for how or why they chose to rate themselves favorably. What is known from our study is the relationship of performance ratings to locale and funding. Furthermore, our findings show some relative disconnects from critical issues that gifted scholars and the NAGC Gifted Education Programming Standards have advocated for across the nation (e.g., disproportionality and representation). These results could provide useful information for legislators, administrators, and researchers in what should be considered within evaluating gifted programs across the state (e.g., locale, proportionality, representation, funding).
Locale
Overall, findings suggest that suburban, town, and urban districts had higher self-assessed ratings for their gifted program than rural districts, which had the lowest average self-assessed rating. The second lowest average rating was reported by town districts, although town districts were almost 2 times as likely to assess their programs at one rating higher than were rural districts. Urban districts assessed their gifted programs highest, and both urban and suburban districts were 3 times as likely to assign their programs one rating higher than rural districts. The current findings align with the range of resource and service opportunities previously reported across locales in Texas (Puryear & Kettler, 2017).
Compared with other Texas locales (i.e., town, suburban, urban), the lower self-ratings of rural districts may be attributable to lack of resources (e.g., funding, program coordinators, curriculum specialists, specialized teachers, professional development). Districts with fewer resources, such as those in rural or town locales, may rate themselves less favorably due to disparities in funding that lessen the extent of gifted programming options for students and professional development opportunities for teachers, which could contribute to how they perceive their gifted programs (e.g., Kettler et al., 2015; Rasheed, 2020). Conversely, many suburban and urban areas within the state of Texas may have more resources, including more available allocated funding, that they can use to support their gifted programs, potentially leading to higher self-rated performance ratings. Districts in suburban and urban locales, especially those which may compete for enrollment with adjacent districts, may also perceive more pressure from the community (e.g., parents, school board members, businesses) to support gifted programming and earn a high-performance rating for their gifted programs.
Funding
Based on our findings, for every percent of the total budget that a district allocates to gifted programming, districts were 12% more likely to rate their performance one rating higher. Our results indicate a weak positive relationship in the percentage of district budget allocated for gifted programs and their performance ratings (see Figure 2). The variance of the coefficient across school districts indicates a need for further research on funding and program evaluation that considers contributions of other factors to a district’s perception of their gifted program (e.g., standardized test scores, program goals, professional development opportunities, community support). Even though the relationship is weak, this finding could indicate that districts that allocate greater portions of their budget for their gifted programs are more likely to view gifted education in their districts favorably and, therefore, rate their performance higher.
The Texas State Plan (TEA, 2009, 2019b) required districts to self-evaluate how they track allocation of funds for gifted programs. How a school district spends its money can be seen, in part, as a reflection of what the school district views as a priority for their students (Hodges et al., 2018). Districts that have more funds for their gifted program are better able to allocate more of their budget to pay for more gifted education personnel, professional development, and specific program resources for gifted students, which could contribute to better student outcomes (Baker, 2001a, 2001b). That said, it is not surprising that districts would have more favorable views of their gifted program when allocating more funds toward it, because districts are quite literally “putting their money where their mouth is.” However, it is still unknown how districts are allocating the budget toward their gifted programming (e.g., more assessments for testing, gifted education personnel, curriculum materials) and what specific spending is influencing more favorable performance ratings. Baker and McIntire (2003) suggested that stakeholders need to “continue to follow-up on whether state aid allocations are meeting their objectives of improving the availability and quality of opportunities for gifted children” (p. 9). We still need to heed their advice and engage in program evaluation that aligns with critical issues (e.g., how the budget is being spent, how their budget relates to equitable access) within gifted education.
In addition, we included an interaction term within our model during the review process that offered a possible explanation to the differences in ratings. The interaction between funding and locale provided evidence that the gap in ratings between rural and other locales closed as the rural school districts allocated greater percentages of their budget to gifted education. In other words, funding had a greater relationship with how a district rated their gifted program in rural locales than in other locales. Likely, though, there are other factors that contribute to the difference in ratings between rural school districts in Texas and school districts in other locales (e.g., demographic composition of the school district). Future research should examine possible interactions among the demographic composition of school districts and funding in relation to their performance ratings.
Proportionality and Representation in Gifted Education
Our overall results indicate that districts with higher proportions of students who are Black or Hispanic were more likely to rate their gifted programs lower than those with different demographic compositions. Thus, the greater the proportion of students who are Black or Hispanic in a district, the more likely that district was to rate their gifted program lower than a similar district. This finding can be attributed to similar factors associated with achievement gap literature, as well as systemic biases held against students of color (e.g., racism, prejudice, institutional discrimination; Mun et al., 2020). Examples of factors considered to contribute to achievement gaps include unsafe school and community environments, fewer economic opportunities for families, lowered expectations of achievement, and less access to sufficient health, social, and academic resources (NEA, 2019; Worrell & Dixson, 2018). Thus, possibly due to these same factors that contribute to achievement gaps, in addition to systemic biases for students of color, the results indicate that if there are large proportions of students who are Black or Hispanic within school districts, it is likely their local committees will rate the performance of their district’s gifted programs less favorably.
In contrast, there was no clear relationship between the representation of students who are Black or Hispanic in gifted programs and how a district rated themselves. We were only able to assess the efficacy of proportional representation as it relates to district ratings based on the data that Texas collects on their school districts. These results give no indication that districts abided by the specific guidelines in the Texas State Plan that recommend state assessments for gifted and talented services be accessible to all populations within their school district (TEA, 2009, 2019b). Given Texas’ historical level of underrepresentation for these two populations (Hodges et al., 2019; Lamb et al., 2019), it is uncertain whether the representation of students who are Black or Hispanic in gifted education was given appropriate consideration within Texas school districts’ self-assessments of their gifted education programs. If representation was taken into account, districts did not report what they considered an acceptable level of representation (i.e., that a school’s gifted population should reflect their general population) that supported a decision to rate their performance as acceptable. As districts reported only composite overall performance ratings, it is unknown what factors were considered and if social desirability to rate their performance higher outweighed the reality of what was happening within the district.
As stated previously, demographic disproportionality and underrepresentation in gifted programs most likely have the same systemic causes (i.e., systematic inequality) that are described in achievement gap literature, as well as the issues outlined within research associated with gifted identification and excellence gaps (Lee et al., 2020; McBee et al., 2014; Peters et al., 2019; Plucker & Peters, 2016; Worrell & Dixson, 2018). Structural inequities associated with social and economic disparities are out of the control of a school district. It is theoretically possible that gifted programs rated as exemplary can have strong disproportionality in their gifted identification (and vice versa) due to demographic representation not being a heavily weighted criteria (and possibly not a priority) in how districts rate their performance of their gifted programs. Until Texas begins measuring student demographic representation in gifted programs and finds a way to hold schools accountable to address inequities, it appears those inequities will persist.
Limitations and Future Directions
The current study has some clear limitations that should be addressed including that the performance rating data collected by the state do not have a way to account for the variety of interpretations for each district. The performance rating data collected do not provide a way to clearly understand the priorities for the district and decision makers (e.g., superintendent, assistant superintendent, principals, local committees) and the pressures that influence their decisions. Long et al. (2015) found that schools with a documented gifted policy “tended to provide more substantial scope and quality to their gifted program” (p. 131); however, even principals who desire to meet policy mandates “may not be given the means to implement the policy guidelines” (p. 133). Future research using qualitative inquiry should further explore the nuances within each school district to address how leaders and stakeholders decide upon the criteria for performance ratings within the state of Texas, what the districts’ plans are for using the self-assessment criteria and the resulting ratings, and the perception of administrators (i.e., decision makers, education policy makers) related to their district’s focus on equity within gifted programs.
A further limitation in this study is that the analysis does not include how the representation of students who are Native American influences performance ratings due to small sample size. Students who are Native American are consistently underrepresented in gifted education programs in the United States (Gentry et al., 2014); however, conducting statistical tests and analyzing representation when populations within districts that have less than 10 Native American students can lead to inappropriate conclusions (Faraway, 2016). Future research should seek to understand how representation of Native American students in school districts relates to perceptions on the quality of their gifted programs.
Another future direction relates to how research should use other locale designations and how funding relates to perceptions of gifted programs. Locale determination based on NCES designations may not be a clear indicator of the complexity of rurality and does not take into account the level of proximity to other urban centers (i.e., remote, distant, and fringe) and the ambiguity surrounding the size of districts as an indicator of rurality (Puryear & Kettler, 2017). Specifically, future research could study how rural school districts engage in self-assessing their performance ratings with less funding, limited population size, lack of ethnic diversity, and restricted access to resources.
Practical Implications
Legislators and administrators should engage in critical reflection of their evaluative processes, especially how their district’s location, funding, and demographic representation can impact their performance ratings. Gifted education scholars have compiled resources and self-assessment checklists for administrators that align with the NAGC Gifted Education Programming Standards (2010, 2019) to help districts self-evaluate and reflect on improvement for their gifted programs, although the use of such tools is largely determined by individual states, regions, and districts across the nation (Cotabish et al., 2015; Johnsen, 2012; Speirs Neumeister & Burney, 2012). For future evaluations of performance, districts can use the revised Gifted Education Programming Standards (NAGC, 2019), that incorporate elements from the Culturally Responsive Equity-Based Bill of Rights for Gifted Students of Color (Ford et al., 2018), to better reflect issues of equity and inclusion for gifted programs. Furthermore, more collaboration between district leadership who are decision makers (e.g., superintendents, assistant superintendents, school board members) and gifted education advocates (e.g., coordinators, gifted education researchers) is needed to help address the disparities in demographic representation that continues within gifted programs (Mun et al., 2020; Park & Datnow, 2009; Peters et al., 2019; Plucker et al., 2017).
Our research cannot assess whether districts were honest assessors. However, our research does provide evidence that districts did not use all of the gifted programming accountability guidelines provided by the state, nor the programming standards from NAGC. If the state wishes for districts to follow its guidelines, it must provide more incentives for compliance, rather than locally controlled accountability measures. For example, the state could provide funding weights to students in underrepresented demographics identified for gifted services in an effort to encourage equitable identification. In addition, districts that aim to use more equitable identification practices may consider moving to a system of universal consideration for gifted programming (Lee et al., 2020), which could alleviate the influence of stereotypical perceptions of gifted students of color (McBee et al., 2014), though universal testing may require more funds than existing procedures. Stronger incentivized state-level accountability measures coupled with partnerships with gifted education scholars are needed.
Conclusion
Our results show a relative disconnect between what scholars believe to be a critical issue within gifted education and how school districts evaluate themselves. For decades, underrepresentation in gifted identification has been a critical issue, in which scholars have decried the lack of change in representation of Black and Hispanic students in gifted programs (e.g., Borland, 2004, 2014; Ford et al., 2018; Ford & Grantham, 2012; Lohman, 2005; Mun et al., 2020; Peters et al., 2019; Plucker et al., 2017; Worrell & Dixson, 2018; Yoon & Gentry, 2009). Representation of Black and Hispanic student populations has historically been low within the state of Texas, and our results indicate their representation in gifted programs does not collectively play a role in how districts rate their program performance to the state. School districts could still be unaware of this fundamental problem of underrepresentation within their gifted education programming, or they are choosing to ignore the issue. Regardless, this important finding has ramifications for the scholarly community, policy makers, and educators. Building partnerships between policy makers and gifted education scholars is crucial if we want to help change systemic issues of inequity within gifted education.
Footnotes
Declaration of Conflicting Interests
The authors declared no potential conflicts of interest with respect to the research, authorship, and/or publication of this article.
Funding
The authors received no financial support for the research and/or authorship of this article.