
Abstract
We examined the state of Arkansas, empirically testing how focusing on high-achieving students using state tests might expand the pool of gifted identified students. From a broader sample of 173,133 students, we compared the degree to which students who were academically talented in the top 5% on third-grade state literacy and math assessments were identified as gifted in Arkansas. Across five independent cohorts, we replicated the finding that roughly 30% of the students in the top 5% on both third-grade literacy and math were not identified as gifted. Logistic regression (N = 3992) indicated that high-achieving students participating in the federal Free/Reduced Lunch program were 50% less likely to be identified. These findings suggest that using state math and literacy assessments as universal screening tools could improve gifted identification of high-achieving students, many from low-income or other disadvantaged backgrounds.
Broadly, one core broad purpose of gifted identification is to be able to match students to educational need (e.g., Assouline et al., 2015; Steenbergen-Hu & Moon, 2011). There are a wide range of definitions of what it means to be gifted (e.g., McBee & Makel, 2019); however, high developed academic aptitude or achievement can be considered one important indicator of giftedness (Subotnik et al., 2011). (Lohman, 2005a, 2005b; also see Lakin, in press) argued that the core purpose of gifted programming should be to provide appropriately challenging curricula for students who have exhibited high accomplishment in one or more domains. Specifically, Lohman, 2005a noted that “measures of academic accomplishments (which include, but are not limited to, norm-referenced achievement tests) should be the primary criteria for defining academic giftedness” and that the developed symbol systems of numbers (related to math achievement) or words (related to literacy achievement) were both an important product of schooling and also important to learning in school (p. 132).
In this paper, we draw from the conceptualization of high academic achievement as one indicator of giftedness to examine the identification process in the state of Arkansas. The identification policy and process in Arkansas is unique to the state, and largely draws from the gifted conceptualization model described by Renzulli (1978), which includes, among other aspects, an emphasis on creativity. We fully acknowledge that gifted identification in Arkansas may not necessarily have had the original aim to primarily serve students specifically advanced in math and literacy achievement. However, recent research focused on finding ways to capture a broader array of talented but disadvantaged students illustrates that using universal screening (Card & Giuliano, 2016), expanding measures used in academic services (Wai & Lakin, 2020), and considering other ways of making the cut in gifted selection such as local norms (Lakin, 2018; Lohman, 2009; Peters et al., 2021) can be effective ways of capturing a broader array of students from low-income and other disadvantaged backgrounds. Here, we examine whether expanding gifted identification to capture a broader group of academically advanced low-income and other disadvantaged students is also an effective strategy. Many school systems may already be set up for providing academic challenge for students with demonstrated high academic achievement; thus, this might be a reasonable way to further expand gifted programming access.
In this article, we first share a brief summary of gifted identification in Arkansas. We then provide an empirical test of how focusing on high-achieving students might expand the pool of identified students in Arkansas, especially those from disadvantaged backgrounds. We conclude by discussing our findings in the broader context of the literature and provide policy suggestions, limitations, and ideas for future research directions.
Gifted Identification in Arkansas
The Arkansas Department of Education (2009) noted: “Gifted and talented (GT) children and youth are those of high potential or ability whose learning characteristics and educational needs require qualitatively differentiated educational experiences and/or services” (p. 4). Arkansas’ GT identification process follows the tradition that looks at giftedness and talents as multifaceted and should be accommodated with appropriate educational services (Renzulli, 1978; for more detail, see Arkansas Department of Education, 2009). The identification process has several stages and can occur at any grade level from kindergarten to Grade 12. Typically, students must be referred for consideration from various sources, including teachers, parents, counselors, and students. Next, data must be collected on the nominated students using, per state requirement, at least two objective and two subjective measures with at least one of those being a creativity assessment. Objective measures include standardized cognitive aptitude tests and standardized achievement tests, such as the ACT Aspire or the Iowa Tests of Basic Skills, or tests of creative ability. Subjective measures include behavioral checklists (parent and/or teacher), rating scales, evaluations of products, student interviews, biographical inventories, grades, and auditions.
A committee consisting of at least five professional educators chaired by a trained specialist in gifted education then makes the placement decision for appropriate programs based on the collected information. This committee can be formed on each campus within the districts and/or at the district level with representatives from each campus. Districts can determine their individualized process, and identification status may not be retained if students transfer districts. Each district’s gifted program must have an annual evaluation through a state program approval report.
In terms of serving students that are identified, districts must meet the minimum requirements of services. From kindergarten through Grade 2, districts generally provide weekly whole-group enrichment classes. Between Grades 3–12, once students are identified as in need of the GT program, they are required to receive a minimum of 150 min a week of GT services. Those services vary widely across the state, especially in the secondary setting, from GT seminar and Honors courses to Advanced Placement (AP), Pre-AP, and concurrent classes. However, there is not necessarily consistency in how districts meet the needs of GT students as local decisions lead to the implementation of services in a wide variety of ways. Gifted and talented teachers are required to attain the minimum required score, which varies across states, on the Gifted Education Praxis Examination, and meet licensing standards for an add-on endorsement/licensure in gifted education (Robinson et al., 2014).
Some studies have focused on training for GT teachers and early interventions in Arkansas (Robinson et al., 2009, 2014, 2018). However, research on Arkansas’s identification process and representation is limited even though Arkansas has a state mandate on GT identification and services. On the other hand, Peters et al. (2019) found that simply having a state mandate does not “appear to translate to proportionality” (p. 280). Moreover, there has been an existing concern about the underrepresentation of low-income or other disadvantaged students in GT education in public schools (e.g., Card & Giuliano, 2016; Grissom & Redding, 2016; Payne, 2010). There are several reasons for such disproportionality in representation, including teacher–student ethnicity congruence (Grissom & Redding, 2016), the use of different tests, and ways students are being identified (Peters & Engerrand, 2016), such as the two-phase identification process (e.g., Hamilton et al., 2018; McBee et al., 2016). Knowing that Arkansas has a state mandate and two-phase identification for GT students and the lack of research on this specific topic stimulated us to conduct this study.
The Current Study
Our study focused explicitly on the identification process of GT students in Arkansas across the entire state. This descriptive analysis examined whether students currently demonstrating high academic achievement at the time of GT identification are fully captured by the current GT identification process in the state. The analysis was intended to examine how focusing on already high-achieving students might expand the identified pool of GT students, in particular those from low-income and other disadvantaged backgrounds.
Data and Sample
In this study, we examined the alignment between students identified GT in Grade 4 and those who performed in the top 5% of the state in both math and literacy on their third-grade assessments. Although GT students can be identified at any grade, we found that in practice 96% of Arkansas school districts identify the majority of GT students by the fall of fourth grade. Students complete the first statewide assessment of math and literacy in the spring of their third-grade year. Test score availability is a core reason why almost all school districts in Arkansas identify their GT students by Grade 4.
We assumed that those students who scored in the top 5% of state standardized tests were high achievers and could be considered academically talented (e.g., Lakin & Wai, 2020; Wai et al., 2012). The Acceleration Institute (n.d.) recommends using the 95th percentile threshold to define “who has mastered the classroom curriculum and needs an intervention that provides more advanced work in a specific subject” (para. 1). Although more inclusive cutoffs such as at the 90th percentile could have been used, in this study, we selected students who scored at or beyond the 95th percentile in state standardized tests in both math and literacy to ensure that we captured a reasonable group of the most academically gifted students in our analytic sample. Our reasoning was that if the 95th percentile cut could capture more students, then we would have pinpointed an important group that may need academic challenge.
We used student third-grade literacy and math achievement in the years 2013, 2014, 2016, 2017, and 2018 and their fourth-grade GT indicator in the years 2014, 2015, 2017, 2018, and 2019. Our analysis did not include the cohort of fourth graders from 2016, as the GT indicator was not included in the data provided for that year.
Summary Statistics of Matched Fourth-Grade Demographics and Third-Grade Literacy and Mathematics Achievement, Full Sample.
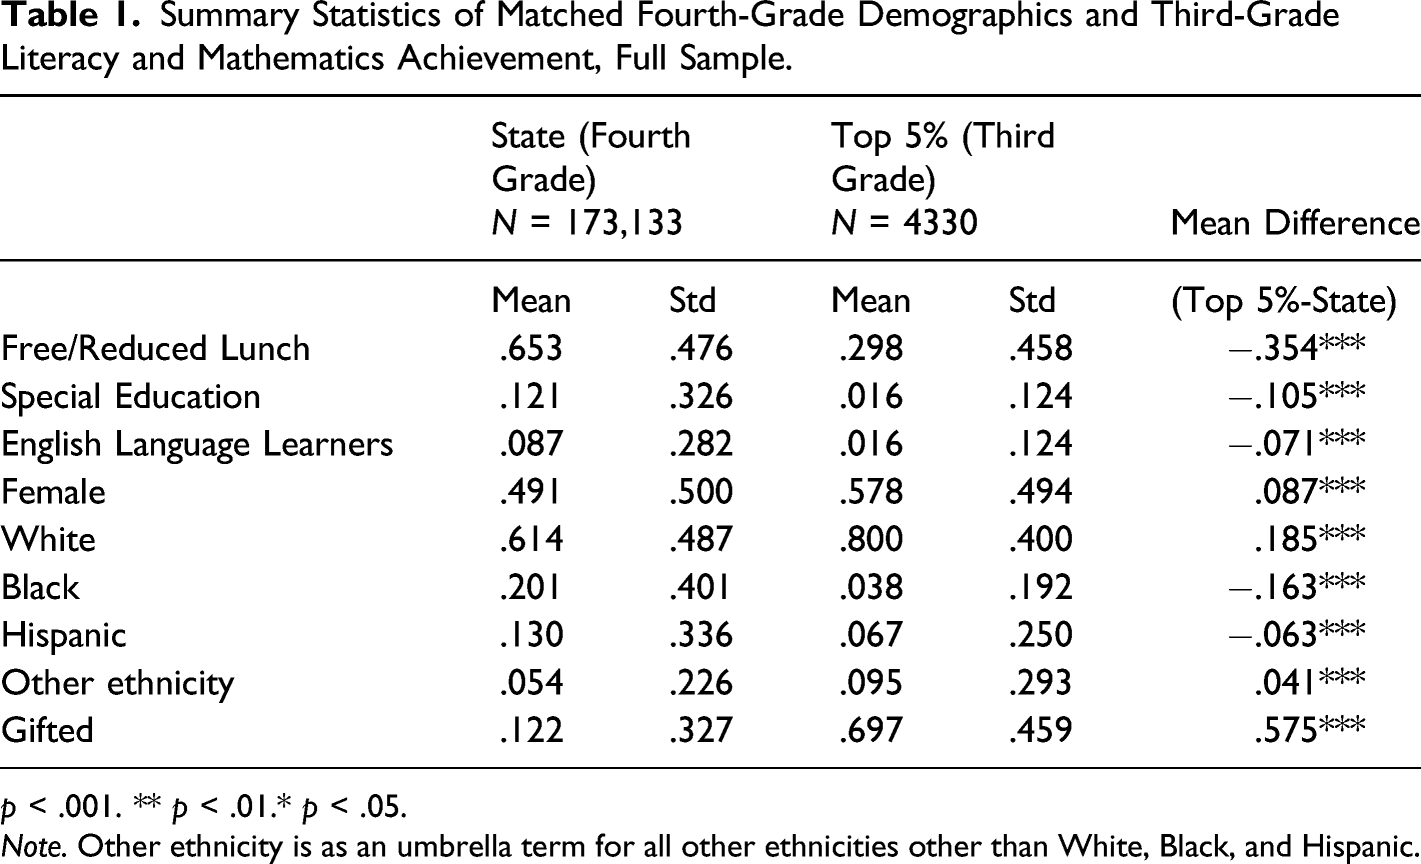
p < .001. ** p < .01.* p < .05.
Note. Other ethnicity is as an umbrella term for all other ethnicities other than White, Black, and Hispanic.
Within the group of top 5% achievers, 70% of students were identified as GT by fourth grade, whereas 30% were not. White and female students were overrepresented in the group of students who scored in the top 5% on third-grade assessments. In contrast, Black and Hispanic students, as well as those participating in FRL, identified as SPED, or identified as ELL were less likely to be in the high-achieving group relative to their share of the fourth-grade population.
Method
We used both descriptive statistics and logistic regression as our analytical strategies. In the descriptive statistics part, we investigated four different groups of students. These groups were the following: 1. GT: Students identified as GT in fourth grade. 2. Top 5%: Students scoring in the top 5% in both literacy and math on third-grade state assessments. 3. GT and Top 5%: Students identified GT in fourth grade who scored in the top 5% on third-grade state assessments. 4. GT but not Top 5%: Students identified GT in fourth grade but who did not score in the top 5% on third-grade state assessments.
Next, we predicted the probability of being assigned to the GT category based on observable characteristics among academically gifted students. In particular, we ran logistic regression to predict the likelihood that students who scored in the top 5% on third-grade state assessments would be identified as GT by fourth grade. We limited our investigation to only those who scored at and beyond the 95th percentile on third-grade assessments. We ran two separate models, one focused on accounting for student-level characteristics and the second accounting for both student- and district-level characteristics

In Model 1, we included student-level characteristics. In Model 2, we added district-level characteristics. In the two models,
However, as district characteristics may also impact the likelihood of GT identification, we added district-level fixed-effects and year fixed-effects to control for across district and across year policy variations. In particular,
There are five regions in Arkansas, including Northwest, Southwest, Northeast, Southeast, and Central Arkansas. In this paper, we used the Northwest as the preference region when comparing with other regions. Poverty levels are divided into four categories based on the numbers of students on FRL: low (0–43%), lower middle (43–52%), upper middle (52–66%), and high (> 66%). In this paper, we used lower middle level of poverty as the reference group because the majority of school districts in Arkansas were in this category. Similarly, we used medium enrollment size (1001–2600 students) as the reference for district enrollment against very small (0–500 students), small (501–1000 students), large (2601–6000), and very large (>6000 students). Finally, we used locale provided by the National Center for Educational Statistics, where city was the reference group. For a nontechnical guide to economics of education methods, see Schlotter et al. (2011).
Findings
Figure 1Figure 1 presents an illustration of the relationship between the populations, the top 5% of achievers, and GT identification for fourth graders in the 2019 cohort. We provided this year as an example for visual illustration because this pattern replicated across the other year cohorts examined. For more detail on the other years, please see the Appendix. Venn Diagram for 2019 Fourth-Grade GT Students and Top 5% Students on 2018 Third-Grade Literacy and Mathematics Assessments. Note. The yellow circle represents all AR GT students. The light blue circle represents all top 5% students. The overlapping area of the two circles is the number of top 5% students who were identified as GT.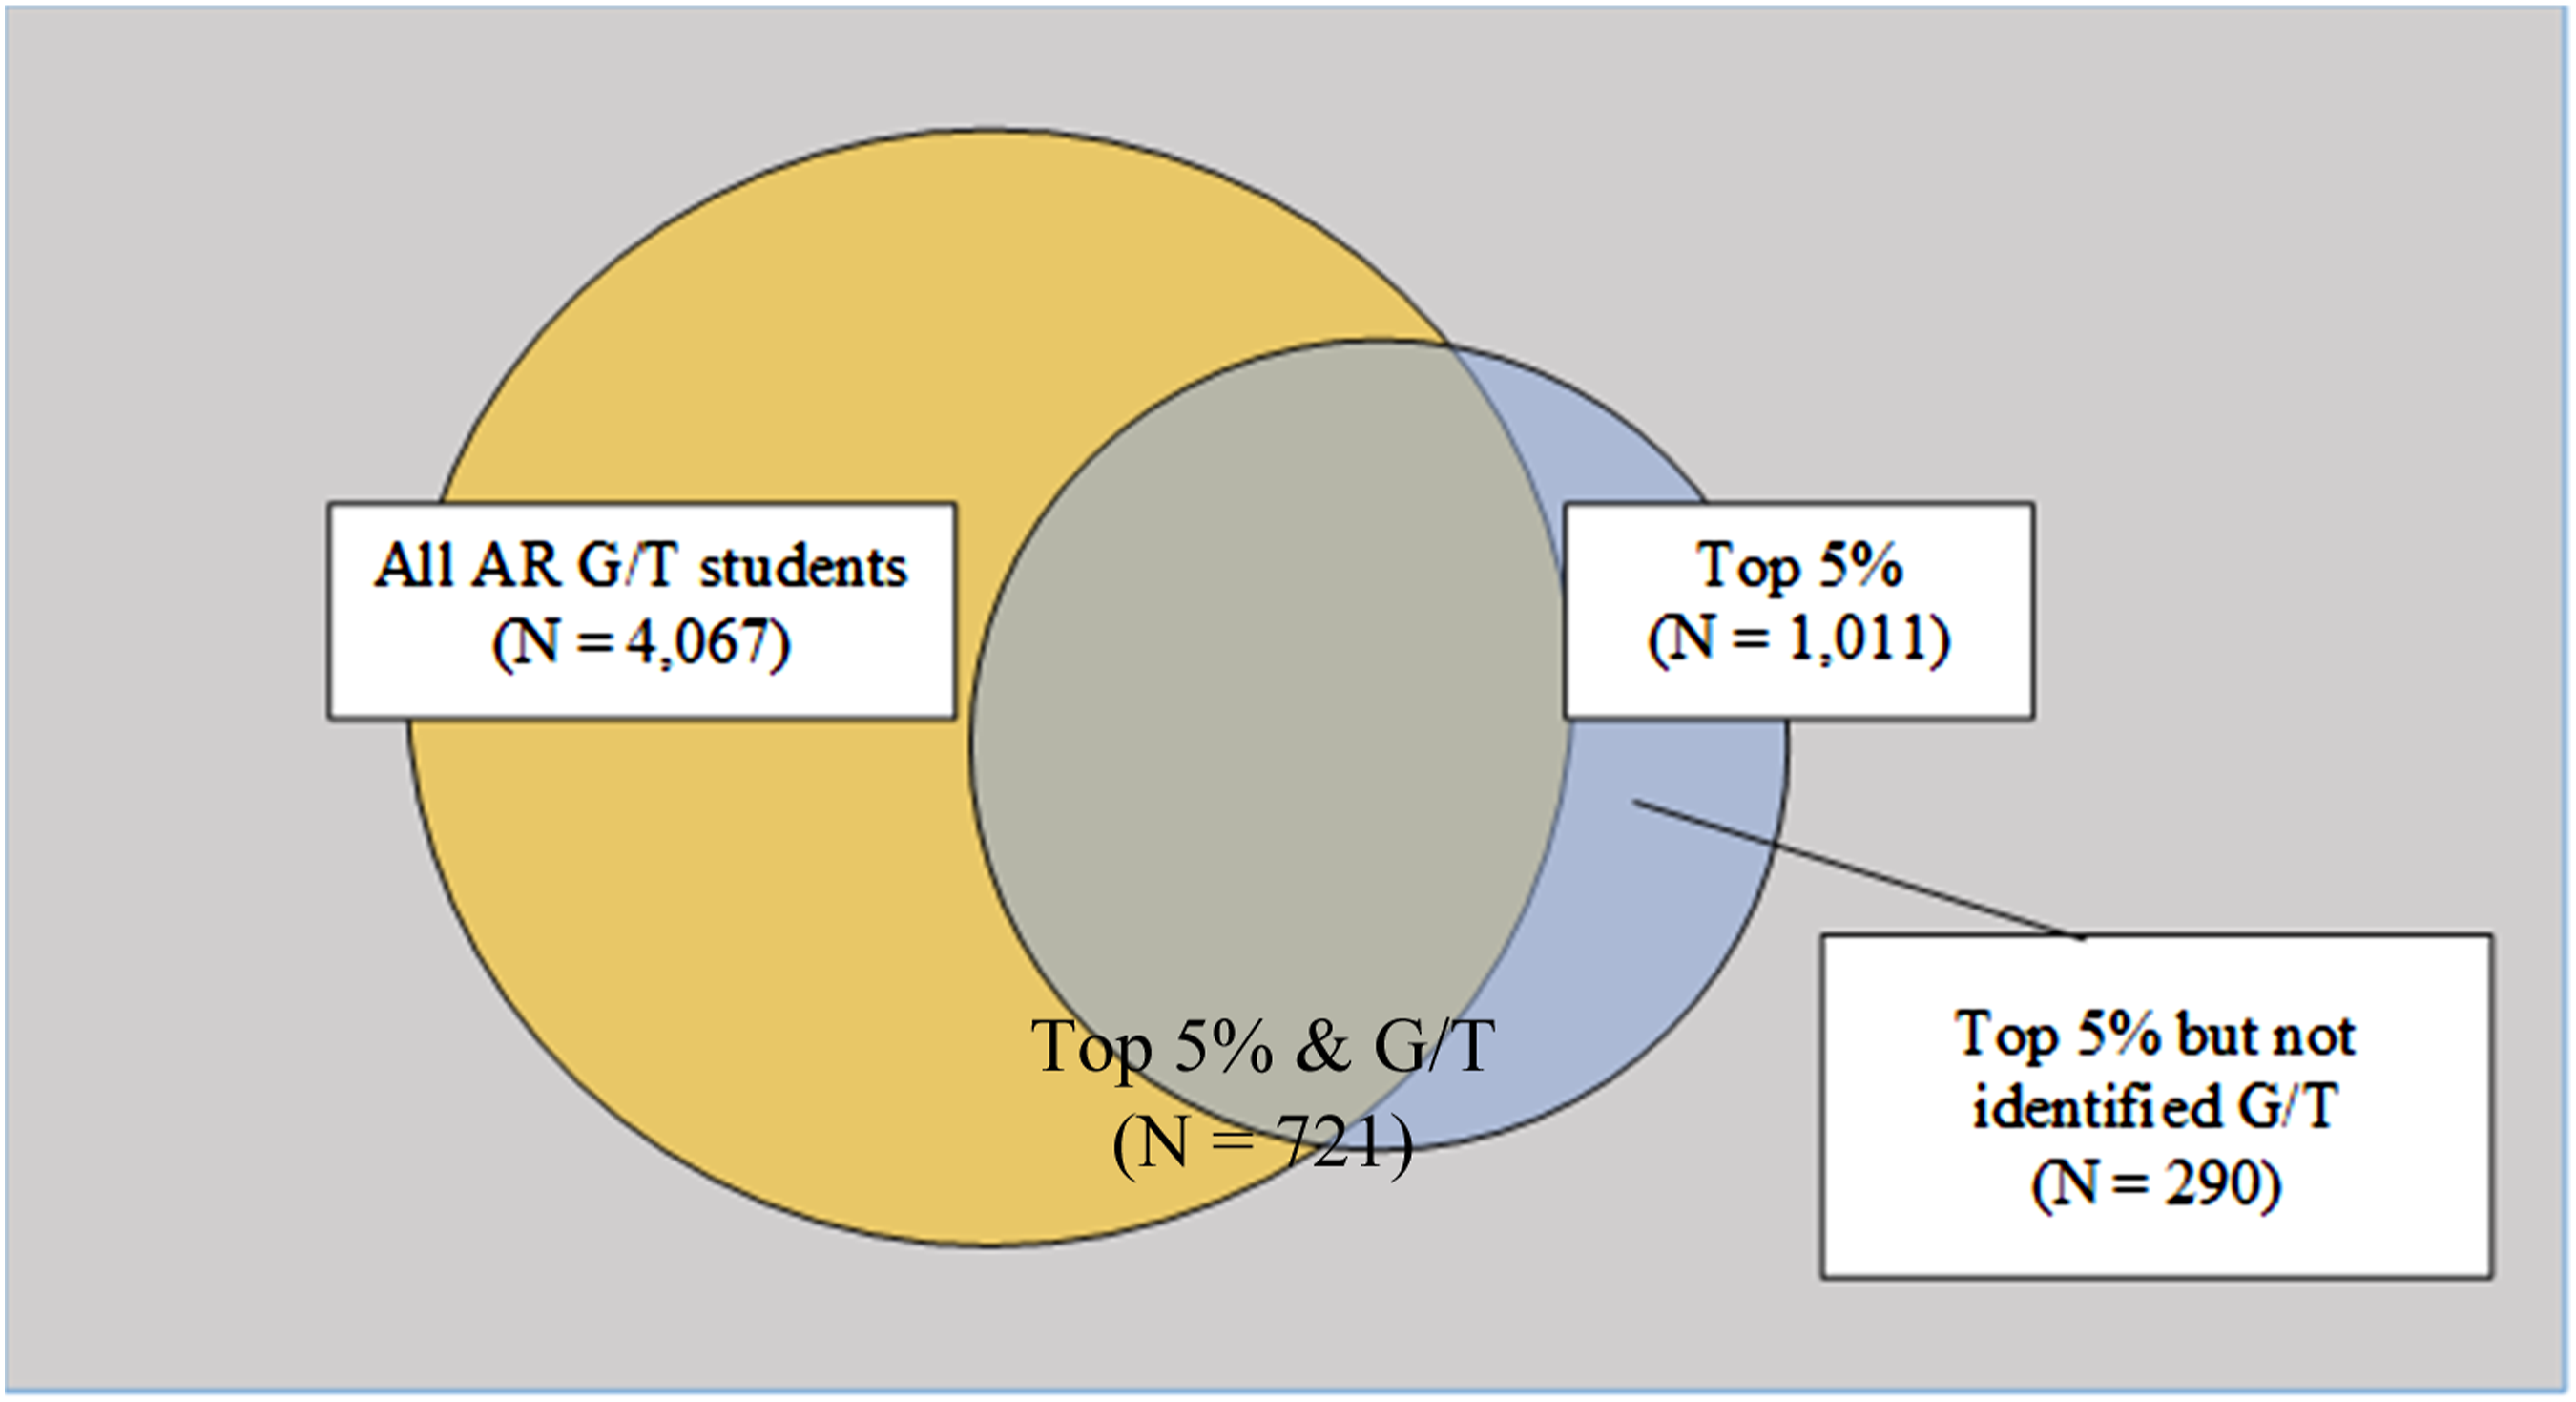
In 2019, 4067 students were identified as GT by the fourth grade (see Figure 1); 1011 students scored in the top 5% on both math and literacy assessments at the state level. Among the top 5% students, 721 (or 71.31%) were identified GT. Among 4,067 GT students, 3346 (or 82.23%) did not score in the top 5% on both assessments. Thus, 28.68% of the top 5% scoring students were not identified as GT.
Student Demographic Breakdown by GT Status in Fourth Grade and Top 5% Status in Third Grade, 2018–2019 Cohort.
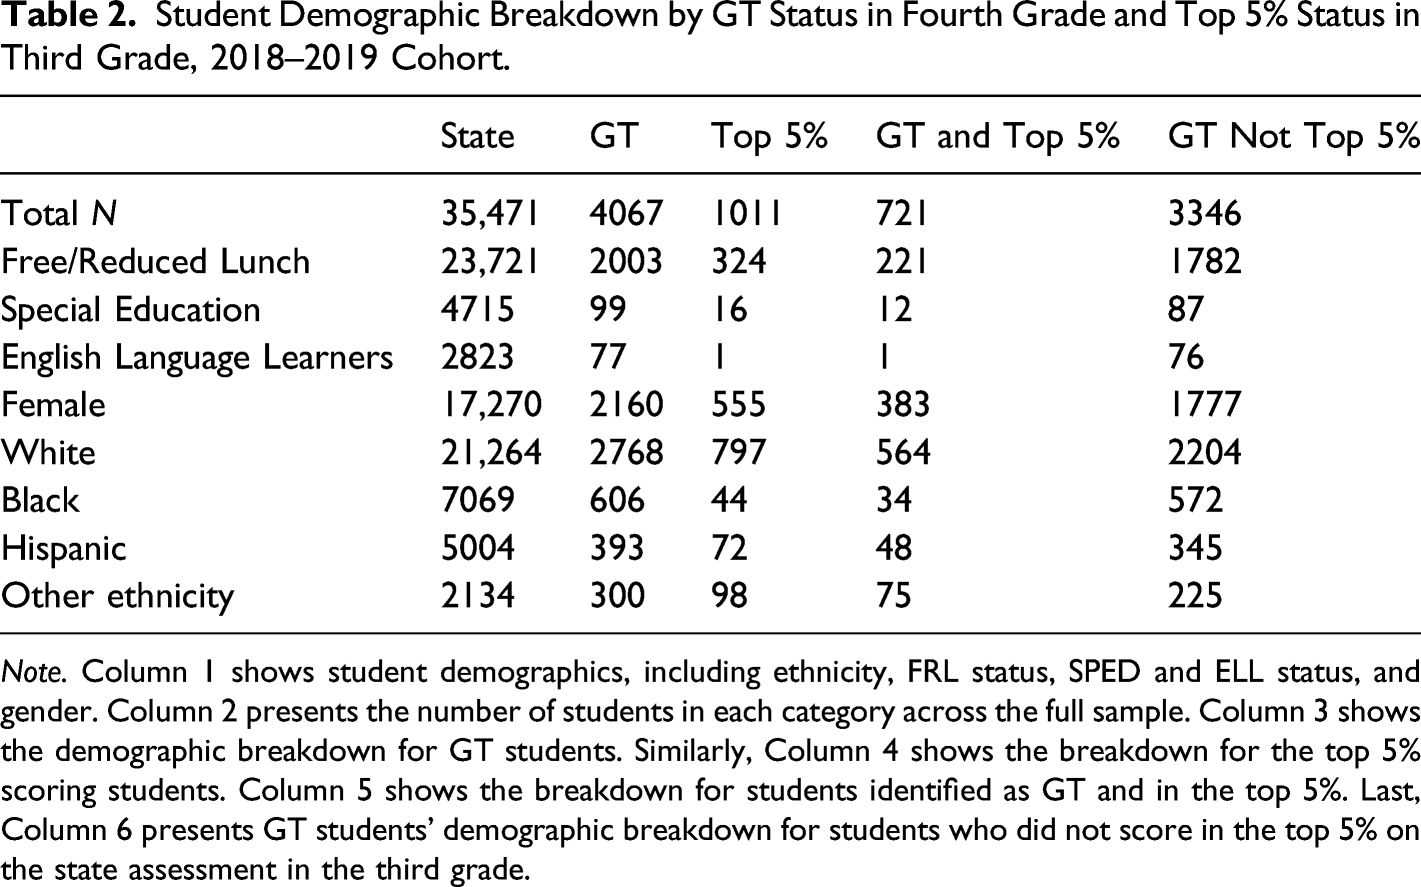
Note. Column 1 shows student demographics, including ethnicity, FRL status, SPED and ELL status, and gender. Column 2 presents the number of students in each category across the full sample. Column 3 shows the demographic breakdown for GT students. Similarly, Column 4 shows the breakdown for the top 5% scoring students. Column 5 shows the breakdown for students identified as GT and in the top 5%. Last, Column 6 presents GT students’ demographic breakdown for students who did not score in the top 5% on the state assessment in the third grade.
Next we describe some noteworthy data patterns from Table 2. First, 11.5% of all fourth graders were identified GT. Among them, roughly 70% were White, 15% Black, 10% Hispanic, and 5% from another ethnicity. There were more female than male GT students. In addition, 49% of GT students had FRL status. On the other hand, only 2.9% of all students were in the top 5% on state assessments in third grade. Among this group, 79% were White, 4% were Black, 7% were Hispanic, 10% were another ethnicity, 32% had FRL status, and 50% were female. White students and those from backgrounds of higher SES were more likely to be in the top 5% on both literacy and math state assessments.
The 721 students who were identified GT and in the top 5% on state assessments accounted for 2% of all students in the 2019 third-/fourth-grade cohort. Among them, 78% were White, 5% were Black, 7% Hispanic, 10% from another ethnicity, 31% had FRL status, 2% were SPED, .1% were identified as ELL, and 53% were female. There were 3346 students (9.4% of all students in Arkansas) who were identified as GT in fourth grade but did not score in the top 5% on state assessments in the third grade. Among them, 66% were White, 17% were Black, 10% were Hispanic, 7% were from another ethnicity, 53% had FRL status, 2.6% had SPED status, 2.3% had ELL status, and 53% were female.
Overall, we observed that about 70% of students who scored in the top 5% on both literacy and math on third-grade state assessments were identified as GT. The current GT system in AR appears to overidentify certain students when considering the top 5% achievers in math and literacy. On the one hand, we found that students from certain ethnic and lower SES backgrounds, ELL, and SPED students had been identified for the gifted program although there were fewer of them in the top 5% of math and literacy achievement.
In addition, comparing the two columns “GT and Top 5%” and “GT not Top 5%,” we found that even though only 4.7% of the GT and Top 5% were Black, these students made up 20.5% in the GT not Top 5% group. Similarly, we saw higher rates in GT not Top 5% for Hispanic, FRL, SPED, and ELL students compared with the GT and Top 5% group.
Fourth-Grade GT Status Matched Third Grade Top 5% Status and District Characteristics in 2019, Cohort 2018–2019.
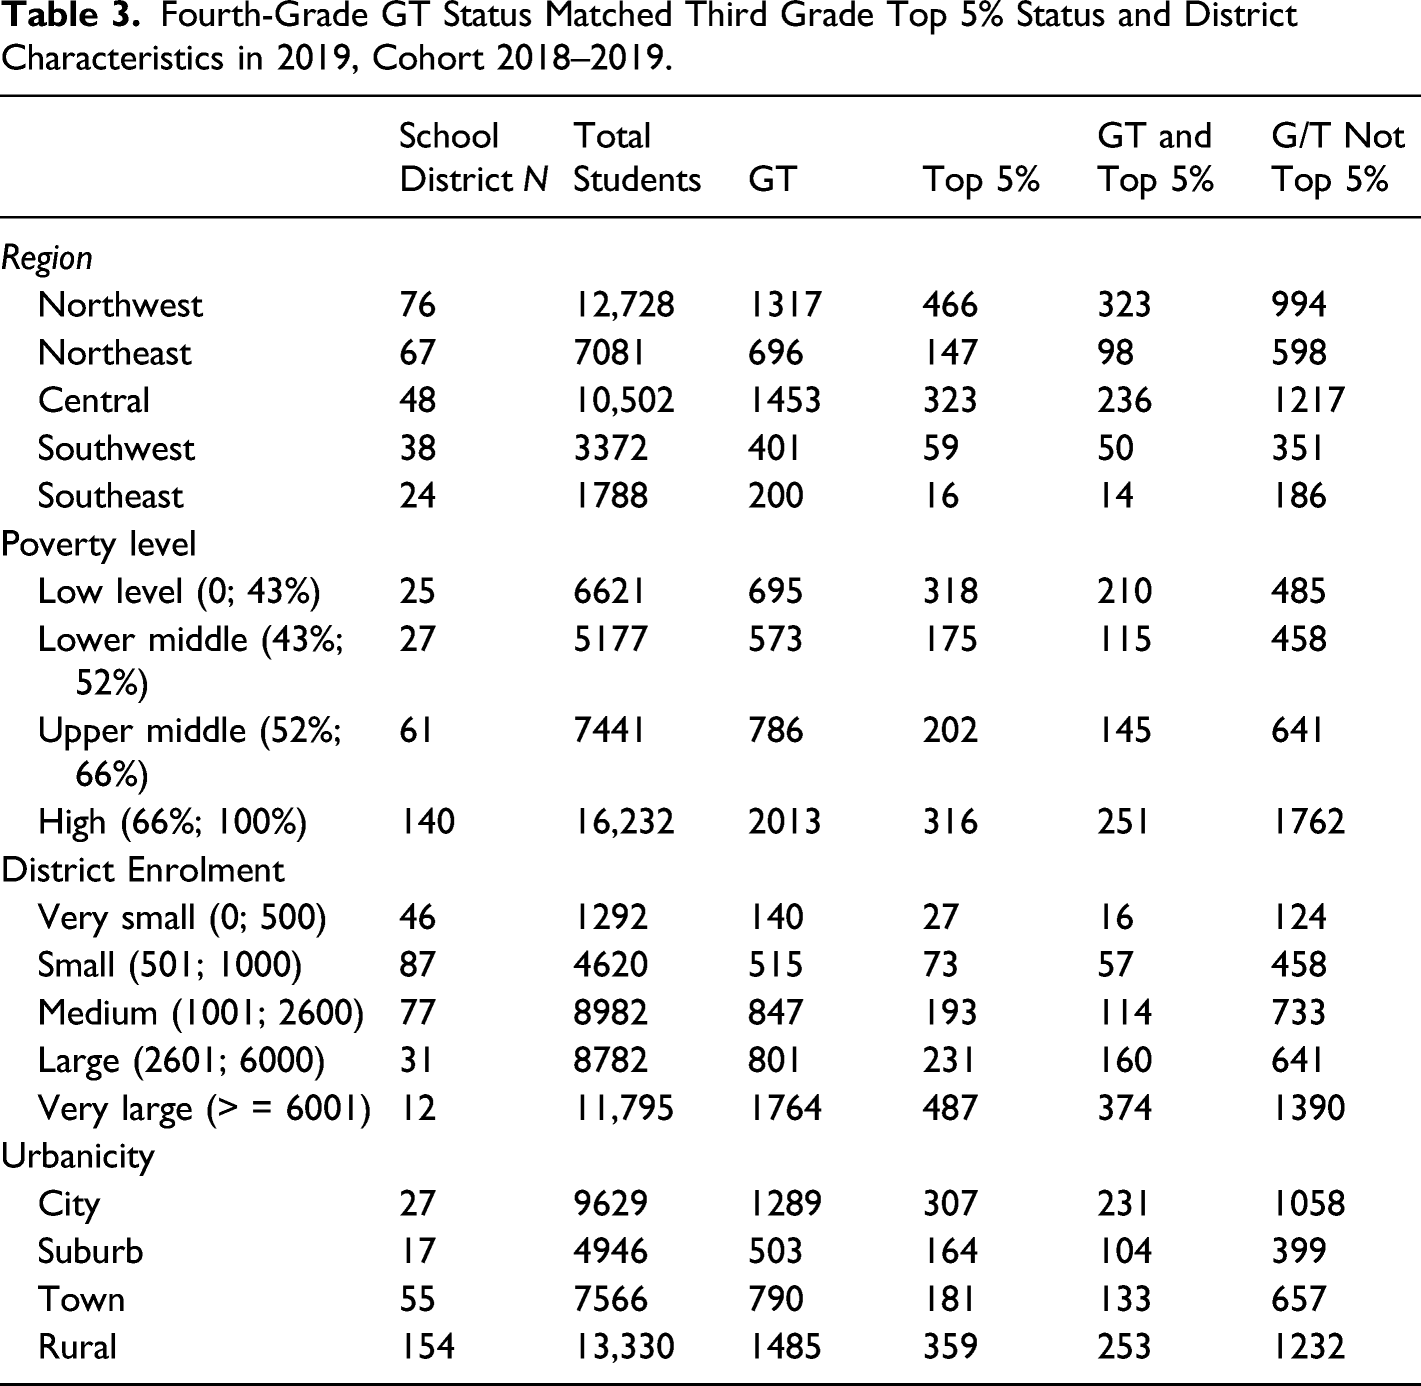
Although a reasonable critic might be concerned that the top 5% of students may not be identified as GT due to a lack of available resources (e.g., class space, personnel), we found this was not the case. As presented in Table 2, more than 82% of students identified GT in fourth grade did not demonstrate high academic performance on third-grade state assessments. In Northwest Arkansas, 75% of GT students were not in the top 5%, which reached a high of 93% for the Southeast. In short, we observed that some regions were more likely to label top 5% students as GT to accommodate them, but they also overaccommodated the service to students who are not in the top 5%, which did not indicate a lack of available resources.
Second, examining the four groups by district poverty rates provided additional insight. Districts with the highest level of poverty (>66% FRL) also identified the highest percentage of students as GT (12%) and were most likely to identify students in the top 5% as GT (79%). Districts in the lowest level of poverty had the highest percentage of students in the top 5% but only identified about two thirds of those students as GT.
Third, the largest districts had the highest percentage of students identified GT (15%) and students identified in the top 5% (4%). Small districts (501–1000 students) and the largest districts identified the highest percentage of top performers as GT at rates of 78% and 77%, respectively. We again observed the phenomenon of more broadly identifying GT students and underaccommodating the top 5% across all district sizes.
Fourth, compared with cities, suburbs, and towns, rural districts enrolled the most students in Arkansas, approximately 38% of all fourth-grade students in 2019. Together with school districts in cities, rural school districts had the most GT students and top 5% students on all state assessments. However, underaccommodating the top 5% of students and more broadly identifying GT students was again replicated when examining urbanicity. For example, in 2019, rural school districts had the most GT students, but 83% of them did not score in the top 5% on the math and literacy state assessments. The number was 82% for cities, 79% for suburbs, and 83% for towns. Simultaneously, in rural schools, 70% of the top 5% of students were also GT students. The number was 73% for towns, 63% for suburbs, and 75% for cities. It appears that high-achieving students in urban school districts were somewhat more likely to be identified for and receive GT services.
In short, from a descriptive synthesis of Tables 1-3, we identified three core considerations regarding existing GT programs in Arkansas. First, around 30% of students who objectively scored in the top 5% on both math and literacy assessments were not identified as GT by fourth grade. This academically high-achieving group of students is not provided a service that may help their further talent development. Second, a high percentage of identified GT students did not demonstrate high achievement (at least defined as the top 5%) on state assessments. Finally, because the percentage of students in the GT group that were not academic high achievers was quite large, efficiency and adequacy of resource usage and distribution are worth thinking more deeply about. If we could improve or expand the identification process to provide more alignment and/or matching, ensuring that students identified as GT are in need of the services, resources might be more appropriately allocated. Again, we note this consideration with an understanding that GT identification in Arkansas may not have been designed to focus on high-achieving students on math and literacy tests.
The student- and district-level characteristics that we examined descriptively in Tables 1-3 were often correlated. Thus, in Step 2 of this study, we used logistic regression to predict the likelihood of being identified GT by fourth grade, given that the student was in the top 5% of performers on the third-grade state assessments. In other words, what student and district characteristics were related to a high-performing student being identified as GT?
Logistic Regression Estimated Coefficients of High-Achieving Third-Grade Students Being Identified as GT in Fourth Grade, Full Sample.
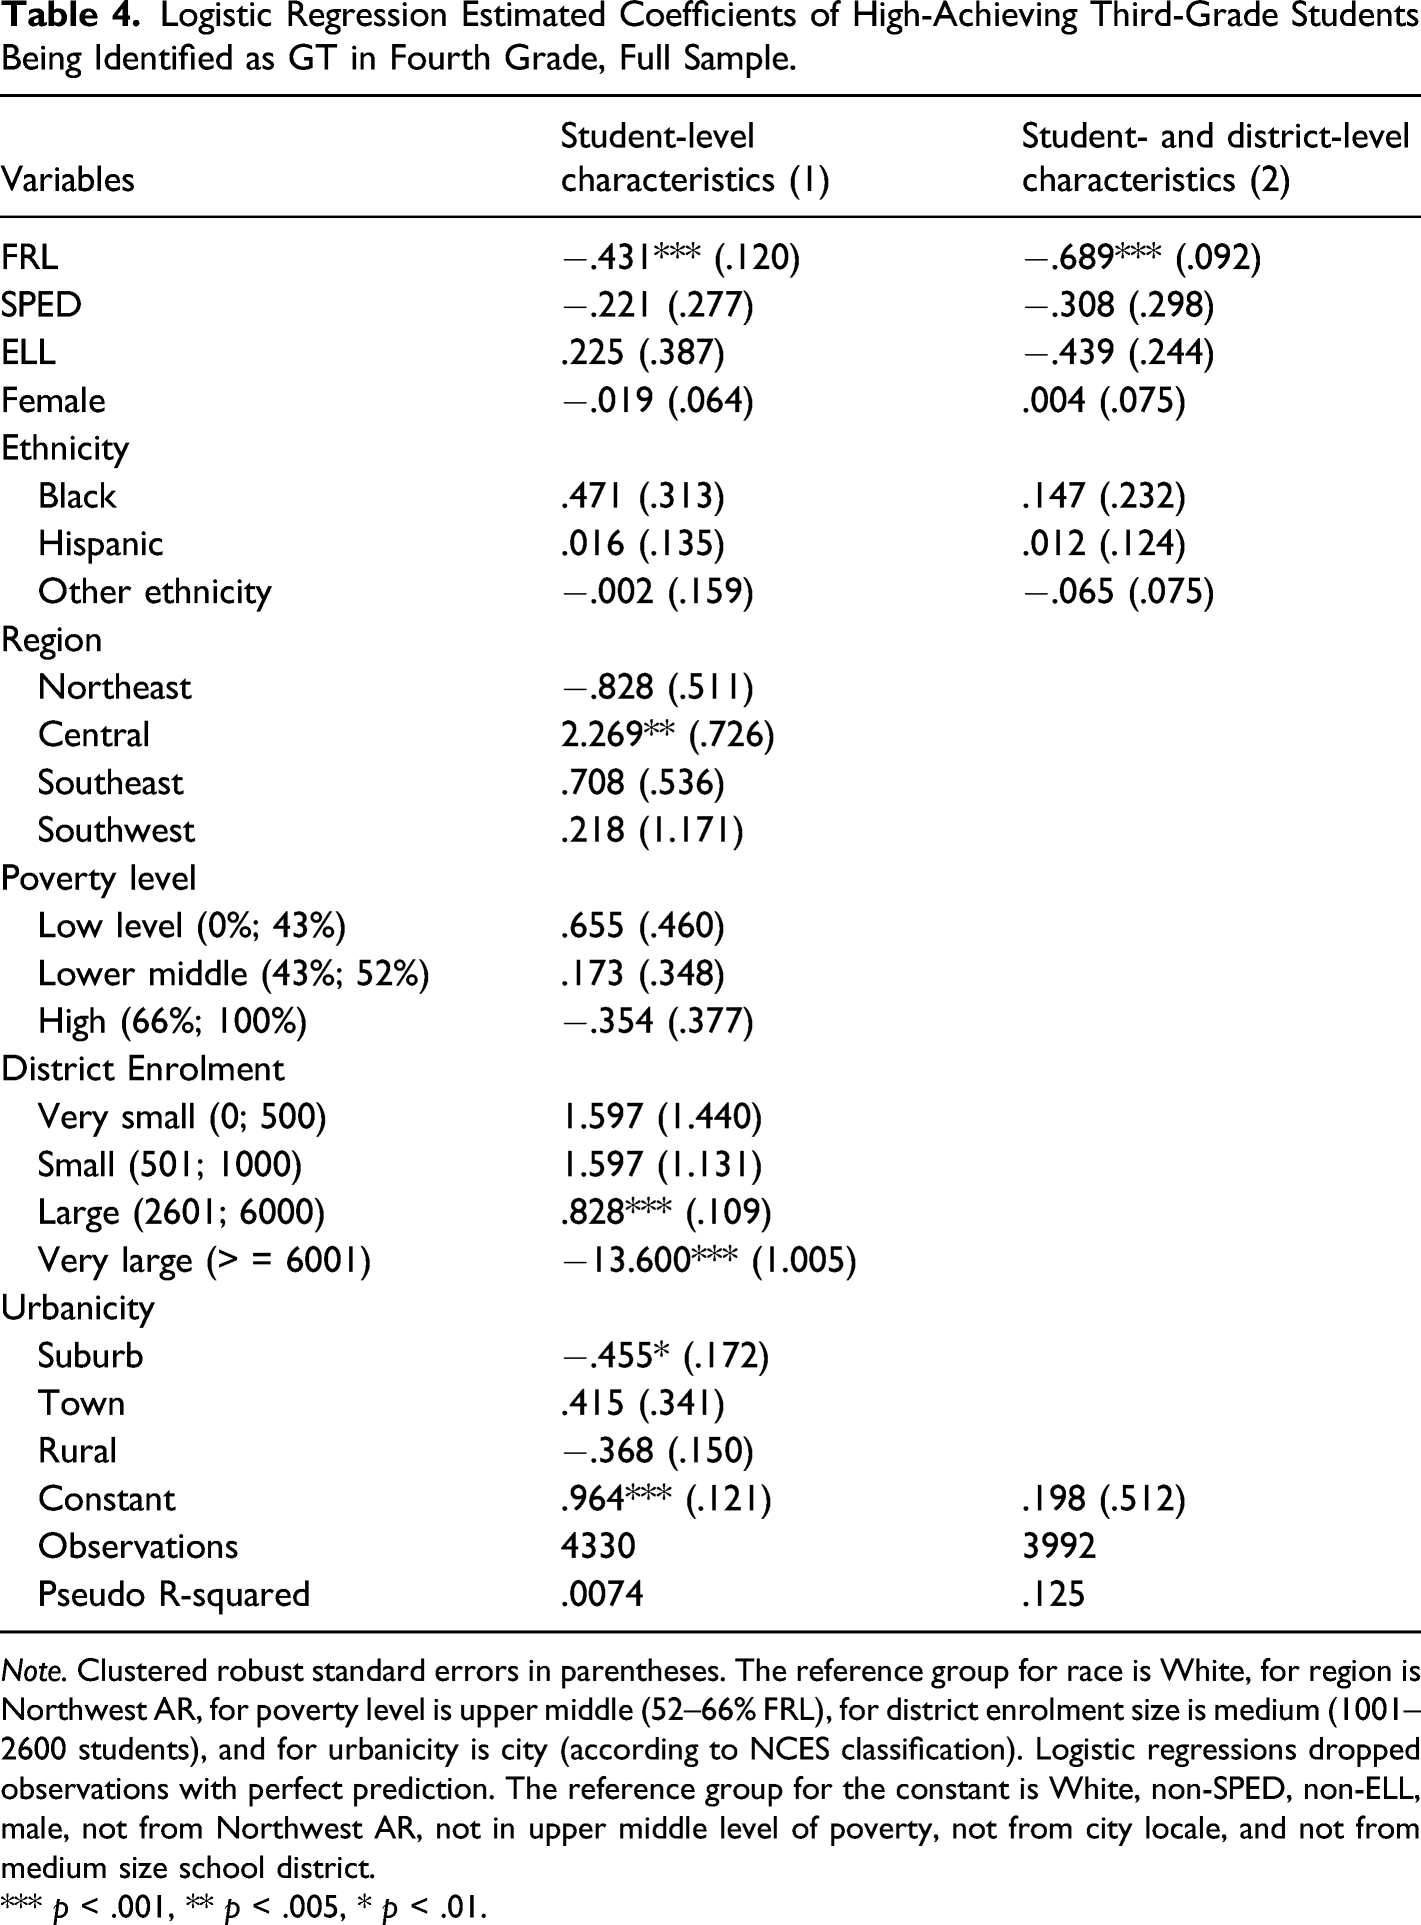
Note. Clustered robust standard errors in parentheses. The reference group for race is White, for region is Northwest AR, for poverty level is upper middle (52–66% FRL), for district enrolment size is medium (1001–2600 students), and for urbanicity is city (according to NCES classification). Logistic regressions dropped observations with perfect prediction. The reference group for the constant is White, non-SPED, non-ELL, male, not from Northwest AR, not in upper middle level of poverty, not from city locale, and not from medium size school district.
*** p < .001, ** p < .005, * p < .01.
The third column in Table 4 reports the probability of being identified as GT in fourth grade for students in the top 5% of state assessments in third grade, controlling for both student- and district-level characteristics. We found that controlling for district-level factors further reduced the likelihood that academically high-performing FRL status students were identified as GT. In particular, FRL status students in the top 5% on third-grade assessments were 50%
When examining the relationship between district size and the likelihood of identifying top 5% students as GT, we found that large school districts were more likely to identify their top 5% students as GT compared with medium-sized school districts. Holding other variables constant, large districts were twice as likely (p < .001) to identify their top 5% students as GT compared with medium size school districts. Very large school districts were also more likely to identify their top 5% as GT; however, despite being statistically significant, this number was very small (almost 0), all else equal.
There were significant differences by geographic region in the likelihood of high-achieving students (top 5%) being identified as GT. We found that, all else equal, the odds of being identified as GT for the top 5% in Central Arkansas school districts were twice the odds of the students in Northwest AR (p < .005). Urbanicity also played a significant role in the likelihood of high-achieving students being identified as GT. Compared with school districts in cities, we found that school districts in suburb areas were 37%
Discussion
The purpose of this study was to examine to what extent broadening the GT identification process as it exists in Arkansas to include academically high-achieving students might be able to expand the pool of GT identified students, and in particular, uncover more disadvantaged talented students who clearly are ready for more advanced academic challenge. Overall, we uncovered that about 30% of fourth-grade students who scored in the top 5% on both literacy and math state assessments in the third grade were not identified as GT. We also found that many currently GT identified students were not performing in the top 5% of the achievement distribution of literacy and math across the state. To be clear, we are not arguing that these relatively lower scoring students identified are not gifted. To some extent, GT is a somewhat arbitrary designation on various continuums that depend on definitions of various developed aptitudes or talents (e.g., McBee & Makel, 2019; Wai & Lakin, 2020). We are simply noting that GT identification could indeed be expanded by using math and literacy state assessments (or other similar assessments), which already serve as a universal screener to capture a broader array of talented students, especially those from low-income and other disadvantaged backgrounds, who are ready for greater academic challenge (Lohman, 2005a, 2005b). Logistic regression indicated that the odds of high-achieving students participating in the federal FRL program to be identified as GT were half of those who are not. This may be due to a lack of teacher, parent, or counselors’ likelihood of referring these students for GT assessments, or other factors such as program availability or access to testing services. Even though Arkansas is a state with mandated GT identification and services, this may not translate into an increase in the representation of economically or other disadvantaged students in the GT category. Some groups may still have greater access to educational opportunities compared with others (Peters et al., 2019). Using student achievement on the third-grade state assessment in literacy and math as a universal screening tool could help these students receive the academic services they need to develop their talents more fully.
On a positive note, we found no statistically significant differences in the likelihood of GT identification of high-achieving students by ethnicity, gender, or special program status (SPED, ELL). In other words, FRL was the only subgroup that we detected a potential misalignment in the GT identification process in Arkansas. In addition, although some student groups were less likely to be in the top 5% of achievers, all student groups were represented in the GT population. We found no consistent patterns between the likelihood of GT identification of academically high-achieving students and district characteristics.
Using universal screening in Arkansas (Card & Giuliano, 2016), in concert with local norms (Peters et al., 2021), in addition to expanding measures used in identification as proposed here, could potentially increase alignment between district identification and identifying more academically high-achieving students from economically or other disadvantaged backgrounds as GT. Utilizing universal screening and local norms would likely capture a larger pool of talent, and as a result, identify more students from diverse backgrounds.
In particular, using state assessments as a universal screener may be cost-effective and relatively low hanging fruit to leverage. Even though state assessments may not be a perfect proxy for students’ developed academic aptitude, in our study, we tried to limit the sample to only those who were highly academically gifted. Even so, we still saw a significant number of those students missing in the GT category. By simply using this approach, we may be able to serve and benefit a greater number of qualified students in the state without inflicting significant cost to other students and school district budgets.
We found that larger districts may already tend to use math and literacy type achievement assessments as an objective indicator in the existing identification procedure. We found that medium school districts (between 1001 and 2600 students) were more likely to identify their top 5% students as GT students. These big school districts may use test scores more consistently as a screening tool to identify their academically gifted students because of the high demand of GT services as well as for efficiency.
Limitations and Future Directions
We still face several limitations in our study. First, we limited our analysis to the top 5% of achievers on third-grade assessments in literacy and math. We assumed this restriction would create two comparable groups within the highest achieving students: those identified GT by fourth grade and those not identified as GT. We admit that this approach may have left out a significant portion of talented students (Gagné, 1995). However, with our purpose of examining academically gifted students, we still favor our reasonable cut of the top 5% in both math and literacy.
We controlled for a rich set of both student- and district-level observable characteristics. However, other unobservable factors may have influenced students’ GT identification, such as parental involvement, student classroom performance, or teacher quality (Hanushek et al., 2019). In addition, we did not have data to look into the identification of a broader array of student aptitudes, including, but certainly not limited to measures such as spatial reasoning (Lakin & Wai, 2020; Wai & Lakin, 2020). Perhaps most importantly, GT identification in Arkansas is a process informed by Renzulli’s (1978) model of giftedness (for a critique, see McBee & Makel, 2019). This model highlights the importance of creativity, among other factors, and may not necessarily be designed to capture academically advanced students on math and literacy assessments. For the case of Arkansas, future similar studies should include, if available, measures of creativity to address this missing piece in the current study.
Recent discussions about the effectiveness of gifted program evaluation have centered around math and literacy achievement growth as a measure of GT programming effectiveness (e.g., Redding & Grissom, 2021; Tran et al., 2021); however, expanding consideration to math and literacy in both GT identification and programing may be important in that scholars such as Lohman, 2005a, 2005b; Lakin, in press have emphasized better aligning GT identification to actual GT programming provided. Additionally, test scores as outcomes are commonly used in program evaluation and policy research; thus, using these test score outcomes would allow better alignment between gifted education and education policy research and practice.
Conclusion
Our study uncovered what we think are some reasonable ideas for improving the GT system in the state, but also broader considerations for expanding gifted identification to capture and serve more high achieving but disadvantaged students who could benefit from greater talent development through academic challenge. The current GT identification system in Arkansas could be expanded to capture a noticeable proportion of talented math and verbal achievers scoring in the top 5% of the state achievement distribution. This group of students could then be provided better aligned GT programming, educational acceleration, or educational dosage matched to their domain-specific achievements and needs (e.g., Assouline et al., 2015; Dixson et al., 2020; Wai et al., 2010). By expanding identification procedures to more universally capture students who have high developed talents in mathematical and verbal symbol systems that are important to school as currently structured (Lohman, 2005a), this is relatively low hanging fruit given that state assessments are already often universally provided and such data can be leveraged as part of the GT identification process, no matter the specific requirements of the state policy. Additionally, gifted education needs better alignment between identification procedures, programming offered based on identification (Lakin, in press), and progrm evaluation (Plucker & Callahan, 2020; Redding & Grissom, 2021; Tran et al., 2021) to demonstrate the importance of such programming to meet academic needs. We illustrate here one way to easily expand the identification process to include talented students from low-income and other disadvantaged backgrounds who are already high achieving and ready to learn something new in schools as they exist today (Stanley, 2000).
Footnotes
Declaration of Conflicting Interests
The author(s) declared no potential conflicts of interest with respect to the research, authorship, and/or publication of this article.
Funding
The author(s) received no financial support for the research, authorship, and/or publication of this article.
Appendix
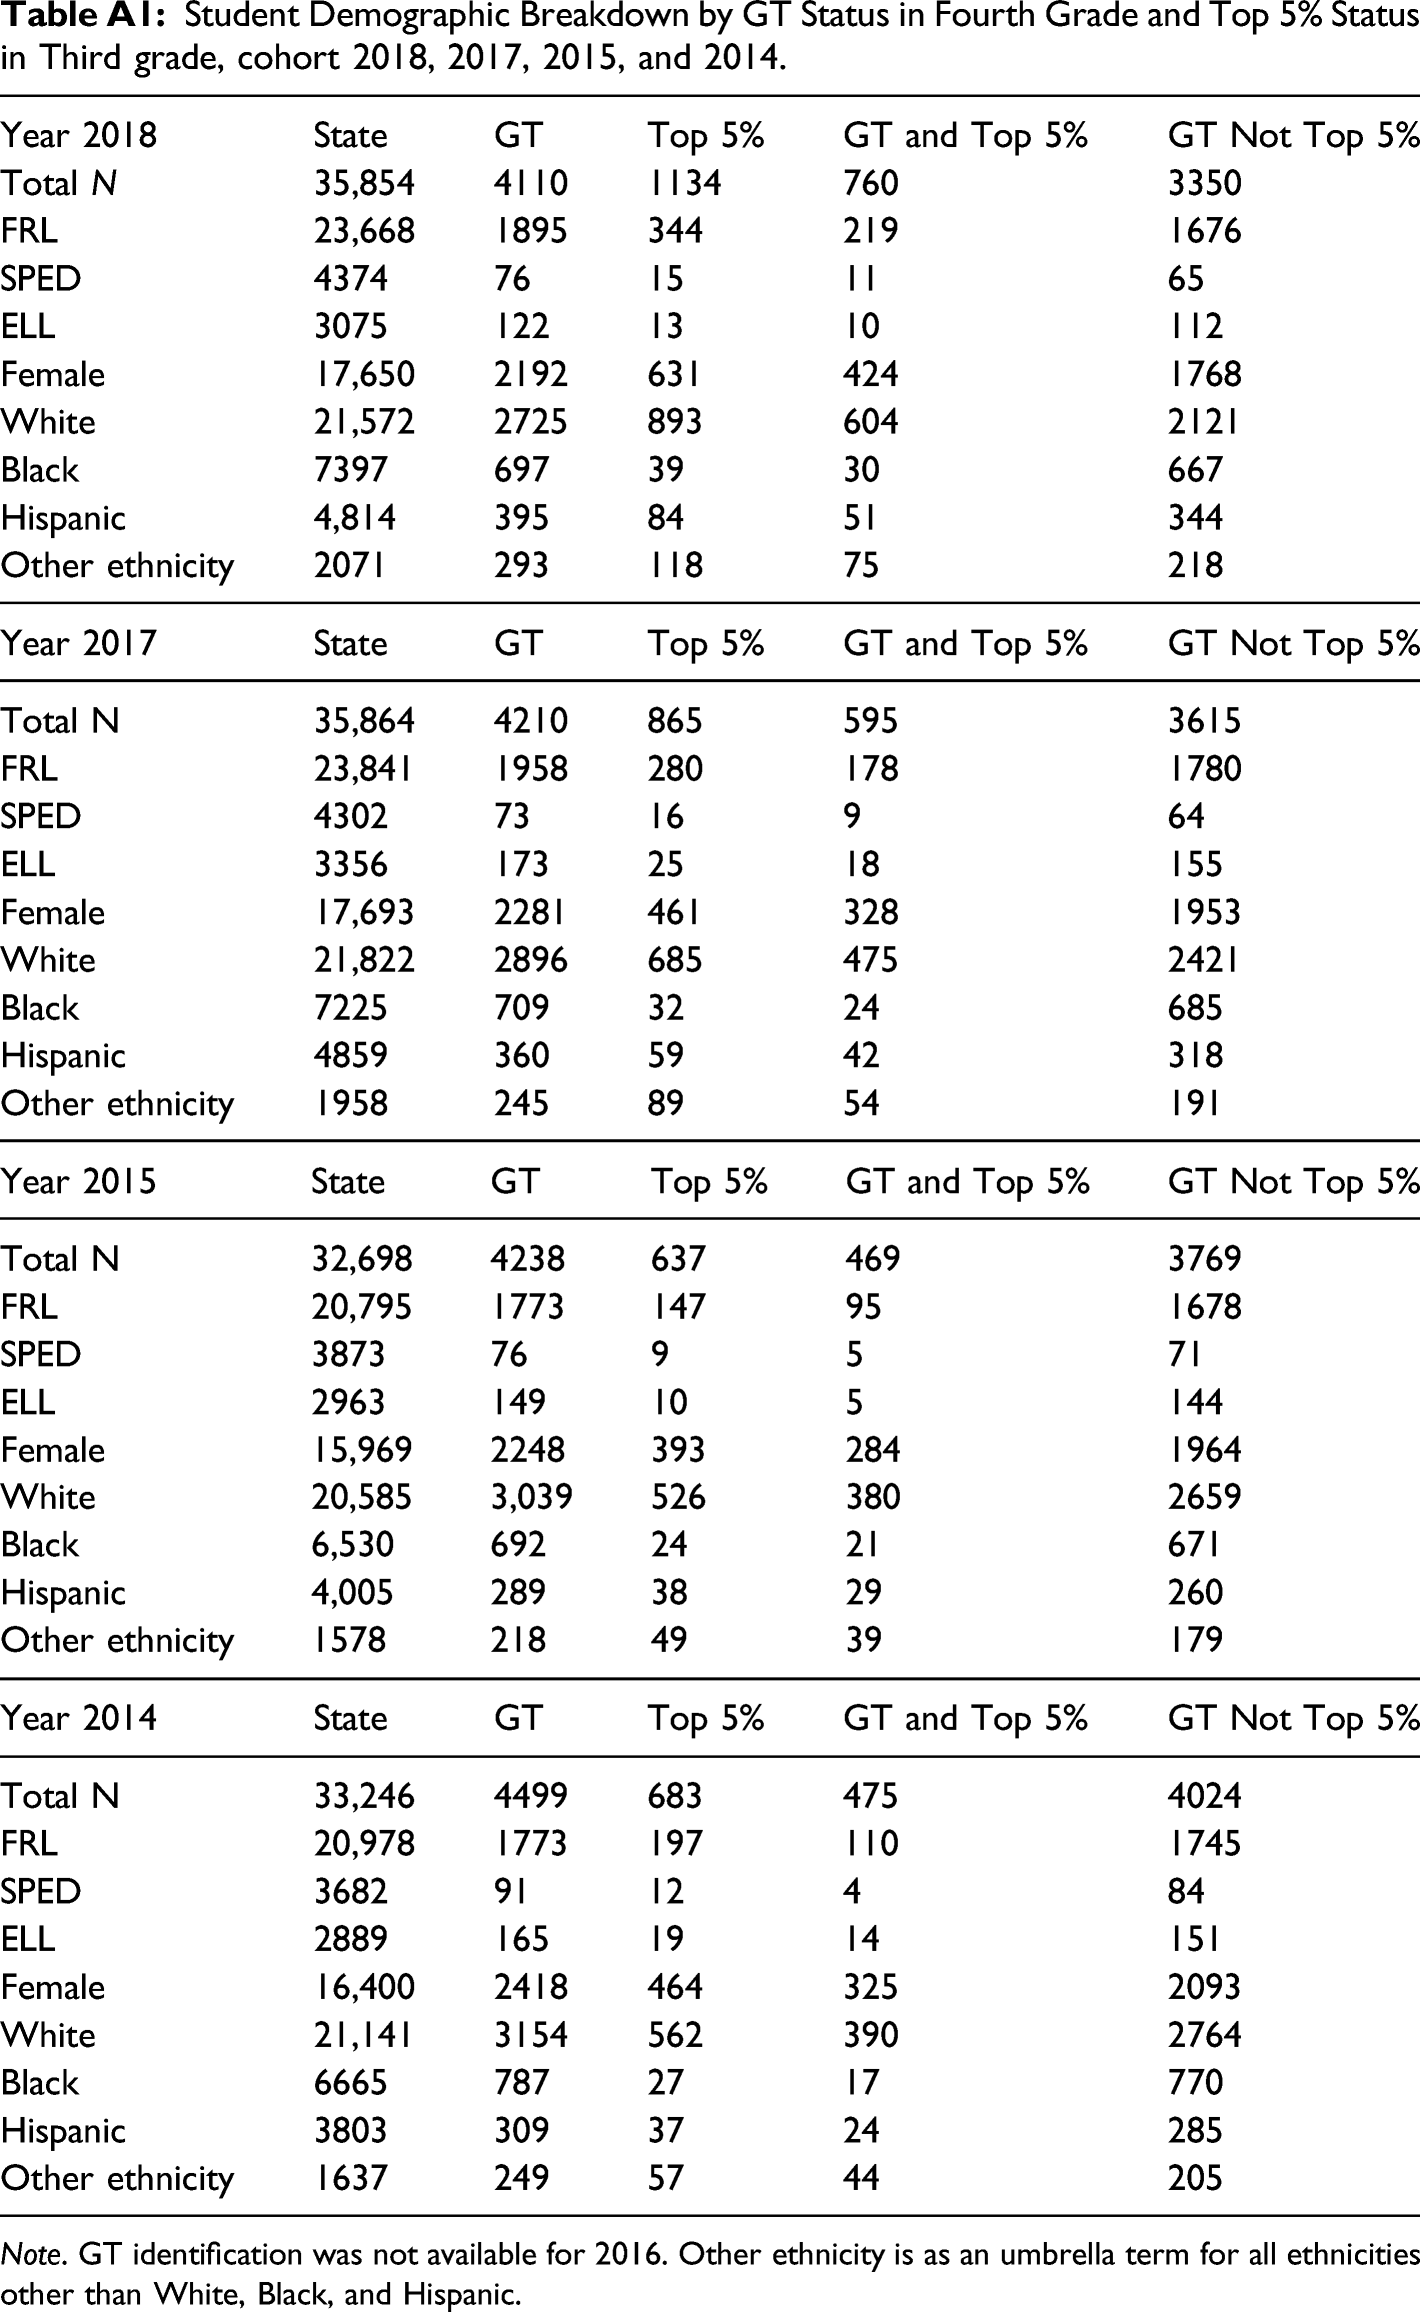
Student Demographic Breakdown by GT Status in Fourth Grade and Top 5% Status in Third grade, cohort 2018, 2017, 2015, and 2014.
| Year 2018 | State | GT | Top 5% | GT and Top 5% | GT Not Top 5% |
| Total N | 35,854 | 4110 | 1134 | 760 | 3350 |
| FRL | 23,668 | 1895 | 344 | 219 | 1676 |
| SPED | 4374 | 76 | 15 | 11 | 65 |
| ELL | 3075 | 122 | 13 | 10 | 112 |
| Female | 17,650 | 2192 | 631 | 424 | 1768 |
| White | 21,572 | 2725 | 893 | 604 | 2121 |
| Black | 7397 | 697 | 39 | 30 | 667 |
| Hispanic | 4,814 | 395 | 84 | 51 | 344 |
| Other ethnicity | 2071 | 293 | 118 | 75 | 218 |
| Year 2017 | State | GT | Top 5% | GT and Top 5% | GT Not Top 5% |
|---|---|---|---|---|---|
| Total N | 35,864 | 4210 | 865 | 595 | 3615 |
| FRL | 23,841 | 1958 | 280 | 178 | 1780 |
| SPED | 4302 | 73 | 16 | 9 | 64 |
| ELL | 3356 | 173 | 25 | 18 | 155 |
| Female | 17,693 | 2281 | 461 | 328 | 1953 |
| White | 21,822 | 2896 | 685 | 475 | 2421 |
| Black | 7225 | 709 | 32 | 24 | 685 |
| Hispanic | 4859 | 360 | 59 | 42 | 318 |
| Other ethnicity | 1958 | 245 | 89 | 54 | 191 |
| Year 2015 | State | GT | Top 5% | GT and Top 5% | GT Not Top 5% |
|---|---|---|---|---|---|
| Total N | 32,698 | 4238 | 637 | 469 | 3769 |
| FRL | 20,795 | 1773 | 147 | 95 | 1678 |
| SPED | 3873 | 76 | 9 | 5 | 71 |
| ELL | 2963 | 149 | 10 | 5 | 144 |
| Female | 15,969 | 2248 | 393 | 284 | 1964 |
| White | 20,585 | 3,039 | 526 | 380 | 2659 |
| Black | 6,530 | 692 | 24 | 21 | 671 |
| Hispanic | 4,005 | 289 | 38 | 29 | 260 |
| Other ethnicity | 1578 | 218 | 49 | 39 | 179 |
| Year 2014 | State | GT | Top 5% | GT and Top 5% | GT Not Top 5% |
|---|---|---|---|---|---|
| Total N | 33,246 | 4499 | 683 | 475 | 4024 |
| FRL | 20,978 | 1773 | 197 | 110 | 1745 |
| SPED | 3682 | 91 | 12 | 4 | 84 |
| ELL | 2889 | 165 | 19 | 14 | 151 |
| Female | 16,400 | 2418 | 464 | 325 | 2093 |
| White | 21,141 | 3154 | 562 | 390 | 2764 |
| Black | 6665 | 787 | 27 | 17 | 770 |
| Hispanic | 3803 | 309 | 37 | 24 | 285 |
| Other ethnicity | 1637 | 249 | 57 | 44 | 205 |
Note. GT identification was not available for 2016. Other ethnicity is as an umbrella term for all ethnicities other than White, Black, and Hispanic.