
Abstract
Effective professional development strategies are needed to enable special educators to provide evidence-based instruction and support to students with severe disabilities. In this single-case design study, we measured the efficacy of video modeling and brief coaching to enable three elementary special education teachers to implement constant time delay and the impact of their implementation on student progress toward individualized goals. After receiving professional development, all three teachers implemented constant time delay with fidelity and promoted student progress on individualized goals. Teachers were able to identify and correct some of their own implementation errors by revisiting video models after attempting implementation. Teachers reported positive perceptions of the professional development model. We provide recommendations for how video modeling and brief coaching can be used in tandem to promote effective implementation of evidence-based practices.
Students with severe disabilities require intensive and effective intervention practices in order to make optimal progress on critical educational goals (Spooner, Knight, Browder, & Smith, 2012). Researchers have identified a number of practices that are highly effective in improving outcomes for this population. For example, teachers can improve academic outcomes with systematic instructional strategies such as constant time delay (Spooner et al., 2012), or reduce problem behaviors with function-based interventions such as functional communication training or differential reinforcement (Wong et al., 2015). These examples are only a subset of the growing repertoire of evidence-based practices that teachers might use to improve outcomes for students with severe disabilities.
Unfortunately, many special educators do not have a clear understanding of which practices are evidence based or the ability to implement these practices effectively. Descriptive studies show that many teachers are not familiar with the concept of evidence-based practice (Stahmer, Collings, & Palinkas, 2005) and report implementing unproven educational practices just as often as those with a strong evidence base (Burns & Ysseldyke, 2009). Furthermore, baseline data from experimental studies show that without focused professional development (PD), many special educators struggle to implement systematic instructional strategies (e.g., Brock & Carter, 2015) or function-based behavior reduction strategies (e.g., Bethune & Wood, 2013). Indeed, the gap between research and practice is substantial, and it poses a major threat to a special educator’s ability to promote improved outcomes for students with severe disabilities.
PD, or the provision of any activity or material designed to promote or improve implementation of an educational practice (Brock et al., 2017; Brock & Carter, 2017), can help to close this research-to-practice gap. Meta-analyses of the teacher PD literature point to potential solutions. Specifically, a combination of two individual components of PD has been shown to be particularly effective in promoting teacher implementation fidelity of evidence-based practices: modeling and coaching with performance feedback (Brock & Carter, 2017; Brock et al., 2017). Modeling involves demonstrating for a teacher how to implement a given practice, and coaching with feedback involves highlighting positive aspects of implementation and pointing out opportunities for improvement. These practices work together by clearly communicating how to implement a practice through modeling and then helping teachers further improve implementation through coaching.
There are opportunities to improve the efficacy and feasibility of coaching by leveraging technology to deliver modeling and feedback. Examples include using Content Acquisition Podcasts (CAPs) that include vignettes illustrating implementation of a practice (Driver, Pullen, Kennedy, Williams, & Ely, 2014), using video models to demonstrate implementation steps associated with a practice (Catania, Almeida, Liu-Constant, & Digennaro-Reed, 2009), providing feedback to teachers based on video recordings of their teaching (Suhrheinrich & Chan, 2017), showing teachers video recordings of themselves demonstrating desired teaching behaviors (i.e., self-video modeling; Hawkins & Heflin, 2011), and using videoconferencing technology to remotely observe teaching and provide feedback (Heitzman-Powell, Buzhardt, Rusinko, & Miller, 2014). Collectively, these technological innovations provide a number of potential advantages over traditional delivery of in-person modeling and coaching. First, instead of teachers only having one opportunity to see how to implement a given practice, CAPs and video models can be hosted online where they can be accessed at any time (Driver et al., 2014). Furthermore, re-accessing these resources might enable teachers who are already attempting implementation to assess the degree to which their implementation matches the exemplar and self-correct their own errors. Second, observing teachers through video recordings or remote video conferencing provides flexibility for both the teacher and coach who is providing PD (Israel, Knowlton, Griswold, & Rowland, 2009). Instead of having to schedule a lesson at a particular time that the coach is available to visit the classroom, the coach can view the lesson live from a remove location, or later by viewing a video tape. Providing feedback to a teacher through videoconferencing technology may enable the coach to provide more immediate feedback in situations that in-person feedback would be delayed and less likely to be effective (Scheeler, Ruhl, & Mcafee, 2004). Third, all of these technology-based approaches are inexpensive and leverage equipment that is increasingly ubiquitous—a computer, tablet, or smartphone with a webcam and an Internet connection (Catania et al., 2009).
In the present study, we investigate one of these technological innovations: web-based video modeling. We are focusing on video modeling in which a teacher views someone else demonstrating implementation with a student (or a confederate playing the role of the student). This is distinct from self-video modeling, in which a teacher views examples of herself demonstrating correct implementation of a strategy (e.g., Hawkins & Heflin, 2011). Despite the potential advantages of video modeling, the effects of this practice as a teacher PD tool are not well understood. In a feasibility study, Dieker et al. (2009) developed and piloted video models of evidence-based practices to target reading, math, and science for students with disabilities. They demonstrated that it is feasible to both create and deliver video models. They collected promising outcome data, and teachers delivered positive feedback. These findings suggest that video modeling may hold promise, but rigorous experimental studies are needed to determine whether video modeling is effective in improving teacher implementation of evidence-based practices.
We identified only three experimental studies in which researchers featured video modeling as a primary PD strategy. In one study, Singer, Sowers, and Irvin (1986) used a combination of video modeling and a computer program to enable a paraprofessional to collect intervention data, and to prompt and reinforce requests and social initiations of an elementary student who was deaf-blind and had intellectual disability. Using a multiple baseline across behaviors design, they demonstrated a functional relation between their PD and the rate that the paraprofessional implemented the targeted strategies. In a second study, Catania et al. (2009) used video modeling to teach three direct care staff at a private school to implement discrete trial training with students with autism spectrum disorder (ASD). Using a multiple baseline across participants design, they demonstrated a functional relation between video modeling and staff implementation of discrete trial training with confederates (i.e., adults without disabilities who played the role of a student with ASD); they collected one probe in each phase to gauge implementation with a student with ASD. In a third study, Slider, Noell, and Williams (2006) used a combination of video modeling and print materials to teach speech therapists to correctly implement time-out procedures; deliver contingent, specific, and sincere praise; and provide clear instructions with modeling and feedback with preschool children with speech delays. They conducted three multiple baseline experiments across three speech therapists—one experiment for each targeted behavior.
Collectively, these three studies suggest video modeling might be an effective PD tool, but their limitations leave critical questions unanswered. First, no student outcomes were measured, making it impossible to determine whether changes in teacher behavior promoted meaningful student progress. Second, although all of these studies involved school staff, none involved special education teachers—the professionals who are ultimately responsible for most instructional goals for students with severe disabilities. Third, implementation with students with severe disabilities in the classroom was limited. In two studies (i.e., Catania et al., 2009; Slider et al., 2006), some observations involved implementation with confederates; across all three studies, only four students with severe disabilities received an intervention. Fourth, not all of the practices taught to staff in these studies meet the Council for Exceptional Children’s (CEC) definition of an evidence-based practice (Cook et al., 2015).
Because of these limitations in the research literature, it is currently unclear whether a combination of video modeling and coaching would be an effective means to enable special educators to implement evidence-based practices and improve outcomes for students with severe disabilities. An experimental study is needed that involves special education teachers implementing evidence-based practices with students who have severe disabilities, and measures both teacher implementation fidelity and student outcomes. Therefore, we designed a study that would address these limitations. We focused our PD on constant time delay because it is a versatile strategy with an extensive evidence base for teaching academic skills to students with severe disabilities (Spooner et al., 2012). Specifically, we addressed the following research questions:
Method
Teachers and Students With Severe Disabilities
After receiving institutional review board and district approval, we recruited three dyads of special education teachers and their students with severe disabilities to participate in this study. Teachers were offered a $200 gift card incentive to participate. To be included, teachers must have (a) provided daily instruction to a student with a severe disability (i.e., student qualified for alternate assessment), (b) reported that they were struggling to deliver instruction that improved student performance on one or more Individualized Education Program (IEP) goals, and (c) expressed willingness to implement an evidence-based practice to target one of the student’s goals. All selected IEP goals were aligned with the general education curriculum.
Tiffany and Jonathan
Tiffany was a White special education teacher in her mid-20s with a bachelor’s degree. She had been teaching for 3 years, and Jonathan had been in her class for the past 2 years. Jonathan was a White 10-year-old fourth-grade student with intellectual disability who communicated with verbal language. He had an IQ score of 70 and received both occupational therapy and speech therapy. Tiffany reported that she had been targeting the same 40 sight words from the Dolch pre-primer word list for the past 2 years, but had made very little progress. In addition to this focus on sight words, Jonathan received phonics instruction in a general education classroom, and Tiffany intentionally chose texts for him to read that included both the sight words he was learning and decodable words.
Sarah and Evan
Sarah was a White special education teacher in her mid-30s with a master’s degree. She had been teaching for 13 years, and Evan had been in her class for the past 2 years. Evan was a White 11-year-old fifth grade student with ASD who communicated with a combination of vocalizations (e.g., beginning sounds of words), gestures (e.g., pointing, leading), and use of a dynamic high-tech alternative/augmentative communication (AAC) device. Evan did not have an IQ score on file. Sarah reported she had been targeting counting money with Evan for the past 2 years. Although he mastered counting coins in isolation, she was struggling to teach him to count combinations of different coins.
Carrie and Alice
Carrie was a White special education teacher in her mid-30s with a bachelor’s degree. She had been teaching for 9 years, and Alice had been in her class for the past 3 years. Alice was a White 7-year-old with multiple disabilities. She had medical diagnoses of cerebral palsy (i.e., spastic quadriplegia) and epilepsy. Alice walked with a walker or with adult support or was pushed in a wheelchair when she was fatigued. She did not have an IQ score on file. Alice communicated through gestures (e.g., waving, hugs, shaking head), approximations of some sign language (e.g., all done), and the use of a static AAC device with a 45-location grid with a guard. Carrie reported that she had been working with Alice on counting objects up to five for the past 3 years, but that Alice had not demonstrated any progress with this skill. In addition to the direct instruction described in the method section, Carrie planned other opportunities for Alice to practice numeracy in other contexts (e.g., playing a game with peers that required rolling dice and moving a certain number of spaces).
Schools and Instructional Settings
Carrie and Sarah taught in two different elementary schools (Grades K–5) in the same school district that served rural and suburban communities. One school served more than 500 students, approximately 85% of whom were White and about one fifth received free or reduced-price meals. The second school served nearly 600 students, approximately 65% of whom were White and about one sixth received free or reduced-priced meals. The third participant (Tiffany) taught in a small rural district. She taught at an intermediate school (Grades 3–5) that served about 400 students. Over 95% of the students at this school were White, and about two thirds received free or reduced-price meals. All schools were located in the Midwest region of the United States. All three teachers delivered instruction to students in a one-to-one format in self-contained special education classrooms.
Experimental Design and Procedures
We used a multiple-probe-across-participants design, which involves repeated intermittent measurement of the dependent variable and staggered introduction of the independent variable across participants (Gast & Ledford, 2014). We designed our study to meet the CEC design standards for single-case design research (Cook et al., 2015).
Pre-baseline procedures
We scheduled an initial meeting with each teacher to review important information about each student and his or her instructional goal. In addition, the first and/or second author observed the teacher providing instruction for approximately 15 min and took detailed notes about the teacher’s instructional approach. We used the information from the teacher interview and observation to confirm that constant time delay would be a good match for the goal and the student and that the teacher was not already implementing constant time delay with fidelity.
Baseline procedures
Teachers delivered instruction to students with severe disabilities in the same way that they had prior to the study. We did not provide any support or direction to teachers. The degree to which teachers were already implementing constant time delay during the baseline condition is described in the results section.
Video modeling and implementation checklists
Video modeling and implementation checklists were introduced for the first participant after we observed five stable data points of teacher implementation fidelity. Video modeling and implementation checklists were introduced for each subsequent participant after we observed five stable data points for that teacher and a clear therapeutic trend with the previous teacher.
We gave each participant a folder that included directions for accessing the video model, an implementation checklist, and any materials needed for implementation that the teacher was not already using. All folders included a first page with a web address where the teacher could access an individualized video model from a free video-sharing website. In addition to the web address, this page included three bullet points that instructed the teacher to (a) watch the video and review the handouts in the folder, (b) return later to the video again as many times as she wished, and (c) begin to attempt implementation. All folders included a one-page implementation checklist for constant time delay. Checklists were aligned with measurement of teacher implementation fidelity (see measurement section below) and the steps portrayed in the video model. For two participants, the folder included additional materials required for implementation. Tiffany was not collecting data on her student’s performance during the baseline condition. Therefore, we provided Tiffany with a datasheet to track the number of independent correct student responses for each instructional session so that she could make data-based decisions regarding when to introduce new instructional targets. Carrie’s instructional plan included use of numbers with visual prompts (i.e., touch points) that would be gradually faded over time. Therefore, Carrie’s folder included the same numbers with visual prompts that were portrayed in the video model. We provided her with a blank version of the planning sheet portrayed in the video. When we provided the folder to a teacher, we (a) reviewed the first page with the web address and instructions, (b) confirmed the teacher could access the video from a school computer, and (c) explained that we wanted to initially observe the impact of the video model alone, and therefore we would not discuss or answer any questions about implementation during this condition.
Video models were created by the first and second authors using the default video recording software (i.e., Windows Movie Maker) on a laptop computer equipped with a web camera. Each video model portrayed the authors demonstrating how to implement each step of the evidence-based practice in a role-play situation with the first author pretending to be the teacher providing instruction on the specific goal, and the second author pretending to be the student with a severe disability. We chose to video record ourselves instead of real teachers and students in order to save time and cost. Furthermore, there is no clear empirical evidence that having an authentic teacher or student improves the efficacy of video modeling. Each video model included (a) an overview of constant time delay, (b) a rationale why constant time delay would likely be effective for promoting student progress, and (c) a model of each implementation step. Instructional programs that incorporated constant time delay are described below. Specific implementation steps are described in more detail in the measurement section.
We spent approximately 30 min planning and recording each video model. Before recording, we talked through how we would role-play implementation, including planning how the student would insert correct responses, incorrect responses, and or a lack of a response. We edited the videos only by clipping any extraneous footage before the beginning or after the end of the video model. Although we watched the footage afterward to make sure that the information and models we provided were accurate, no further editing was required. On average, videos were 10-min long. All videos were posted to a free video-sharing website.
Individualized intervention plans
Tiffany targeted Jonathan’s IEP goal of reading the first 40 words from the Dolch pre-primer sight word list. We designed an intervention plan in which Tiffany would use constant time delay to target this skill. In this plan, Tiffany would (a) pick five words the student missed on the previous day’s probe, (b) provide five trials with a 0-s delay for each word, (c) provide three trials with a 4-s delay for each word, (d) and repeat the sequence until the student had zero errors or time allotted for instruction had expired. Materials included flash cards with all 40 sight words, which Tiffany already had in her classroom prior to the study.
Sarah targeted Evan’s IEP goal of counting combinations of dimes and pennies up to one dollar. We focused specifically on combinations of up to 9 dimes and up to 9 pennies. We designed an intervention plan in which Sarah would use a 0-s delay with full physical prompts and then a 4-s delay to target this skill. In this plan, Sarah would (a) implement three trials with a 0-s delay with random combinations of dimes and pennies, (b) implement two trials with a 4-s delay, and (c) repeat this sequence of trials until the student had zero errors or the time allotted for instruction expired. We planned for Sarah to fade all 0-s delay trials when Evan had zero errors for an entire session, but to return to the 0-s delay if errors increased. Materials included 9 dimes and 9 pennies, which Sarah already had in her classroom prior to the study.
Carrie targeted Alice’s IEP goal of counting manipulatives up to five. Specifically, we focused on teaching Alice to demonstrate a conceptual understanding of numerals and cardinality by using manipulatives to create representations of written numerals. Because Alice did not use verbal language, Carrie specified in the goal that Alice would be directed to count a certain number of objects from a pool of objects (i.e., “show me 4 bears”) by moving the correct number of objects into a designated location away from the other objects. We designed an intervention plan in which Carrie would use constant time delay with full physical prompts to target the skill. In addition, she would use a stimulus prompt (i.e., a large numeral with touch points that matched the numeral). Alice would be prompted to place the manipulatives directly on the touch points, and the touch points would be faded over time. Carrie would start with large numerals (i.e., 1–5) with large touch points. She would focus first on the number one. In this plan, Carrie would (a) implement five trials with a 0-s delay, (b) implement five trials with a 4-s delay, and then repeat the sequence until the student had zero errors or time allotted for instruction had expired. Carrie would transition to the next numeral after Alice provided three independent correct responses during constant time delay trials on the previous number. When Alice met this criterion with all five numbers, Carrie would fade to smaller touch points. When Alice met this criterion with smaller touch points, the touch points would be faded entirely so that the student was simply placing the objects on a numeral with no touch points.
Brief coaching
The second component of the PD, brief coaching, was delivered after we had sufficient data to gauge the effects of the video modeling and checklist (i.e., a minimum of five data points) and student data demonstrated the potential for improved implementation (i.e., two consecutive sessions with no progress). All participants met this criteria at some point in the study, at which point we delivered brief coaching. Coaching was delivered by the first author, a University faculty member in special education. Brief coaching occurred in the classroom immediately after each observation, lasted 5 min or less, and focused on how to improve implementation fidelity, and how to adapt their instruction based on student behavior. Coaching on implementation fidelity involved (a) reviewing implementation data collected at the most recent observation, (b) highlighting steps that were followed with fidelity, and (c) providing constructive feedback for how to correct steps that were not followed with fidelity. Coaching on adapting student instruction involved (a) reviewing teacher-collected data on student performance and (b) if student performance was not optimal, providing specific suggestions for how to make instruction more reinforcing for students.
While the format of coaching sessions was identical across teachers, the content of feedback differed based on teacher and student performance. Below, we report the nature of the specific feedback delivered to each teacher so the reader can better understand how specific types of feedback impacted teacher implementation and student instruction. For Tiffany, coaching focused on directing her to provide specific praise that included stating the word the student just got correct. In addition, we directed her to improve the quality of her verbal praise by diversifying the topography her praise statements (e.g., “great job!”, “awesome”, “way to go!”), and by improving the quality of delivery by smiling, raising the pitch of her voice, and increasing her volume.
Sarah had no implementation errors, but we directed her to modify reinforcement contingencies because Evan’s behavior seemed to have the function of avoiding or escaping the task (e.g., pushing materials away, not providing a response after a task direction, quickly providing an incorrect response). This involved only reinforcing independent correct responses (instead of both independent and prompted correct responses), and terminating the session after 10 correct responses.
Carrie had no implementation errors, but we directed her to make one adaption. Because Alice would try to escape from the task as instruction progressed (i.e., scooting away from the instructional area), we directed Carrie to set an attainable criterion of independent correct responses for the session, clearly communicate the criterion to Alice, and terminate the session immediately after Alice achieved the criterion.
Procedural fidelity of PD
Through a web-based tracking tool, we measured the number of times each teacher accessed the video models. Tiffany accessed her video model 4 times (once before the first session, and 3 times between the first and second session), Sarah 2 times (once before the first session, and again between the first and second sessions), and Carrie 6 times (four before the first session, once between the first and second sessions, and once again). We used a coaching checklist to ensure that all coaching visit included all steps described in above in the coaching protocol.
Dependent Measures and Recording
We measured both teacher implementation fidelity (primary dependent variable) and individualized student outcomes (secondary dependent variable).
Teacher implementation fidelity
We observed teachers providing instruction on the selected IEP goals and coded the degree to which they implemented constant time delay with fidelity. The implementation steps in this protocol are based on implementation checklists developed by the National Professional Development Center on ASD and reflect the implementation steps reported in experimental studies that make up the evidence base for time delay (Neitzel & Wolery, 2009). We have demonstrated in prior studies that this observation protocol is both valid and reliable (e.g., Brock & Carter, 2015; Brock, Seaman, & Downing, 2017).
We began data collection for a trial after the teacher presented a stimulus or task direction and coded up to five trials for a 0-s delay and five trials for a 4-s delay. For the 0-s delay, we scored the following implementation steps: (a) provide the controlling prompt within 1 s of presenting the stimulus or task direction, (b) pause until the student provides a response or 2–5 s elapse with no response, (c) respond to a correct learner response with verbal praise and stating specifically what the student did correctly, or (d) respond to an incorrect response by restarting the trial by redelivering the stimulus or task direction. For the 4-s delay, implementation steps after provision of a stimulus or task direction included that one (a) pause until the student provides a response or 3- to 5-s elapse with no response, (b) respond to a correct learner response with verbal praise and stating specifically what the student did correctly, or (c) respond to an incorrect response by inserting a 0-s delay trial. For Tiffany, who taught a discrete skill, each step was scored for every discrete instructional target (i.e., every sight word). Because Sarah and Carrie taught chained skills (counting coins and counting objects), we coded correct delivery of prompts, response interval, and error correction for every step; we coded reinforcement with specific praise for only the final step in the chain. We stopped coding a trial when a teacher made an error; the number of possible steps for the trial included only the missed step and preceding steps. A percentage was calculated of the total steps implemented correctly divided by the total number of opportunities to correctly implement steps. Observations lasted 15–20 min.
Individualized student outcomes
Individualized measures of student progress were developed to measure progress toward mastery of IEP goals. We measured Jonathan’s progress by probing him on flash cards of the 40 targeted sight words at the end of each instructional session. Flash cards were shuffled prior to each probe. We measured Evan’s progress by probing him on 10 combinations of pennies and dimes that summed to random values between 11 and 99, but excluded multiples of 10 (so that a combination of dimes and pennies would be required). We generated random sums using a computer-based random number generator. We measured Alice’s progress by asking her to count each of the targeted numbers (1–5) from a pool of seven objects. We presented the numbers in random order.
Observer Training and Reliability
Observers included one university faculty member and two graduate students studying special education. In one 1-hr training session, the first author reviewed the training manual and shared verbal and written examples and nonexamples of all codes. Before collecting data, observers achieved 100% accuracy on a written test of coding definitions, and at least 90% agreement with the first author on all variables in live settings. A second observer collected data on 28.1% of all observations balanced across participants and conditions. Agreement was calculated by dividing the number of intervals the primary and secondary observer codes matched by the total number of intervals (Gast & Ledford, 2014). Average agreement was 97.9% (SD = 6.7%) across all variables, 96.9% (SD = 8.8%) across only implementation fidelity variables, and 99.5% (SD = 1.7%) across only individualized student outcome variables.
Social Validity
After the study was over, participants completed a written social validity survey to gauge their perceptions of the PD and student intervention strategy. This survey included six questions that were scored on a Likert-type scale (listed in Table 1), and six open-ended questions that invited narrative responses (reported alongside teacher responses in the Results section).
Quantitative Social Validity Questions and Teacher Responses.
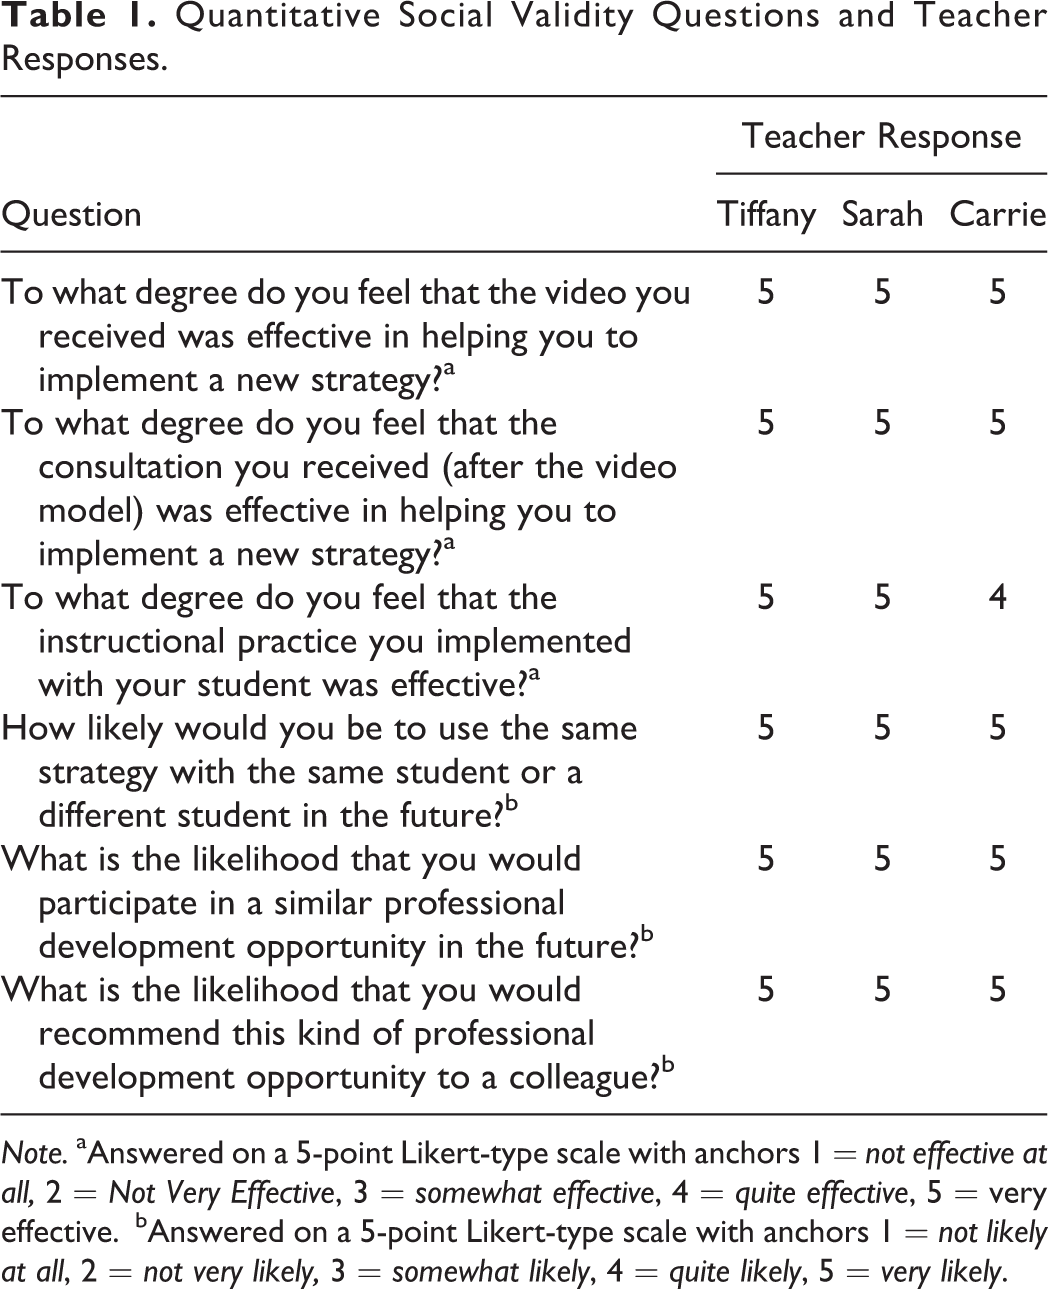
Note. aAnswered on a 5-point Likert-type scale with anchors 1 = not effective at all, 2 = Not Very Effective, 3 = somewhat effective, 4 = quite effective, 5 = very effective.
bAnswered on a 5-point Likert-type scale with anchors 1 = not likely at all, 2 = not very likely, 3 = somewhat likely, 4 = quite likely, 5 = very likely.
Results
Teacher Implementation of Constant Time Delay
Introduction of video modeling and an implementation checklist coincided with an immediate and substantial increase in implementation fidelity for all three teachers. Therefore, a functional relation was demonstrated between the combination of video modeling and an implementation checklist on implementation fidelity. Two teachers achieved 100% implementation fidelity with video modeling and checklist alone; one required brief coaching in order to achieve this criterion. Performance in all conditions is reported in Figure 1. We calculated a d-Hedges-Pustejovsky-Shadish (DHPS) effect size (Hedges, Pustejovsky, & Shadish, 2013), which was 8.67 (variance = 3.83) for the effects of video modeling on teacher implementation fidelity. Below, we describe visual analysis for each participant’s data in terms of level, trend, variability, and immediacy of effect (Gast & Ledford, 2014).
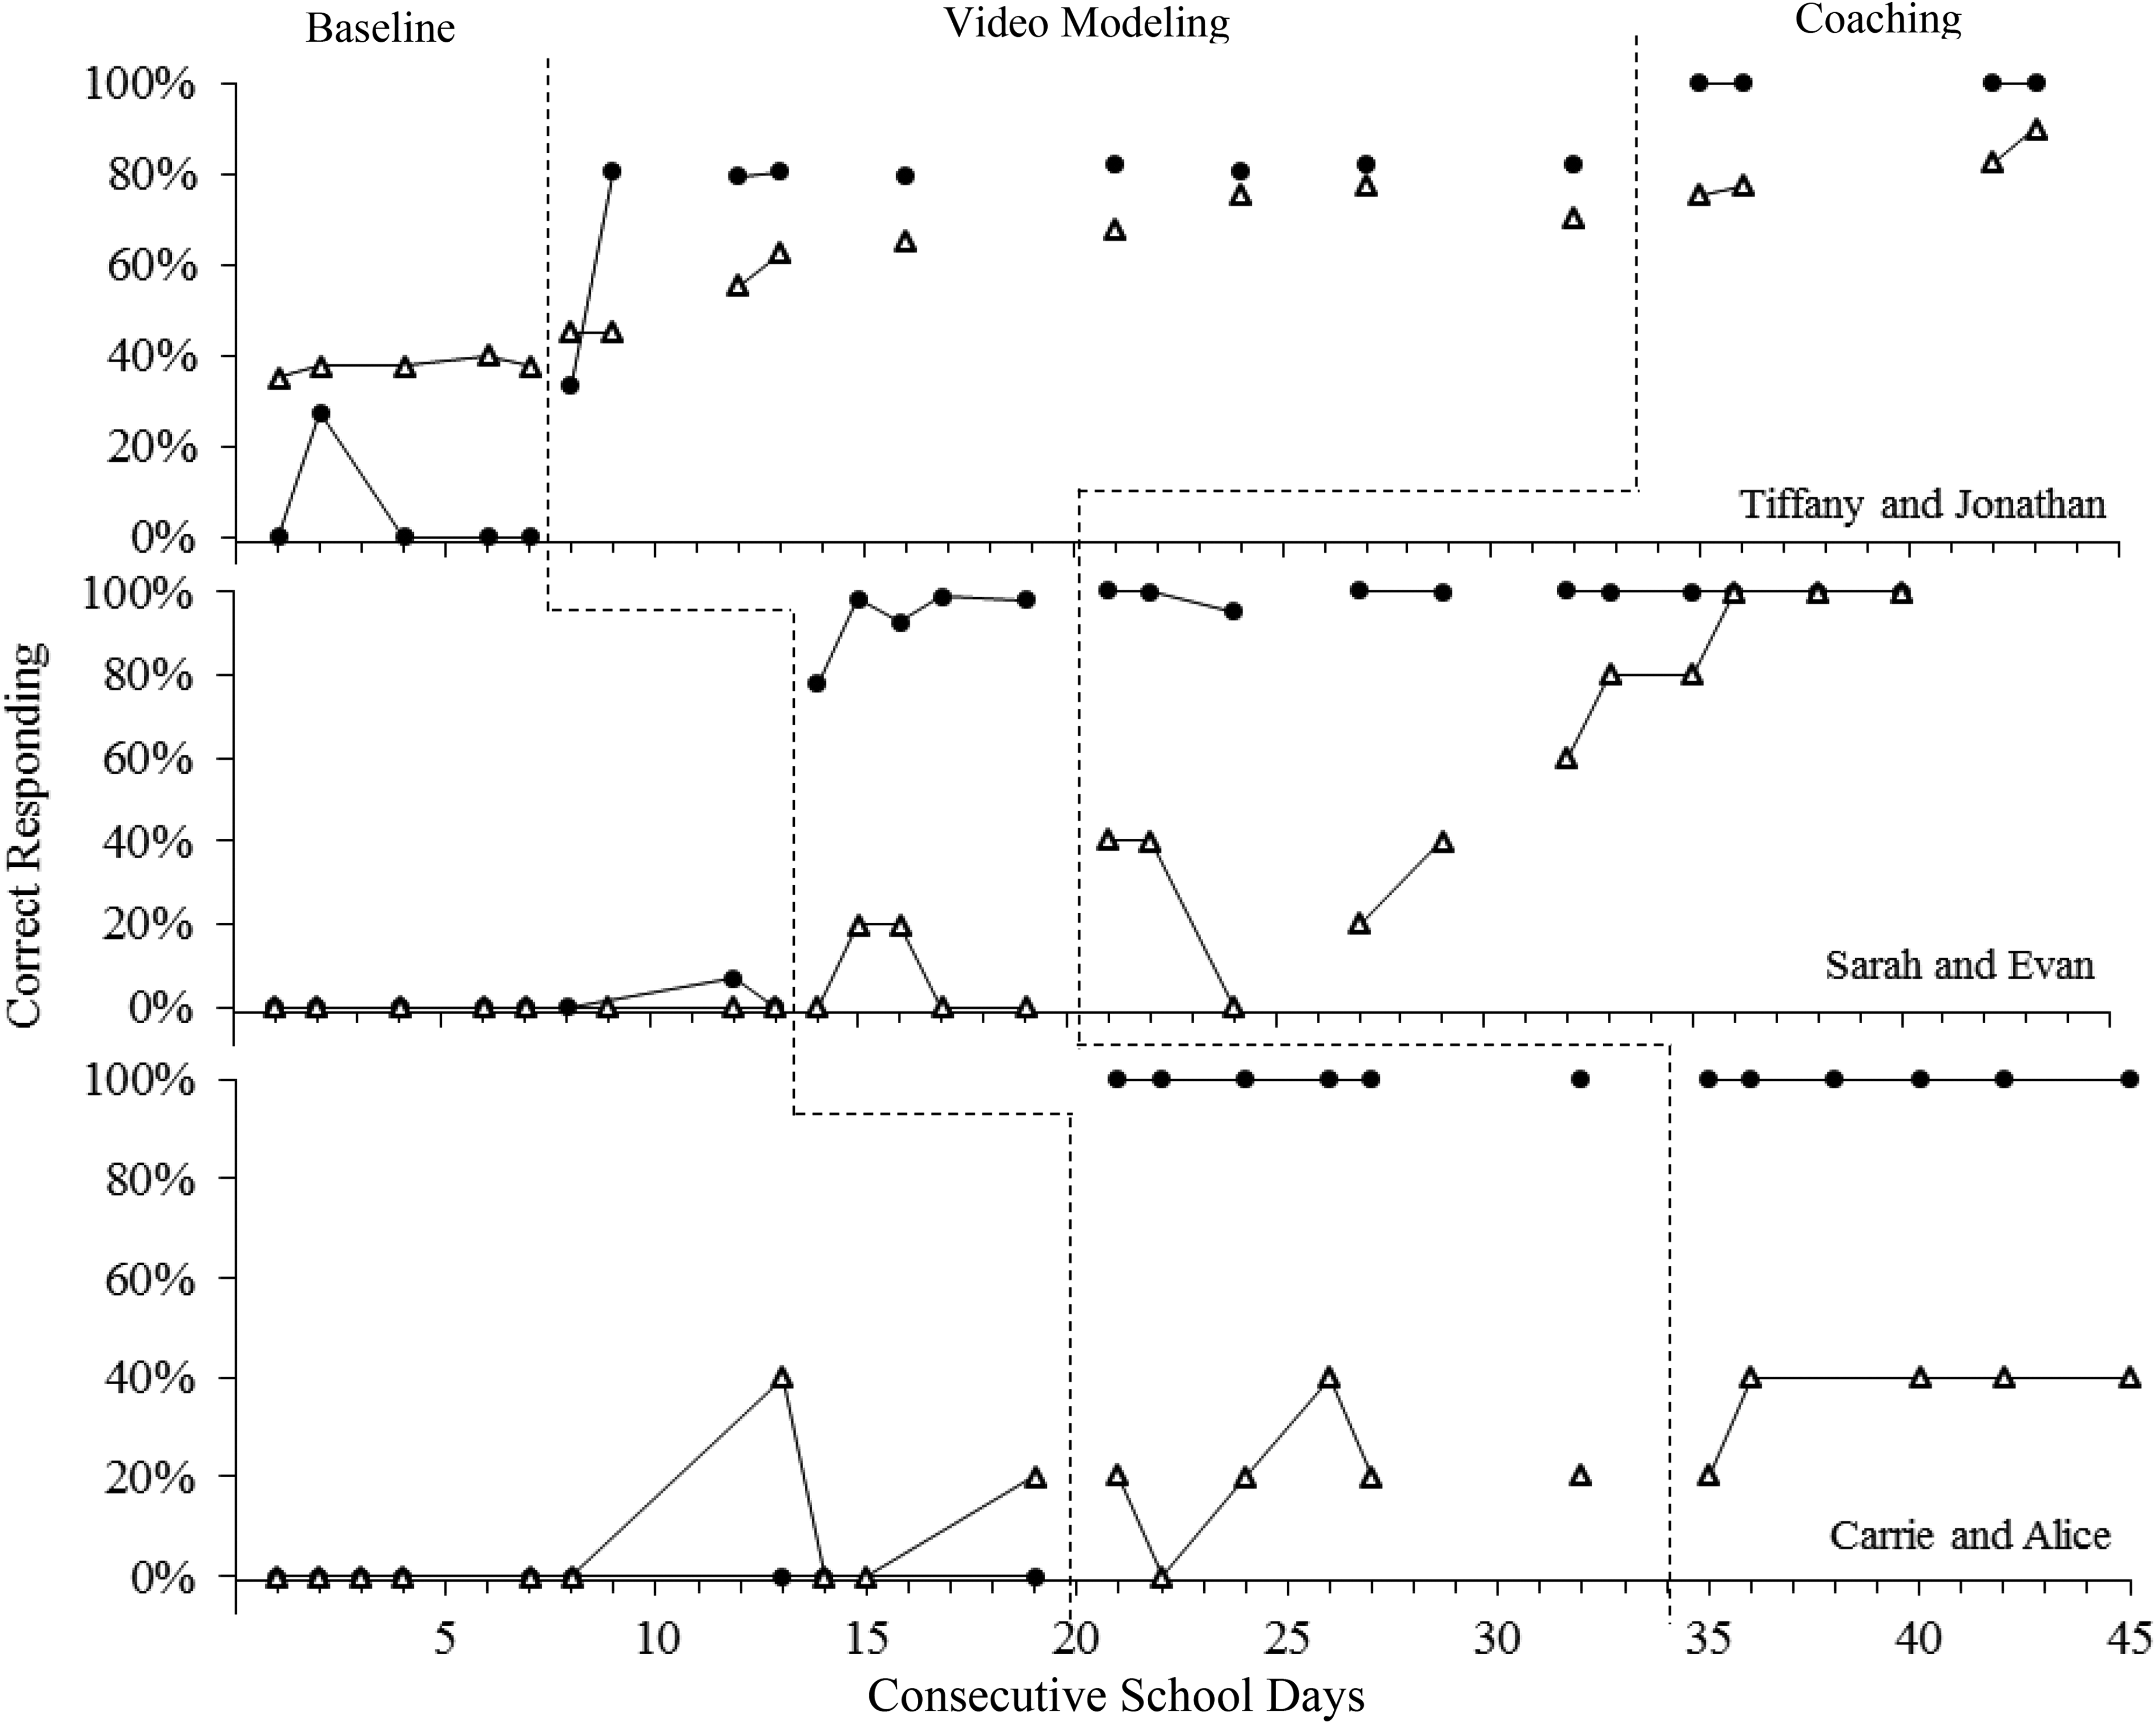
Teacher Implementation of constant time delay (filled circles) and student performance on individualized outcomes (open triangles). Jonathan was probed on reading 40 sight words, Evan on counting 10 random combinations of dimes and pennies up to one dollar, and Carrie on correctly counting 1–5 objects given one opportunity per number.
Tiffany
During the baseline condition, Tiffany used a prescribed multisensory teaching method to teach Jonathan sight words. Her implementation fidelity for constant time delay was 0% for most sessions, with the exception of one session in which she deviated from the prescribed multisensory teaching method. Once given access to the video model and checklist, her implementation fidelity increased immediately to 33%, and then 80%. Once coaching was provided, Tiffany immediately achieved 100% implementation fidelity and maintained perfect fidelity for the duration of the experiment.
Sarah
During the baseline condition, Sarah directed Evan to count money, but rarely provided any prompts or consistent error correction. Her implementation fidelity for constant time delay was 0% for seven of the eight baseline sessions. Once given access to the video model and checklist, her implementation fidelity increased immediately to 80% and then quickly trended to 100%. Sarah maintained very high implementation fidelity for the duration of the experiment.
Carrie
During the baseline condition, Carrie provided a complete model for how to count a given number and then provided Alice with the direction to count without providing any additional prompts until after Alice made multiple errors. Her implementation fidelity for constant time delay was 0% for all baseline sessions. Once given access to the video model and checklist, her implementation fidelity increased immediately to 100% and maintained at that level.
Student Progress on IEP Goals
Only one student made immediate and substantial progress during the video modeling phase, but all three demonstrated marked progress after brief coaching (see Figure 1). The DHPS was .40 (variance = .17) for effects of video modeling on student progress.
Jonathan
During the baseline condition, Jonathan’s performance was relatively stable at 38%, with no clear upward or downward trend. Immediately after Tiffany began implementing constant time delay, Jonathan’s data began slowly trending upward for nine sessions. On the tenth session his data declined, triggering the brief coaching condition. After Tiffany implemented the feedback we provided, Jonathan’s data trended to 90%—exceeding the criterion of 80% in his IEP goal.
Evan
During the baseline condition, Evan did not count any combinations of dimes and pennies correctly. When Sarah began implementing constant time delay, Evan initially made minimal progress (i.e., counted one of five combinations correctly in two consecutive sessions). A return to zero correct responses triggered brief coaching. In this condition, Evan’s correct responses increased immediately, dropped, and then steadily trended toward 100% across three sessions—the criterion in his IEP goal.
Alice
During the baseline condition, Alice’s data were variable. During most sessions, she would move all seven of the objects regardless of the number she was instructed to count. However, on one session, she intentionally moved less than seven objects for each trial—resulting in two correct responses. She continued to occasionally move less than seven objects in subsequent sessions during baseline, but her responses did not have a clear pattern and usually did not correspond with the number she was instructed to count. When Carrie began implementing constant time delay, Alice provided at least one correct response more consistently, but a lack of sustained progress triggered brief coaching. During this condition, Alice consistently counted at least two numbers correctly (one and two). Although Alice made notable progress, she did not meet the criterion stated in her IEP during the course of this study (i.e., counting sums 1–5 correctly).
Social Validity
All three teachers had positive perceptions of both the PD and the evidence-based practices. Quantitative items and teacher responses are reported in Table 1; we report open-ended questions and narrative responses in this section. When asked what they liked about the video model, Tiffany and Sarah noted that they enjoyed being able to access the video at their convenience and own pace. Carrie liked how the video provided a detailed model of exactly how instruction should be implemented. When asked what (if anything) they did not like about the video model, Carrie wrote that it would have been helpful to have information on how to modify instruction if the student was not making progress or had mastered the target skill, while the other two reported there was nothing they did not like. When asked what they liked about coaching, Tiffany wrote that she liked being able to ask any questions that she still had. Similarly, Sarah wrote “responses to specific questions about the implementation were clearly addressed and I was still able to use professional judgment with my student.”
All three participants reported that they would not change anything about the intervention. When asked what they did not like about time delay and what they thought would be helpful for future instructional plans for other teachers, both Sarah and Carrie wrote that it would have been helpful to include additional instruction on how to use the strategy effectively in other contexts.
Discussion
Many special educators struggle to deliver evidence-based instruction to students with severe disabilities. In this study, we tested the degree to which video modeling, an implementation checklist, and brief coaching could enable teachers to implement an evidence-based practice with fidelity and promote student progress. This combination of strategies enabled all three teachers to implement constant time delay with fidelity and promote student progress on individualized goals. Our findings extend the literature in a number of key ways.
First, video modeling with an implementation checklist is an effective means for promoting implementation fidelity. This confirms findings from prior studies (Catania et al., 2009; Singer et al., 1986; Slider et al., 2006) that video modeling can enable teachers to acquire implementation fidelity of new practices. All three teachers achieved implementation of 80% or greater with the video model and checklist. Tiffany and Sara initially made implementation errors after they were given access to the video models, but then they corrected some of their own implementation errors by the second session. Both teachers accessed the video immediately after the first session and reported that doing so was very helpful. This highlights a unique advantage of video modeling relative to in-person modeling—that teachers can re-create PD from an expert after they have attempted implementation in their classrooms. In addition, Carrie reported that she attempted implementation with a colleague and then watched the video model again prior to the first session. Therefore, she also seems to have benefited from attempting implementation, watching the video model, and then implementing again. It seems that for some teachers, revisiting video models can in part serve the same function as performance feedback—identifying and correcting implementation errors.
Notably, Tiffany did not achieve 100% implementation fidelity with only the video model and checklist. Brief coaching was needed to correct implementation errors; however, only one coaching session was required to achieve 100% implementation fidelity. Her implementation error was consistent—she simply did not restate what the student did correctly when delivering praise.
Second, brief coaching was required to promote optimal student progress. This extends beyond prior studies that did not measure student outcomes (Catania et al., 2009, Singer et al., 1986; Slider et al., 2006). All instructional adjustments related to improving the quality of reinforcement. For Sarah, the key adjustment was requiring Evan to provide an independent correct response in order to receive reinforcement and improving the quality of this reinforcement; Evan had learned that he could receive reinforcement for guessing and being prompted to the correct response, but he changed his behavior once the contingency for reinforcement was altered. For Carrie, the only adjustment was ending instruction after Alice provided a predetermined number of correct responses; it seems that it was reinforcing for Alice to reach the end of the instructional session so that she could gain access to a preferred activity. In both cases, student performance immediately improved after changes were made to reinforcement contingencies. Tiffany made implementation errors with video modeling alone, but Jonathan still made substantial progress. This is consistent with previous findings that constant time delay can promote progress for some students in spite of implementation errors (e.g., Holcombe, Wolery, & Snyder, 1994). Performance feedback corrected Tiffany’s implementation error and enabled Jonathan to make further progress.
These cases illustrate that high implementation fidelity does not necessarily guarantee optimal student progress for all students, and implementation errors do not preclude some students from making progress. This highlights the complicated relationship between implementation fidelity and student outcomes, and why it is difficult to say that teachers must implement a practice with a specific level of implementation fidelity in order for the practice to be effective. In addition to accurate implementation of evidence-based practices, student progress is impacted by a number of other factors including the quality of the student–teacher relationship (Sutherland, Mcleoud, Conroy, & Cox, 2013), the degree to which the task is reinforcing to the student (Dunlap, Foster-Johnson, Clarke, Kern, & Childs, 1995), antecedents to instruction (Kennedy, 1994), and individual student characteristics.
Third, the present study focused on using video modeling, but there are also other opportunities to leverage technology that could further improve the feasibility of coaching. Specifically, coaches could observe teachers and deliver feedback remotely through videoconference technology instead of only providing coaching in person (Israel et al., 2009). Eliminating coach travel time could enable a coach to use his or her time more efficiently and deliver coaching to a larger number of teachers. Future research is needed to better understand what combination of technological innovations is most feasible and effective for improving teacher practice and student outcomes.
Implications for Practice
Our results suggest that administrators and teacher educators can use a combination of video modeling, an implementation checklist, and brief coaching to enable teachers to effectively implement systematic prompting strategies to students with severe disabilities. We strongly recommend collecting both teacher implementation data and student progress data to determine when coaching is necessary, and whether coaching should focus on improving procedural fidelity and/or making adaptations based on student behavior. Based on our findings, we cannot recommend video modeling as a standalone PD tool without brief coaching.
Limitations and Directions for Future Research
Although our findings provide valuable insight into the efficacy of video modeling and brief coaching, there are a number of limitations to our study that provide directions for future research. First, one student made progress but did not meet her IEP goal. However, this is likely related to the short duration of this study, the nature of Alice’s disability and complex medical needs, and the design of Alice’s instruction. The plan we designed included gradually fading a stimulus prompt—a process that may have required time beyond the length of the study. In future studies, researchers might collect longitudinal data to better observe skill acquisition over a longer period of time, particularly with students with complex medical needs. Second, we created individualized video models that limited the burden on teachers to generalize to a new context. This likely contributed to experimental effects, but it also raises questions about how easily teachers might generalize the evidence-based strategies to new students or skills; the teachers themselves raised this concern when completing the social validity survey. In future studies, researchers could measure generalization of teacher implementation fidelity and develop strategies for promoting generalization if needed. Third, our measurement of implementation fidelity focused on adherence to implementation steps. In future studies, researchers might focus on other dimensions of fidelity (O’Donnell, 2008). Fourth, we provided video models and implementation checklists to teachers simultaneously. Therefore, we can only draw conclusions about the combination of strategies, and not video modeling in isolation. However, a number of prior studies have demonstrated that written instructions alone have a very limited impact on teacher implementation; for a review, see Brock et al., 2017. In future studies, researchers might design studies to disaggregate the effects of these two strategies through component analysis. Fifth, we delivered PD to in-service teachers who were all White and female. In future studies, researchers might test whether these same effects are observed with preservice teachers and more diverse samples. Sixth, a University faculty member created the video models and delivered the coaching in this study. In future studies, researchers might examine if administrators or other instructional coaches within a school district could feasibly implement these practices. Finally, there were individualized elements of the coaching that are not manualized in a way that would necessarily be replicated by another coach. For this reason, this study does not provide experimental evidence to support a replicable coaching model.
Conclusion
Video modeling with brief coaching enabled teachers in this study to implement an evidence-based practice with fidelity and promote progress on individualized student goals.
This combination of strategies represents a promising and feasible form of PD that can contribute to closing the research-to-practice gap for students with severe disabilities. Furthermore, the primary innovation in this study—replacing in-person modeling with video modeling—may enhance both the efficacy and feasibility of teacher PD.
Footnotes
Declaration of Conflicting Interests
The author(s) declared no potential conflicts of interest with respect to the research, authorship, and/or publication of this article.
Funding
The author(s) disclosed receipt of the following financial support for the research, authorship, and/or publication of this article: Support for this research came from an internal grant from The Ohio State University, Department of Educational Studies.