
Abstract
In this study, we evaluate the impact of a game-based supplemental fraction curriculum on student engagement, fraction knowledge, and STEM interest in inclusive elementary mathematics classrooms. Utilizing a robust experimental design, the research explores how a game-based interventions can augment traditional fraction instruction and promote STEM interest among students, including those with disabilities. The curriculum, grounded in Scheme Theory and Learning Trajectories, significantly improved students’ fraction understanding and STEM interest. These findings highlight the potential of integrating game-based learning into mathematics education to address foundational STEM concepts and advocate for further research to explore scalability and broader applicability. The results of the study underscore the potential of innovative educational strategies to enhance learning outcomes and fostering interest in STEM careers among diverse student populations.
Introduction
Most 21st-century jobs require a college degree. Consequently, education reform in mathematics over the past 70 years has primarily aimed at ensuring students successfully complete Algebra (National Mathematics Advisory Panel (NMAP), 2008), considered a “gatekeeper” course (Bailey et al., 2012) for college and career readiness. However, research indicates that many students’ struggles with Algebra, including students who experience mathematics difficulties (MD), originate from a limited understanding of foundational concepts and skills. For example, a significant link exists between algebraic concepts and an understanding of rational numbers, especially fractions (Booth & Newton, 2012; Brown & Quinn, 2007; NMAP, 2008; Siegler, Duncan, Davis-Kean, Duckworth, Claessens, Engel, et al., 2012). A lack of conceptual understanding of fractions, in particular, can significantly impact students' ability to perform and apply computational procedures with fractions in advanced mathematics contexts (Hackenberg, 2013; NMAP, 2008).
Review of Literature
Fraction Intervention Research
The research literature on fractions over the past decade reflects a clear focus on enhancing students’ conceptual understanding of fractions as magnitudes (e.g., Fuchs et al., 2021; Hansen et al., 2017; Jordan et al., 2017). This research examines how students understand fractions over time, revealing persistent challenges (Hansen et al., 2017; Jordan et al., 2017). For example, Hansen et al. (2017) documented fraction knowledge growth for a cohort of students from third to sixth grade. They noted a group of students who began the study with limited understanding exhibited inflexibility when dealing with fractions. These students, who disproportionately represented students with disabilities, made significant errors in operations on fractions with different denominators, treating them as separate whole numbers, rather than coordinated units. The ongoing difficulties reported in this study and others (e.g., Jordan et al., 2017) underscore “fundamental problems with the bipartite structure of fractions” (Hansen et al., 2017, p. 55), suggesting students may confuse whole number and fraction operations and have difficulties extending their whole number understanding to fractional units.
Effective interventions for bolstering students’ understanding of fractions have also been documented. For example, employing fractions as measures of distance on a number line (e.g., Fuchs et al., 2021; Jordan et al., 2017), which replicates the structuring of whole numbers, amalgamates whole numbers with rational numbers to connect those conceptualizations. These studies also showcase components of effective intervention that are connected to content, such as student explanations or verbalizations of reasoning and learning to compare fractions and place their magnitudes on number lines through teacher demonstration. Yet, one critique of this research is that it seldom considers students’ individual reasoning and does not respond or give feedback to the real time thinking and strategies students bring forward to engage with fractions (Kochmar et al., 2021). Another critique is that a richer concept of fractions combines measure interpretations with other fraction interpretations, such as relational understandings grounded in division (i.e., ¾ = 3 ÷ 4) or equivalence classes grounded in ratios (Schoen et al., 2021). Thus, more research is needed in fraction interventions that bring forward students’ authentic strategies for thinking about fractions and use multiple representations to bolster students’ understanding.
Game-Based Mathematics Interventions
Just like fraction interventions, game-based mathematics interventions have also gained growing attention over the past decade (e.g. Clark et al., 2016). Numerous studies highlighted the positive influences of game-based learning on students’ motivation, engagement, attitudes, and enjoyment, contributing to an enhanced affective domain in mathematics education (Vankúš, 2021). Additionally, games have been shown to offer opportunities for students to receive real time prompts or feedback on their gameplay (Law & Chen, 2016). However, the use of educational games has shown mixed outcomes in improving students’ understanding and performance (Byun & Joung, 2018; Flores-Velazquez et al., 2021), leading to a need for more research in terms of their potential impact on students’ content outcomes.
Game-Based Fraction Interventions
The effects of game-based fraction interventions, in particular, is historically underexplored (Clark et al., 2016), although more studies are beginning to explore this topic (e.g. a, b et al., 2023; Martin et al., 2015; Ninaus et al., 2017; Riconscente, 2013; Zhang et al., 2020). To the best of our knowledge, there are six game-based fraction interventions mentioned in the literature. Slice Fractions and Slice Fractions 2 (Cyr et al., 2019; Zhang et al., 2020) are based in the part-whole interpretation of fractions and offer visual ways for students to act on objects, inquire, and employ strategic thinking. Refraction (Martin et al., 2015) is based in the part-whole interpretation of fractions and focuses on the on the concept of splitting fractions. Motion Math (Riconscente, 2013) and Semideus (Kiili et al., 2018) are based in the measurement interpretation of fractions and rely heavily on number line representations. Abydos (Masek et al., 2017) addresses more complex fraction concepts, such as equivalence and fraction operations. Finally, Math Mathews Fraction (Bhatia et al., 2023) uses multiple representations of fractions and feedback on errors (depletion of student points given incorrect answers) to bolster student fraction knowledge.
Several studies of game-based fraction interventions that involve Motion Math (Riconscente, 2013), Refraction Martin et al. (2015), and Semidues (Ninaus et al., 2017) did not use comparison groups, so we did not include them here, as we do not know if the impacts reported in those studies are attributable to the intervention or to other factors. Other studies that did use comparison groups are reviewed below.
Cyr et al. (2019) examined students’ learning of fractions in three conditions: 3 hours of gameplay of Slice Fractions, three-hours of gameplay of Slice Fractions embedded in regular teaching, and a business-as-usual condition (BAU). The researchers found significant differences in students’ fraction content outcomes as measured by test items from the Trends in International Mathematics and Science Study (TIMSS) in both gameplay conditions but not in the BAU condition. Students in these two gameplay conditions exhibited similar knowledge gains (i.e., students in the gameplay + instruction group did not do better than students who only played the game), suggesting that the game-based fraction interventions may successfully bring forward students’ authentic strategies for thinking about fractions without added teacher instruction, even in short durations.
In another study, Zhang et al. (2020) investigated the impact of two game based fraction interventions combined with regular instruction - Slice Fractions and Motion Math (Riconscente, 2013). Slice Fractions relies on the part-whole interpretation of fractions and area models, while Motion Math replies on number lines. Zhang investigated two experimental conditions – one with regular instruction + Slice Fractions and another with regular instruction + Motion Math. A third condition served as control (i.e., regular instruction). The researchers found no difference between experimental and control conditions on measures of short-term, direct impacts on students’ fraction knowledge. However, researchers also found significant differences in students’ scores on a transfer test of fraction outcomes in both gameplay conditions but not in the BAU condition. Results of the study suggest the game-based fraction interventions cultivated enhanced fraction knowledge through opportunities to act on objects, inquire, and employ strategic thinking not apparent in regular instruction in ways that transferred to more distal ideas about fractions.
In another study, Bhatia et al. (2023) investigated the impact of Math Mathews Fractions on students’ fraction understanding compared to when compared to a group that did not play the game. Math Mathews Fractions is a 12 level game covering topics such as fraction word problems, arithmetic, and foundational concepts. The game relies on multiple representations, game longevity, interactivity, direct instruction (i.e., modules on fraction topics students could view in gameplay), and feedback on errors in its program design. Students who played the game demonstrated significantly improved fractional understanding on researcher-created measures of fraction performance compared to controls (Bhatia et al., 2023). The results of the study suggest that programs that infuse multiple representations of fractions, longevity of gameplay, and feedback could be effective in bolstering students’ understanding of fractions.
While the studies reviewed above show effectiveness in term of student outcomes, they also have some important limitations. First, like the larger body of research on fraction intervention, all but one of the game-based fraction interventions rely on one representation of fractions, which could lead to limitations in student understanding (Lamon, 2020). Second, all but one of studies were short in duration, so we do not yet know if students’ short and long term outcomes would improve through prolonged engagement. Third, while program that did include multiple representations and longevity produced positive effects, we do not yet know if the results would hold in programs that were tighter in focus, did not include direct instruction, and had feedback on students’ organic problem solving. We also do not know the relationship between students’ prolonged engagement in such programs on their short and longer term learning outcomes. Finally, none of the programs reviewed address learning of students with math difficulty as a part of the sample or measure other important student outcomes, such as interest in STEM careers. Together, the limitations of past studies call for further research.
This paper examines how a game-based supplemental fraction curriculum impacts student engagement, fraction knowledge, and STEM interest in inclusive elementary school mathematics classrooms. An experimental design was employed to investigate changes in students’ fraction knowledge, engagement, and STEM interests before, during, and after program implementation. It was hypothesized students with and without mathematics difficulties and disabilities receiving the game-based intervention would demonstrate sustained engagement and significant augmentation of their fraction concepts (i.e., performance on a measure of the curriculum and a measure of fraction schemes) due to the design of the game compared to students receiving core mathematics instruction with no intervention. We also hypothesized that students would heighten their STEM interest when compared with similar students receiving core mathematics instruction with no intervention. The research questions for this study were: (a) Are there statistically significant differences in overall knowledge (i.e. the number of correct responses) on a curriculum-based measure of fractions and on a measure of fraction schemes for students with and without disabilities who do and do not participate in a game-based intervention? (b) Are there statistically significant differences in STEM Interest for students with and without disabilities who do and do not participate in a game-based intervention? (c) Is there an association between gameplay behaviors (time spent in gameplay worlds and/or gameplay tutorials) and conceptual understanding of fractions?
Conceptual Framework
The game-based intervention in this manuscript draws from two conceptual frameworks: Scheme Theory and Learning Trajectories. Each framework is further delineated below.
Scheme Theory
Students’ mathematical understandings are often dissimilar from that of an adult (Flavell, 1996). That is, students actively build their own mathematical understandings through an integration of their prior experiences and new activity within their environment. We can name students mathematical understandings as schemes, or mental structures. These mental structures come about through students’ goal-driven, enacted activity, the anticipated results, and reflection upon those results (Von Glasersfeld, 2013). Repetitions of this process bring about abstractions of the logical necessity or relationships. The abstractions become the students’ mathematical mental structures.
To illustrate, consider a student who is sharing 4 objects equally among 3 people. In their activity, students engage, observe, and reflect on results of their problem-solving. They begin a process of reconciling disparities between expected results of their activity (e.g., if I partition each object into halves, then I will have enough parts for each person) and actual results of activity (e.g., when I partitioned each object into halves, I did not have enough halves to share equally). This process affords students tentative noticing of necessities and relationships (e.g., I must consider the relationship between the number of items shared and the number of people sharing”; “I must use the number of people sharing the items as an input to my plan to partition the items”), and, with additional activity across tasks, abstractions of logical necessities, mathematical relationships, and advances in their schemes.
Learning Trajectories
The second conceptual framework that grounds the intervention is learning trajectories (LTs), or hypothesized pathways of conceptual development (Daro et al., 2011), including those in the conceptual field of fractions and rational numbers (e.g., Confrey, Maloney, & Corley, 2014; Empson et al., 2006; Steffe, 2012; Wilkins & Norton, 2018). LTs consist of both the hypothesized developmental stages of thinking as well as activities (e.g., tasks, representations, prompts) designed to explicitly promote the stages of thinking toward a learning goal (e.g., Baroody et al., 2022). The stages of thinking are grounded in students’ conceptual development toward the goal, with each stage more sophisticated than its predecessor. Each stage depicts “specific concepts (e.g., mental objects) and processes (e.g., mental ‘actions-on-objects’) that underlie mathematical thinking at [that stage]” (Clements et al., 2020, p. (2) which in turn support students’ learning in other stages. LTs are often integrated into the design of curriculum standards (e.g., Common Core Standards for School Mathematics, CCSSM) and mathematics assessments and curricula. Yet, their use as foundations for mathematics intervention programs, including programs that address fractions, is largely unaddressed in the literature. As a result, their use as a conceptual grounding for interventions in special education is innovative (but see Hunt et al., 2024; Martin & Hunt, 2022).
Intervention Game Tasks and LT
LTs are innately situated in students’ access to tasks wide enough to take in different ways of knowing. That is, engaging diverse students in ‘rigid’ task sets is unlikely to bring forward diverse reasoning (Myers, 2022). This project designs for diversity by using tasks reflective of LTs confirmed in mathematics and special education literature (Hunt et al., 2024; Martin & Hunt, 2022) designed to promote access to and advancement of different schemes that a diverse audience of students, including students with disabilities and those who experience math difficulty, use to create and quantify fractions (Hunt & Martin, 2024; Hunt et al., 2016, 2023b, 2019, 2023a).
The tasks in the game-based intervention are based in both the partitive and the measure interpretation of fractions and are grounded in opportunities for students to create and quantify fractions using the core operations of partitioning, distributing, and iterating. In the first set of tasks, students use partitioning and iteration to create and test the length of unit fractions along a whole. In the second set of tasks, students use partitioning and distribution to create non unit fractions from unit fractions. In the third set of tasks, iteration is a core action for students to create non unit fractions from unit fractions and related non-unit fractions. Students use partitioning and iterations to reverse non-unit fractions to make wholes and create fractions of fractions in Task sets four and five.
Methodology
Participants and Setting
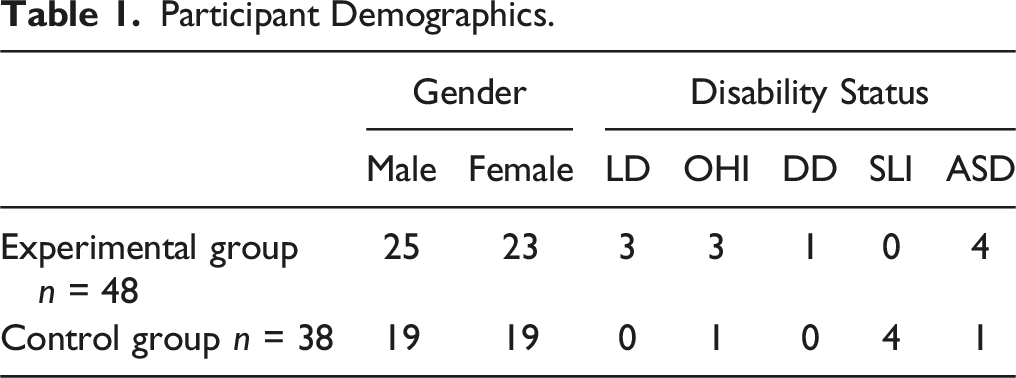
Participant Demographics.
Research Design
An experimental pretest-posttest design (Creswell & Creswell, 2017) was used in this study. The design examined the effects of the game-based fraction intervention on performance of fractions as recorded by two measures between the experimental and control groups, between students with and without disabilities, and any interactions. Additionally, patterns of engagement and strategy use among students with and without disabilities were examined. An a priori power analysis was utilized to compute the necessary sample size for the research questions 1 using G Power 3 statistical software (Faul et al., 2007). Effect sizes from previous research in fractions for students with LD (Svane et al., 2023) ranging from 0.50 to 0.75 were considered in the analyses. Thus, using an alpha level of 0.05 and noted effect sizes, the power analyses indicated a total sample size of 65 was sufficient to produce a power of .95 for a 2 x 3 between factors MANCOVA with repeated measures (Faul et al., 2007). Thus, the sample size was considered adequate to test the research questions. Significant differences were found between students with and without disabilities on both pretest measures. Therefore, disability was used as a covariate in our analyses.
Measures
Fraction Knowledge
Proximal fraction knowledge was measured before, during, and after intervention using the Trajectory Aligned Fraction Assessment (TEMA), hereafter called “FractionCBM”. The test is a 26-item curriculum-based measure of fourth grade curriculum standard. Test items are based on the six trajectory stages taught by the game- unit fractions, partitive fractions, iterative fractions, reversible fractions, recursive fractions, and distributive fractions. Items use both linear and open representations of fractions. The test was group administered and paper and pencil based. Test-retest reliability was 0.86; internal consistency reliability for the test was 0.75. Construct validity with the Test of Fraction Schemes (see below) was 0.71.
Distal fraction knowledge was measured before, during, and after the intervention using the Test of Fraction Schemes (Wilkins et al., 2013). This test is a 12-item measure of the effects of the intervention on students’ fraction conceptions. Original numerical values and representations were retained in both the pre and the post test. Tests were paper and pencil based. Internal consistency reliability for the test was reported by the authors as 0.70; criterion-related validity was 0.58 (p < .01). The test was group administered and included six items that measured the mental operations students use to construct fractions (i.e., two items on partitioning, two items on iterating, and two on splitting) and six items on overall fraction concepts (e.g., unit fraction, partitive fraction, iterative fraction).
STEM Interest
The authors used the Upper Elementary School (4–5) and Middle High School (6–12) Student Attitudes Toward STEM (S-STEM) (Friday Institute for Educational Innovation, 2012) to measure changes in students’ self-reported STEM interests before, during, and after the intervention. The S-STEM was developed as part of a US National Science Foundation (NSF) funded research program and measures students’ confidence and self-efficacy in STEM subjects, 21st century learning skills, and interests in STEM careers. It contains six constructs: math attitudes (8 items), science attitudes (9 items), engineering and technology attitudes (9 items), 21st century learning attitudes (11 items), interest in STEM career areas (12 items), and 7 “About You” items that measure short-term expectations for course success and exposure to STEM careers. We used an average of students’ responses on the math attitudes and the interest in STEM career area constructs for our study. Responses are supported by a five-point Likert scale, with response options ranging from “strongly disagree” (1) to “strongly agree” (5). Higher scores reflect the greater perceived value of participants. Cronbach’s α of the S-STEM ranged from 0.84 to 0.86 for the grade 4-5 subscales.
Engagement
Click trails (i.e., traces of all mouse clicks indicating the beginning and ending of a world 2 ) were used to determine in-game engagement. We used 10 second game intervals without activity as the basis for engagement based on Marino et al.’s (2014) prior research and adjustments based on the change from science to mathematics. Measured variables included time within the worlds, and time within the tutorials.
Procedures
Data Collection
Consenting students took the measures of engagement, conceptual understanding, and STEM/ICT interests in their mathematics classrooms on three consecutive 30-min class sessions immediately before, during (i.e., 6 weeks after the pretest), and immediately after the intervention. Teachers administered all measures after being trained on implementation. Measures were given to students as a group. Teachers told students to answer questions about their perspectives and interest in STEM and fraction knowledge and to do their best. Teachers gave no other direction. Items were read aloud to students who required assistance; in some cases, a scribe was used to write numeric answers for students who required support. Mid-test and posttest procedures mirrored pre-test procedures.
Supplemental Intervention Procedures
Teachers used a curriculum guide to administer the game-based intervention lessons for 35 minutes a day, three days a week, for 12 consecutive weeks. For each lesson, teachers enacted a five-minute preview, allowed 10–15 minutes of student gameplay, and facilitated a 15–20 minute after game task. Previews were opportunities for students to converse about the upcoming game play and were often video based. An example of a preview showed students how solar panels are installed and generate power, while another video showed students varied locations and uses of solar panels across the country and in the students’ state and counties.
After the preview, students played the embedded, web-based game for 10–15 minutes. Students take on the role of “Bunny”, a customizable character whose identity students can change according to their preferences. The game is a five world, sandbox play puzzle game that presents fraction challenges along the aforementioned learning trajectory. Some game challenges were constrained to invite particular actions on objects (e.g., find the length of exactly one share of a rectangular length) while other challenges invite a range of approaches and ways of quantification (e.g., share 4 solar panels among five houses equally). In every challenge, players are given a choice of tools that they can use to engage with the fraction challenges. The game is leveled: that is, students must successfully complete each challenge in order to advance to the next challenge, subworld, and game world. As students play, their prior work is saved, and different features of the character customizer “unlock” as more problems are solved.
After the game, students engage in a 15-20 discussion with their classmates and their teacher through number strings and a game replay, depending on the lesson. Procedures for number strings involved students being shown a problem and asked to solve it in their heads and indicate with a nonverbal symbol when they had a solution. The teacher then called on students to share their reasoning; teachers used a core representation (e.g., a number line) to illustrate students’ strategies. The process was then repeated with two to four additional problems; with each, teachers asked students if they could use their thinking from the previous problems to engage with the newly presented problem.
Game replay procedures are presented as think-pair-shares; students are given a challenge from the game world and are asked to recreate the strategy they used to solve it for 4 minutes. Next, students pair up and discuss their strategies with a partner for four to 5 minutes. They are given a sharing structure called talk and share. Sentence stems are provided to support students to both share (e.g., “my strategy was…“; ““My strategy makes sense to me because…“) and listen to and question what is being shared (e.g., “I noticed that you said…“; “I had a question about…“). Finally, students come together as a whole group to share their strategies around the discussion focus for the lesson (e.g., partitioning or iterating strategy to make 1/n) and the overall learning goal for the world (e.g., unit fractions (1/n) are named for the number of times they repeat (n) to create some whole (n/n)).
Teacher Development
Teachers attended four one-half day training sessions on implementation of the supplemental curriculum. Day one opened with the purpose of the study, the logic model, and the target population. Over the second and third days, teachers used the game and sample student gameplay to deepen their understanding of how the core program components are used to bolster student learning. On the final day, a curriculum guide was given to teachers to drive delivery of the intervention, and teachers practiced using the resource through role playing in small groups, rotating between teaching roles and student roles. Teachers also engaged in the after-game tasks, discourse, and talk moves to facilitate a sample student conversation. Finally, training on how to administer the study’s measures was given.
Classroom Instruction
To understand core classroom instruction, we relied on an analysis of the district’s fourth grade mathematics program, Eureka Math, and a questionnaire that we administered to classroom teachers in both the study and the comparison conditions.
Eureka Math addresses fractions at fourth grade in two units: Fraction equivalence, ordering, and operations and Decimal fractions. About 35% of the lesson topics in fourth grade were allocated to the two fraction units. In “fraction equivalence, ordering, and operations”, the program relies heavily on area and bar models of fractions. Lessons often begin with a modeled representation of a problem to demonstrate a concept before moving to symbolic representations of number sentences. For example, the program begins with two lessons that use paper strips and number bonds to show non unit fractions as a composition of unit fractions and to demonstrate the definition of a mixed number (e.g.,
Addition and subtraction of like denominator fractions is presented procedurally over several lessons using decomposition and definitions of mixed number fractions. For example, (de)composition and definition of mixed numbers are used to illustrate the concept, followed by word problems supported by part-whole bar models and number line representations. Procedures are extended to operations with “related” denominators, such as 4 and 8, using the equivalent fractions procedures to generate equivalents from unit fractions and/or simplify non unit fractions. Addition and subtraction of mixed numbers and, later, multiplication of whole numbers by fractions is treated through part-whole bar models supported by composition and decomposition. The unit concludes with one lesson on multiplicative comparison using language (times as long/tall as) and models.
Core Instruction Versus Supplemental Instruction
Five out of six of the teachers in our survey indicate that they used Eureka Math as their core math instruction for fractions; one teacher reported using a combination of Eureka Math and another program. Accordingly, teachers reported using two dominant fraction representations in their instruction. Squares with shaded regions and part whole models with bar models were reported as the dominant model (100% of teachers), with number lines less frequently identified (40% of teachers). Teachers also identified part whole models as the dominant fraction interpretation (83% of teachers), with measure models reported by 17% of teachers. Other interpretations of fractions (e.g., relational) were not reported. Finally, teacher-led instruction with the reported models was the dominant pedagogical mechanism (100% of teachers). Opportunities for students to partition/iterate to create unit and non-unit fractions in problem solving or explain their reasoning to other students were not reported by any teacher.
The game-based curriculum, by contrast, is grounded in opportunities for students to create and quantify fractions using the core operations of partitioning and iterating (see literature review for a full description). Length models (e.g., rectangular models of fractions; number lines) are the dominant instructional representation in the game; in game replays, students can choose their own re-presentation of their game strategies. Finally, student-led processes and strategies lead both the gameplay and the after-game tasks. Students’ explanation of thinking is a regular feature of instruction. Together, the instructional features of the game-based curriculum set it apart from core instruction.
Data Analysis
To address the first research question, we performed a 3 (Time) × 2 (Condition) 2-way multivariate analysis of covariance (MANCOVA) on two dependent variables: FractionCBM and FractionFAR, after controlling for disability status. The independent variables were time (Pre-, Mid-, and Post-Test) and condition (Experimental and Control groups). Results of evaluation assumptions of normality, homogeneity of variance-covariance matrices, and linearity were tested using Box’s method. Follow up analyses were performed using univariate ANOVAs.
To address the second research question, the team performed a 3 (Time) × 2 (Condition) 2-way analysis of covariance (ANCOVA) on one dependent variable: STEM interest, after controlling for disability status. The independent variables were time (Pre-, Mid-, and Post-Test) and condition (Experimental and Control groups). Results of evaluation assumptions of normality, homogeneity of variance-covariance matrices, and linearity were tested using Box’s method. Follow up analyses were performed using univariate ANOVAs.
To address the final research question, the team used analytics data of student gameplay behaviors as a proxy measure of student engagement in the game. Specifically, we examined two analytics measures: the amount of time students spent per gameplay world, and the amount of time students spent in the tutorial per gameplay world. Analysis included a MANOVA with repeated measures to examine if students spent significantly different amounts of time in different game worlds (dependent variable 1) or in different game-level tutorials (dependent variable 2), followed by linear regressions to examine if gameplay duration and gameplay tutorial duration predicted post-test scores of conceptual understanding and STEM interest. The team conducted these analyses with students who completed game worlds 1–4 (n = 40).
Results
Students’ Fraction Knowledge
Descriptive Statistics and Results From RM-(M)ANCOVA Interactions for Condition by Fraction Learning Outcomes and STEM Interest While Controlling for Disability Status.

*p < .05, **p < .01, ***p < .001.
GGGreenhouse-Geisser value due to violation of assumption of Sphericity. Exp. = experimental condition, Cont. = control condition.
To investigate the impact of the effect on each DV, we performed univariate F-tests using an alpha level of .05, while controlling for disability status. For between-subjects effects, while controlling for disability status, the main effect of condition was significant on FractionCBM (F (1, 83) = 7.75, p < .001, ηp2 = .085, Observed power = .79), but not FractionFAR (F (1, 83) = 2.49, p = .12, ηp2 = .029, Observed power = .35). Pairwise comparisons indicated a significant mean difference on FractionCBM score between the experimental and control groups (p = .007, such that while controlling for disability status, students in the experimental condition had significantly higher scores on the FractionCBM test (MCBMExp = 13.127, SE = .759) compared to students in the control condition (MCBMCont = 10.239, SE = .672).
For within-subjects interaction effects, Greenhouse-Geisser values are reported for FractionCBM because Mauchly’s Test of Sphericity was violated (p < .05). The results revealed, while controlling for disability status, the interaction effect was significant for both FractionCBM (Greenhouse-Geisser F (1.646, 135.579) = 11.36, p < .001, ηp2 = .12, Observed power = .98), and FractionFAR (F (2, 166) = 6.41, p = .002, ηp2 = .072, Observed power = .898). Pairwise comparisons, while controlling for disability status, indicated for FractionCBM, there were significant differences in scores between conditions at times 2 (mid-test; p = .008) and 3 (post-test; p < .001). At both mid- and post-test, students in the experimental condition had significantly higher FractionCBM scores (MCBMExpMid = 13.879, SE = .381; MCBMExpPost = 14.524, SE = .753) than students in the control condition (MCBMContMid = 10.606, SE = .779; MCBMContPost = 9.873, SE = .667). For FractionFAR, while controlling for disability status, there were significant differences in scores between conditions at time 3 (post-test; p = .013). At time 3, students in the experimental condition had significantly higher FractionFAR scores (MFARExpPost = 5.677, SE = .462) than students in the control condition (MFARContPost = 4.079, SE = .409).
For FractionFAR scores, while controlling for disability status, for the control condition, there are no significant differences between scores at any time point (p > .05). For the experimental condition, there were significant differences in scores between times 1 and 2 (pre-test and mid-test; p < .001) and times 1 and 3 (pre-test and post-test; p < .001, while controlling for disability status. However, there were no significant differences in score between times 2 and 3 (mid-test and post-test; p = .95). Therefore, scores at pre-test (MFARExpPre = 3.797, SE = .383) were lower than at mid- (MFARExpMid = 5.174, SE = .378) or post-test (MFARExpPost = 5.677, SE = .462). Although not significant, scores for both post-test measures were higher than at mid-test (Figure 1). Significant interaction between time*condition on CBM and FAR scores.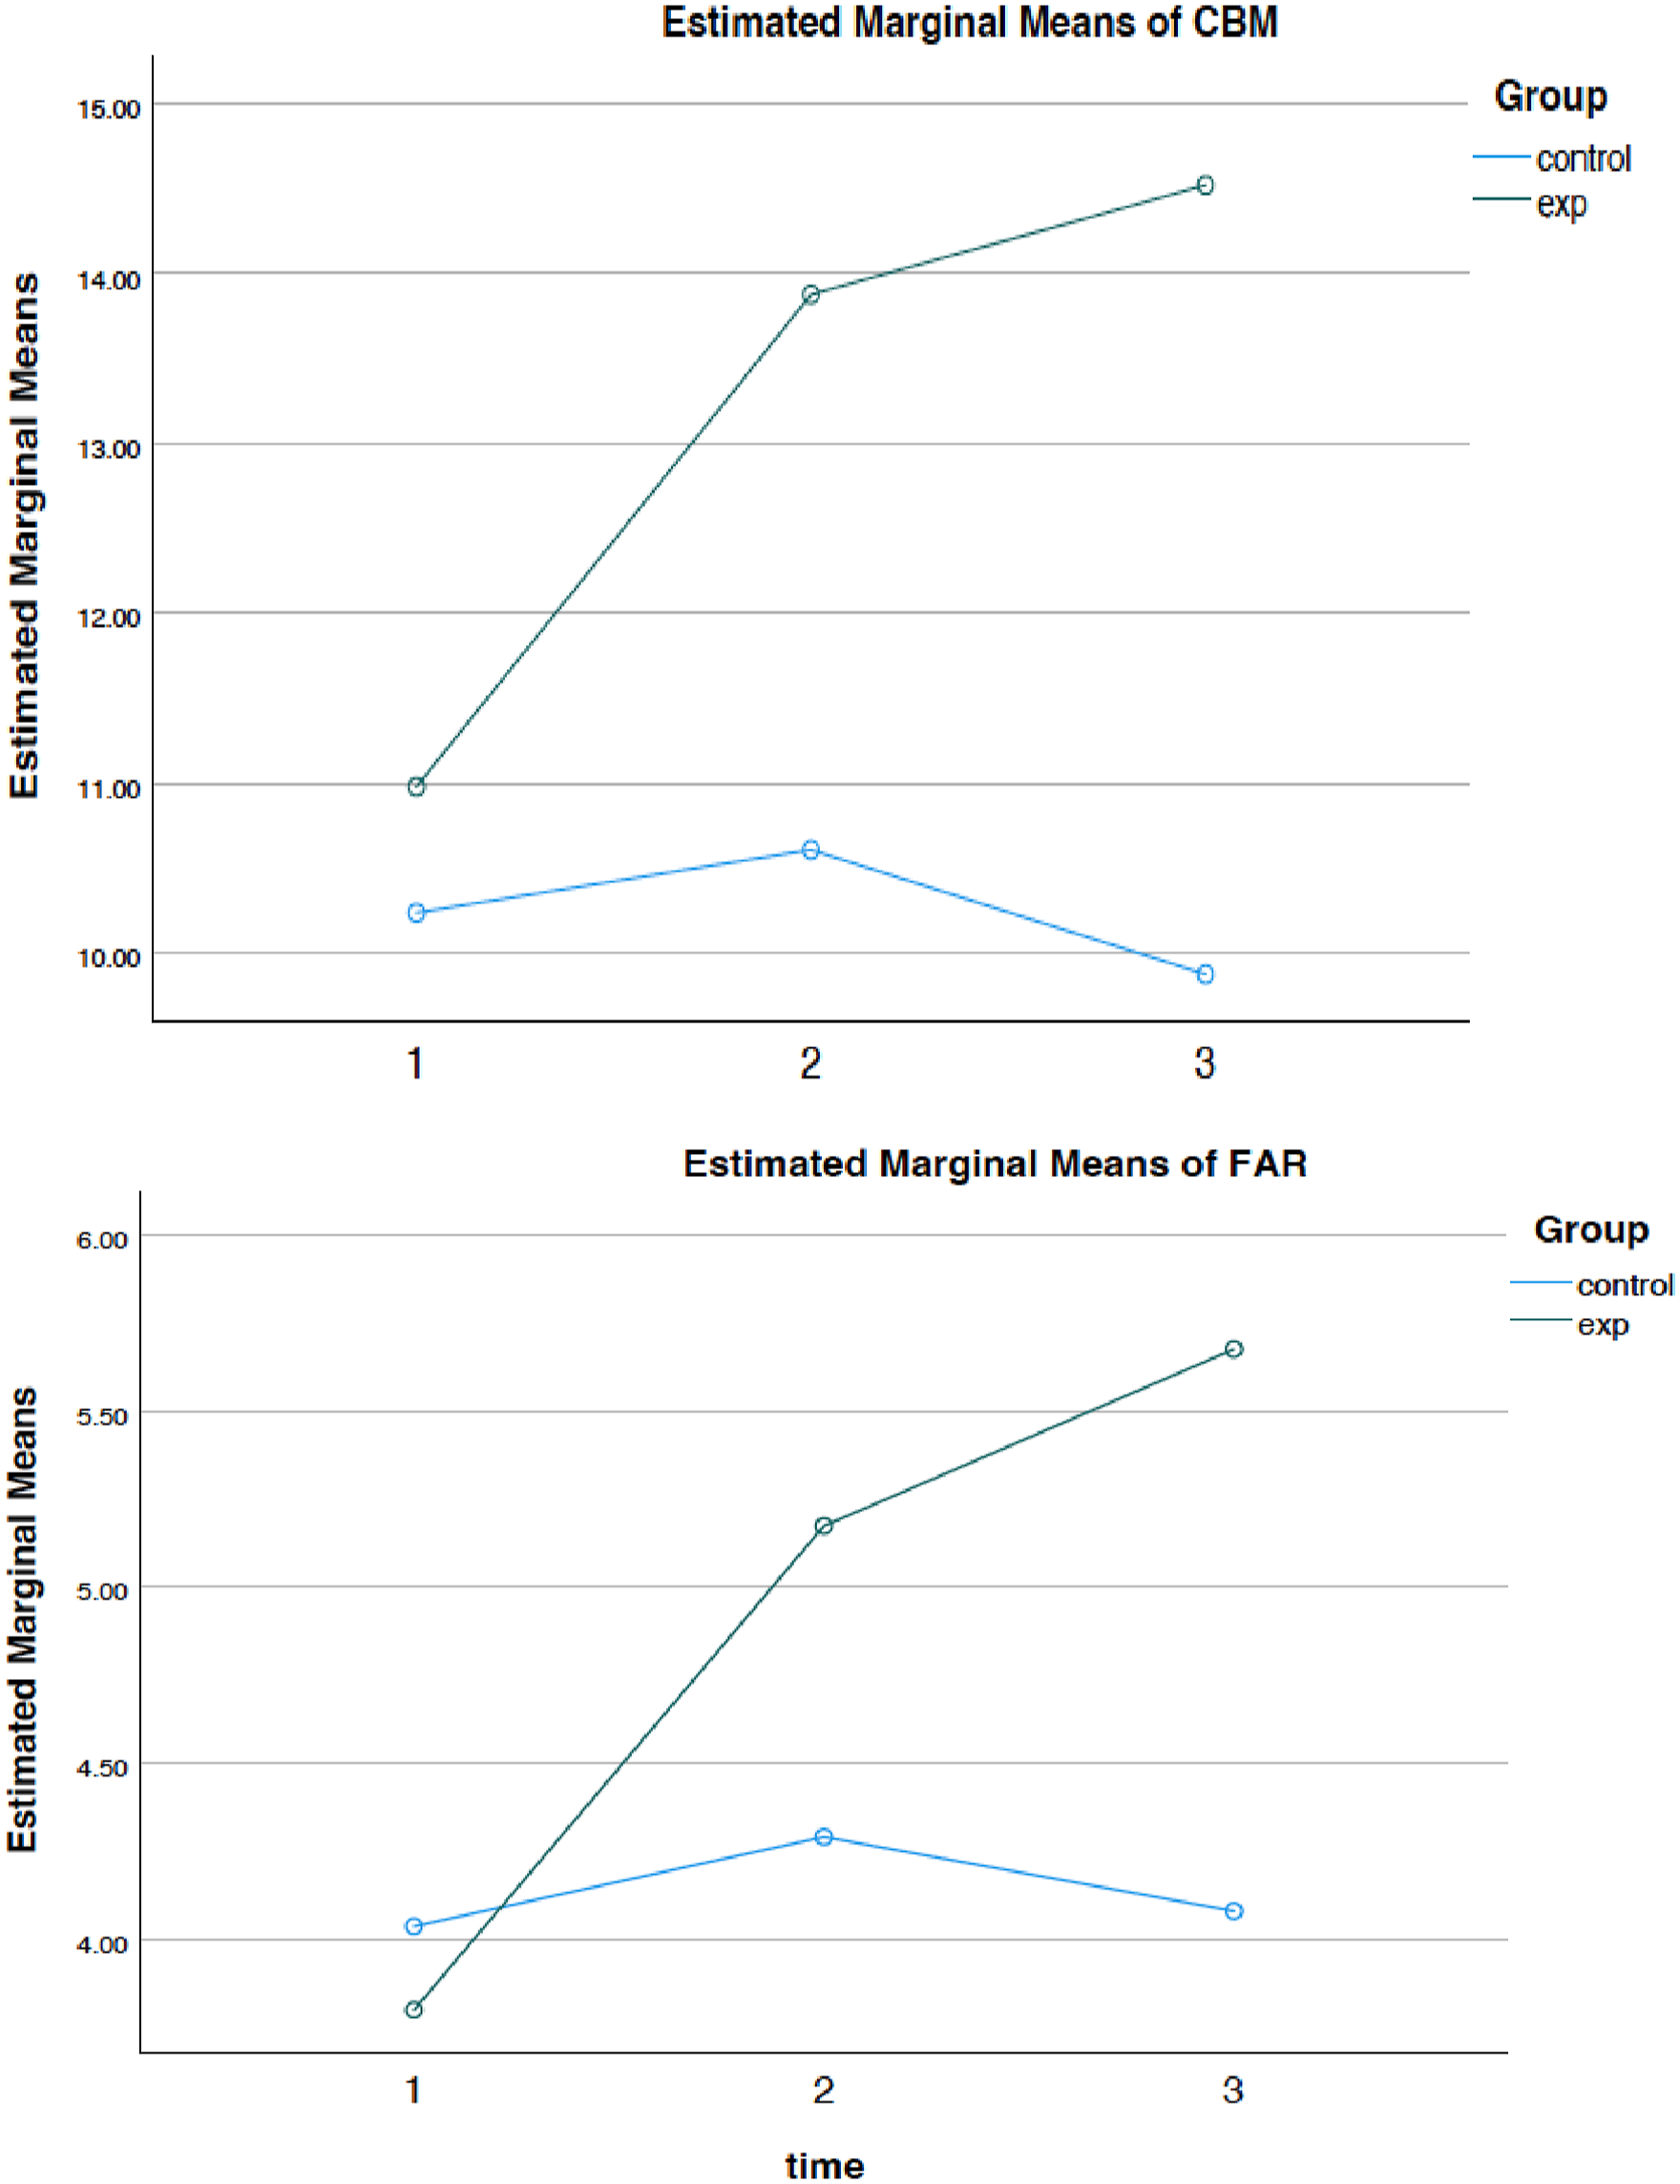
Students’ STEM Interest
The second research question asked if there were statistically significant differences in STEM interest for students with and without disabilities who did and did not participate in a game-based intervention. To address this question, the team performed a 3 (Time) × 2 (Condition) 2-way analysis of covariance (ANCOVA) on the dependent variable: self-reported STEM interest 3 , after controlling for Disability Status. The independent variables are time (Pre-, Mid-, and Post-Test) and condition (Experimental and Control groups). Results of evaluation assumptions of normality, homogeneity of variance-covariance matrices [The Box’s M of 12.35 indicates that the homogeneity of covariance matrices across groups is assumed (F (6, 9729.117) = 1.904, p = .076], and linearity was satisfactory. (p > .05).
Results from the ANCOVA (see Table 2) revealed while controlling for disability status, the main effect of time (Wilks’ λ = .93, F (2, 45) = 8.193, p = .182, ηp2 = .073, Observed power = .35) was not significant. However, there was a significant time*condition interaction with large effect sizes (Wilks’ λ = .78, F (2, 45) = 6.55, p = .003, ηp2 = .225, Observed power = .89).
Between-subjects effects revealed, while controlling for disability status, there was a main effect of condition on STEM interest (F (1, 46) = 11.39, p = .002, ηp2 = .199, Observed power = .91). Pairwise comparisons indicated a significant mean difference on STEM interest score between the experimental and control groups (p = .002, such that while controlling for disability status, students in the experimental condition had significantly higher scores on the STEM interest survey (MSTEMExp = 6.022, SE = .332) compared to students in the control condition (MSTEMCont = 4.571, SE = .262).
For the interaction effect, sphericity was assumed (p = .051). The results from the F-test revealed, while controlling for disability status, the interaction effect was significant (F (2, 92) = 7.55, p < .001, ηp2 = .141, Observed power = .938). Pairwise comparisons indicated, while controlling for disability status, there were significant differences in STEM interest survey responses between conditions at times 2 (mid-test; p = .009) and 3 (post-test; p < .001). At both mid- and post-test, students in the experimental condition had significantly higher STEM interest scores (MSTEMExpMid = 7.298, SE = .561; MSTEMExpPost = 7.974, SE = .504) than controls (MSTEMContMid = 5.252, SE = .459; MSTEMContPost = 5.623, SE = .398) (Figure 2). Significant interaction between time*condition on STEM interest.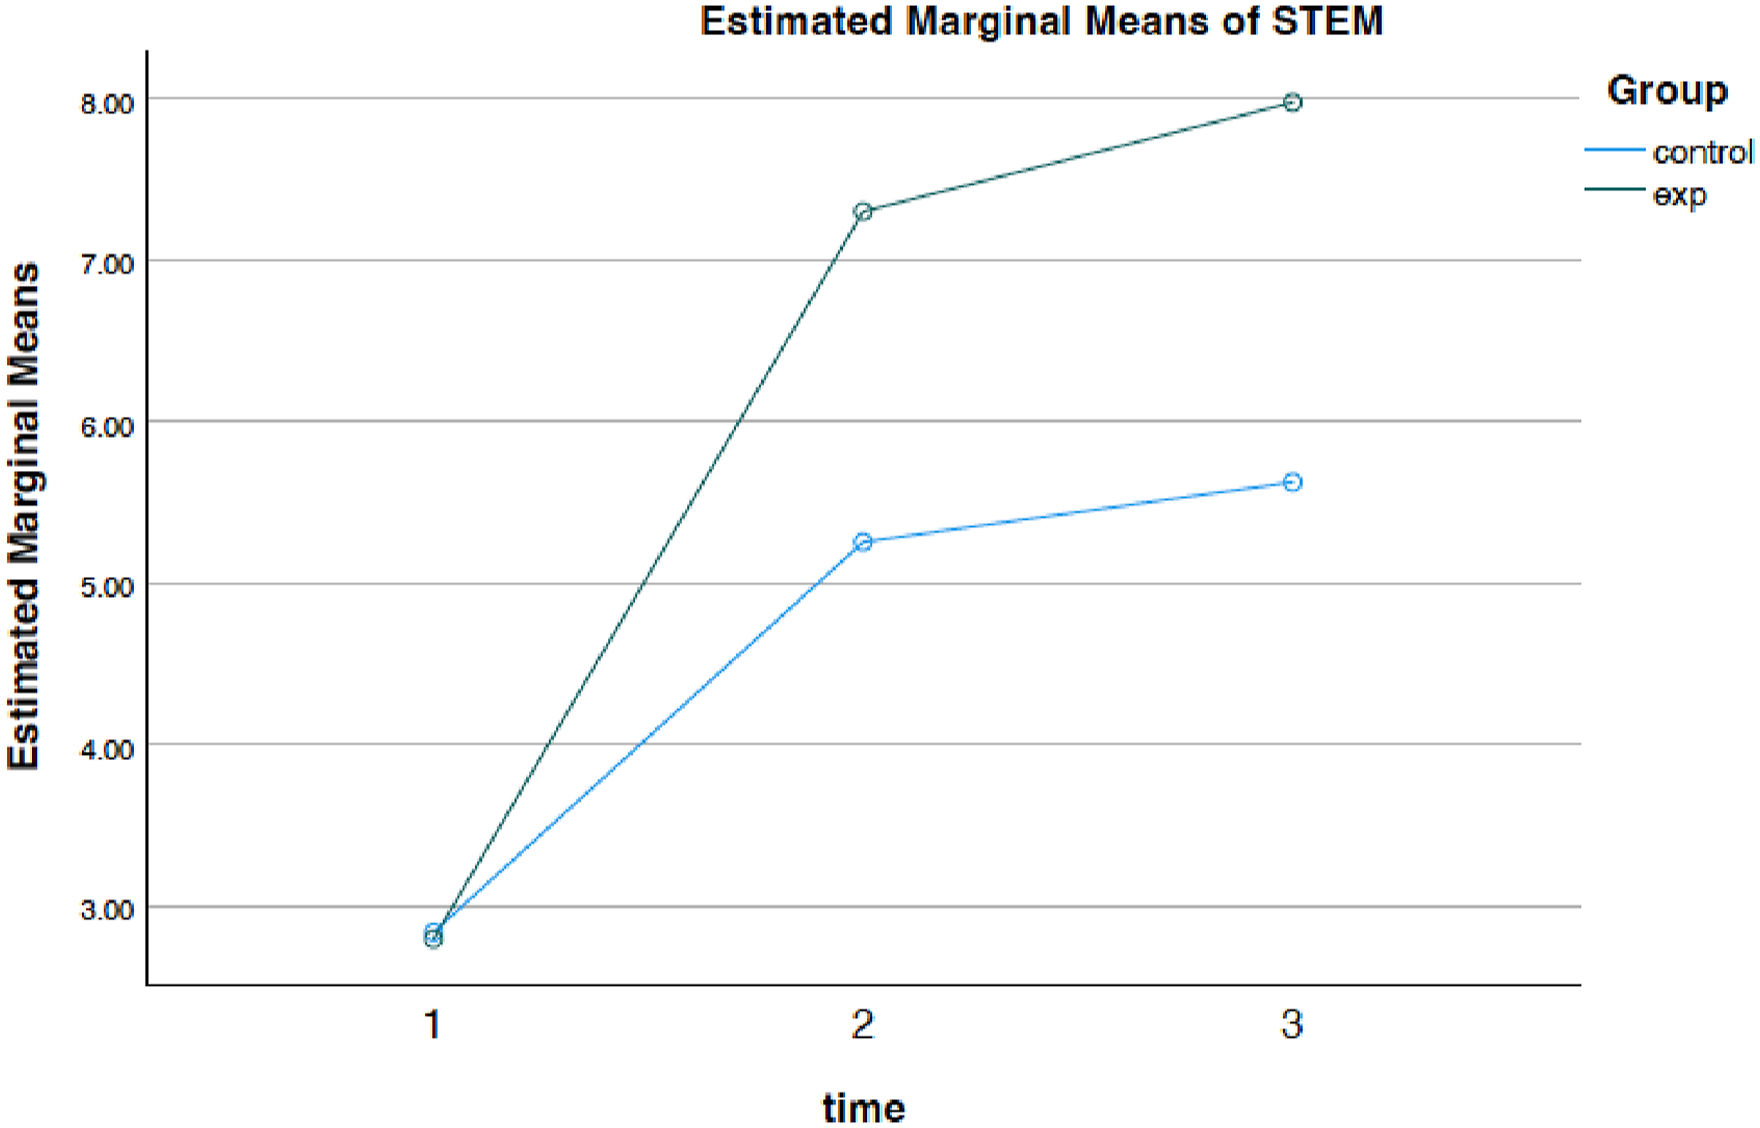
Students’ Engagement
Descriptive Statistics and Results From RM-MANOVA for Gameplay Time and Gameplay Tutorial Time by World.

*p < .05, **p < .01, ***p < .001.
GGGreenhouse-Geisser value due to violation of assumption of Sphericity. W = gameplay world.
Linear Regression Results With Mean Gameplay Duration and Mean Gameplay Tutorial Duration Predicting Post-test CBM, FAR, and STEM Interest Scores.
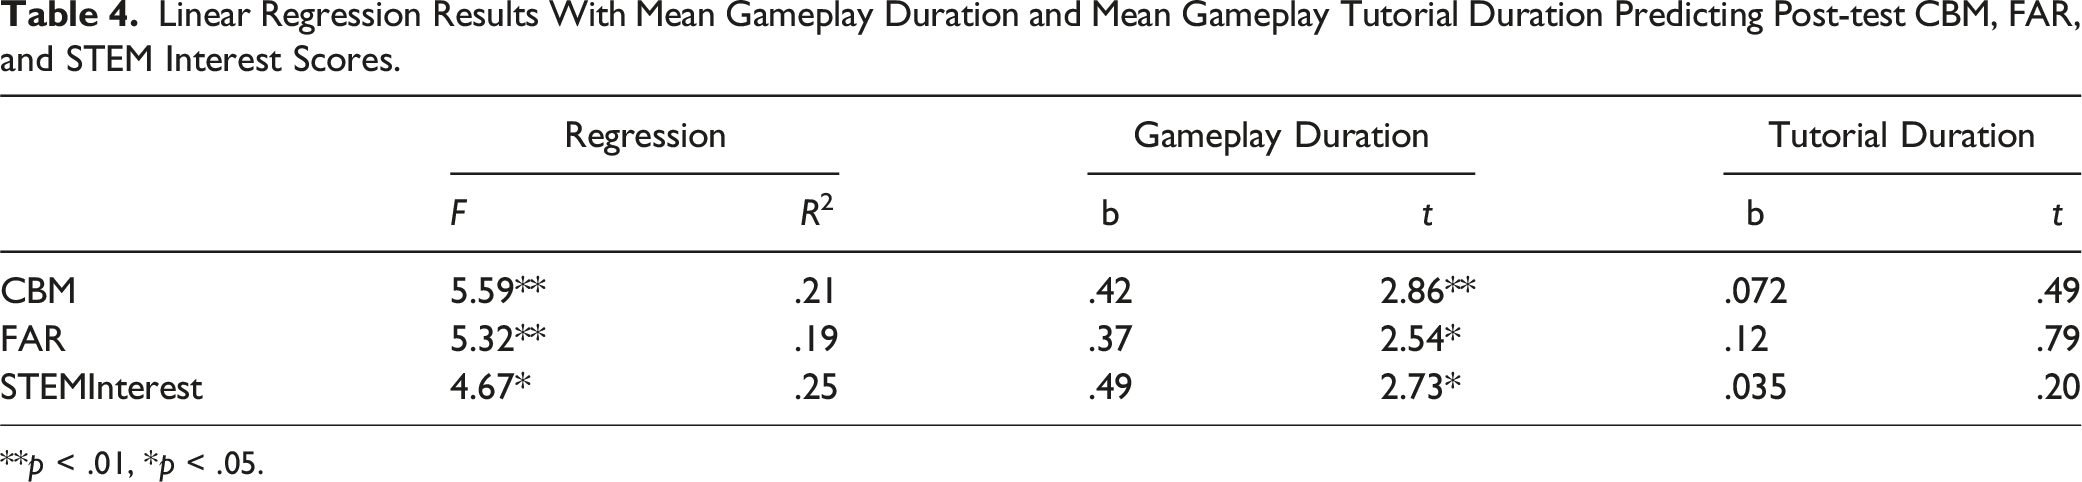
**p < .01, *p < .05.
Discussion
Previous studies have indicated that fourth and fifth graders with MD exhibit reduced conceptual understanding of fractions compared to their peers, leading to limited progress in problem-solving and computational skills (Eichhorn, 2018; Jayanthi et al., 2021). The purpose of this study was to explore how a game-based supplemental fraction curriculum impacts student engagement, fraction knowledge, and STEM interest in inclusive elementary school mathematics classrooms. An experimental design was employed to investigate changes in students’ fraction knowledge, engagement, and STEM interests before, during, and after program implementation. Results revealed that students who engaged in the game-based supplemental fraction curriculum outperformed students in the comparison group. Significant differences were found between the comparison and control groups in terms of fraction knowledge, fraction schemes, and STEM interest. Moreover, mean gameplay time predicted scores on measures of conceptual understanding (i.e., CBM and FAR at pre, mid, and post), and scores on measures of STEM interest at mid and posttest.
The large effects on students’ fraction learning and STEM interest reported in this study suggest the potential of the program to promote outcomes in a foundational STEM concept for historically marginalized students included in our study (i.e., students with disabilities). Thus, the supplemental game-based fraction program warrants future research and expansion to examine whether positive effects on students’ fraction learning are impactful for larger numbers of students beyond the bounds of this study. The following paragraphs discuss the study results in relation to the program’s design and promoting equity and inclusion of students with disabilities in STEM. Implications for future research and practice are also presented.
Access and Achievement Through Game Based Interventions
Results of the study connect to and expand prior intervention research on fractions. For example, prior research suggests instructional approaches that bolster students’ understanding of fractions include connecting to students’ structuring of whole numbers and providing opportunities for students to explain or verbalize their reasoning as they learn (Fuchs et al., 2021; Jordan et al., 2017). Our results are consistent with this literature and suggest that game-based interventions that include these instructional approaches can also be effective in augmenting students’ conceptions of fractions (Cyr et al., 2019; Bhatia et al., 2023; Riconscente, 2013; Martin et al., 2015; Ninaus et al., 2017; Zhang et al., 2020). However, one nuance that sets this work apart from past research may rest in the engagement of students’ individual reasoning as a basis for conceptual change. For example, students’ engagement in the game-based intervention required them to engage their prior knowledge of whole numbers to create fractions through gameplay. Specifically, students’ use of iterating and partitioning actions as a basis to create and quantify fractional quantities was fundamental across the trajectory of instructional tasks. The significant correlation of mean gameplay time with all measures of conceptual understanding (i.e., CBM and FAR at pre, mid, and post) suggest students must engage in these gameplay actions to access, build, and internalize improved notions of fractions (Jayanthi et al., 2021; Wilkins & Norton, 2018). Such findings suggest a potentially powerful link between students’ gameplay engagement and their heightened fraction conceptions and STEM interest. Future research is needed to further test this hypothesis.
Limitations and Implications for Future Research
From the study results, there are both limitations and implications for future research. First, the sample size involved in this study, while appropriate to address the research questions, was small. Future research could replicate this study with a larger number of teacher and student participants to scale the results (i.e., “scaling out”, Riddell & Moore, 2015). For example, future studies could aim to replicate these findings with larger cohorts and explore the effectiveness of game-based learning in other mathematical domains and educational settings. Research could also compare the game-based fraction curriculum against other game-based fraction programs or compare the game-based fraction curriculum against non-game based programs with similar design components.
Second, although reflective of the prevalence rates of students with disabilities in K-12 schools, the number of students with disabilities in the current study was small; conditions of the data warranted the use of students with disabilities as a covariate. Future research should use designs that better examine the effects of the program on students with disabilities, specifically, either through the measures used in this research or more sophisticated gameplay trace data. Such research might examine the trajectories of students’ experiences in the game and the types of engagement profiles that predict the improved knowledge and interest reported in this study.
Finally, students’ stories might also be used to change the narratives regarding students with disabilities in STEM more generally. Riddell and Moore (2015) provided many definitions of scale that reach beyond scaling out. For example, “scaling deep” could also be used to increase not only the impact of game-based interventions on more students with disabilities but also the perception of how these students learn and grow within mathematics. Studying the gameplay trajectories, curriculum experiences, and broader experiences (e.g., enrollment in math courses, STEM informal experiences, or career training) of students with disabilities could impact larger cultural or social ideas about these students. Using students’ stories to change beliefs and norms deeply rooted in people, relationships, communities, and cultures could prove to have broader implications for this marginalized community within STEM. Plans to implement both versions of scale are being planned for this program of research.
Conclusion
In conclusion, this study substantiates the promising impact of this game-based supplemental fraction curriculum in elevating students’ engagement, fraction knowledge and STEM interest in inclusive elementary mathematics classrooms. The intervention’s design, rooted in Scheme Theory and Learning Trajectories, demonstrates a nuanced approach that significantly differs from traditional fraction instruction and contemporary approaches to intervention. The findings offer promising evidence that integrating game-based interventions into fraction education can profoundly impact students' learning and interest in STEM fields.
In light of the promising results, educators and curriculum developers are encouraged to consider integrating game-based interventions into their teaching practices. By doing so, they can provide more inclusive, engaging, and effective mathematics education that not only improves fraction understanding but also fosters a sustained interest in STEM careers among diverse student populations. The potential of game-based learning to transform educational outcomes and bridge the gap between theory and practice in mathematics education has never been more evident.
Footnotes
Declaration of Conflicting Interests
The author(s) declared no potential conflicts of interest with respect to the research, authorship, and/or publication of this article.
Funding
The author(s) disclosed receipt of the following financial support for the research, authorship, and/or publication of this article: This work was supported by the Directorate for STEM Education 1949122.