
Abstract
Evaluations of red light camera (RLC) traffic safety programs have produced mixed results. Some conclude RLCs were associated with significant increases in motor vehicle crashes and injury crashes, whereas other research reports safety benefits. To understand the difference in findings, the present analysis assessed whether standards required for internal validity in quasi-experimental public health program evaluations were adhered to in frequently cited RLC analyses. Four evaluation standards were identified and used to assess the RLC analyses: lack of bias in the selection of both (a) treated sites and (b) comparison sites, (c) integration of relevant control variables in the analysis, and (d) full disclosure of results of the statistical analysis. Six leading RLC studies were then critiqued. Only two of the six studies adhered to the four standards and both concluded RLCs were associated with significant increases in crashes and injury or possible injury crashes. A third study reported an increase in fatal/injury crashes but did not test for statistical significance. Three studies reported equivocal findings; however, each failed to adhere to most standards. Differences in findings were attributed to the evaluation methods used. If implementing an RLC program, communities should use sound public health evaluation methods to assess effectiveness.
Keywords
Introduction
Red light cameras (RLCs) are offered as a remedy to improve motor vehicle safety by reducing crashes and injuries from red light running. It is a timely topic since many states and local jurisdictions are confronting decisions on whether to permit RLC programs, as well as to continue existing programs since some evaluations conclude RLCs are associated with increases in crashes and injuries. At present, state laws vary regarding RLC use. Nine states ban the use of RLCs and 20 states have no laws regarding their use (Governors Highway Safety Association, 2014). In Florida, legislation was passed in 2010 to allow local jurisdictions to use RLCs ( Uniform Traffic Control, 2010-80, 2010). In 2012, Florida used a questionnaire (nonexperimental) of 73 jurisdictions using RLCs. The findings were mixed, with 56% of jurisdictions reporting decreases in crashes and the remainder reporting increases, no change in crashes, or no data available (Highway Safety and Motor Vehicles, 2012).
Red light running accounts for 2% of U.S. traffic fatalities and has been decreasing over time without the use of cameras In 2009, 676 fatalities in the United States occurred from red light running, a 28% decrease since 2000 (Federal Highway Administration [FHWA], 2013). RLC programs attempt to decrease injuries from “angle” crashes by photographing vehicles that enter an intersection on a red light, which results in a traffic ticket for the vehicle owner or driver, depending on state laws or local ordinances. A known limitation of RLCs is that they do not reduce accidental red light running, which occurs when drivers do not notice or see the red traffic signal.
While some evaluations conclude RLCs were associated with reductions in angle crashes, other studies report RLCs were associated with significant increases in crashes and injuries, including angle crashes. As such, the 2014 legislative analysis of an RLC bill in Florida reports that numerous studies have been conducted on the impact of RLCs on crashes and fatalities and that “the studies are contradictory” (Price, 2014). Due to conflicting findings, Florida policy makers have sought opinions from the Florida Committee on Trauma and Florida Hospital Association when considering proposed legislation regarding RLC use as these professional associations focus on efficacy. Further, in Florida and some other states, a portion of RLC ticket fines accrues to trauma centers. The Florida Hospital Association includes RLC bills as part of its legislative agenda and acknowledges that trauma centers receive a portion of the fine (Florida Hospital Association, 2014). Also, trauma and public health researchers have the skills needed to conduct evaluations of RLC program effectiveness. For example, trauma researchers analyzed the impact cameras have on driver behavior in one community and concluded RLCs were not associated with a reduction in crashes (Wahl et al., 2010).
The purpose of the present analysis was to identify standards for quasi-experimental evaluations of RLC programs based on published criticisms of some existing studies. Then, six RLC studies deemed by the National Highway Traffic Safety Administration (NHTSA) as best in data and methods were assessed to determine the extent to which standards were met. This should assist trauma, public health, and hospital professionals in making decisions to support or oppose any RLC legislation or program provisions, as well as to encourage the use of sound evaluation methods in communities that use RLCs.
The need for RLC evaluation standards is evident due to the conflicting findings, as well as differing opinions about what constitutes a valid study. For example, a meta-analysis concluded that RLCs were associated with a nonsignificant change in crashes. Also, it found studies that better controlled for confounding factors had less favorable RLC findings (Erke, 2009). The Insurance Institute for Highway Safety (IIHS), which is funded by the insurance industry, subsequently criticized Erke’s methods, in particular for failing to begin with a critical review of each study and assess whether the methods were valid (Lund, Kyrychenko, & Retting, 2009). Høye (2013) replicated Erke’s study using a larger sample and addressing the IIHS criticisms. This analysis also found nonsignificant changes in crashes. In 2011, the IIHS published an analysis that concluded RLCs were associated with a significant reduction in red light running fatality rates in large U.S. cities (Hu, McCartt, & Teoh, 2011). Langland-Orban, Pracht, and Large (2014) replicated this study to demonstrate the camera variable was not statistically significant if eliminating a single outlier city that had an extraordinarily high red light running fatality rate and accounted for more than half the observed variance the IIHS study was attempting to explain. McCartt of the IIHS explained “We have a difference of opinion about what constitutes a strong study” (Bialik, 2013). Consensus on RLC evaluation standards is needed to promote the use of valid evaluation methods.
When findings about an intervention’s effectiveness are contradictory, differences may be explained by dissimilarities in the evaluation design, the data, or both. While meta-analysis provides a statistical approach to interpret findings from independent studies about an intervention to make conclusions about conflicting findings, prior to conducting a meta-analysis, each research study must first be reviewed to evaluate the design and determine the validity of the methods used. Only studies believed to use correct research assumptions should be included in a meta-analysis (Shi, 2008).
The NHTSA’s Automated Enforcement: A Compendium of Worldwide Evaluation of Results critiqued 75 RLC studies and identified seven as the best in data and research design (Decina, Thomas, Srinivasan, & Staplin, 2007). One limitation they reported was many RLC evaluations “identified sources of variance in outcome measures that have not been controlled and/or have not been adjusted for in the statistical analysis.” As such, factors associated with changes in crashes and/or injuries were excluded from the analysis and could change the results if included.
For example, a report from the Office of the Majority Leader, U.S. House of Representatives (2001), titled The Red Light Running Crisis: Is It Intentional, identified the amber (yellow) light timing as a critical source of variation that influences red light running. The established remedy to reduce red light running at problem sites is to lengthen the amber light interval, as approximately 80% of red light violations occur in the first second after the light changes to red. The report explained that if the amber light interval is too brief, a zone exists where drivers cannot safely stop and are forced to enter the intersection on a red light. The report also explained RLCs are associated with increases in rear-end crashes, which has been attributed to driver behavior changes (abrupt braking to avoid a ticket).
Another confounding factor is the natural time trend. Motor vehicle injuries and fatalities from all causes, including red light running, have decreased steadily over time absent the use of RLCs. As such, evaluations require differentiating the influence of the intervention from changes that may take place independently with the passage of time (Stoto & Cosler, 2008).
An RLC study conducted by Retting and Kyrychenko (2002) provided additional insights into potential research design flaws. Burkey and Obeng (2004) replicated this study, which revealed the following research method weaknesses. First, RLC approaches were not separately evaluated, as crash data from RLC sites were merged with all signalized intersection approaches. The RLC approaches constituted only 2% of sites labeled as “treated” (camera). Second, the comparison intersections in the statistical analysis were not from other cities, as implied. Instead, they were nonsignalized intersections in the same city, which would not exhibit the declining time trend in red light running crashes since they had no red light running crashes. Third, traffic volume and the number of traffic lanes were excluded as control variables in the analysis, recognizing both are associated with numbers of accidents. Finally, the findings from the multiple regression analyses were not fully reported.
These reports and analyses were used to identify standards for RLC evaluations. Then, evaluations deemed the best in the NHTSA’s compendium were critiqued to determine whether they adhere to or deviate from the standards, which may explain the differences in findings.
Method
The NHTSA compendium, the Office of the House Majority Leader’s report, and the Burkey and Obeng (2004) analysis were used to identify four evaluation standards that must be used, at a minimum, for an RLC study to have internal validity or included in a meta-analysis. First, selection bias should not be evident in choosing the RLC sites included in the evaluation. In particular, non-RLC approaches should not be included as “treated” (camera) sites. Second, selection bias should not be evident in choosing the comparison/control sites. This implies comparison/control sites should be comparable intersections. For example, if RLC sites are selected due to extremely high crashes, the comparison sites should have similar extreme crash numbers. Regression to the mean must be considered in selecting comparison sites. Third, independent variables used in the statistical analysis should at a minimum include (a) amber light timing, (b) traffic volume, (c) number of traffic lanes, and (d) time trend variables. Fourth, findings from the statistical analysis should be fully reported.
These four standards were used to critique the RLC studies identified in the NHTSA compendium as best in data and study design. The localities included were independent of one another with one exception. Both Butler (2001) and Council, Persaud, Eccles, Lyon, and Griffith (2005) included Howard County, Maryland. However, the Butler evaluation, which reported nonsignificant findings at the two RLC sites analyzed, was not accessible despite multiple requests to the Federal Highway Administration and Howard University (publishers of the study). Therefore, six of the seven RLC studies were critiqued and one substitution was made. The Virginia study (Garber et al., 2005) was replaced with their later analysis (Garber, Miller, Abel, Eslambolchi, & Korukonda, 2007), since it is a more comprehensive analysis of the same jurisdictions.
Results
Table 1 provides a summary of each study, including the jurisdictions, the study period before and after RLC implementation, the number of treated and control/comparison intersections, and the general findings. Table 2 summarizes deviations from the four standards used in evaluating the programs, each of which is explained.
Summary of RLC Evaluations Best Achieving NHTSA Research Standards.
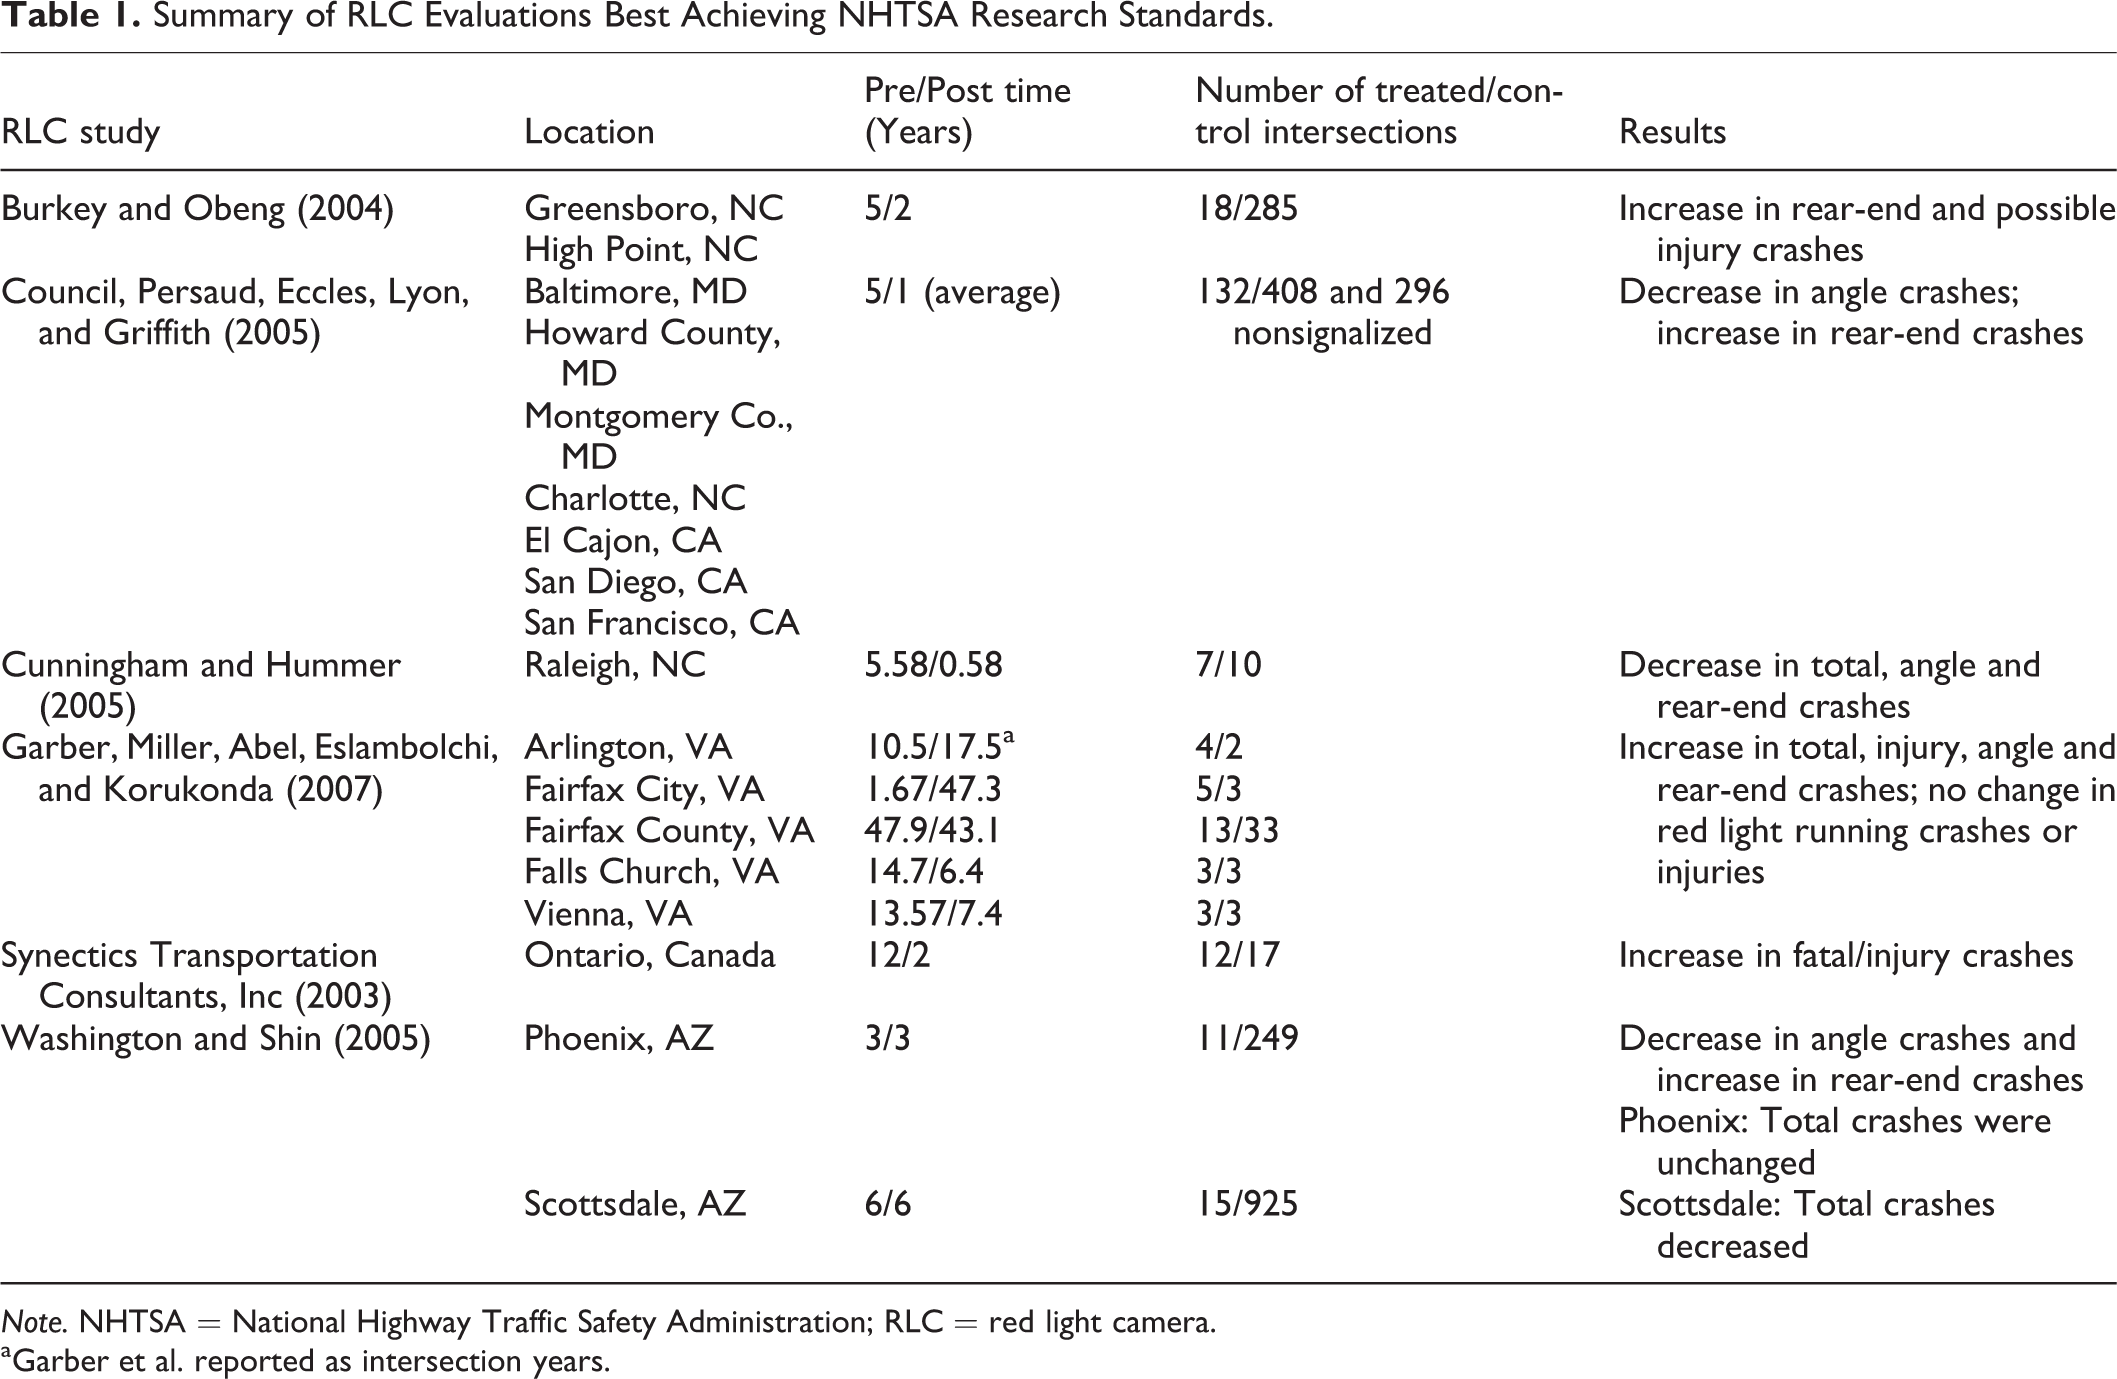
Note. NHTSA = National Highway Traffic Safety Administration; RLC = red light camera.
aGarber et al. reported as intersection years.
Violations of Quasi-Experimental Public Health Evaluation Methods.
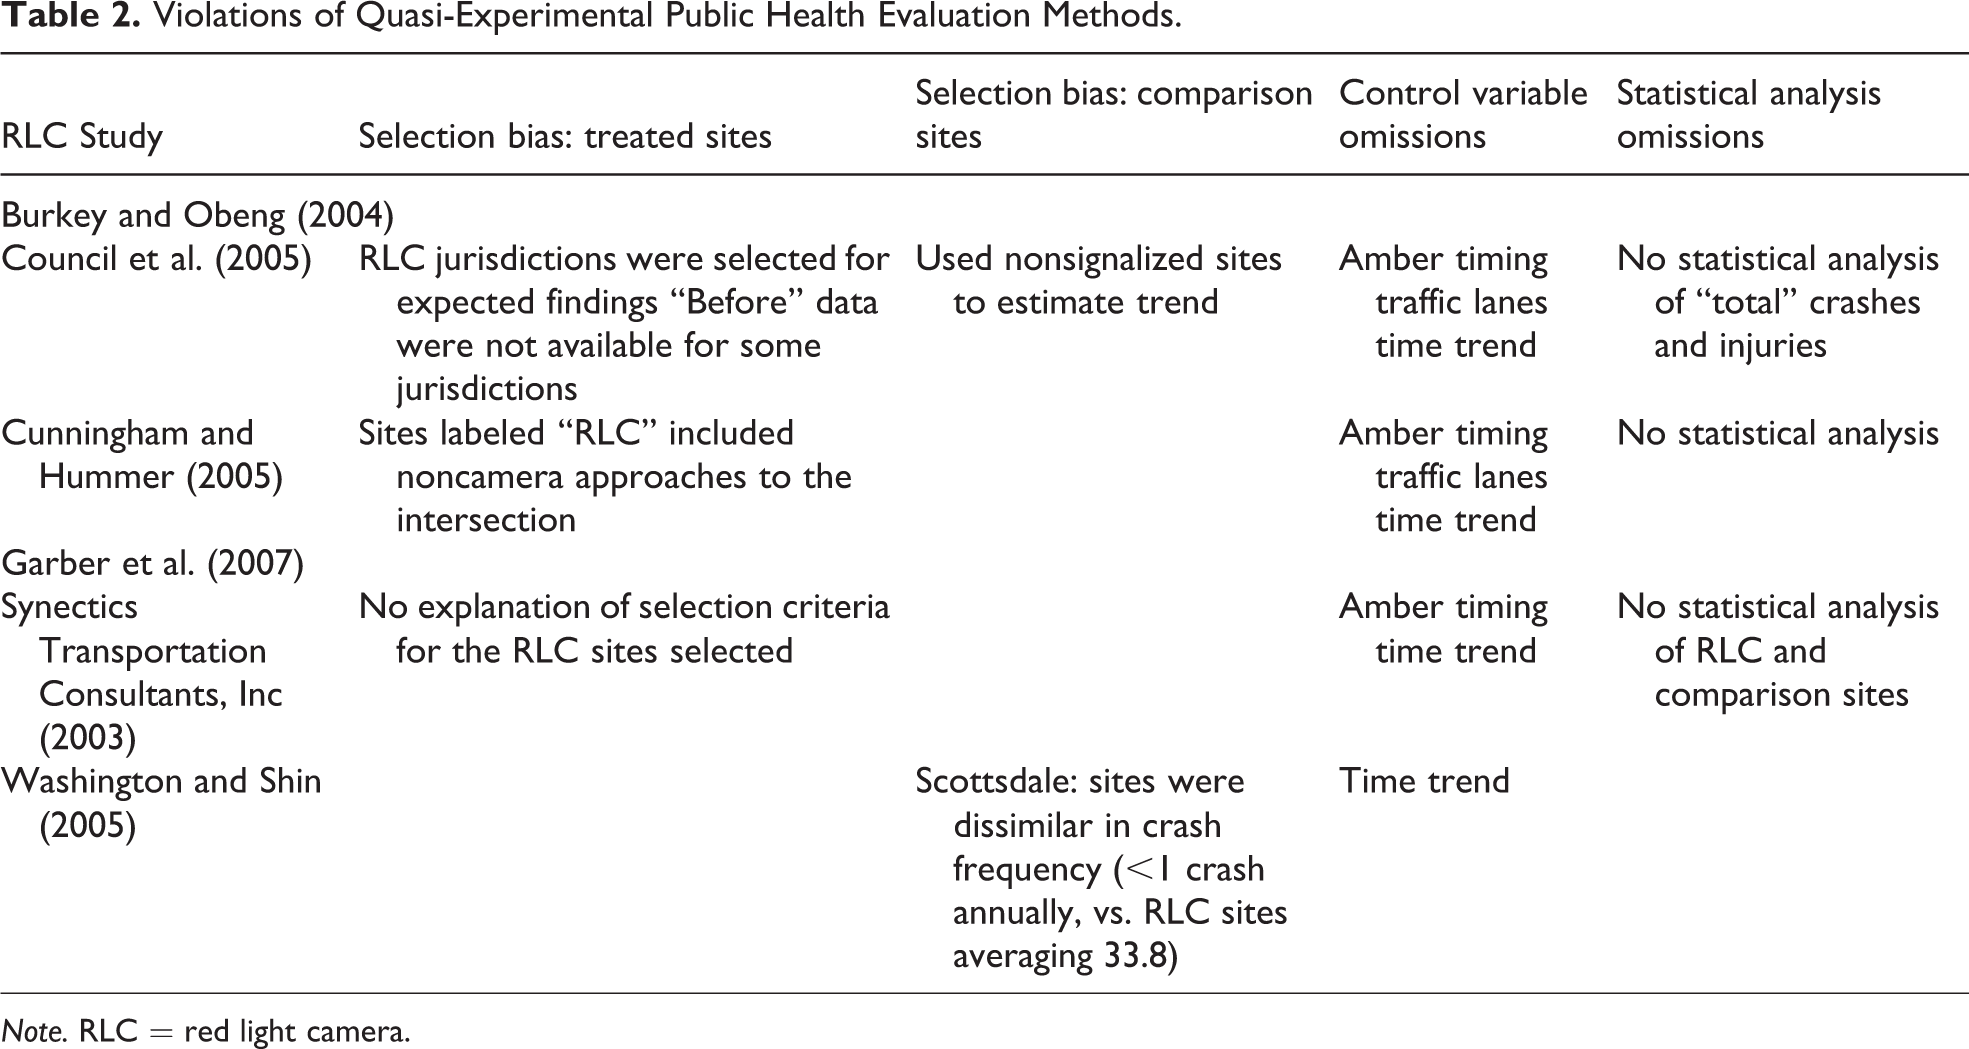
Note. RLC = red light camera.
Selection of RLC Sites
Four of the six studies used all RLCs in the jurisdictions studied. In contrast, the Synectics Transportation Consultants selected 19 of the 68 RLC sites absent reporting the selection criteria. Council et al. (2005) reviewed 15 jurisdictions with RLCs and then chose 7 to analyze since favorable results were anticipated. Cunningham and Hummer (2005) merged outcomes from RLC sites with non-RLC sites. They included crash counts from all four intersection approaches, whereas an RLC was installed in only one of the four approaches, meaning three fourths of the approaches deemed “treated” did not have an RLC.
Selection of Comparison Intersections
Cunningham and Hummer (2005), Garber et al. (2007), and Synectics Transportation Consultants limited the number of comparison sites, such that sites were selected to be similar to the treated intersections, based on angle crash frequency or intersection characteristics. In contrast, Burkey and Obeng (2004) used all other signalized intersections in the community as comparison sites; however, they controlled for intersection characteristics in their statistical analysis, thereby accounting for differences among intersections by using substantially more data. In the Washington and Shin (2005) analysis, one jurisdiction (Phoenix) used comparison sites with similar intersection characteristics and crash rates, whereas the other (Scottsdale) used comparison sites that averaged less than one crash per year. In contrast, the RLC sites averaged 33.77 annual crashes, making them systematically dissimilar from the comparison sites. Council et al. (2005) used nonsignalized intersections as comparison sites for the time trend, which were clearly dissimilar since they would not have red light running crashes in before or after time periods.
Independent Variables Integrated in the Analysis
Table 3 reports the independent variables integrated into each study’s statistical analysis. All studies claimed to integrate the average daily traffic volume in the analysis. However, Council et al. (2005) reported that a single traffic volume was used for some jurisdictions for both before and after time periods, such that changes in traffic volume were not accounted for between the two study periods.
Independent Variables Included in the Analysis.
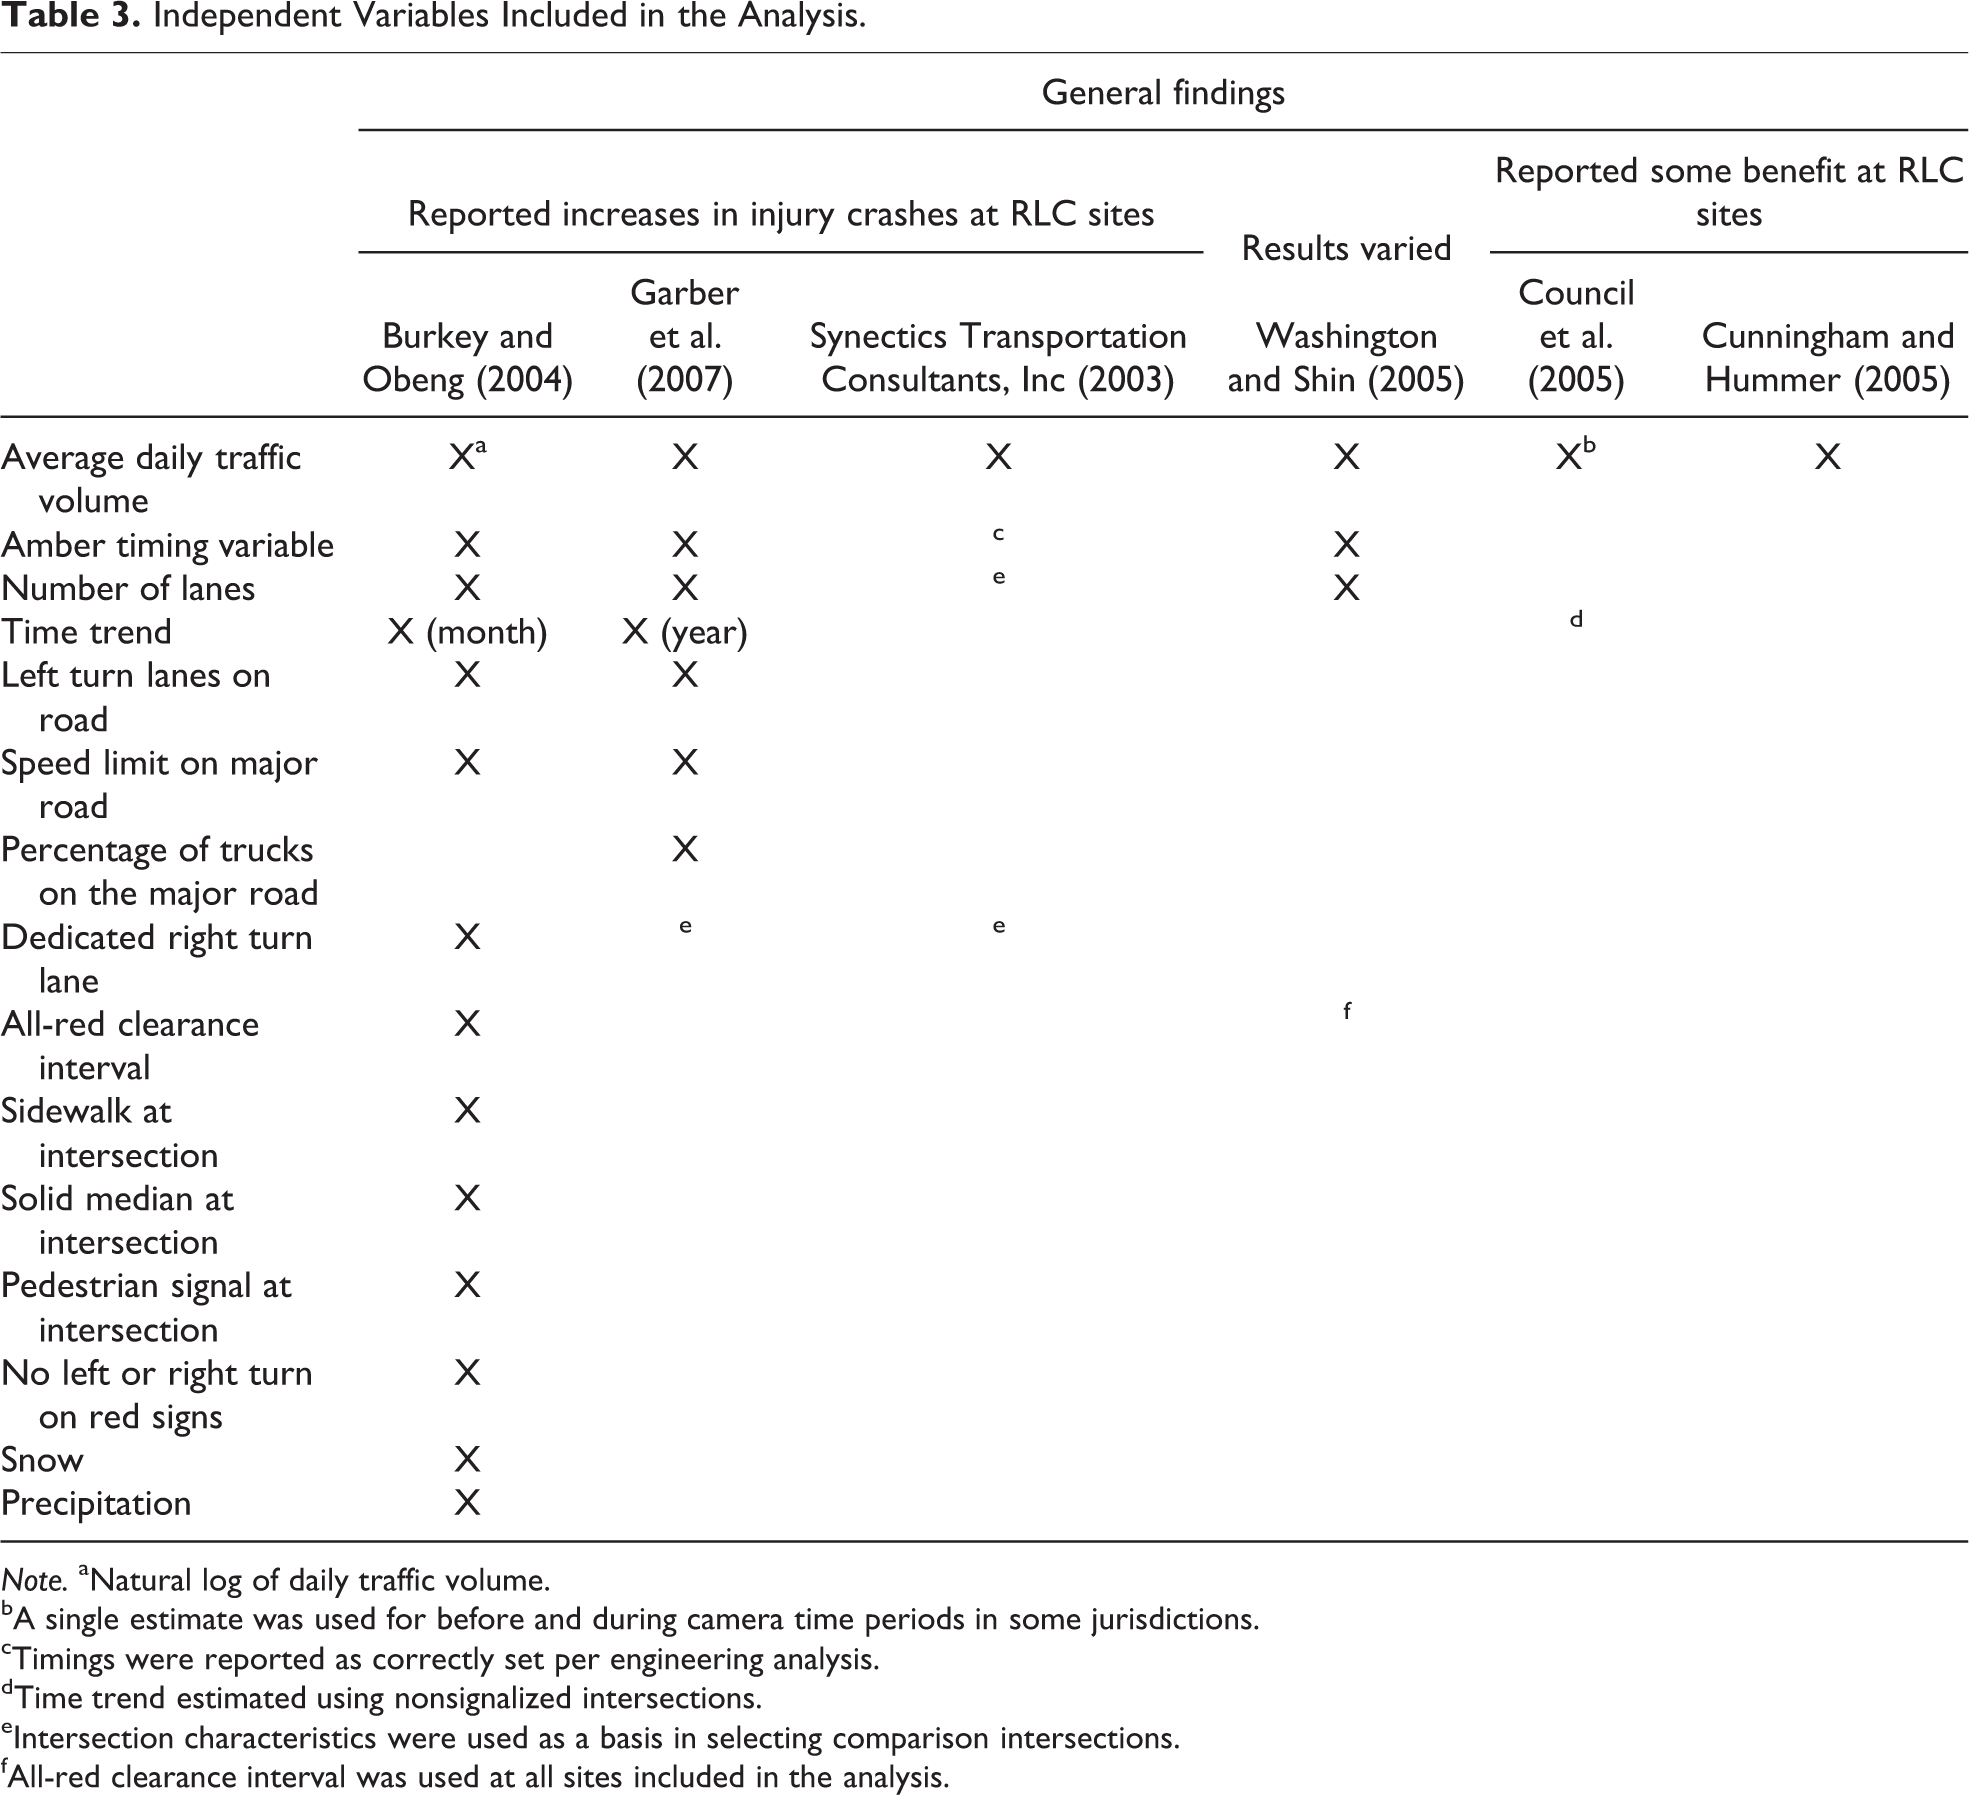
Note. aNatural log of daily traffic volume.
bA single estimate was used for before and during camera time periods in some jurisdictions.
cTimings were reported as correctly set per engineering analysis.
dTime trend estimated using nonsignalized intersections.
eIntersection characteristics were used as a basis in selecting comparison intersections.
fAll-red clearance interval was used at all sites included in the analysis.
Only three studies included an amber light timing variable. Washington and Shin (2005) used the actual light timing, whereas Burkey and Obeng (2004) and Garber et al. (2007) used the difference between the actual and recommended timing. In contrast, Synectics Transportation Consultants reported that amber timings were correctly set per engineering analyses. Council et al. (2005) and Cunningham and Hummer (2005) excluded this variable. Only three studies integrated the number of lanes in their analyses (Burkey & Obeng, 2004; Garber et al. (2007), and Washington & Shin, 2005), and only two studies integrated a time trend (Burkey & Obeng, 2004; and Garber et al. (2007)).
In addition, Garber et al. (2007) included the percentage of trucks on the road, as trucks can create line of sight problems. Burkey and Obeng (2004) integrated snow and precipitation factors, in addition to an all-red clearance interval variable, in their analysis. Washington and Shin (2005) stated the all-red interval was used at all treated and comparison sites. In 2000, federal standards were modified making the use of a brief (e.g., one to two seconds) all-red clearance interval optional when a traffic signal changes to red, meaning cross traffic can be released while vehicles are still in the intersection (Office of Majority Leader, 2001).
Complete Reporting of Statistical Analysis
Burkey and Obeng (2004) and Garber et al. (2007) disclosed major findings from their statistical analyses. In contrast, Cunningham and Hummer (2005) did not test for statistical significance and reported findings as percentage changes, absent any count data. The Synectics Transportation Consultants evaluation also reported findings as percentage changes. It concluded RLC sites had a 2% increase in injury/fatal crashes, whereas comparison and enhanced police enforcement intersections had decreases of 12 and 10%, respectively, but did not provide a statistical analysis of the difference.
Council et al. (2005) reported counts for angle and rear-end crashes, reporting a 24.6% decrease in angle crashes and a 14.9% increase in rear-end crashes. However, they did not analyze the change in total crashes or total injury crashes. Since rear-end crashes are more frequent, the change was 4 fewer crashes and 23 fewer definite injury crashes than expected during the 370 RLC site years evaluated in the study.
Washington and Shin (2005) found RLCs in Phoenix were not associated with a change in crashes, and reported an 11% decrease in crashes in Scottsdale. However, this decrease was not significant as the confidence interval overlapped with that of the comparison group.
Burkey and Obeng (2004) and Garber et al. (2007) (Empirical Bayes analysis) were the only studies among the six that adhered to all four standards identified for RLC evaluations, and are the only studies that should be included in a meta-analysis. However, to create a funnel plot for a meta-analysis requires a minimum of three studies, and a minimum of 10 are needed for testing funnel plot asymmetry. Nonetheless, the findings of the two studies do not conflict. Both found large increases in rear-end crashes and neither reported a decrease in angle crashes. Both evaluations reported a significant and large increase in crashes, and a significant increase in possible injury or injury crashes, respectively. The larger study conducted by Garber et al. (2007) may account for the finding of statistical significance regarding the 18% increase in injury crashes. In analyzing more sites and longer time periods, Garber et al. (2007) achieved increased statistical power. Garber et al. (2007) used an Empirical Bayes method, which estimates outcomes using the before experience to compare with outcomes after the intervention. Alternatively, Burkey and Obeng (2004) used a negative binomial regression analysis. Garber et al. (2007) selected comparison sites with similar intersection characteristics as RLC sites, whereas Burkey and Obeng (2004) accounted for the confounding influence of these characteristics by incorporating them in their regression analysis. Despite the differences in approaches to account for nonrandom variances in intersection characteristics, the findings do not conflict.
Discussion
The findings from the six RLC evaluations were driven substantially by differences in the data, variables, and study design used. Adhering to two of the four proposed RLC evaluation standards required collecting and integrating the relevant data. For example, Cunningham and Hummer (2005) had intersection data that were not specific to the RLC approaches, which compromised their study’s validity. Also, findings differed among studies when independent variables that are known to have a causal relationship with changes in crashes were omitted from the analysis; the resulting omitted variables bias manifests itself as the model compensates for the missing factors by over (or under) estimating the impact of the remaining variables. Burkey and Obeng (2004) and Garber et al. (2007) integrated more contributing factors in their analyses than the other studies, and their findings were similar and definitive. The following six variables were used in both analyses and should be integrated in any community’s analysis of their RLC program: average daily traffic volume, amber timing variable, number of traffic lanes, time trend, left turn lanes, and speed limit. With regard to the studies that did not integrate these variables, it is unknown whether the data were available to the researchers. The paucity of sound RLC program evaluations may be due to insufficient data as the cost of collecting the substantial data needed may be prohibitive for some communities and data collection must be planned in advance of the RLC intervention.
Further, differences were observed regarding the selection of comparison sites. RLCs are often located at sites with higher traffic volumes and numbers of crashes. Since comparison sites should be similar to the treated sites, if an RLC evaluation is planned, it is necessary to avoid treating all high crash sites in order to have comparable sites for use as controls. The selection of control sites to match treated sites can be a difficult problem to adequately solve, especially if meaningful matches do not exist. However, an analysis such as Washington and Shin (2005), which compared treated sites in Scottsdale that averaged 33.8 crashes annually with comparison sites that averaged less than one crash annually, was an unsound effort in identifying a control group as it ignored the potential for substantial regression to the mean. Also, the Burkey and Obeng (2004) decision to use all non-RLC signalized intersections in the same community required extensive data to account for differences among all intersections, which is inefficient relative to identifying similar comparison sites.
Two of the analyses created an appearance that the study design was intended to have favorable RLC findings. Council et al. (2005) disclosed that they selected 7 of the 15 RLCs programs for analysis because they anticipated favorable findings, thereby excluding 8 programs with apparently less favorable results. Further, they omitted analyzing changes in total crashes and injury crashes, which avoided disclosing that a meaningful change did not occur. The Synectics Transportation Consultants study had data for both before and after time periods, but their statistical analysis merged the RLC findings with the outcomes from the comparison sites and sites that were treated with a different intervention (stepped-up police enforcement). Thus, they had the data to conduct a quasi-experimental research study but opted to use a nonexperimental design in their statistical analysis, comparing before and after periods for all sites included in the study. Since the comparison sites and stepped-up police enforcement sites had better injury/fatal crash outcomes than the RLC sites, the study’s statistical design obfuscated the actual results at RLC sites.
Further, standardization did not exist in the definition of outcome measures. For example, angle crashes were defined as including left turn crashes in some studies while excluded in others. Also, distances varied in defining intersection-related crashes. For example, Council et al. (2005) reported some jurisdictions defined intersection-related crashes as occurring within 20 feet of the intersection, whereas others used 158 feet. Such measurement differences can influence the findings. Definitions and measurement of variables should be standardized in motor vehicle safety research.
Three studies reported a higher incidence of fatal crashes at RLC sites than comparison sites (Council et al., 2005; Garber et al. (2007), Washington & Shin, 2005) and the Synectics Transportation Consultants study reported a higher incidence of fatal/injury crashes. Burkey and Obeng (2004) reported a nonsignificant increase in severe crashes, which included fatal accidents. These findings suggest that RLC analyses should report injury counts by severity, including fatalities.
While ecological studies of regional evaluations of crash data have two distinct advantages, lower cost and availability of crash data, this approach is associated with its own statistical challenges and requires great care lest the results be rendered invalid. A cataloging of potential statistical downfalls include nonlinearity, incorrect measurement of an outcome, nonzero expected disturbances, nonspherical disturbances (e.g., heteroscedasticity and autocorrelation), and measurement error. The presence of any of these statistical difficulties may render the results spurious and without validity if they are not adequately accounted for. Of particular importance in RLC research is the selection of treatment sites which may be chosen for their unusually high rate of crashes, as was the case in Washington and Shin (2005). In other words, using the presence of an RLC at such an intersection, to explain an outcome such as the number of crashes, is problematic as it is itself a dependent variable.
In conclusion, the identified four standards should be used by communities when conducting an RLC program evaluation. To avoid spurious results, future investigators should assess the statistical power of their studies to make sure they can meaningfully detect or reject the hypothesized effect. Investigators should perform a sample size calculation before the evaluation to avoid conducting studies that are underpowered. The choice of the number of controls per RLC site needs to be determined prior to study, based on effect size, variability, and cost. It is inadvisable to seek a control to case ratio greater than four, as further increase does not lead to much improvement in the efficiency (Rothman & Greenland, 1998). The effect sizes should be based on preliminary data or published studies and should reflect an effect on safety. Both the anticipated favorable effects (reducing angle crashes) and the negative effects (increasing in rear-end collisions) of RLC should be considered in the sample size and power analysis, as the primary and secondary outcomes, respectively.
There are several important implications for communities and policy makers to consider. First, the Federal Highway Administration (2005) has developed guidelines on the use of RLCs, which explain red light running occurs for many reasons, including intersection design, vehicle characteristics, weather, and driver behavior. The first recommended step is to document that a red light running problem exists through data collection. Crash data are the most comprehensive, although violations can also be used. Data collection is also recommended for signal timings, number of traffic lanes, number and location of signal heads, speed limits, street lighting, road grades, traffic volumes, visual obstructions, and the proportion of tall or wide vehicles. Agencies are then advised to conduct an engineering analysis to identify indicated engineering countermeasures that can be used to reduce red light running, such as lengthening yellow light timings, adding signal heads, modifying the road grade, or improving sight lines. It is recommended the engineering analysis be fully documented to address any concerns from the public should RLCs be subsequently used. The guidelines also identify education and traditional enforcement as possible interventions. If RLCs are used, the placement of cameras should be based on red light running crashes and/or violations, as high crash intersections may not have a high number of red light running crashes. High crash intersections often result from left turns on high traffic volume roads, unrelated to red light running. The guidelines conclude by stating the results of the RLC program should be communicated to the public.
For results to be communicated, an RLC program must be evaluated. When agencies conduct the engineering analysis that precedes camera use, the data will then be available as the “before” period data for an evaluation. Evaluations should adhere to the standards identified in this study. When deviations from these standards occur, debate about RLC effectiveness can remain unresolved. For example, the Florida legislature’s Office of Program Policy Analysis and Government Accountability (OPPAGA, 2014) conducted an evaluation of RLCs on state roads. It concluded rear-end crashes increased by 35% and angle crashes increased by 22%. Camera opponents have used the study to contend cameras were ineffective while camera proponents point out the study lacked a comparison group, rendering it inadequate.
Finally, in states where laws allow RLCs, state or local public policy can require the Federal Highway Administration guidelines are followed. This would require documenting that a red light running problem exists before using cameras at an intersection. An engineering analysis would then be required and relevant countermeasures identified and implemented prior to camera use. Subsequently, the effectiveness of the program would be evaluated and the results disclosed to the public.
In both performance management and continuous quality improvement, any newly implemented intervention requires monitoring and evaluation to close the feedback loop. Merely employing RLCs without a credible analysis of performance assumes RLCs are a panacea, whereas the root cause at problem intersections can be factors other than intentional red light running, which is the sole focus of RLCs. Finally, RLC programs attempt to decrease angle crashes while expecting to increase rear-end crashes, which is an ethical dilemma that communities should address when considering whether or not to use RLCs.
Footnotes
Declaration of Conflicting Interests
The author(s) declared no potential conflicts of interest with respect to the research, authorship, and/or publication of this article.
Funding
The author(s) received no financial support for the research, authorship, and/or publication of this article.