
Abstract
The personal well-being index—school children (PWI-SC) is designed as a cross-cultural instrument to measure subjective well-being among high school–aged children. Several published cross-cultural studies have confirmed adequate psychometric performance in terms of reliability, validity, and measurement invariance. This study adds to this literature by applying the Rasch approach to estimate invariant comparison in a cross-cultural context, applied to both Australian and Portuguese high school students. Participants were an age- and gender-matched convenience sample of 1,040 adolescents (520 cases in each group, 51.54% male) who ranged in age from 12 to 18 years (M = 14.25 years, SD = 1.71 years). It is found that both Portuguese and Australian data fit the Rasch measurement model, with excellent levels of reliability at a country level. However, when all of the data were combined, a slight misfit was found. This was resolved by removing some issues with item thresholds in standard of living among the Australian data and splitting the data by country on health. This allowed both Australian and Portuguese cases to differ on the health item. We conclude that the PWI-SC is unidimensional, with some evidence of mild, but acceptable local dependency. This study further supports the cross-cultural validity of the PWI-SC and the use of this measure in the Australian and Portuguese context but also indicates a potential direction that development of the PWI-SC might proceed.
The child and adolescent subjective well-being (SWB) literature has experienced dramatic growth in recent years. This has been spurred by the recognition that all children have a right to achieve their potential and experience happiness. Such aspirations can be facilitated by the use of reliable and valid subjective social indicators to inform public policy, national performance, and progress. Essential to this measurement agenda are scales with robust psychometric properties, which function equivalently between cultural groups. To this end, the International Wellbeing Group (IWG, 2013) champions the personal well-being index (PWI) for use with adults.
The PWI is a domain-based measure of SWB that generates a composite variable, calculated by averaging life satisfaction scores on seven life domains. These domains represent the first-level deconstruction of general life satisfaction measured through a single question of “satisfaction with life as a whole,” an adaptation from Andrews and Withey’s (1976) original measure. Together, the seven domains represent SWB.
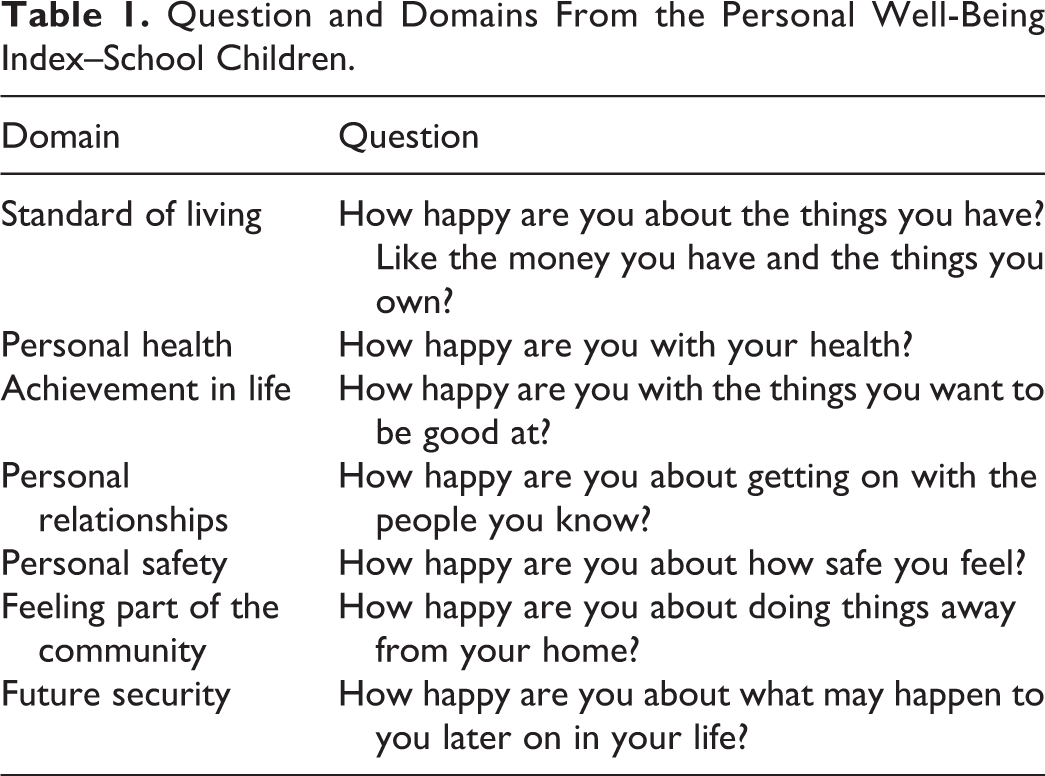
The personal well-being index—school children (PWI–SC; Cummins & Lau 2005) was developed as a parallel scale to the adult version, for use with high school–aged children. Some items have been reworded from the adult version to increase the understanding and relevance for adolescents, while still retaining the essence of the original adult scale. For example, the item “How satisfied are you with your future security?” is modified to “How happy are you about what may happen to you later on in your life?” The PWI-SC also differs from the adult PWI in that respondents indicate their level of “happiness” rather than “satisfaction.” The Response Scale uses happiness, rather than satisfaction, because the former term is better understood by children. While it is recognized that these two terms are not equivalent, they yield very similar data (Cummins, Eckersley, Pallant, Misajon, & Davern, 2001; Cummins, Eckersley, Pallant, Van Vugt, et al., 2001; Lau, Cummins, & McPherson, 2005).
The PWI–Adult has been translated and evaluated in 27 different languages, and the PWI-SC has been translated and evaluated into six languages. A number of recent studies have explored the psychometric performance of the PWI-SC in various groups. Examples are mainstream, Indigenous, and “at-risk” adolescents in Australia (Tomyn & Cummins, 2011b; Tomyn, Cummins, & Norrish, 2015); adolescents in Spain, Brazil, and Chile (Casas et al., 2012); in Algeria (Tiliouine, Cummins, & Davern, 2006); Austria (Renn et al., 2009); and Hong Kong (Lau, Cummins, & McPherson, 2005); and among New Zealand Maori (Ganglmair-Wooliscroft & Lawson, 2008). The associated analyses have ranged from traditional tests of reliability and validity (e.g., Cronbach’s α and correlations with other measures) to more sophisticated tests of factorial invariance using confirmatory factor analysis (e.g., Casas, Tiliouine, & Figuer, 2013; Tomyn, Fuller-Tyszkiewicz, & Cummins, 2013; Tomyn, Fuller-Tyszkiewicz, & Norrish, 2013; Tomyn, Tamir, Stokes & Dias, 2015).
Of basic psychometric concern is that the PWI-SC functions reliably when translated. Casas et al. report that PWI-SC attained a Cronbach’s α of .80 in three separate populations (Spain, Brazil, and Chile), while within the Algerian translation, Cronbach’s α was found to be .85 (Tiliouine et al., 2006). Within the Austrian–German translation, Cronbach’s α was reported as being .85. The Chinese version attains a slightly lower Cronbach’s α of .75 (Lau et al., 2005). A Hindi version obtained a Cronbach’s α of .74 (Singh, Ruch, & Junnarkar, 2015). In all of this research, the instrument has been found reliable and to be have convergent validity with other assessments of SWB (cf. Casas et al., 2012; Lau et al., 2005; Renn et al., 2009; Singh et al., 2015).
While this work has demonstrated that PWI-SC has adequate psychometric properties and cross-group equivalence within the populations employed, the scale is yet to be psychometrically evaluated using the Rasch measurement model. Rasch models provide a number of critical evaluations that aid in understanding both validity and reliability. They provide clear assessment of unidimensionality (that items load onto a single dimension), assessment of ordinality of response thresholds (that respondents select proportionally higher categories of response as their trait increases), and interval stability (the property that intervals between measured items are meaningful distances, reflecting the degree of trait, and not simply arbitrary units; Bond & Fox, 2007; Embretson & Reise, 2000). Unidimensionality has previously been established in Australian samples using a factor model approach (e.g., Misajon, Pallant, & Bliuc, 2016; Tomyn, Tamir, et al., 2015). However, the Rasch approach is more rigorous (Bond & Fox, 2007; Embretson & Reise, 2000).
Before proceeding to describe the Rasch measurement approach, it is important to declare our theoretical framework. While numerous theories of SWB have been proposed over more than four decades, one with substantial empirical credentials is SWB homeostasis theory (Cummins 1995, 2010, 2016). This theory is underpinned by the recent demonstration of SWB set points (Capic, Li, & Cummins, 2018; Cummins, Li, Wooden, & Stokes, 2014). Homeostasis theory asserts that SWB is managed for each person around their set point by a system of psychological devices that have evolved for this purpose. These include the processes of adaptation, the use of external resources such as money and relationships, to defend against external challenges, while internal resources such as secondary control are used to manage the perceptions of personal failure (Cummins, 2018a, 2018b; Cummins & Nistico, 2002). Findings by Cummins, Li, Wooden, and Stokes (2014) suggest that individual set points normally range between 70 and 90 points on a standard 0–100 point range. Moreover, the distribution of set points within this range is normal, yielding a theoretical population mean score of 80 points. More recently, this conclusion was confirmed by Capic and Cummins (2018).
The goal of homeostasis is to defend the affective core of SWB, termed homeostatically protected mood (HPMood). The level of HPMood approximates the genetically determined set point for each person (Capic et al., 2018) and provides a weak background level of positive, mildly activated mood. While the level of this mood is unchanging for each person and constitutes an individual difference (Cummins, 2016), the moment-by-moment level of SWB is also determined by the affect of emotions, as the person reacts to external and internal percepts. Homeostasis acts on these emotions to normally bring SWB back to a level that approximates set point. This homeostatic maintenance of SWB accounts for the positive and stable nature of SWB frequently observed within the literature (e.g., Blore, Stokes, Mellor, Firth, & Cummins, 2010; Capic & Cummins 2017; Cummins et al., 2014; Headey & Wearing, 1989). For a comprehensive review of SWB homeostasis theory, see Cummins (2016).
Rasch Modeling
Measurement validity requires that an instrument consistently evaluates the construct that it is designed to measure. It must therefore be consistent across individuals and levels of ability and thus, must demonstrate ordinality, where each successive response option (i.e., 0, 1, 2…) reflects a greater level than the one before; and stability of interval, where the difference between measurement intervals is constant (Bond & Fox, 2007). The Rasch model reveals the stability of the response intervals as the consistent distance between each graduation of the measurement scale. This consistency requires that the strength of the trait must increase before the next graduation will be selected (Embretson & Reise, 2000).
The Rasch model also measures unidimensionality, which is the property of systematically measuring a single dimension; here happiness or satisfaction. If the measure in question is contaminated with some different construct, such as self-esteem, then the measurement instrument will fail to display this property. A demonstration of unidimensionality is obtained when two conditions are met. First, that all items measure the same underlying construct, and second, that scores increase as the underlying strength of the construct increases. The property of unidimensionality cannot be validly inferred from measures of reliability, such as Cronbach’s α (Embretson & Reise, 2000). Cronbach’s α is simply a measure of the extent to which items correlate together and can be easily manipulated, for example, by adjusting the number of test items (Nunnally, 1978; Sijtsma, 2009; Ten Berge & Sočan, 2004).
A further feature of the Rasch model is that it facilitates the evaluation of differential responding by different groups of respondents, known as differential item functioning (DIF). This makes it possible to compare groups for a difference in their probability of selecting a given level of any item, provided that the level of the underlying trait is the same. This is based upon each individual’s total score and their assignment to a class interval representing their broad trait level. The DIF analysis then evaluates whether the data differ systematically by class interval or by the interaction of class interval by group on an item. DIF analysis demonstrates much of the same information as measurement invariance analysis. That is, it requires that the conditional probability of selecting values on a measure of a latent construct does not vary systematically by respondent group (Millsap & Olivera-Aguilar, 2012). However, DIF analysis provides additional information about the nature of differences from the associated Rasch analysis. This includes the nature of scoring where, for example, failing at an easy item despite demonstrating high scores on all other items. This would indicate that the measure was not interpreted in the same way by different groups or individuals of different ability (i.e., different class intervals) and that the instrument would need revision. DIF analysis, occurring within a Rasch context, additionally provides information on the scale differences between groups. For instance, this would reveal whether one or more groups respond at higher or lower values than others groups.
The Rasch approach was recently applied to the adult PWI by Misajon, Pallant, and Bliuc (2016). Using a sample of 593 (53.1% female) Australian (n = 265) and Canadian (n = 328) adults aged 18 years and over, these authors determined that the 7-item scale showed good model fit, excellent person separation, no item or person misfit, no DIF for country or gender, and unidimensionality was supported. They also conclude that the 11-point response format was suitable for this population. These results support the use of the Rasch approach in the current study.
Study Aims
The aim of this study is to establish whether the SWB of adolescents, from both Portugal and Australia, can be validly and reliably measured by the PWI-SC. The Rasch analysis will make specific reference to unidimensionality, ordinality of response thresholds, and interval stability. Last, we aim to establish whether Australian English-speaking adolescents systematically differ in their use of the PWI-SC from Portuguese adolescents.
Method
Participants
The Australian participants were a convenience sample of 1,104 Victorian high school students aged between 12 and 19 years (M = 14.42, SD = 1.63). There were 682 males (61.8%) and 422 females (38.2%). The Portuguese adolescents were a convenience sample of 573 high school students ranged in age from 12 to 18 (M = 14.30, SD = 1.72). Both samples were from middle class, metropolitan areas. Extreme cases (i.e., PWI > 99 or PWI < 1) were removed from the data for two reasons. First, this is the recommended procedure within the PWI manual (IWG, 2013) based on the recognition that such scores, representing the scale maximum or minimum on all seven domains, likely represent either acquiescent responding or intentional distortion. Second, such data cannot contribute to model fit assessments. There were only 18 of these in the data, all with PWI > 99, 7 in the Australian and 11 in the Portuguese data. Participants were then randomly matched on age and gender only to ensure differences between the samples could not be attributed to these variables. Age matching was to within 3 months, and the gender match was exact. This left 520 matched cases (51.54% male) in each group. Participants ranged in age from 12 to 18 years (M = 14.25, SD = 1.71).
Measures
SWB was measured using the PWI-SC (Cummins & Lau, 2005). The PWI-SC asks respondents to indicate their level of happiness with seven life domains as standard of living, health, achieving in life, relationships, safety, community connection, and future security (see Table 1), using an 11-point end-defined rating scale ranging from 0 (very sad) to 10 (very happy), with the midpoint at 5 (not happy or sad). All PWI-SC data have been standardized to a percentage of scale maximum, which converts data onto a 0–100 scale (Cummins & Lau, 2005). Previous research reports good internal reliability (Cronbach’s α = .82) and construct validity for this scale in Australia, with a one-factor structure that accounts for approximately half of the variance (Tomyn & Cummins, 2011a). The Portuguese students completed a Portuguese translation of the PWI-SC, with adequate psychometric properties reported by Dias and Bastos (2014).
Question and Domains From the Personal Well-Being Index–School Children.
Procedure
The Australian data were collected from three independent high schools across two studies conducted in the Melbourne metropolitan region in 2010 and 2011. Following human research ethics approval, Plain Language Information Statement and consent forms were distributed to students, and only those students who returned signed parent or guardian consent forms then received the pencil and paper questionnaire, which they completed in their regular class time.
Following ethics approval, the Portuguese data were collected in Portugal from two public schools in 2012. After obtaining parental consent, students completed the PWI-SC in their classrooms. A secondary, deidentified data set was sent via e-mail from the Portuguese research partner to Australia for data cleaning and analysis.
Data Analytic Strategy
Prior to establishing whether the two groups of respondents differ in the way they respond to the PWI-SC, it was necessary to establish whether the data from each country fit the model. Once separate model fit was confirmed, the overall model fit was tested by combining the data from both country groups. Following establishment of overall model fit, item thresholds were examined by country to establish whether either group responded to thresholds differently within the PWI-SC. This was followed by an exploration of scale unidimensionality across all data. Finally, analysis was undertaken contrasting both sets of data.
There were no missing data. A Rasch model was then assessed across four parameters (location, scale, kurtosis, and skewness; giving 28 parameters to fit for 7 items). As the data used here (a) may, following recoding, have items with different numbers of thresholds and (b) would have a value assigned to each choice, a Rasch model was deemed the most appropriate model to evaluate (Bond & Fox, 2007). Model fit criteria used herein were based upon the standards accepted through the literature (Bond & Fox, 2007; Curtis, 2004; Pallant & Tenant, 2007; Sheridan, 2015; Smith, 2000. Smith, Rush, Fallowfield, Velikova, & Sharpe, 2008). Models were all fitted to a convergence criterion of .001 or smaller, unless otherwise stated.
Data were analyzed in RUMM2030 (Andrich, Sheridan, & Luo, 2010). Data for Australians and for Portuguese were initially examined separately to establish that both groups fitted the Rasch model. Thereafter, the threshold maps were examined to establish whether all thresholds for each item functioned as expected. Next, the distribution of person-item thresholds was investigated to clarify whether item thresholds were adequately measuring individuals at all levels of PWI-SC. Following this, unidimensionality was examined for local dependency and by examining both the factor structure of the data and a principle components analysis of residuals. Finally, in order to establish whether the adolescent groups from Portugal and Australia were responding similarly to the items, we undertook a DIF analysis.
Results
Item Response Analysis
Data for both samples were found to fit the model, Portuguese: χ2(63) = 71.83, p = .21; and Australian: χ2(63) = 53.52, p = .80. The person separation index (PSI), an indicator of interitem reliability, derived from estimated variance for persons relative to total variance, were acceptable for Portuguese and Australian data (.79 and .77, respectively) as were Cronbach’s α values (.84 and .80, respectively).
The mean residual item fit values (a measure of fit discrepancy which should be less than ±2.5; Curtis, 2004; Pallant & Tenant, 2007; Sheridan, 2015; Smith, 2015) for Portuguese data were −.28 (SD = 1.77). Mean person location values (which describe the mean value on the logit-transformed scale where items have a mean of 0; Bond & Fox, 2007) were 1.27 (SD = 0.68) with mean person residuals being −0.62 (SD = 1.45). For the Australian data, the mean residual item fit values were −.26 (SD = 0.76). Mean person location values were 0.85 (SD = 0.62) within mean person residuals being −.51 (SD = 1.34). No item for either group had excessive fit residuals. Person fit was explored and 46 (8.8%) Australian cases and 57 (10.2%) Portuguese cases were found to have poor fit to the model (9.5% overall). Both Portuguese and Australian data were examined for disordered thresholds, where individuals provided a response that is inconsistent with their composite PWI-SC score (e.g., a PWI-SC of 80 and a score of “0” on health). Portuguese data had no disordered thresholds, but Australian data revealed disordered thresholds on Item 1 (standard of living; see Figure 1). Within Figure 1, Category 0 has a 95% probability at location scores of −4, which represent lower PWI-SC, while Category 10 has a probability of 85% at location 3, representing higher PWI-SC. Intermediate categories represent choices on the PWI-SC Scale (i.e., 0, 1, 2,…, 10). It may be seen that Categories 1, 2, and 3 never exceed the values for Categories 0 and 4. For all values of Categories 1, 2, and 3, either Category 0 or Category 4 is always more probable, as revealed by the value on the vertical axis, and therefore these categories are never the most probable category at any level of SWB. Consequently, the threshold to choose Category 1, 2, or 3 is always less probable than to choose Category 0. Hence, the thresholds are disordered.
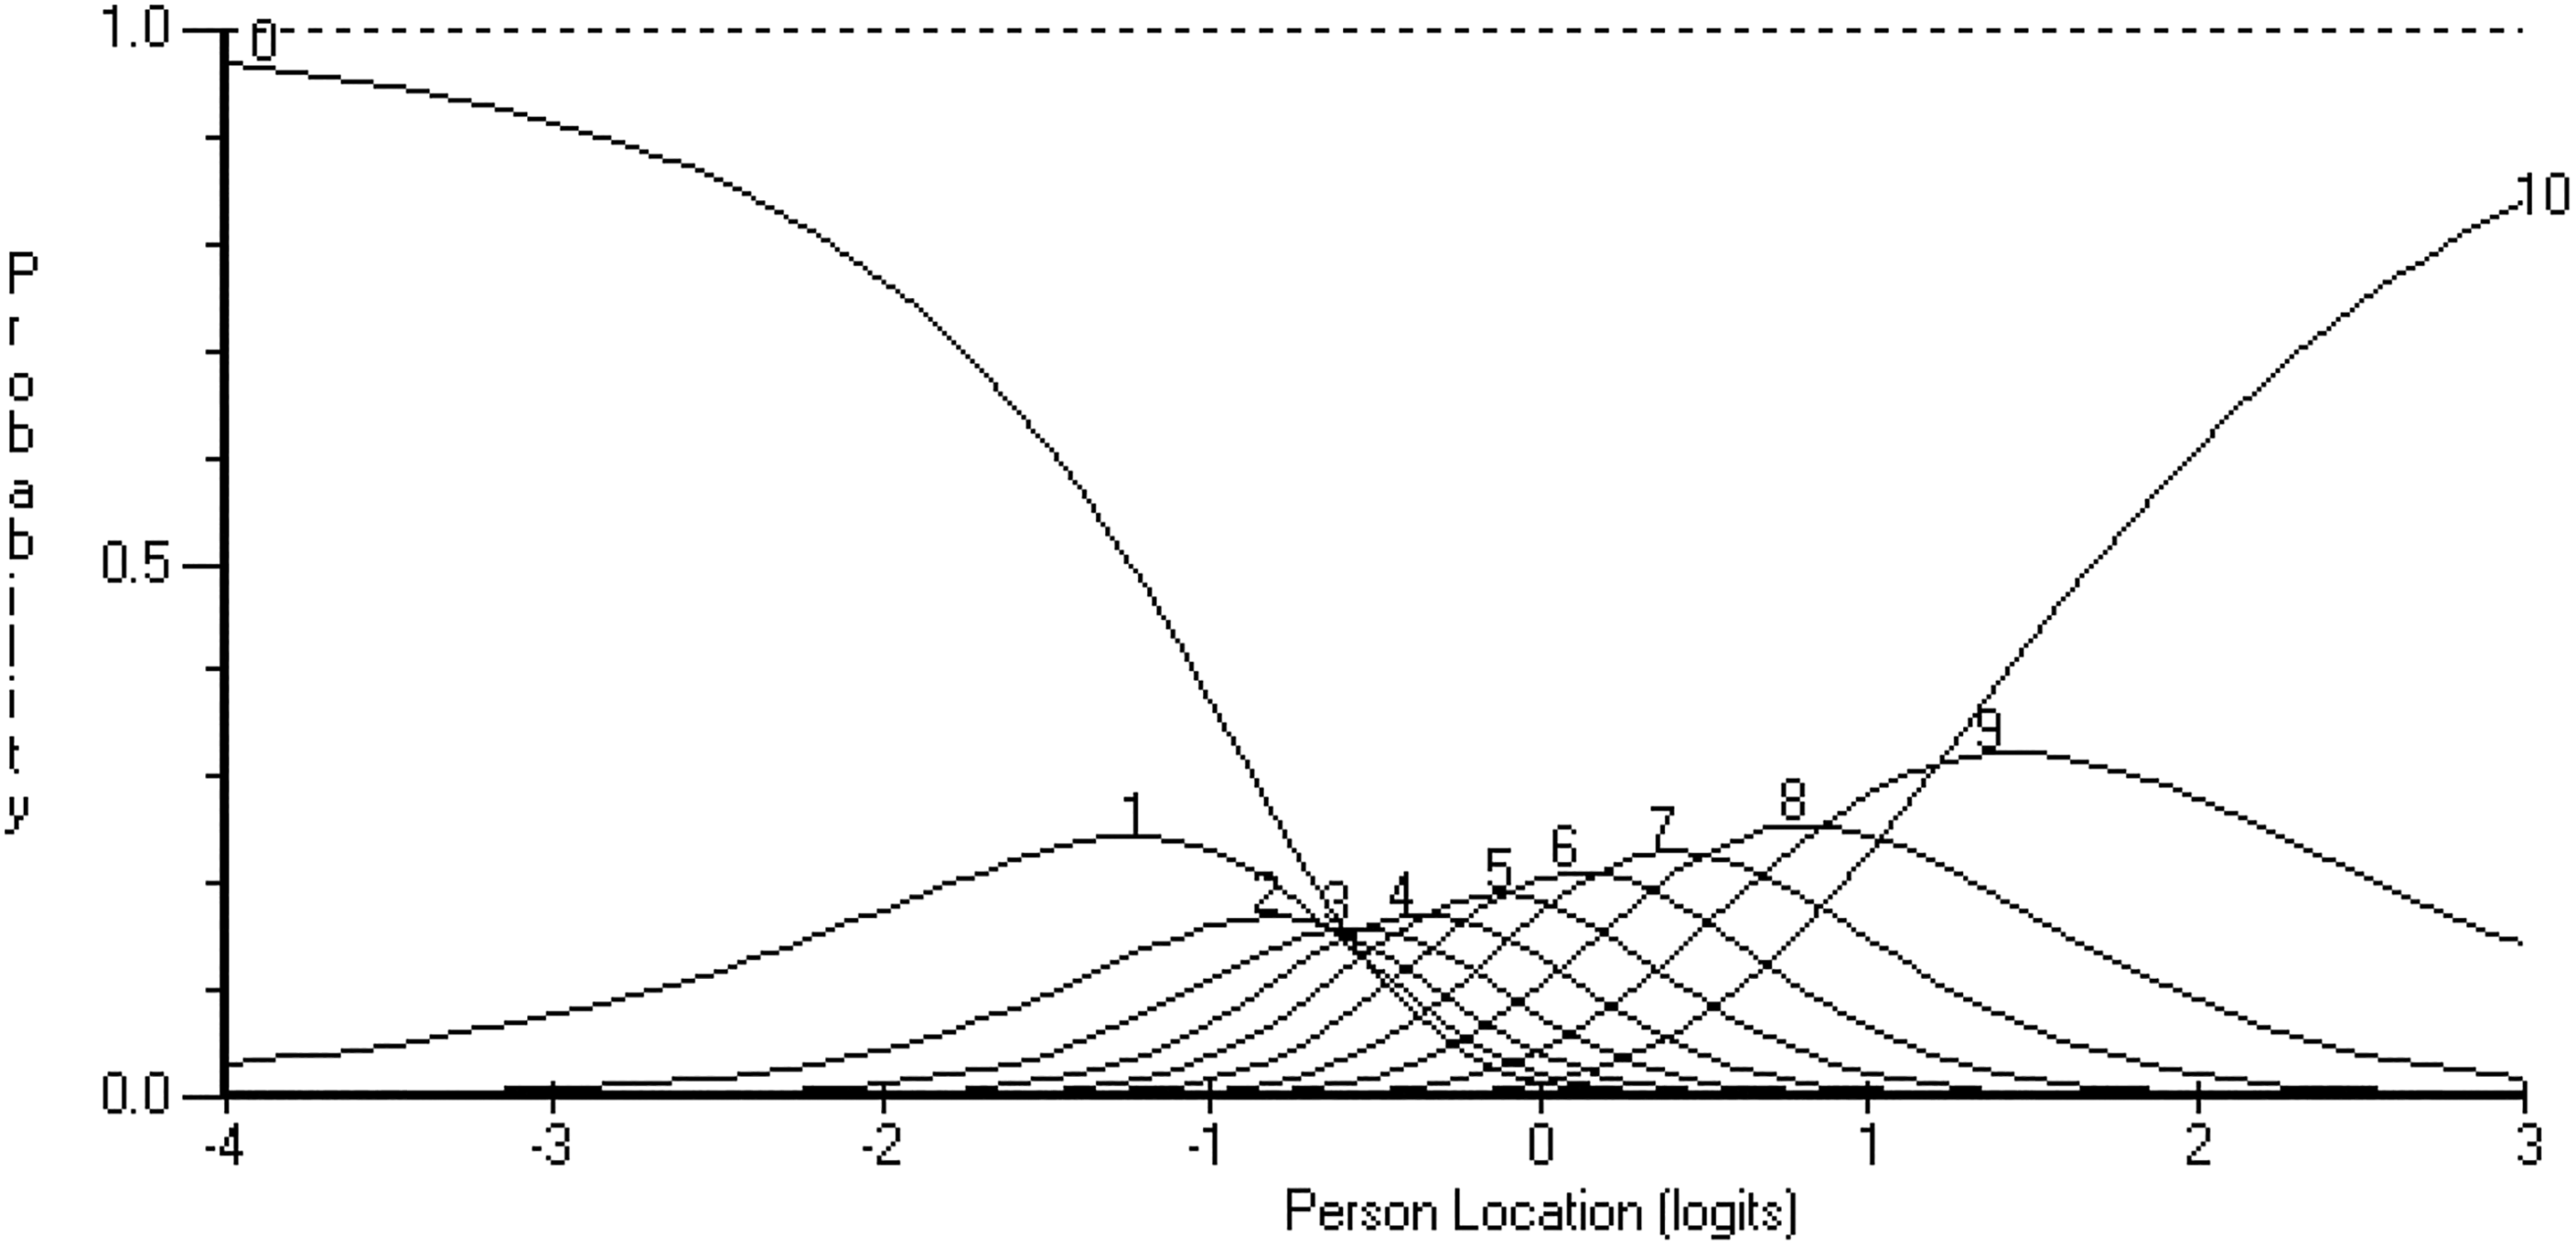
Category probability curves for Item 1 (standard of living; Australian data only). Each curve gives the probability of selecting a category (a score on the scale, i.e., 0, 1, 2,…, 10) at each level of personal well-being index—school children (location). The vertical axis describes the probability of choice, while the horizontal axis describes the strength of trait. A score of 0 on the horizontal axis is the strength of the mean item. Scores below this (i.e., negative) indicate levels of trait below the mean item value, scores to the right indicate those above this.
The PWI-SC domains for both Australian and Portuguese participants were evaluated together for overall model fit and was found to have very mild misfit, χ2(63) = 83.67, p = .04. Given the number of cases and observations (11 per item × 7 items × 1,020 respondents), this level of misfit was acceptable (Smith et al., 2008). Overall, model fit revealed the PSI was .78, and Cronbach’s α was .82. The mean item residual location was close to expected (M = −0.47, SD = 1.45), as was mean person location (M = 0.97, SD = 0.63) with mean person fit residuals also being close to the expected values (M = −0.59, SD = 1.44). Nonetheless, sources of the mild misfit were examined. While no item displayed excessive fit residual, Item 4 (relationships) had the largest fit residuals (−2.07). This item was examined and the lowest scoring 10% (class interval 1, n = 101) did not fit the model, χ2(1) = 6.45, p = .01, residual −2.54. Exclusion of these cases revealed the data fitted the model, χ2(63) = 82.65, p = .05. Given this group had only mild misfit, it was decided to retain rather than exclude these cases, and the original model fit was accepted.
Threshold Structure
Examination of the threshold maps was undertaken, successively higher values should tend to be selected as an individual obtains a higher PWI-SC. Only for Item 1 (standard of living; “How happy are you about the things that you have? Like the money you have and the things you own?”), thresholds were disordered. Examination of the category probability curves for standard of living suggested that Thresholds 1, 2, and 3 were disordered, and therefore, these were then collapsed into Category 3. While rescoring of Categories 0, 1, and 2 into a single category repaired the disordered thresholds, this had only marginal nonsignificant effect on the model fit, Δχ2(1) = 0.18, p = ns. Collapsing categories did not improve model fit. Consequently, the collapsed categories were not retained, but nonetheless, issues surrounding the disordered thresholds were explored further. Disordered thresholds were examined for each sample and were not evident in the Portuguese data but were apparent in the Australian data (Figure 1). Examination of the responses to this item was undertaken to establish which categories individuals selected. Had they selected categories commensurate with their PWI-SC score, it would have been expected that as percentile band decreased, successively lower categories would have been selected. Figure 1 reveals that the curves for Thresholds 1 and 2 fall under the curve for Threshold 0, meaning respondents selected Categories 1 and 2 less often than Category 0, compared to would be predicted by their level of SWB. The data revealed that 87% of those in the lowest 10% of PWI-SC scores, 95% of those in the 11th–20th percentile, 99% of those in the 21st–30th percentile, and 99% of those in the 31st–40th percentile selected Categories 4–10 (see Figure 2). This suggests that within the Australian data only, adolescents with lower overall SWB still report relatively higher levels of happiness with standard of living than might be expected from their level of overall SWB.
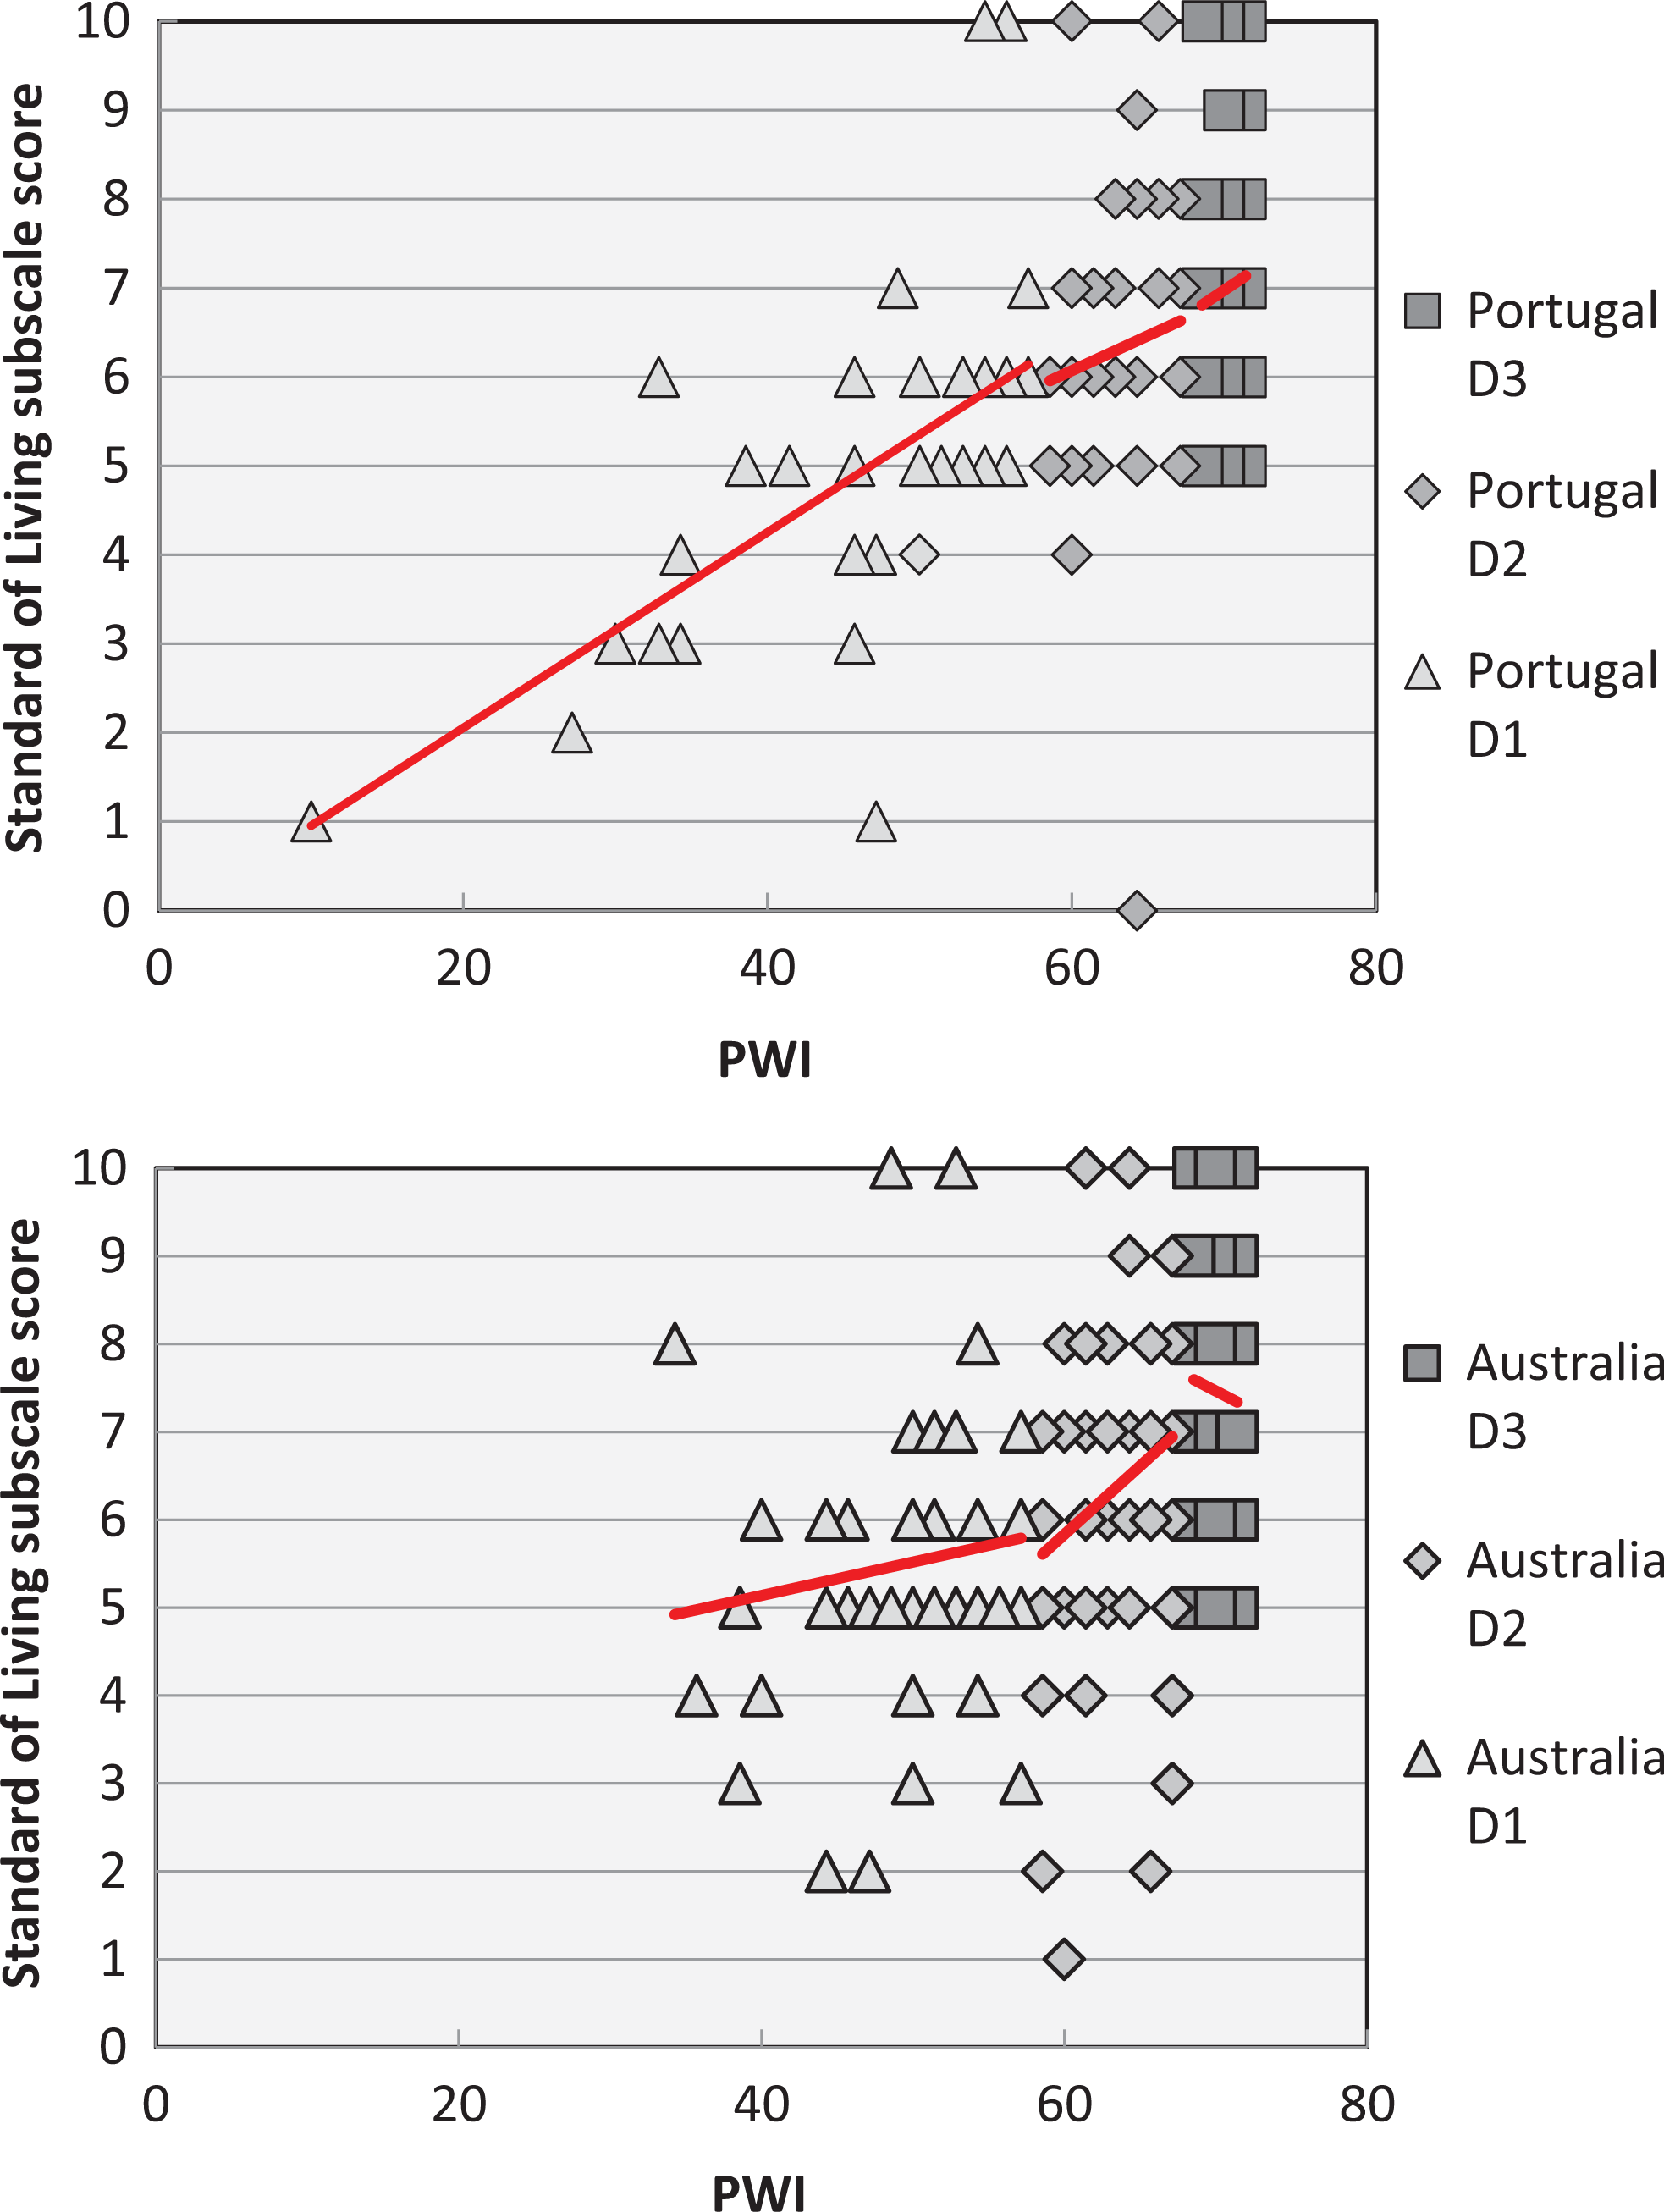
Scatterplots for Portuguese (top) and Australian (bottom) standard of living by personal well-being index—school children. Triangles: first decile (D1; cases 1–10%); diamonds: second decile (D2); and squares: third decile (D3). Lines are linear fit for each decile.
Person-Item Threshold Distribution
The distribution of person-item thresholds was further examined (Figure 3) to obtain understanding of whether item thresholds were adequately measuring individuals at all levels of PWI-SC. Within Figure 3, elements above the abscissa show the frequency plot for individuals at their level of measured trait. The measured trait is given in logits, the logit transformation of individuals’ scores. Individuals with low PWI-SC are located to the left, and those with higher PWI-SC are located to the right. Elements below the abscissa show the frequency of thresholds for items (i.e., the difference between a choice of 5 and 6 on an item). Lower thresholds that are selected by those with lower PWI-SC level are located to the left, higher thresholds are located to the right. The information function (bell curve) reveals how much information is given by each level of threshold.
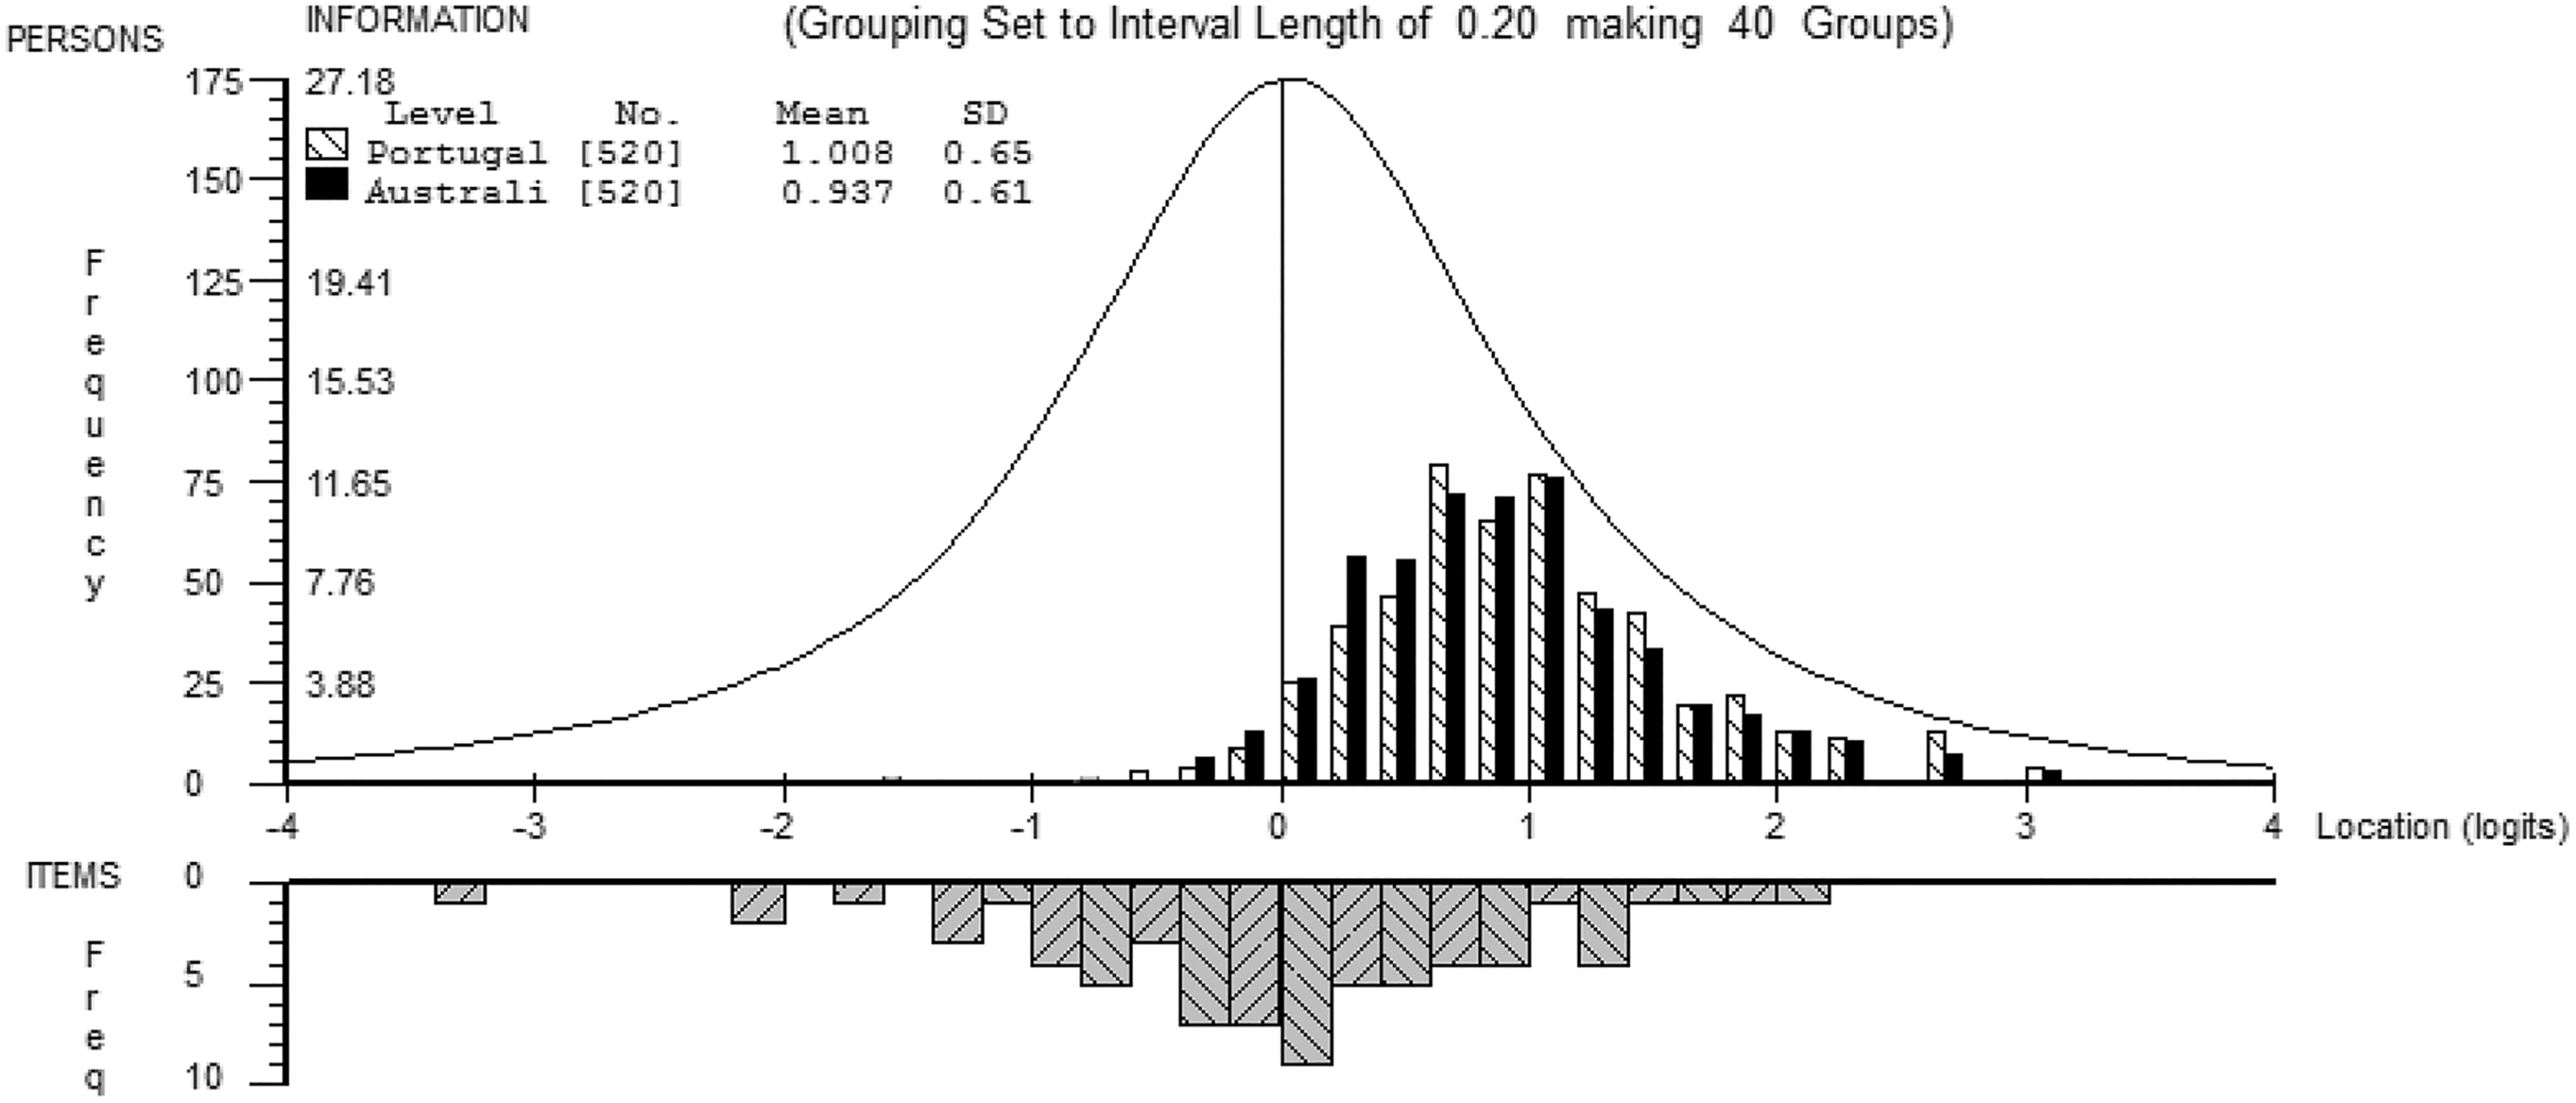
Person-item threshold distribution for both Australian (black) and Portuguese (pattern) respondents. Item thresholds are below the abscissa.
As revealed in Figure 3, item thresholds were well distributed across PWI-SC, but with the majority of item thresholds clustering below the average of PWI-SC (M = 0.972). Some thresholds were below the lowest scores, but none were above the highest scores. Almost all item thresholds were below the average value. Examination of Figure 3 shows 57 thresholds below .972 logits and only 9 above this value. Of the 70 thresholds available, this means 81.4% were below, 12.9% were above, and 5.7% were located at the average value of PWI-SC. This reveals that people who scored at ceiling levels on the PWI-SC were not reliably measured. Figure 3 reveals that in general, Portuguese and Australian cohorts did not differ. Figure 3 represents the comparison of these data, showing separate histograms for each country. The smoothed information function in Figure 3 represents the information provided at each score level by the items below the abscissa. A one-way analysis of variance was undertaken to evaluate the difference between these two. No difference was found in PWI-SC scores, though Portuguese respondents did have a slightly higher PWI-SC, F(1, 1038) = 3.34, p = .07,
Unidimensionality
Thereafter, unidimensionality was examined. First correlations between the residuals of items were examined to check for local dependency. If all items are only dependent upon the construct of PWI-SC, there should be no remaining correlation between them after this factor has been removed. Naturally, this is an ideal and is rarely fully achieved. Second, the loading of cases onto factors was explored. If the different eigenvectors truly represent unrelated factors, then cases should obtain discrepant scores on each, and there should be a significant number of cases with discrepancies on these two scores. The first two factors are examined, as by definition these have the greatest amount of variance associated with each. Residual item correlations are presented in Table 2. Residual correlations were evaluated at 0.3 with one pair of items found to be correlated (Items 3 and 5); however, when the criterion was set to 0.2 eight of eight pairs of items were correlated, suggesting some local dependence within the PWI.
Residual Item Correlations.a
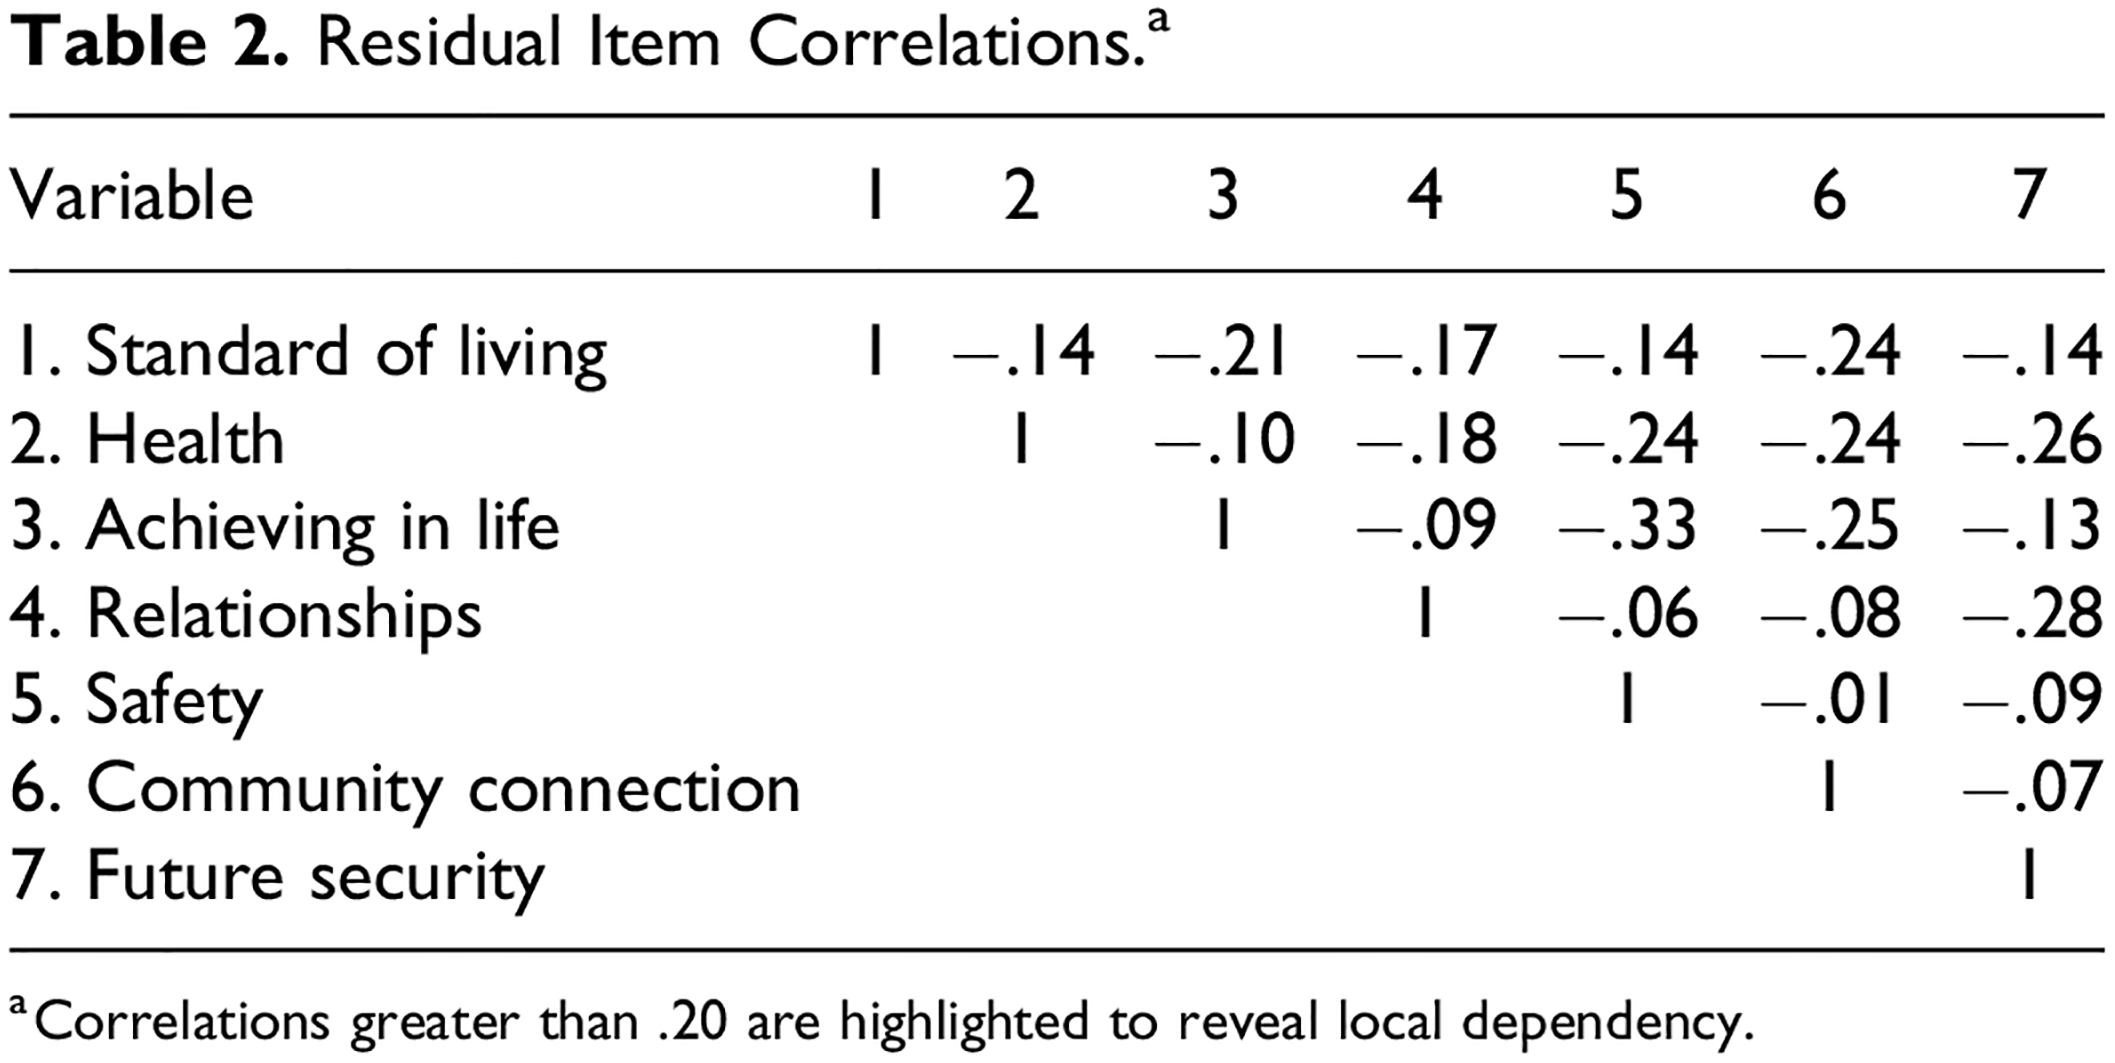
a Correlations greater than .20 are highlighted to reveal local dependency.
To further evaluate unidimensionality, we undertook a principle components analysis of residuals. Four items loaded onto the first eigenvector (21.5% of variance, Items 2, 3, 5, and 6), and 3 items loaded onto the second eigenvector (18.4% of variance, Items 1, 4, and 7). If the scale was multidimensional, then these eigenvectors would function as independent scales, and participants would be expected to score differently on these (Misajon et al., 2016). Scores for the first and second eigenvectors were obtained, and the differences between them examined by t test for each participant. Only 2.4% of participants had significant t values at .05, indicating that the two eigenvectors did not give rise to different dimensional scores, and that the PWI-SC is unidimensional.
Differential Item Functioning
DIF was explored for the two countries, Portugal and Australia, to establish whether the two adolescent groups responded differently to items. No DIF was found for class interval or for the interaction of class interval by country. However, Item 2, health: F(1, 1020) = 70.78, p < .001,
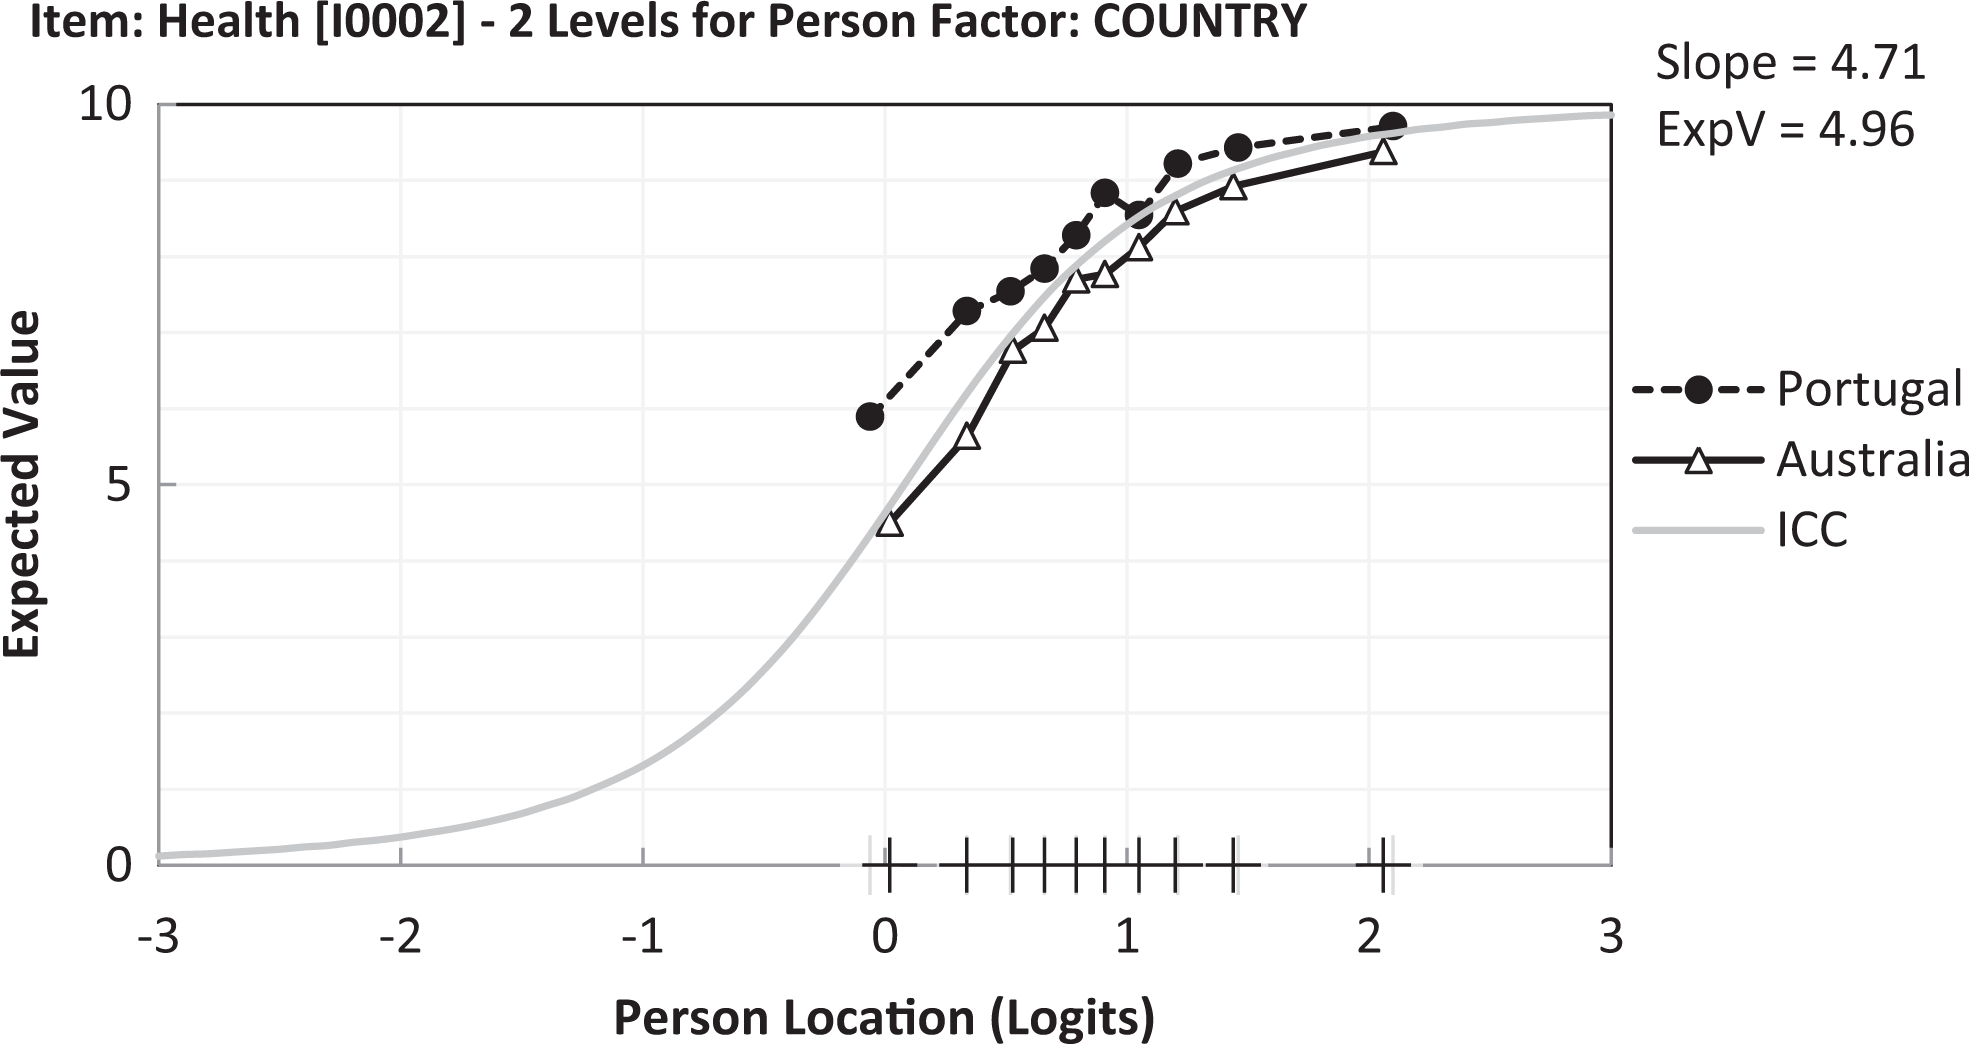
Item characteristic curve for Item 2 (health). Curve plots the expected probability of scores for each personal well-being index level (location). Data for Australian respondents (solid black line triangle symbol) and Portuguese respondents (dashed black line with solid circles) are plotted with each point indicating the center for each decile group (class interval).
Model Fit Parameters.
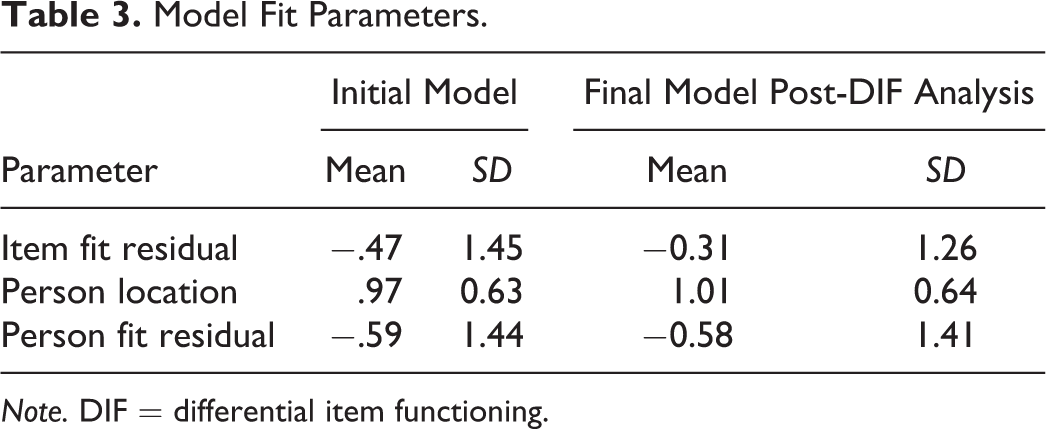
Note. DIF = differential item functioning.
Discussion
The PWI-SC is designed as a cross-cultural measure of SWB and has undergone extensive psychometric interrogation over the past 5 years (e.g., Casas et al., 2012; Tomyn & Cummins, 2011; Tomyn, Cummins, et al., 2015). The aim of this study was to explore SWB by applying the Rasch measurement approach to estimate ordinality of response thresholds, and interval stability, and to estimate difference in the use of the PWI-SC cross-culturally.
The major result is that both Portuguese and Australian adolescent data, matched on age and gender, were found to fit the Rasch measurement model. Further, both groups were found to have excellent levels of reliability. This psychometric stability is consistent with the predictions of homeostasis theory (Cummins, 1995, 2010, 2016). When the two samples were evaluated together, some slight misfit was found in the data. However, this was addressed by removing some mild issues with item thresholds in Item 1 (standard of living), noted among the Australian data, and splitting the data by country on Item 2 (health), allowing both Australian and Portuguese cases to differ on Item 2 (health).
Concerning the standard of living domain first, young Australian respondents with very low overall SWB (<58) tended not to report correspondingly lower happiness with this domain. Correspondingly, low SWB by young Portuguese respondents, on the other hand, reported levels of happiness that were consistent. This difference, a decoupling between SWB and standard of living among young Australians, may reflect the nature of the living environment. For example, in 2016, Australia had experienced 25 years of continual economic growth (Australian Government, Department of Industry, Innovation and Science 2016), and Australians experience among the highest standard of living globally (Malik, 2013). Portugal, on the other hand, is ranked much lower on economic indices. This difference in economic performance at a country level may be linked to the different view of low satisfaction with standard of living. For the Portuguese, the two are linked because low satisfaction with standard of living is simply part of the low SWB overall. For the Australians, on the other hand, low satisfaction with standard of living may be more likely linked to other causes, thereby resulting in a disconnection between the two indices.
A second difference was the degree to which Australian and Portuguese respondents differed on Item 2 (health) where Portuguese responders selected higher values, which suggests that the two groups may have used this item in different ways. It is unclear why this should be so, as both countries offer their citizens universal and accessible health care. However, it is interesting to note that in a recent European Union obesity report, it is claimed that adolescents in Portugal have among the lowest levels of physical activity among the 28 member countries of the European Union, with approximately 80% of boys and 90% of girls deemed insufficiently active (Jackson-Leach, Montague, & Lobstein, 2017). Regardless of whether the health consequences associated with physical inactivity are a cause of poorer perceptions of health among Portuguese adolescents, this difference in response did not interact with strength of SWB. Portuguese participants responded to the health question at consistently higher levels across all levels of SWB. This indicates that Portuguese children were happier with their level of health consistent with their level of SWB and that SWB and health did not interact. Therefore, the PWI-SC did not show concerning levels of DIF. While there was a stable difference between Portuguese and Australian adolescents, as revealed by the analysis, this had little overall effect on the measured SWB—the analysis revealed that the difference in Portuguese and Australian children in their response to the measure of health-associated well-being did not significantly interact with their level of PWI, and so this itself did not drive country differences in PWI scores. Other than speculated, we are not able to offer any insight as to why this difference was there. This matter will require further exploration.
Overall, the PWI-SC was found to be unidimensional, though with some mild and acceptable local dependency. This unidimensionality is in accord with that of Tomyn, Fuller-Tyszkiewicz, and Cummins (2013) and shows that this scale functions in a similar manner to the PWI with adults, as also found by Misajon et al. (2016) and Tomyn, Fuller-Tyszkiewicz, and Norrish (2013). This finding strengthens the utility of this instrument as it confirms the utility of the PWI-SC across cultures and age groups (e.g., Casas et al., 2012, 2013; Ganglmair-Wooliscroft & Lawson, 2008; Lau et al., 2005; Renn et al., 2009; Tiliouine et al., 2006; Tomyn, Fuller-Tyszkiewicz, & Norrish, 2013).
In summary, the PWI-SC fits a unidimensional Rasch model. The instrument was found to be highly reliable in both samples. Further, the measurement properties do not differ between non-English-speaking Portuguese and English-speaking Australian adolescents. With the exception of very low values for standard of living, the PWI-SC was shown to have ordinal stability of response thresholds in both samples, even in health, though this differed by country. Consequently, the values chosen by respondents are meaningful. These results extend those obtained using invariance analysis with the PWI-SC and reveal that this instrument functions compatibly with the PWI.
Study Limitations
As is common within the literature in research involving children and adolescents, one limitation of this study is the use of convenience sampling. Thus, the data do not represent the diverse qualities and characteristics of adolescents in both countries. It is notable, however, that the current samples were matched on gender and age so is not likely that this study suffered from any inherent biases as a consequence of differences in these person characteristics.
A second methodological limitation is that both groups were sampled from Western countries. Given that a key feature of the Rasch approach is the demonstration of measurement ordinality, where each successive measurement reflects a greater level than the one before, it is recommended that a future study focus on collectivist cultures such as Taiwan, Japan, and China. People from these cultures are less likely to rate themselves at the high-end the PWI compared to people living within individualistic cultures (Chen & Davey, 2008b; Lau, Cummins, & McPherson, 2005). It is quite possible that such different forms of cultural response bias may systematically affect a Rasch analysis.
Summary and Conclusions
This study explored the validity of the PWI-SC in an age and gender-matched sample of adolescents, from Australia and Portugal, using the Rasch measurement model to estimate whether the scale displayed measurement ordinality, interval stability, and functioned in similar ways across cultures. We provide further evidence that the PWI is unidimensional, despite evidence of mild, but acceptable local dependency. However, these results also demonstrate the PWI-SC health item is affected by culture and therefore indicate that the PWI-SC requires further development and research. It is possible that the cultural dependence of this item indicates it should be reconsidered for exclusion from future versions of this instrument. Nonetheless, overall, this study further supports the utility of the PWI-SC as a cross-culturally valid instrument in the Australian and Portuguese context.
Footnotes
Declaration of Conflicting Interests
The author(s) declared no potential conflicts of interest with respect to the research, authorship, and/or publication of this article.
Funding
The author(s) received no financial support for the research, authorship, and/or publication of this article.