
Abstract
We normalized, harmonized, and pooled 344,429 surveys collected from 106,470 research participants from 25 research studies that assessed past 30-day alcohol use, drunkenness, smoking cigarettes, using marijuana, and a host of psychosocial variables. After normalizing and harmonizing psychosocial measures, we completed analyses to examine the ability of psychosocial variables to serve as proxy indicators of use. Intentionality, peer descriptive normative beliefs, and age emerged as being of primary importance in indicating use. Additional variables – peer injunctive norms, beliefs about the positive and negative consequences of use, and attitudes – were also demonstrated to have the potential to serve as proxies in the assessment of substance use risk. There were developmental patterns in how intentionality and descriptive normative beliefs changed with age. Young adolescents had scores that are protective; they have positive intentionality and do not see the prevalence of alcohol and other drug use as widespread. These and other psychosocial variable’s mean scores generally erode with age while the distribution of scores widens as youth grow older. The goal of analyses was to define age-related psychosocial profiles that can be used prospectively to estimate substance use risk. These profiles are useful in creating virtual control cases for evaluating disseminated prevention programs.
Introduction
Two aspects of alcohol and drug prevention research, intervention design and evaluation, rely on understanding the relation between the prevalence of use and relevant psychosocial variables. In the case of intervention design, the law of maximum expected potential effect states that interventions that target modifiable psychosocial variable with high regression coefficients have the inherent potential to result in meaningful behavioral effects. However, if the psychosocial variable has a weak relation to the behavior, it may be impossible for such interventions to yield desired behavioral effects (Hansen & McNeal, 1996).
Evaluation also requires the inclusion of psychosocial variables (Brown et al., 2017). Many studies that have examined the potential for psychosocial variables to serve as proxies of use (Bry, 1983; Fearnow-Kenney et al., 2002; Graves et al., 2005; Thomas & Hsiu, 1993; Trucco, 2020). If one desires to use psychosocial variables in this manner, only psychosocial variables with statistically strong relations with behavior are suitable for fulfilling this role (Komro et al., 2001; 2004; Nation & Heflinger, 2006).
Prior research studies have identified numerous candidate psychosocial measures. Derzon & Lipsey (1999a, 1999b) and Derzon (2000) examined a variety of measures, including measures proposed as part of Communities That Care (Hawkins et al., 1992). In these meta-analytic studies, demographic, behavioral, and psychosocial correlations were examined. From these analyses it is apparent that there is a wide spectrum that characterizes the relation between these variables and use with some variables being strongly related and others, indeed most, being relatively weakly related.
In addition to these meta-analytic findings, a host of psychosocial constructs are candidates for inclusion either as targets of intervention, or psychosocial variables to be assessed in an evaluation. These include motivational and dispositional constructs such as intentions, normative beliefs, attitudes, and beliefs about consequences (Garcia-Cerde et al., 2021; Hohman et al., 2014; Huba et al., 1981; Miech et al., 2017; Olds et al., 2005; Perkins et al., 2019; Stephens et al., 2009; Stoddard & Pierce, 2018; Zaleski & Aloise-Young, 2013). Previous research has also considered personal and social competencies such as assertiveness, skills for refusing peer pressure and substance use offers, decision-making, goal-setting, anger-management, stress-management, and social skills (Barkin et al., 2002; Epstein et al., 2007; Margherio et al., 2020; Scheier et al., 1999; Trudeau et al., 2003). Personality characteristics such as self-esteem and a tendency for risk taking have also been assessed (Newcomb et al., 1987; O’Cathail et al., 2011; Richardson et al., 2013; Schwinn et al., 2010). At the environmental level, family factors, bonding to school, and ease of access also need to be considered (Kosterman et al., 2000; Rowland et al., 2015; Schuler et al., 2019).
Our goal in the current study is to identify a set of psychosocial variables that have the potential to serve as a proxy for substance use. We seek to create age-specific psychosocial profiles that can be used to estimate substance use risk for newly enrolled participants in prospective evaluations. These profiles will be useful in creating “virtual control” cases for evaluating disseminated prevention programs. Proxy measures are valuable when direct measures cannot be obtained. In the current environment in which alcohol and drug prevention programs have been widely disseminated and schools’ priorities often preclude them from participating in research as control sites, it is not often possible to recruit control groups. In such a circumstance, being able to create a virtual control group using estimates of prevalence at posttest and follow-up based on proxy data may allow an evaluation to proceed (Strayhorn, 2021). Creating such a proxy requires an empirical basis, using what is known about alcohol and drug use onset. Such approaches have been used in clinical oncology and toxicology studies where virtual control groups are used to compare experimental treatment results with previously established standards (Berry et al., 2017; Steger-Hartmann et al., 2020).
Unlike meta-analysis which pools statistical outcomes, our method pools raw data from multiple independent studies. As a method, meta-analysis typically proceed by searching published literature for relevant outcomes. Because results are often presented using a variety of statistics, a primary goal of meta-analysis is to transform outcomes into metrics that can compared using effect size statistics. Analyzing raw data for analysis requires a different strategy. Whereas meta-analysis focuses on published statistical results and ignores raw data (typically because it is unavailable), the focus on our method is to gather and analyze raw data from original studies. Data from these studies are first normalized so that scaling is consistent across studies. They are then harmonized so that they reflect common conceptual constructs.
Curran and Hussong (2009) note that there are many advantages that can be gained when original data are pooled from multiple studies. Studies usually employ surveys that differ from one another in definable ways. It is commonplace for psychosocial research items to be idiosyncratic from study-to-study. Therefore, a major goal of any study that uses pooled data is to develop metrics that allow individual items and scale responses to be compared.
Normalization
There are two approaches to aligning metrics from multiple studies: standardization and normalization (Ali et al., 2014; Muralidharan, 2010). Standardization refers to adjusting response distributions so that means and standard deviations are equal across all included cases. Typically, standardized datasets have means of 0 and standard deviations of 1, creating z-scores for individual cases. Normalization is a technique that rescales values based on stretching or shrinking scores to fit a prescribed range of outcomes. Min-max scaling is one example in which scores are rescaled. For example, minimum allowed scores may be set to 0 and maximum allowed scores set to 10 with all intermediate scores equally spread across this range.
Each approach results in definably different outcomes. When the goal is to compare treatment conditions, standardization is the most suitable approach and is often used in Integrated Data Analysis (IDA; Curran & Hussong, 2009). However, there are several challenges with standardization. Means and standard deviations change with the addition of new cases and the addition of longitudinal data. With the addition of every new study or every wave of data collection, standardized scores need to be recalculated. Interpreting outcomes relies on being able to interpret relativistic values. When data are standardized, there are no fixed maximum or minimum scores generated that can be used to interpret the range of findings. We do not use standardization or IDA in this study.
Normalization ignores means and standard deviations (although they can be readily graphed once data from multiple studies are pooled). The benefit of this approach is that there is no need to re-standardize when additional cases or additional waves of data are incorporated into a project; scaling is done for each study using the same rules. Any prospective data can be pre-formatted to match established normalization criteria. Further, normalized cases can be readily interpreted; any given score can map onto a theoretical ideal for the variables under consideration. In this study, we use a normalization approach for rescaling data. Our intent is to create age-specific profiles of psychosocial variables that can serve as a referent for creating virtual control cases when new data are collected.
Harmonization
Harmonization refers to aligning items that measure the same construct. Researchers often develop survey items that reflect constructs they deem important to measure. These constructs can reflect either a formal theory or an intuitive conceptualization that has emerged in the reasoning of the researcher. Because researchers come from diverse backgrounds and the purposes of survey development differ based on a project’s goals, there is little consistency in how measures are described or categorized (Breedvelt et al., 2020; Kaufman et al., 2020).
Harmonization proceeds more cleanly if a reference to an existing theoretical literature can be established. In prior research, we examined prevention programs and the psychosocial variables they targeted for intervention (Hansen, 1992; Hansen et al., 2007, 2010). We concluded that interventions broadly targeted variables related to (1) motivation (e.g., attitudes, intentions, normative beliefs, beliefs about consequences and incongruence between risky behaviors and personal aspirations), (2) personal competencies (e.g., decision-making and goal-setting skills), (3) social competencies such as (e.g., the ability to refuse offers and communication skills), and (4) environmental contexts (e.g., bonding to school and parental relationships).
In this study, we develop a lexicon of constructs that define the variety of psychosocial measures used in prior alcohol and drug research studies. We apply these definitions to harmonize items and scales within studies that allow data to be comparable across studies.
Purpose
Our goal in the current study is to identify key constructs for which there is empirical evidence of a strong relation with adolescent alcohol, cigarette, and marijuana use. We use standard and novel analysis methods to examine a wide range of psychosocial constructs that prior researchers have included in surveys of adolescents. Using raw data provided by 25 research studies, we normalize metrics and harmonize constructs. We complete analyses that use pooled data to estimate the overall accuracy with which alcohol and other drug use can be estimated using age and psychosocial variables. We identify the relative importance of commonly measured constructs. We also examine typical developmental patterns of use and age-related changes in key psychosocial constructs. Our goal is to use results to create an age-specific reference table that can be used in evaluating program effectiveness through the development of virtual control cases (Hansen et al., 2018).
Method
Sources of Data
We assembled raw data from 25 longitudinal research projects. Our search for datasets relied in part on our knowledge of the field of school- and community-based alcohol and drug prevention. Having been involved with alcohol and drug prevention for the last four decades, the first author was personally acquainted with principal investigators of many NIAAA- and NIDA-funded adolescent-focused prevention and epidemiology studies. We supplemented this knowledge by searching NIH Reporter for additional alcohol and drug prevention and epidemiology projects. Our criteria for including datasets were that (1) they must include longitudinal data (i.e., multiple waves), (2) they must include measures of recent (past 30-day) alcohol, cigarette, or marijuana use, (3) they must include psychosocial measures, and (4) they must be able to provide a codebook or sample survey. Only datasets that met these criteria were included.
Other than data which we had archived from our own research, we sought data directly from principal investigators. We identified 43 research teams that might potentially provide data to this project. Researchers or their designees were offered an honorarium for providing their data and either a codebook or a sample survey. We had replies from 22 researchers, four of whom refused outright to provide data and two revealed that their datasets had been lost over time.
We collected data from our own research (7 projects) as well as 18 datasets by 16 researchers that met our criteria for inclusion. Datasets included epidemiological studies and prevention studies. For the latter, only control group and pretest data were included. Data were “raw” in that individual items were provided along with a codebook or survey that specified what prompt had been given to research participants and how response categories had been coded. Data files included anonymized ID numbers and indicators of the wave of data collection. Overall, 344,429 surveys from 106,470 research participants were included in this project. All projects were longitudinal in nature. Surveys were collected only once from 28,389 participants (26.7%), twice from 21,225 participants (19.9%), three times from 22,497 participants (21.1%), four times from 8,557 participants (8.0%), five times from 6,444 participants (6.1%), six times from 2,402 participants (2.3%), seven times from 15,946 participants (15.0%), and eight or more times from 1,020 participants (0.8%). (Supplemental Appendix A, Table A1 presents the number of surveys, percent female, and age range for each study’s dataset. Supplemental Appendix A, Table A2 presents the percent of various racial/ethnic groups sampled in each project.)
Psychosocial Item Harmonization
Psychosocial Constructs That Were Identified Through Analysis of Surveys and Codebooks and Harmonized.
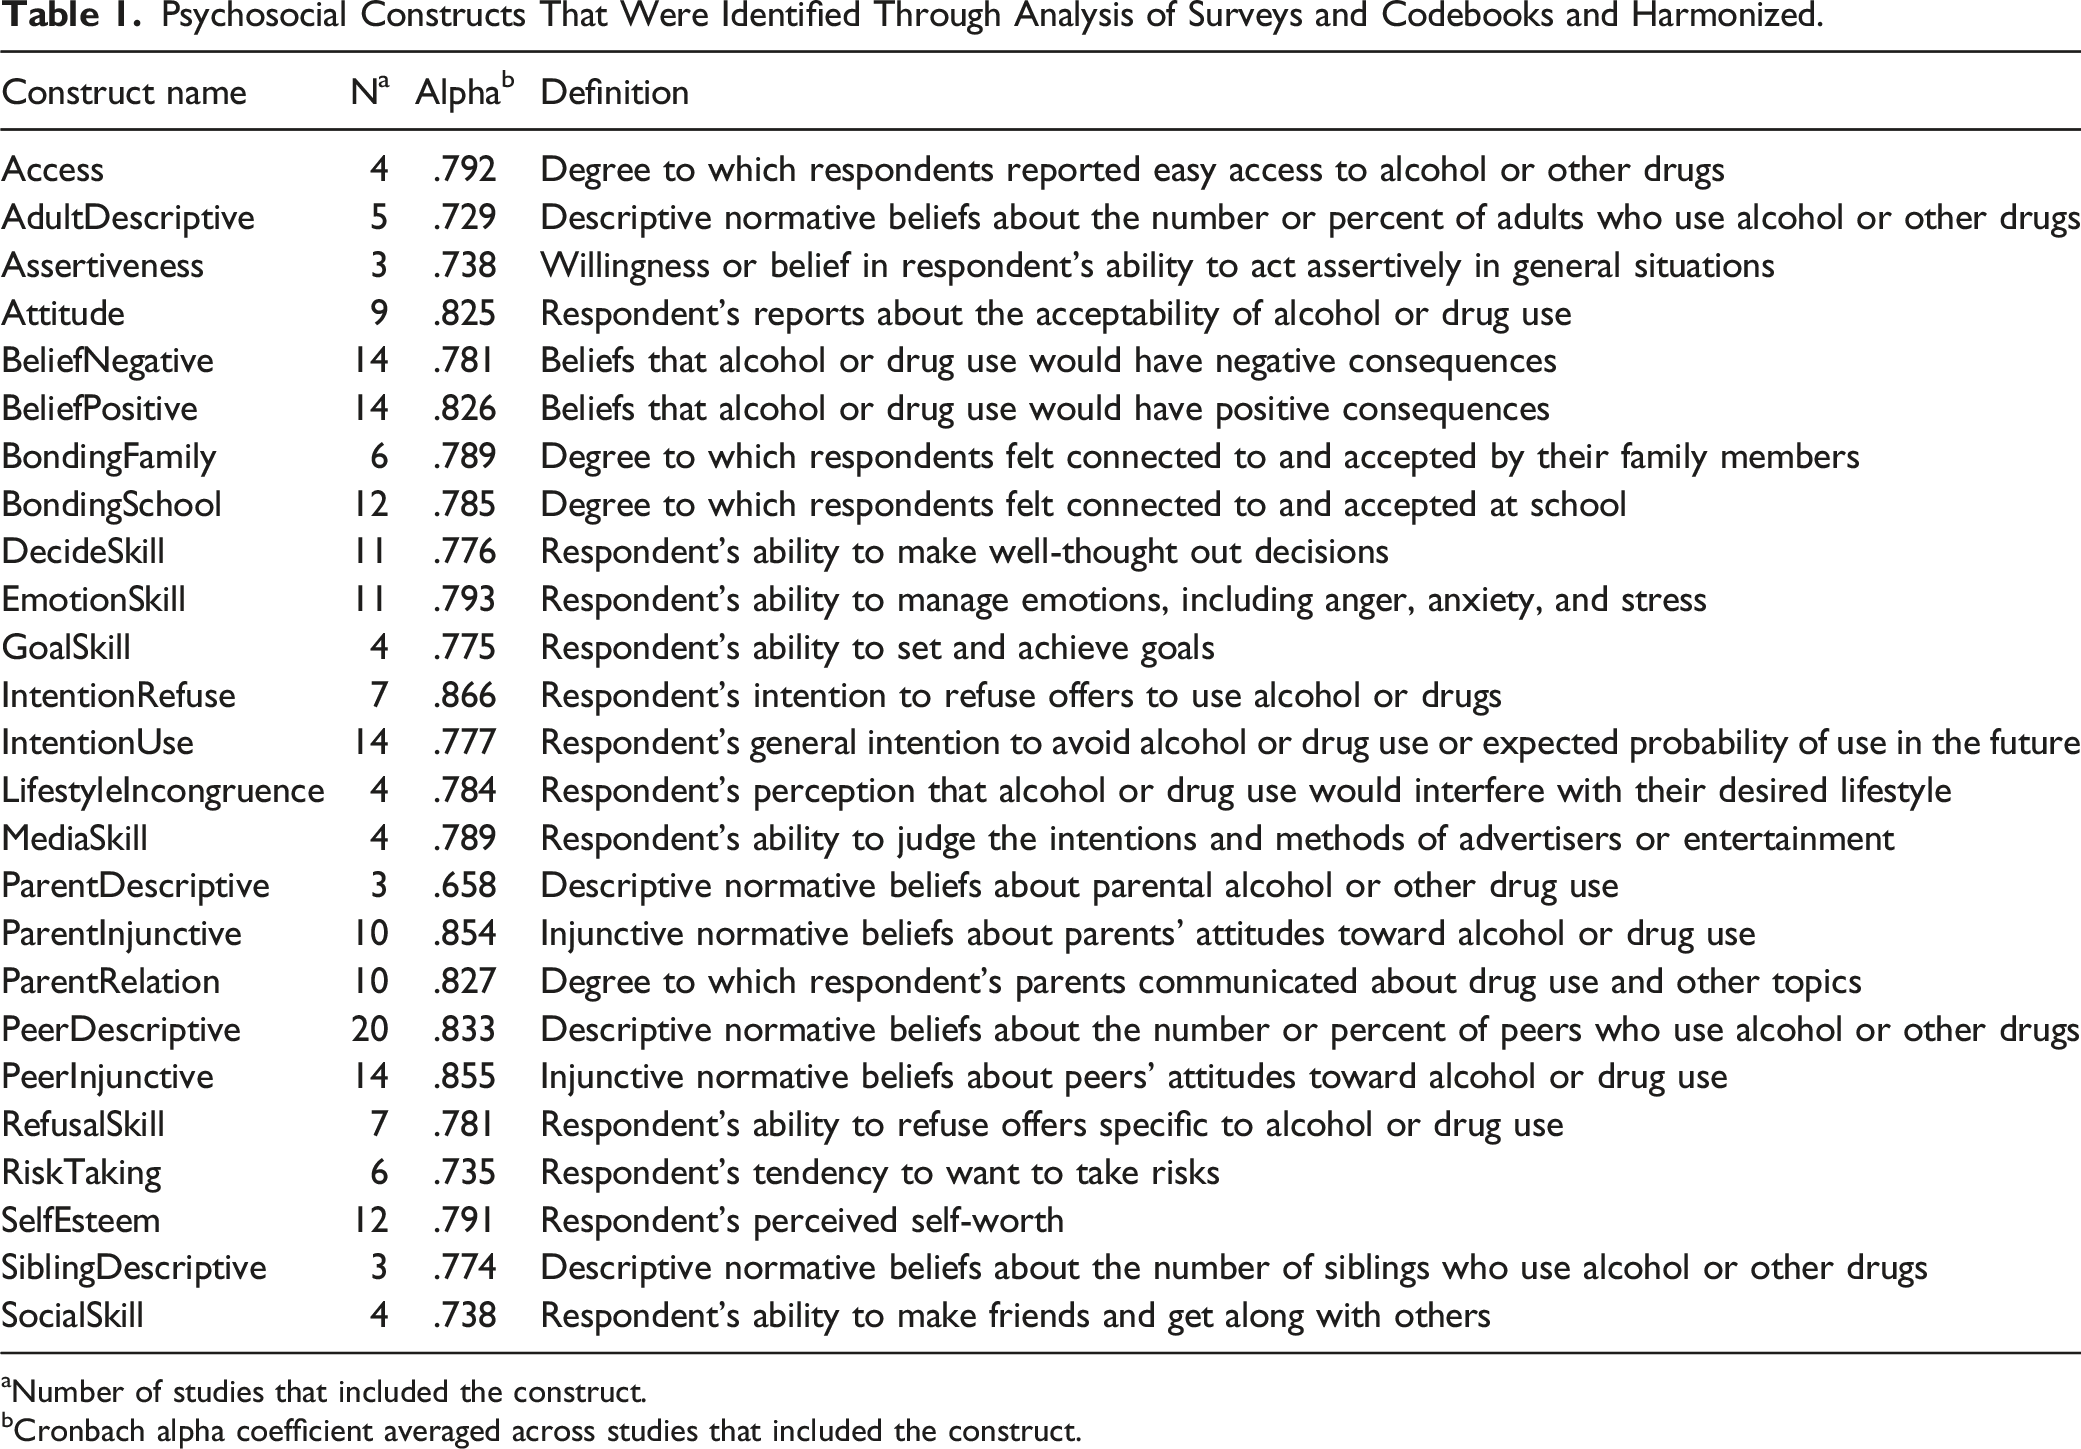
aNumber of studies that included the construct.
bCronbach alpha coefficient averaged across studies that included the construct.
Every study asked multiple questions to assess its concepts of interest. Only rarely did surveys ask the same set of questions. For example, PeerDescriptive items included the following variety of prompts about peer alcohol use: • How many of your friends drink alcohol when they are out with their friends? • How many of your closest friends do you think have had some kind of alcoholic beverage during the past 30 days? • How many of your friends drink alcohol? • How many people in your grade at your school drink alcohol? • How many of your four best friends drink alcohol at least once a month? • How many of your three best friends have ever tried drinking alcohol? • How many of the students in your grade drink alcohol? • How many closest friends have drunk alcohol?
Every construct had similar variability. However, as can be discerned in the list of questions about peer alcohol use, each of these prompts ask respondents to provide some estimate of perceived peer prevalence that fits with the PeerDescriptive construct. Across and within studies, survey items employed varying numbers of response categories. For example, the questions about peer alcohol drinking listed above used a variety of response categories, including specific options and numbers of options available for respondents to choose from.
Psychosocial Variable Normalization
Our goal was to make the response formats consistent across all psychosocial items. For each, we normalized responses and transformed item weights to conform to a 0-to-10 range. Thus, if an item had four responses (e.g. 1, 2, 3, and 4 or 0, 1, 2, and 3), we transformed the points to be 0, 3.333, 6.667, and 10. Five-point response items were transformed to be 0, 2.5, 5, 7.5, and 10. Three-point response items were transformed to be 0, 5, and 10, and so forth. In all cases, a value of 10 represented the most theoretically or socially desirable response. For example, consider an item that purported to measure negative beliefs about the consequences of using alcohol (“If I drank alcohol, I would probably get in an accident”). We would recode a strong agreement as a 10 and strong disagreement as a 0. On the other hand, consider a positive belief item (“If I drank alcohol, I would have more fun”). We would recode strong agreement as 0 and strong disagreement as 10.
Scales were created separately for each dataset using available items for that dataset. For example, PeerDescriptive scales typically included items that assessed perceived prevalence of alcohol, cigarette, and marijuana use as well as, on occasion, other drugs such as cocaine, hallucinogens, methamphetamines, etc. Once all items were harmonized, Cronbach alphas were calculated. When alphas improved when items were deleted, items that did not contribute were excluded. As can be seen in Table 1, all scales but one had alpha coefficients greater than .700. Items that contributed to each scale were averaged. Thus, each multi-item scale also had a 0-to-10 range. The practical value of these transformations is that resulting scale values are easily interpreted and allow ready comparisons across measures and for different ages.
Behavior Items Normalization
Studies varied in how past 30-day alcohol use, drunkenness and binge drinking, cigarette smoking, and marijuana use were measured. Some studies asked about use with dichotomous response categories whereas others used frequency of use and quantity of use scales. We recoded all behavioral items so that they reflected dichotomous values with 0 representing non-use and 1 representing use.
Demographic Item Normalization
How age, gender, and ethnicity were coded and reported varied across studies. In some studies, age was coded as an integer whereas other studies coded age as a decimal value. Responses in studies that coded age as a sequence (e.g., 1, 2, 3 . . . ) were recoded to reflect actual age. Ages expressed as true values (e.g., 10, 11, 12 . . . ) or decimals were retained as they were originally scored. Gender was coded so that males were always scored as 1 and females as 2. Race/ethnicity was recoded into the following categories: (1). African American, (2). White, (3). Native American, (4). Hispanic, (5). Asian, (6). Pacific Islander, and (7). Other/Multiple.
Analysis Plan
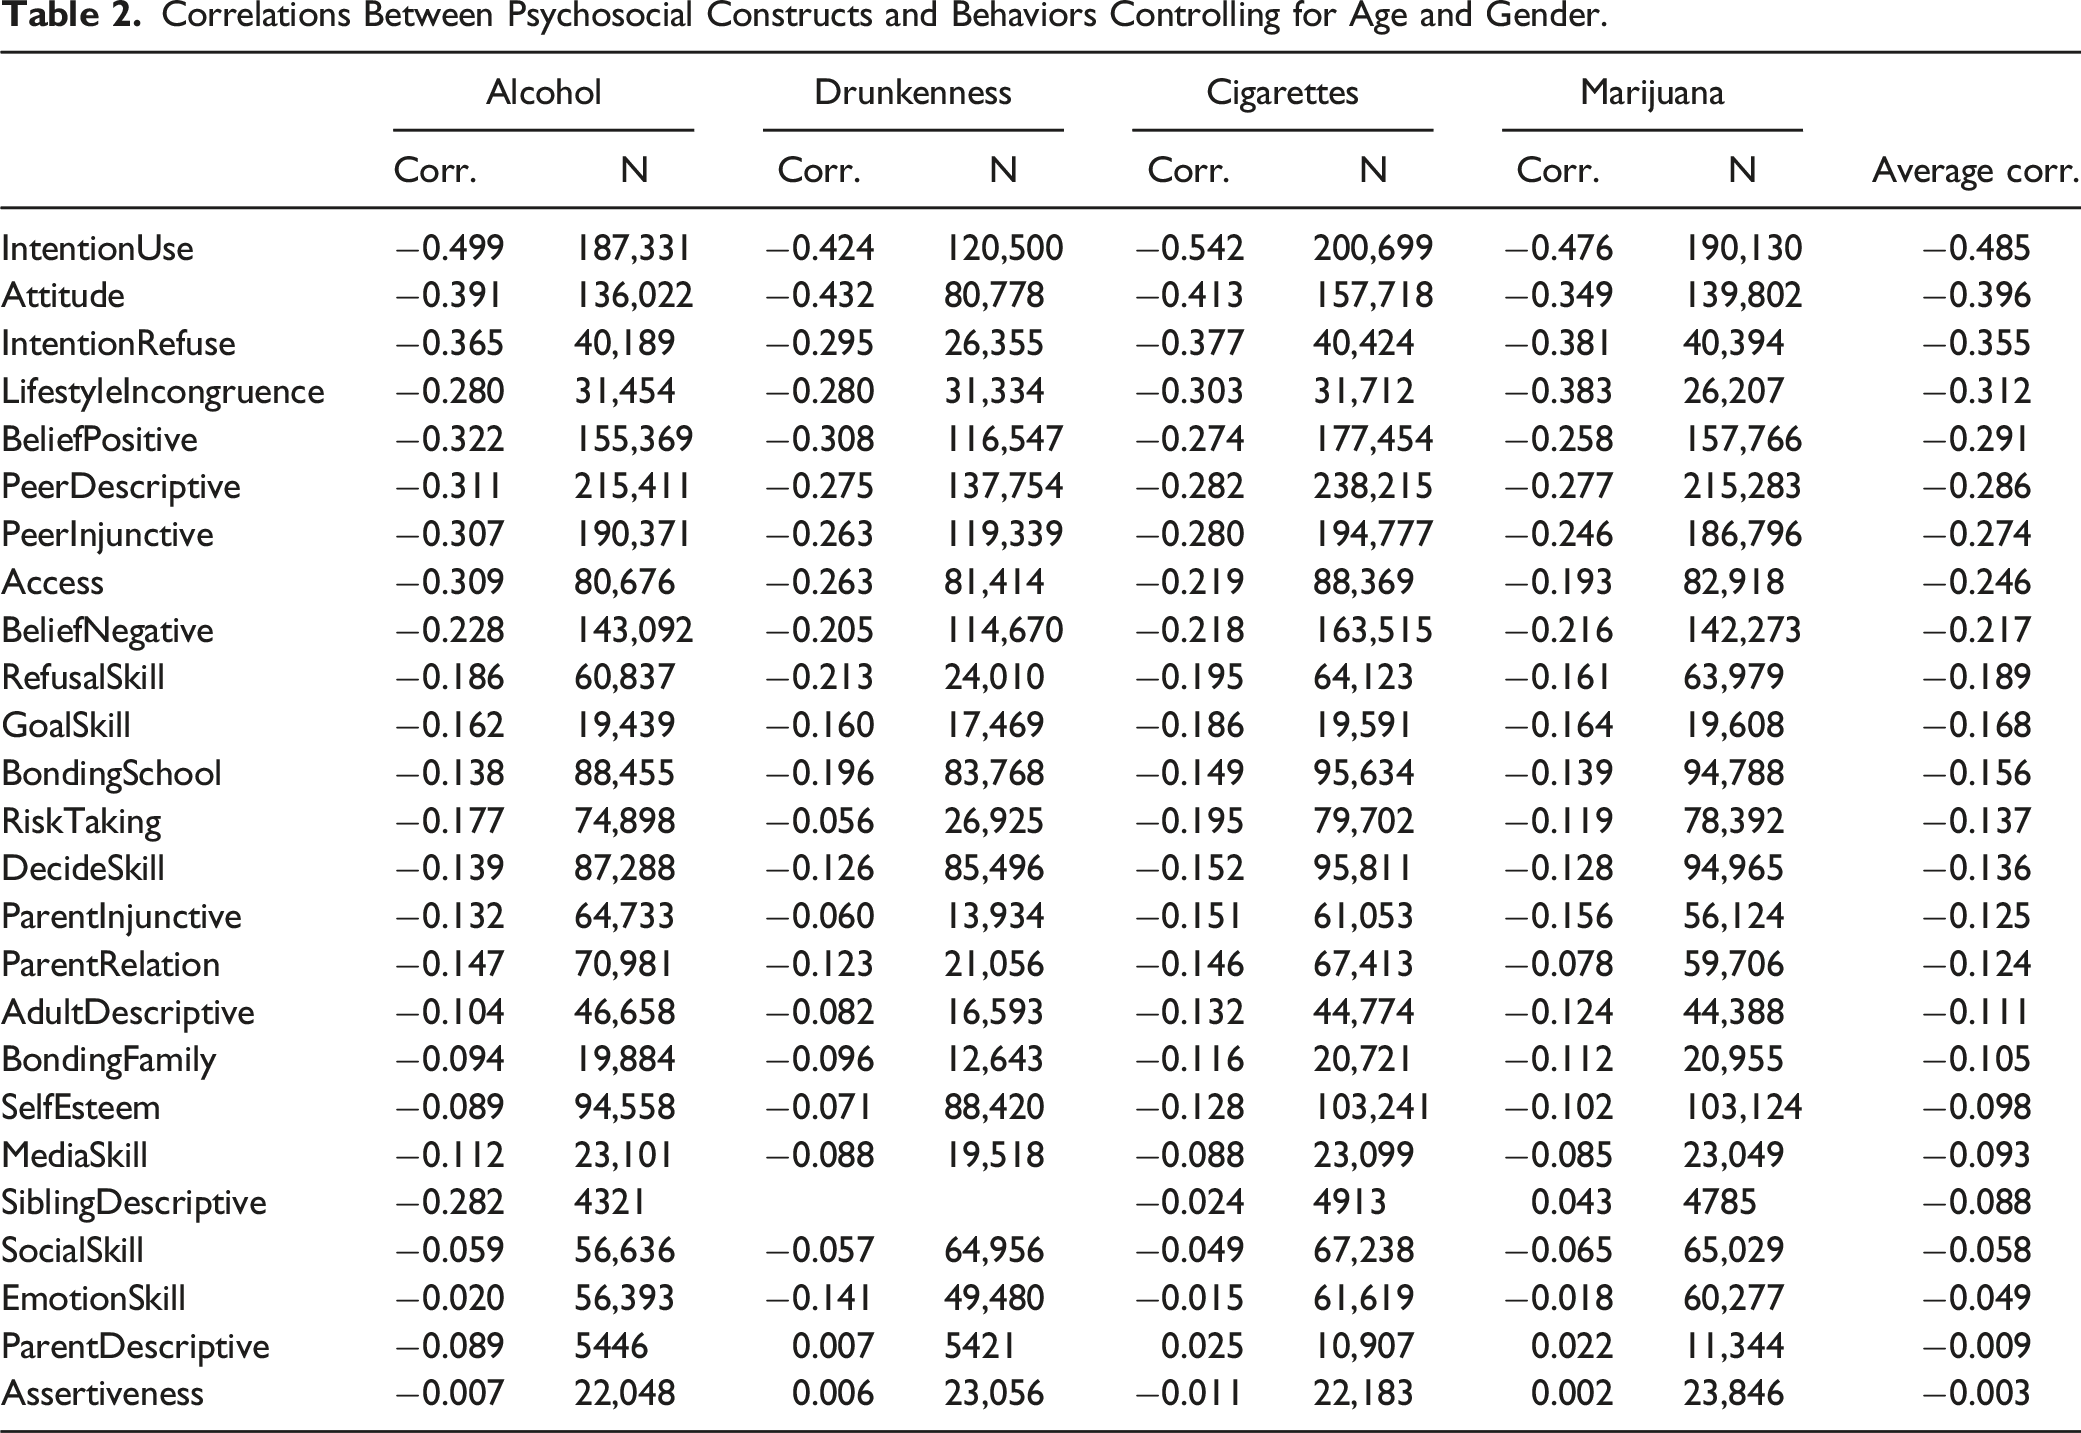
Our overall goal was to identify variables that best indicated alcohol use, drunkenness, cigarette smoking, and marijuana use in drug and alcohol prevention research. How well a demographic or psychosocial predictor variable performed was based on how accurate the predictor variable classified the individuals for the dichotomized outcome. Our initial analysis examined the correlations between psychosocial variables and behaviors with age and gender partialled out (Yule, 1911). We then used multiple metrics to assess overall accuracy, sensitivity, specificity, and error calculated using an independent sample.
Missing Data
Previously, we used multiple imputation to handle missing data. Missing value for a specific variable was imputed based on an imputation model. We used the R-based program missForest (Hansen et al., 2018; Stekhoven & Bühlmann, 2012), in which the imputation model was a tree-based regression Random Forest. In the current analysis, due to the expanded number of heterogenous datasets included we modified our imputation approach. Compared to the previous analyses, we handled a substantially higher number of potential predictive factors, leading to a challenging selection problem from a high dimensional predictor space. We reduced the dimensionality by using a multi-step procedure. First, we filtered out predictors with missing percentages higher than 50%. This provided a balance of variable inclusion while filtering out biases towards studies with fewer missing variables and is an acceptable upper bound in some studies (Madley-Dowd et al., 2019). Next, we used a canopy-based nonparametric K-Nearest Neighbor (KNN) method for single imputation of missing values (McCallumzy et al., 2000; Tutz & Ramzan, 2015; Zhang et al., 2019). KNN draws (weighted) values from the nearest neighbors of the data point where missing value occurred and used that value for imputation. KNN imputation is preferred when the dimensionality is high and when there is a high level of heterogeneity in the data. Compared to the previously used multiple-regression based imputation method KNN was also computationally more tractable given the high dimensionality of our current dataset (Hansen, 2020). The “canopy” implementation of KNN provided additional efficiency by only calculating distances between data points that fell within a certain range of the data centroid instead for all data points. Because our purpose was to assess relative performance of variables in terms of classification accuracy, uncertainty in confidence limits due to missing value imputation was of secondary importance. Therefore, we followed the usual practice of using single imputation for reporting point estimates, which is commonly used in large-scale surveys such as the National Assessment of Educational Progress (NAEP; Yamamoto & Mazzeo, 1992).
Training and Testing Datasets
We performed stratified sampling on the imputed dataset producing a dataset with an equal proportion of occurrence/non-occurrence of the outcome variable. A 90/10 split was then performed on the stratified dataset producing a training and testing dataset respectively. For each outcome variable we used the tree-based classification method Random Forest (Breiman, 2001; Dell et al., 2022) for prediction. In other words, Random Forest was first conducted on the training set and then the resulting model was applied to the testing set for assessing classification accuracy as well as variable importance. The process from stratified sampling through Random Forest analysis was repeated 10 times and the metrics and variable importance of each variable were averaged over the 10 replications for reporting.
Results
The self-reported prevalence of past 30-day alcohol use, drunkenness, smoking cigarettes, and using marijuana generally increased with respondents’ age (see Supplemental Appendix B, Figure B1). Cigarette smoking and marijuana use both increased more or less steadily from age 10 through 19. Past 30-day alcohol use and drunkenness had less of a smooth age-to-age increase. Datasets included surveys administered in studies that had been completed from the mid-1980s through the 2010 decade and included multiple longitudinally followed cohorts. We attribute the disjointed increases in alcohol and drunkenness observed in Supplemental Appendix B, Figure B1 to (1) the population sampled by a study (Banks et al., 2017; Newcomb et al., 1987), (2) cohorts being measured in different decades with prevalence being known to change (Johnston et al., 2021), and (3) extensive attrition within cohorts with succeeding waves of data collection with users more likely to drop out (Biglan et al., 1997; Hansen et al., 1985, 1990). Within studies, 30-day alcohol use prevalence generally increased with each year of age (see Supplemental Appendix B, Figure B2). A similar outcome was observed for drunkenness, cigarette smoking, and marijuana use.
Correlations Between Psychosocial Constructs and Behaviors Controlling for Age and Gender.
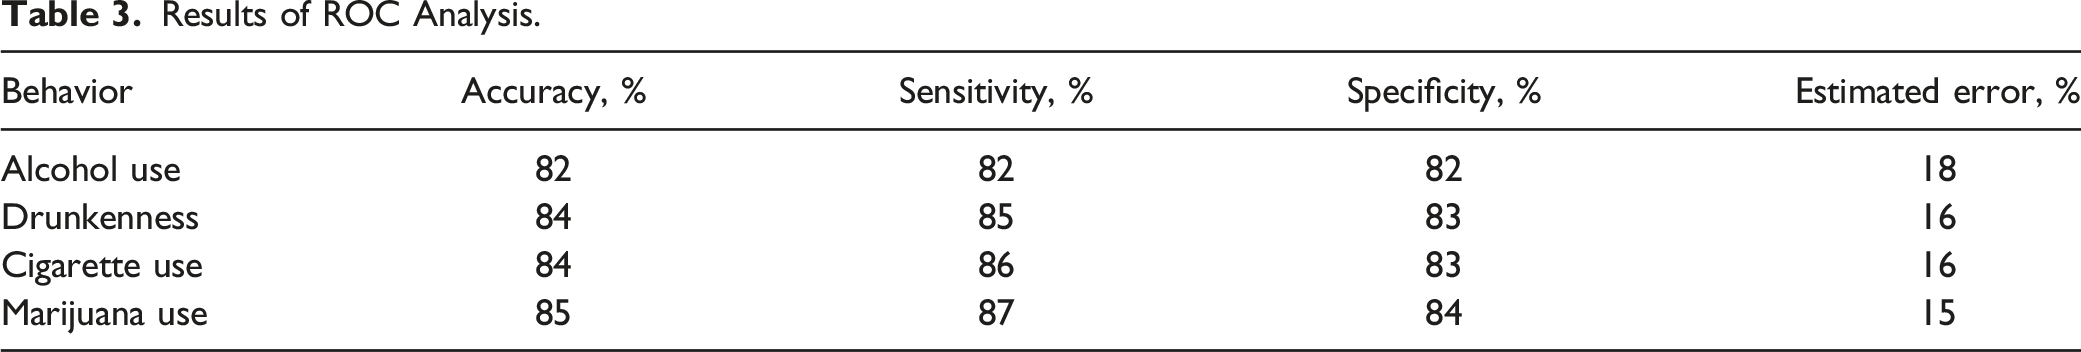
Results of ROC Analysis.
Importance Metrics from Random Forest (Mean Decrease in Accuracy).
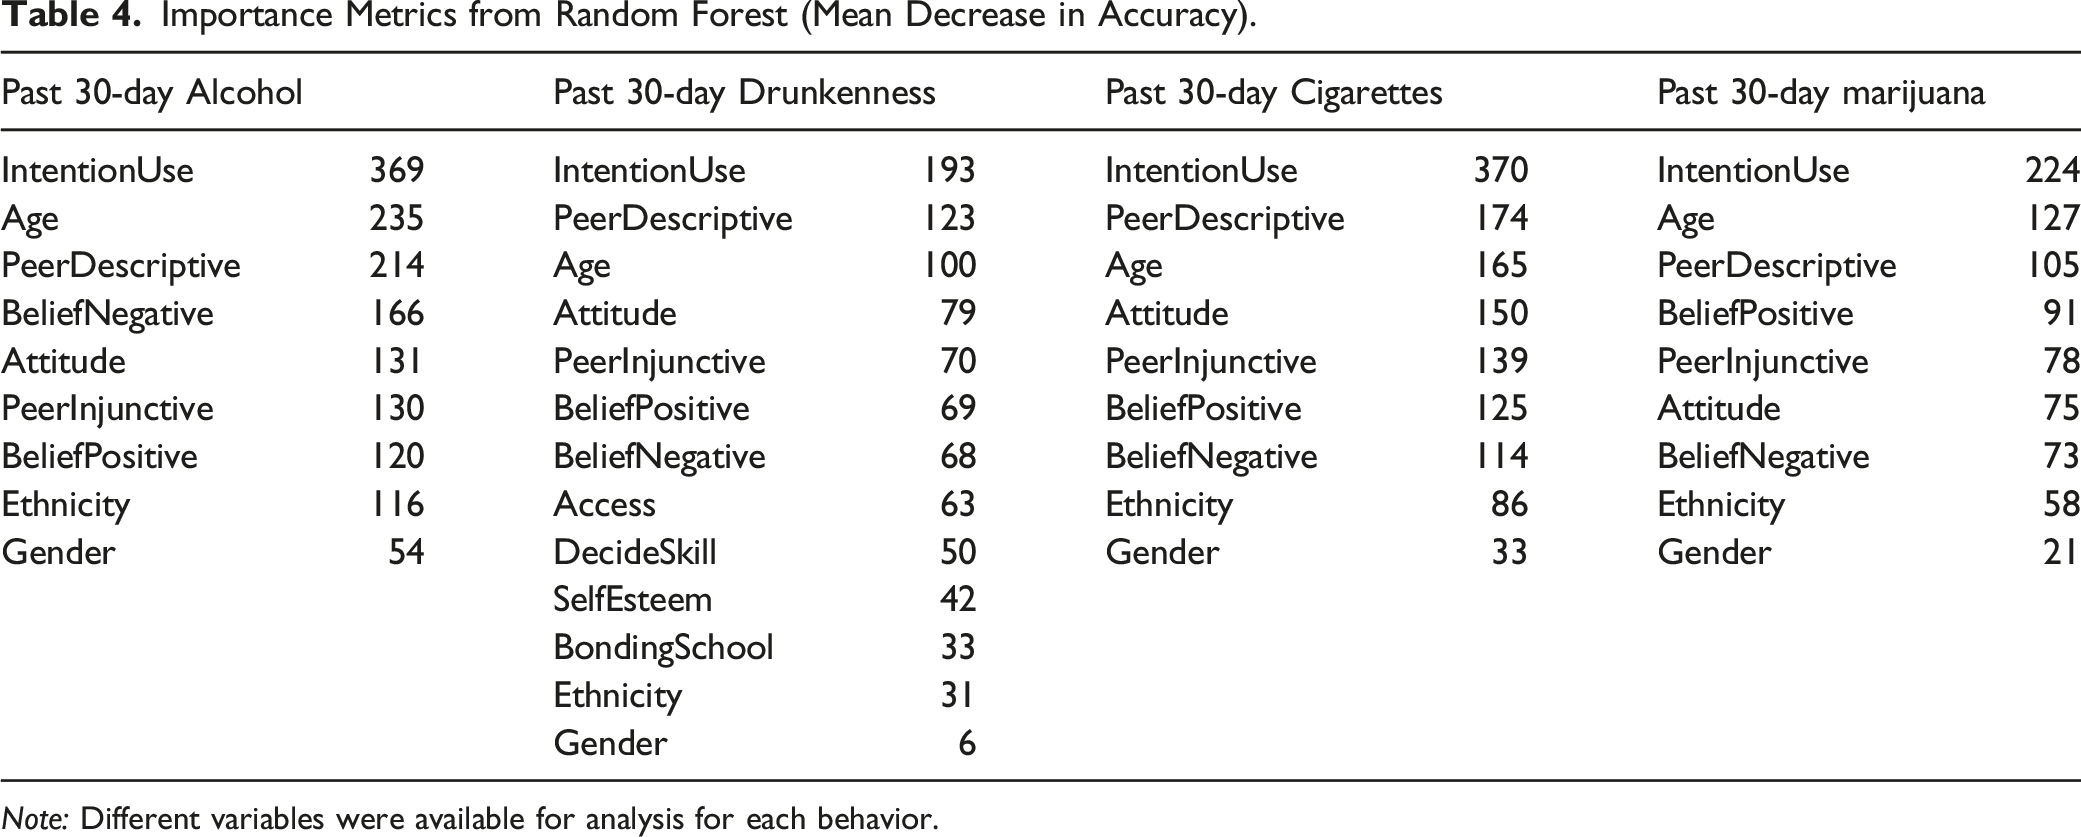
Note: Different variables were available for analysis for each behavior.
Because IntentionUse and PeerDescriptive predominated, we calculated age-specific changes observed for these two variables. Younger people’s IntentionUse scores (see Supplemental Appendix C, Figure C1) approached the upper range of possible scores. As samples aged, median scores (50th percentile) and lower quartile scores (25th percentile) eroded. However, a large proportion (at least the top 75th percentile of respondents of all ages) maintained IntentionUse scores of 10, indicating they intended to not use. The 25th, 50th, and 75th percentiles for PeerDesciprtive scores declined from age 10 through age 20 (see Supplemental Appendix C, Figure C2). For both IntentionUse and PeerDescriptive variables, the standard deviation within the sample grew larger with increasing age; more so for IntentionUse than PeerDescriptive. The correlations between Age and IntentionUse and PeerDescriptive were −.188 and −.311, respectively.
Discussion
Uniqueness of the Dataset
Pooling datasets is a relatively new method being employed to understand health behaviors. This study included a normalized, harmonized, and pooled dataset that is unique. Unlike meta-analysis that synthesizes statistical findings, the dataset used in these analyses consisted of raw data gathered from multiple studies. As such, it provides a rare resource for exploring the relations between psychosocial and demographic variables and adolescent substance use. We are aware of several projects that have pooled data from multiple primary studies that have a focus on health behaviors and psychosocial correlates. Several of these studies these include only two or three pooled studies with data from fewer than 2000 participants (Burns et al., 2017; Curran et al., 2014; Rose et al., 2013). One analysis (Brown et al., 2018) pooled 19 studies and includes surveys from 5200. The data pooled in this study is a magnitude larger.
Accuracy of Prediction
The wealth of data provided by multiple pooled studies provide an opportunity to gain insights about the psychosocial correlates of alcohol and drug use. In general, the set of psychosocial variables included in these analyses demonstrate that accuracy, sensitivity, and specificity of predicting all four behaviors was high, greater than 80%. The fact that these findings reflect the outcomes of diverse studies within which the composition varied markedly underscores the robustness of these findings.
Primary Indicators
The same sets of variables predominated as being important predictors for all behaviors. First and foremost, these included respondents’ age, their manifest future intentions to use substances, and their beliefs about the prevalence of use among their peers. Given the widely documented increase in prevalence that is associated with age, finding that age is an important predictor might be assumed. However, intentionality was consistently more important than age as a predictor and beliefs about peer prevalence was more important than age for both drunkenness and marijuana use. This suggests that there is high value for considering these variables as proxies for substance use.
Secondary Indicators
Remaining psychosocial variables included in analyses had considerably less importance in the correlation and KNN analyses. These included several variables included in the KNN analysis of all four behaviors: Attitude, BeliefNegative, BeliefPositive, and PeerInjunctive. We distinguished between positive and negative beliefs. PeerInjunctive reflected a specific form of normative belief that we distinguished from PeerDescriptive. Simplified as attitudes, beliefs, and normative beliefs, each of these variables were also featured in the Theory of Reasoned Action (Ajzen & Fishbein, 1980) and the Theory of Planned Behavior (Ajzen, 1991). Each is viewed theoretically as distal to intentions. Our analyses confirmed roles that reflect slightly lesser importance that may fit with this perspective. The implication of these findings is that, even though secondary, they remain important and may assist in creating a referential dataset that can be used for creating virtual control cases.
Three variables, Access, DecideSkill, and SelfEsteem were only included in the past 30-day drunkenness KNN analysis. Within the drunkenness analysis, these variables ranked as the psychosocial variables that had the least importance.
Gender was consistently of low importance for all four behaviors. It would thus appear that when other variables are included, gender plays little or no role in distinguishing users from non-users. Ethnicity similarly was of little importance in accounting for use. While among the various ethnic groups, there may be base rate differences in prevalence, ethnicity did not moderate other psychosocial variables used in estimating use. The exception was the role ethnicity played in past 30-day alcohol use where it was of moderate importance.
Excluded Indicators
The KNN analysis excluded a number of psychosocial variables: AdultDescriptive, Assertiveness, BondingFamily, EmotionSkill, GoalSkill, IntentionRefuse, LifestyleIncongruence, MediaSkill, ParentDescriptive, ParentInjunctive, ParentRelation, RefusalSkill, RiskTaking, SiblingDescriptive, and SocialSkill. As can be from an examination of Table 1, these variables did not appear in many studies and did not meet the 50% missing value cutoff that we used for inclusion. However, IntentionRefuse, LifestyleIncongruence, and PeerInjunctive were identified as possible important secondary predictors in the correlational analysis (see Table 2). These variables might yet prove to be important; our KNN analyses just could not test their importance.
Theoretical Implications
Our primary goal with these analyses was to use findings to develop a referent table for defining risk and age. However, it is worth considering the degree to which these findings align with broader theoretical ideas. A number of theories have included intentions and normative beliefs as key variables. The Theory of Reasoned Action (Ajzen & Fishbein, 1980) and the Theory of Planned Behavior (Ajzen, 1991) both have intentions playing a central role in predicting behavior. In these theories, intentions are generally considered to be proximal to behavior. Normative beliefs inform the development of intentions. The strength of arguments presented by these theories rely primarily on the observed strength of relation between intentions, however measured, and the behavior of interest. In our case, intentionality was measured using a variety of ways. Some surveys asked about the chances or probability of use with a vaguely worded future sense; others asked with a specific timeframe like within the next year, next two years, or as an adult. Some surveys assessed intentionality by asking about level of commitment to avoid use and if respondents would use if the opportunity arose. All of these alternatives appeared equally valid for assessing intentions.
While our research strongly supports intentions as a correlate of adolescent substance use, it may be helpful to add to this with an explanation of how intentions serve as a proxy for behavior. One explanation is that when a young person has behaved in the recent past, survey intention questions may simply ask respondents to project current behavior into the future. In this case, people may simply be using a Bayesian heuristic that relies on an acknowledgment of current behavior. When researchers ask for probabilities, this may be a logical explanation. However, we included studies that also asked about commitments, which reflect internal motivation. From this perspective, young people would be actively processing not just their probability of future behavior but their desires and lifestyle choices as well that reflect some conscious cognitive reflection.
Among those at increased risk of alcohol and other drug use, prior research has consistently documented that these individuals have erroneous and exaggerated beliefs about prevalence among the peer group. Descriptive prevalence measures typically ask respondents to estimate what proportion of friends or same-age peers use substances. Response options across studies varied but typically centered on one of two response sets. The first included options such as none, some, half, many, or all. The other option was to ask respondents to estimate an exact percentage who used.
It should be noted that we distinguished between descriptive and injunctive norms in our analysis. Injunctive peer norms, while predictive, were not as important as descriptive peer norms. Thus, while approval or disapproval from peers plays a role, it is young people’s perceptions about what their peers do that is more important. As with intentions, it is worthwhile to consider explanations about how normative beliefs develop. One explanation may have to do with what is observed within the immediate friendship group as opposed to the peer group at large. While some surveys asked questions that referred to general same-age peers, others asked specifically about friends. However, there appears to be an over-estimation even among this group. It is also possible that there is a perceptual bias that is due to natural tendencies to take highly visible but rare cases and think that these cases reflect the more general case. Estimates may also reflect rumor and hearsay and may be forward looking in that attention may be paid to slightly older peers who, by virtue of their age, are in fact more likely to use.
It should be noted that in our analyses, both intentions and normative beliefs about prevalence have an age-related gradient such that the average values for younger adolescents reflect low risk. With increased age, not only do average intention and normative belief scores shift towards higher risk, but the distribution of scores spreads as well. This implies that there are developmental processes that need to be considered in explaining the role of intentions and normative beliefs as predictors of behavior. In either case, including intentionality as a target for intervention as well as a marker of risk in evaluation is highly recommended by our research findings.
Limitations
This study used datasets that were collected spanning four decades, the 1980s through the decade that began in 2010. This time span corresponds to a variety of refinements in survey research methods. In some respects, it is remarkable that survey topics remained relatively consistent across studies from various decades. Nonetheless, it is possible that they may have been year-of-study effects that may affect outcomes. There are trends associated with alcohol, tobacco, and marijuana prevalence that may affect the relations between use and psychosocial variables that we failed to detect. We note that seven datasets that were included were from our own previous research. These accounted for 25% of the cases that were analyzed. While it is possible that a bias may have been introduced, it is not clear what such a bias might be.
Even though we collected survey data from studies that included multiple waves of data, our analyses did not endeavor to assess longitudinal relations between psychosocial constructs and behavior. There is a strong bias for conducting analyses in which psychosocial variables are used to predict lagged behaviors (Davies & Pickles, 1985). Instead, we used cross-sectional analyses. In part, we are aware that, despite the preference for longitudinal analyses, this is not without controversy (Rindfleisch et al., 2008; Wunsch et al., 2010). Our goal is to use a combination of psychosocial measures as a proxy for concurrent substance use. This goal is easily achieved through cross-sectional analysis. Later analyses may make use of the pooled, harmonized dataset to complete longitudinal analysis.
Conclusion
We pooled a large number of surveys from 25 studies that longitudinally assessed demographic characteristics, past 30-day alcohol use, drunkenness, smoking cigarettes, using marijuana, and a host of psychosocial constructs. Intentionality, peer descriptive normative beliefs, and age emerged as being of primary importance in predicting use. Additional constructs – peer injunctive norms, beliefs about the positive and negative consequences of use, and attitudes – were demonstrated to have the potential to augment substance use predictability. Moreover, there were clear developmental patterns in how intentionality and descriptive normative beliefs changed with age. In both cases, young people have positive intentionality and do not see the prevalence of alcohol and other drug use as widespread. Both gradually erode for some youth as they grow older. The goal of analyses was to define age-related psychosocial profiles that can be used prospectively to estimate substance use risk. These profiles are useful in creating virtual control cases for evaluating disseminated prevention programs.
Supplemental Material
Supplemental Material - Psychosocial Indicators of Adolescent Alcohol, Cigarette, and Marijuana Use: An Analysis of Normalized, Harmonized, and Pooled Data
Supplemental Material for Psychosocial Indicators of Adolescent Alcohol, Cigarette, and Marijuana Use: An Analysis of Normalized, Harmonized, and Pooled Data by William B. Hansen, Santiago Saldana, and Edward Hak-Sing Ip in Evaluation & the Health Professions
Footnotes
Declaration of Conflicting Interests
The author(s) declared the following potential conflicts of interest with respect to the research, authorship, and/or publication of this article: Results of these analyses are used in a commercialized evaluation tool, Virtual Controls, for which the first author has a fiduciary interest.
Funding
The author(s) disclosed receipt of the following financial support for the research, authorship, and/or publication of this article: This project was funded by a grant from the National Institute on Alcohol Abuse and Alcoholism, grant number 2R44AA024657.
Ethical Approval
This study was performed in accordance with the ethical standards as laid down in the 1964 Declaration of Helsinki and its later amendments or comparable ethical standards.
Informed Consent
This study involved only secondary data analysis. There was no information that would identify any individual. Survey respondents were identified only by a non-traceable ID number. As part of our agreement with researchers who submitted data, they, their research institution, and information that might identify them or their projects has been withheld.
References
Supplementary Material
Please find the following supplemental material available below.
For Open Access articles published under a Creative Commons License, all supplemental material carries the same license as the article it is associated with.
For non-Open Access articles published, all supplemental material carries a non-exclusive license, and permission requests for re-use of supplemental material or any part of supplemental material shall be sent directly to the copyright owner as specified in the copyright notice associated with the article.