
Abstract
To examine the effectiveness of mixed-mode methodology, this article draws on a study that used both online and paper surveys to collect data on a sample of the over 50 population in a small New England town. Respondents were offered the option of responding online or with a paper survey, an approach that addresses some of the major concerns about using online surveys among groups with limited Internet access while also reducing costs and simplifying data entry. The authors demonstrate that response mode does not have a significant effect on survey answers once demographic variables (such as employment and income) are added to the analysis. In addition, the results from this survey suggest that the Internet is useful as a tool to collect data from those over 50.
Online surveys often target populations expected to have regular access to the Internet, such as students or university staff (Best et al. 2001; Börkan 2010; Couper, Traugott, and Lamias 2001; Sax et al. 2003). Mixed-mode methods for surveys are increasingly popular (Dillman 2007), and there is some indication that there is a limited “mode effect” for online versus paper surveys (Börkan 2010). Despite this, few studies consider the effectiveness of online survey options specifically for older populations. For example, Shih and Fan’s (2008) meta-analysis of the response rate for 39 studies compared the effectiveness of online and paper surveys, not one of which specifically considered older (50+) populations.
Many researchers assume that the Internet is an ineffective way to access populations over the age of 50, at least in part because older populations are less likely to have access to and make use of online resources (Loges and Jung 2001; National Telecommunications and Information Administration [NTIA] 2002). But few analyses confirm these assumptions, and recent research suggests that a large portion of older adults use the Internet (Pew Internet & American Life Project 2011). 1
In this article, we examine the approach of combining online and paper surveys for effective data collection for those over the age of 50. Drawing on data from a survey of a small New England town, we compare the response rate and demographic patterns for online and paper surveys for those who are 50 and older.
Purpose
The original purpose for this survey was to assess the quality and rate of use for programs and services at the local senior center. When respondents were given the choice to complete a survey online or in paper form, we suspected that there would be some demographic differences between the two self-selected groups (i.e., income and age may be related to Internet access and facility). Based on other evaluations of mixed-mode survey design (Best et al. 2001; Börkan 2010; Sax et al. 2003; Dillman 2007) as well as online surveys of young cohorts and preexisting groups (Couper et al. 2001; Couper et al. 2007), we hypothesized that older adults’ demographic characteristics would outweigh response mode as important factors in understanding their lifestyles (e.g., health and well-being, mobility, contact with family, and use of local services for seniors). If response mode did indeed have a limited impact on the analytic outcomes of the survey, we could strengthen the argument that the mixed-mode approach is an appropriate way to increase response options for data collection among an older population.
Relevant Literature
Older populations and the Internet
There are striking differences in the use of digital technologies between older and younger populations, with older populations less likely to access the Internet (Loges and Jung 2001; NTIA 2002). And yet as younger and more technologically savvy populations age, knowing how to effectively survey the senior population will become more useful. Younger cohorts, particularly those under 65, are more likely to use the Internet than older cohorts (Eriksson-Backa 2003; Millward 2003), at least in part because they may still be in the workplace (Haddon 2000). In addition to age, demographic factors such as higher income and education (Loges and Jung 2001; Lorence and Park 2007; Morris, Goodman, and Brading 2007) are positively correlated with Internet use.
As for other concerns for older adults, such as frequency of leaving the house, it is difficult to parse whether Internet use prompts individuals to be more engaged with their communities or if those who are more connected with others are likely to feel more confident about using the Internet (Cody et al. 1999; Czaja et al. 1993; Czaja and Sharit 1998). For example, those over the age of 55 who do use the Internet report that Internet access has a positive impact on their lives (Morris et al. 2007), and there is some evidence that Internet access may help older individuals maintain their physical health (Philbeck 1997). White et al. (2002) found that older Internet users were less lonely and experienced less depression than their nonuser counterparts, though, again, causality is difficult to establish.
While there have been numerous studies on the relationship between Internet use and correlated concerns among older adults, Couper et al. (2007) conducted one of the few web-based analyses on respondents age 50 and over. Using a self-selected group, Couper et al. found that those older persons who use the Internet regularly are likely to be in better health, to have a higher income, and to be more educated than those who do not. Couper et al., however, conducted only a web-based survey and, perhaps more importantly, collected survey responses only from a subset of already willing participants. This study contributes to analyses of Internet use for data collection with a population over the age of 50, focusing on whether or not the response mode (online vs. paper) that respondents selected resulted in significantly different answers to key survey questions.
Senior centers and health assessment research
There are approximately 11,000 senior centers in the United States (National Council on Aging 2012), a significant drop since 2005 (Salari, Brown, and Jacqueline 2006). Senior centers can reduce psychological stress (Farone, Fitzpatrick, and Tran 2005), provide seniors with important information (Tang and Lee 2011), and improve social networks (Aday, Kehoe, and Farney 2006). This is particularly true when senior center programs and services reflect the needs of the specific populations they serve (Aday et al. 2006; Farone et al. 2005; Yoon 2005; Yoon and Lee 2007). In addition, as baby boomers age, the needs of the senior population are likely to shift (Milner 2007; Young 2005), and the ability of senior centers to recognize and meet these needs is important for their longevity as organizations. Despite this, many senior centers face reduced funding (Alt 1998; Hostetler 2011) and have a need to demonstrate their usefulness to public and private funding sources (Hostetler 2011; Taylor 2011).
Those who conduct health assessment surveys of senior populations often use senior centers as a convenient source for participants (some examples include Beverly et al. 2005; Choi and McDougall 2007; Fitzpatrick et al. 2005). While this is entirely understandable, those who use senior centers often differ from their non-center-using counterparts, and expanding the sampling method to draw from all seniors living in the community may increase the representativeness of the sample. Furthermore, community-wide health assessment endeavors may be improved by combining traditional paper survey methods with an online survey component. Adding the option for survey participants to respond online can increase accessibility by adding audio components (Dillman 2007), can simplify administration by utilizing skip fields and answer piping (Dillman 2007), and can reduce costs associated with paper surveys and data entry (Couper and Miller 2008; Wright 2006).
Online surveys and mixed methodology
The use of the Internet for collecting data is becoming more common (Couper et al. 2007). Marketing researchers began using web-based surveys before those in many other fields (Dolnicar, Laesser, and Matus 2009), though at this point the use of web surveys is common in any number of academic fields, including the social sciences, medicine, and education (Lefever, Dal, and Matthíasdóttir 2007; Shih and Fan 2008). Examining the efficacy of web-based surveys (Berrens et al. 2003; Best et al. 2001; Ilieva, Baron, and Healey 2002) is vital as it is clear this method of data collection is here to stay. Some studies have used the Internet to access difficult populations (Andrews, Nonnecke, and Preece 2003) such as egg donors (Curtis 2010) or to address sensitive topics such as how gay, lesbian, and bisexual college students define “having sex” (Mustanski 2001). As a result, it is important to examine the validity of web surveys more generally but also to consider how researchers can use the Internet to access underrepresented populations.
Because many studies that use online methods recruit participants from online sources, the most common critique leveled at the use of online surveys is the difficulty in achieving a representative sample, primarily because only a subset of the population has regular access to the Internet. Limited access to the Internet can include having an email address that works, the resources to go online, and the ability to use the Internet. We argue that online surveys can be used more effectively with populations that have limited access to the Internet if participants are recruited using paper methods and provided with an option to respond online because this allows researchers to draw from a more representative participant pool. This mixed-mode approach can help to address the most common issue with online survey use.
In an assessment of studies done using web-based surveys, Shih and Fan (2008) found that the average response rate for a web survey was 34% and that web-based surveys had about a 10% lower response rate than mailed surveys (p. 257). Research suggests that web-based surveys are most effective when used as part of a mixed-mode study (Börkan 2010; Couper et al. 2007; Greenlaw and Brown-Welty 2009; Schonlau, Asch, and Du 2003). While a mixed-mode methodology does not address all of the potential concerns for the use of online surveys, this approach does seem to provide higher response rates (Dillman et al. 2009; Ilieva et al. 2002), and for that reason mixed-mode surveys are worth considering even though they are more expensive than web-only surveys (Greenlaw and Brown-Welty 2009). Combining the use of paper and web surveys may also contribute to the robustness of outcomes (Dolnicar et al. 2009). This is particularly important when the outcomes of interest among the target population may be correlated to Internet use (Robinson and Martin 2009; Sum et al. 2008; Sum et al. 2009).
Survey Method
We examined data from a mixed-mode community-based survey of adults aged 50 and over, where respondents were offered the option to complete an online questionnaire or a mailed paper questionnaire. The primary goal of this survey was to assess the needs of the senior and soon-to-be senior population of the town of Amherst, Massachusetts. The Amherst Council on Aging (ACA) requested that the principal investigators (PIs) design and implement a survey to accomplish this goal. The survey instrument asked respondents about their use of the Amherst Senior Center (ASC), financial strains, health needs, and worries for the future. Respondents were not offered a gift or reward for participating in the survey.
The survey was mailed to individuals age 50 and older residing in Amherst. The ACA provided the PIs with a list created from the town’s street directory and the newsletter mailing list. The list included both those who rented and those who owned their home. The street directory was publicly available and linked to owning a landline, so those who did not have a phone or who used cell phones exclusively were not included. However, a recent study using the Current Population Survey indicated that the percentage of persons over 55 who had only a cell phone was less than 2% (Tucker, Brick, and Meekins 2007). An additional limitation was that individuals living in group quarters (such as nursing homes) were not included in the street directory. That said, the ASC mailing list included names that were not listed in the street directory, and so captured some of those who did not have a landline or who lived in group homes, resulting in a list that came as close as possible to a complete universe of residents age 50 and older living independently.
To address the potential weaknesses in using an online survey, the researchers in this study used a different approach than other online survey studies. Rather than relying on respondents having (and checking) a working email address, the researchers sent potential respondents a postcard inviting them to participate in a survey by giving them a link to participate online and letting them know that a paper copy of the survey would arrive in a couple of weeks for those who did not respond online. Identification numbers were assigned as passwords to enter the online survey and were used to track respondents and ensure that only those who did not respond online received a paper survey, The questions on the web version of the survey were identical and presented in the same order as the paper survey. Because the PIs collected both paper surveys and online surveys, and since lack of Internet access was not a barrier to participation, we can compare online and paper respondents and examine meaningful differences in their responses and assess online surveys as a resource for studying older populations.
The PIs randomly selected 1,800 names from the list (a random sample of approximately 30% of the total list) and contacted the potential respondents in two waves. Anticipating a response rate of 40% (Dillman 2007; Shih and Fan 2008), the 1,800 names represented a likely response pool of 720, which would allow for a reasonable assessment at the desired level of precision for a town the size of Amherst (Iarossi 2006).
The first wave of respondents (n = 1,100) was sent a postcard with a link to the survey and a password and identification number. 2 After two weeks, everyone in the first wave who had not yet filled out the survey online was sent a paper copy of the survey (similar to Millar and Dillman 2011). The mailing included a cover letter with further details, a return postage-paid envelope, and a paper questionnaire. The second wave of survey invitations (n = 700) was sent out four weeks after the initial mailing following the same procedure (postcard, then paper questionnaire).
Of the 1,800 survey invitations sent out, 118 were returned undeliverable, usually because the respondent had moved or was deceased. The research team received 735 usable survey responses (response rate = 43.7%), 212 online and 523 paper responses. Nine respondents (or 4.3% of the online respondents) returned a hard copy of the survey that included a letter or note indicating they had also filled the survey out online. Four of the nine were from the first wave, and the remaining five were from the second wave of surveys. The PIs opted to use the electronic version of these surveys because the data entry for the online survey was already completed. A comparison of respondents age 50 to 64 versus 65 and older showed that while the raw numbers of online respondents were about evenly distributed between the two age groups (n = 104, n = 108), a significantly higher proportion of respondents ages 50 to 64 selected the online survey, compared to the proportion of respondents ages 65 and older (33.9 vs. 25.2%, p = .007).
There were no follow-up mailings after the paper questionnaire was sent; although the response rate was good, additional funds for follow-up contact may have increased the response rate further. For the analyses reported in this article, we selected only responses where there were no missing values on the items of interest (n = 569, 139 online, 430 paper). 3
Survey instrument
Several areas of program evaluation and needs assessment were included in the survey that covered respondents’ relationship to the senior center and their mobility and independence. For this study, to assess whether the response mode had an effect on the findings, we focused on the central themes of the survey: respondents’ independence and well-being and their use of ASC services.
Online versus paper
Responses were coded during data entry if they were returned online or on paper. Respondent codes ensured only one response mode.
Demographics
Standard demographic items included highest year finished in school, income, age, working full- or part-time, marital status (binary married or living with partner versus not married), gender (binary male or female), and race (binary White or non-White)
Health and well-being
We selected a few key items to approximate respondents’ emotional, physical, and financial health. Emotional health was measured using a single item, “Do you often feel sad or lonely?” where 1 = yes. Physical health was measured using a single item, “How would you rate your health,” and recoded so that 0 = very poor and 3 = excellent. Financial health combined 11 instances where respondents indicated whether they were concerned they could not afford important items (e.g., rent/mortgage, food, medicine) and constituted a scale ranging from 0 (not concerned about any items) to 1 (concerned about all 11 items).
Mobility and family contact
Responses to the question “How many days per week, on average, do you leave home for any reason?” were recoded so that 0 = none and 4 = every day. The survey included two questions about respondents contact with their family: “How often do you speak to members of your family on the phone or exchange emails?” and “How often do you see members of your family?” Responses were combined so that 0 = rarely or never have contact with family and 3 = daily contact with family.
Senior center services
The community-based survey asked seniors about their experiences with the ASC, including whether they used any services (referencing a list of 13 specific services and a general “other” category), which services they used, how frequently, and how satisfied they were with those services. Ever using any of the services (including health and fitness services, meal service, activities and trips, and educational services) was combined into a single item ranging from 0 = 0 services to 1 = used all services listed. Frequency of using services ranged from 0 = never used any services to 4 = used any service at least once a week.
Results
Our analyses compare online and paper respondents to examine any differences between the groups on central items of interest for the local senior center. Our analyses examine differences between respondents that are more significant than response mode (i.e., education, income, work status, and age).
When comparing outcomes of interest to the senior center, initial comparisons between online responders and paper responders suggested some differences. For example, online responders were less likely to have taken advantage of senior center programs, and they left the house on more days during an average week. To further investigate the possible effects of self-selected response mode, we used ordinary least squares (OLS) regressions to test issues of interest to the senior center. We found that any possible effects the online or paper response may have had on the survey outcomes were mediated by demographic differences between groups. Demographic differences that were more significant than response mode varied by dependent variable, and included education, income, work status, and age.
To address selection effects often present in nonexperimental social research and further complicated by the fact that respondents were not randomly assigned to a response mode, we included the Heckman two-step correction in the analyses, which allows us to account for possible selection bias to the extent that it may affect outcomes of interest (Bushway, Johnson, and Slocum 2007; Copas and Li 1997). In the first step, we used logistic regression to construct a probit estimate (Lee 1983; Smits 2001). The independent variables were demographic items: education, income, working full- or part-time, age, marital status (binary married or living with partner versus not married), gender (binary male or female), and race (binary White or non-White). This created the individual probabilities that were used to construct the individual probit scores, which were then used to compute the lambda for each case. In the second step, selected demographic variables used in constructing the probit estimate were excluded from the OLS regression models presented in this article (marital status, gender, and race), while other demographic variables were left in (education, income, work status, and age).
Response mode
Demographic differences between online and paper respondents are shown in Table 1. Online respondents, on average, reported having slightly more education than paper respondents, had a slightly higher income, were more likely to work full- or part-time, and were about two years younger.
Comparisons of Online and Paper Respondents.
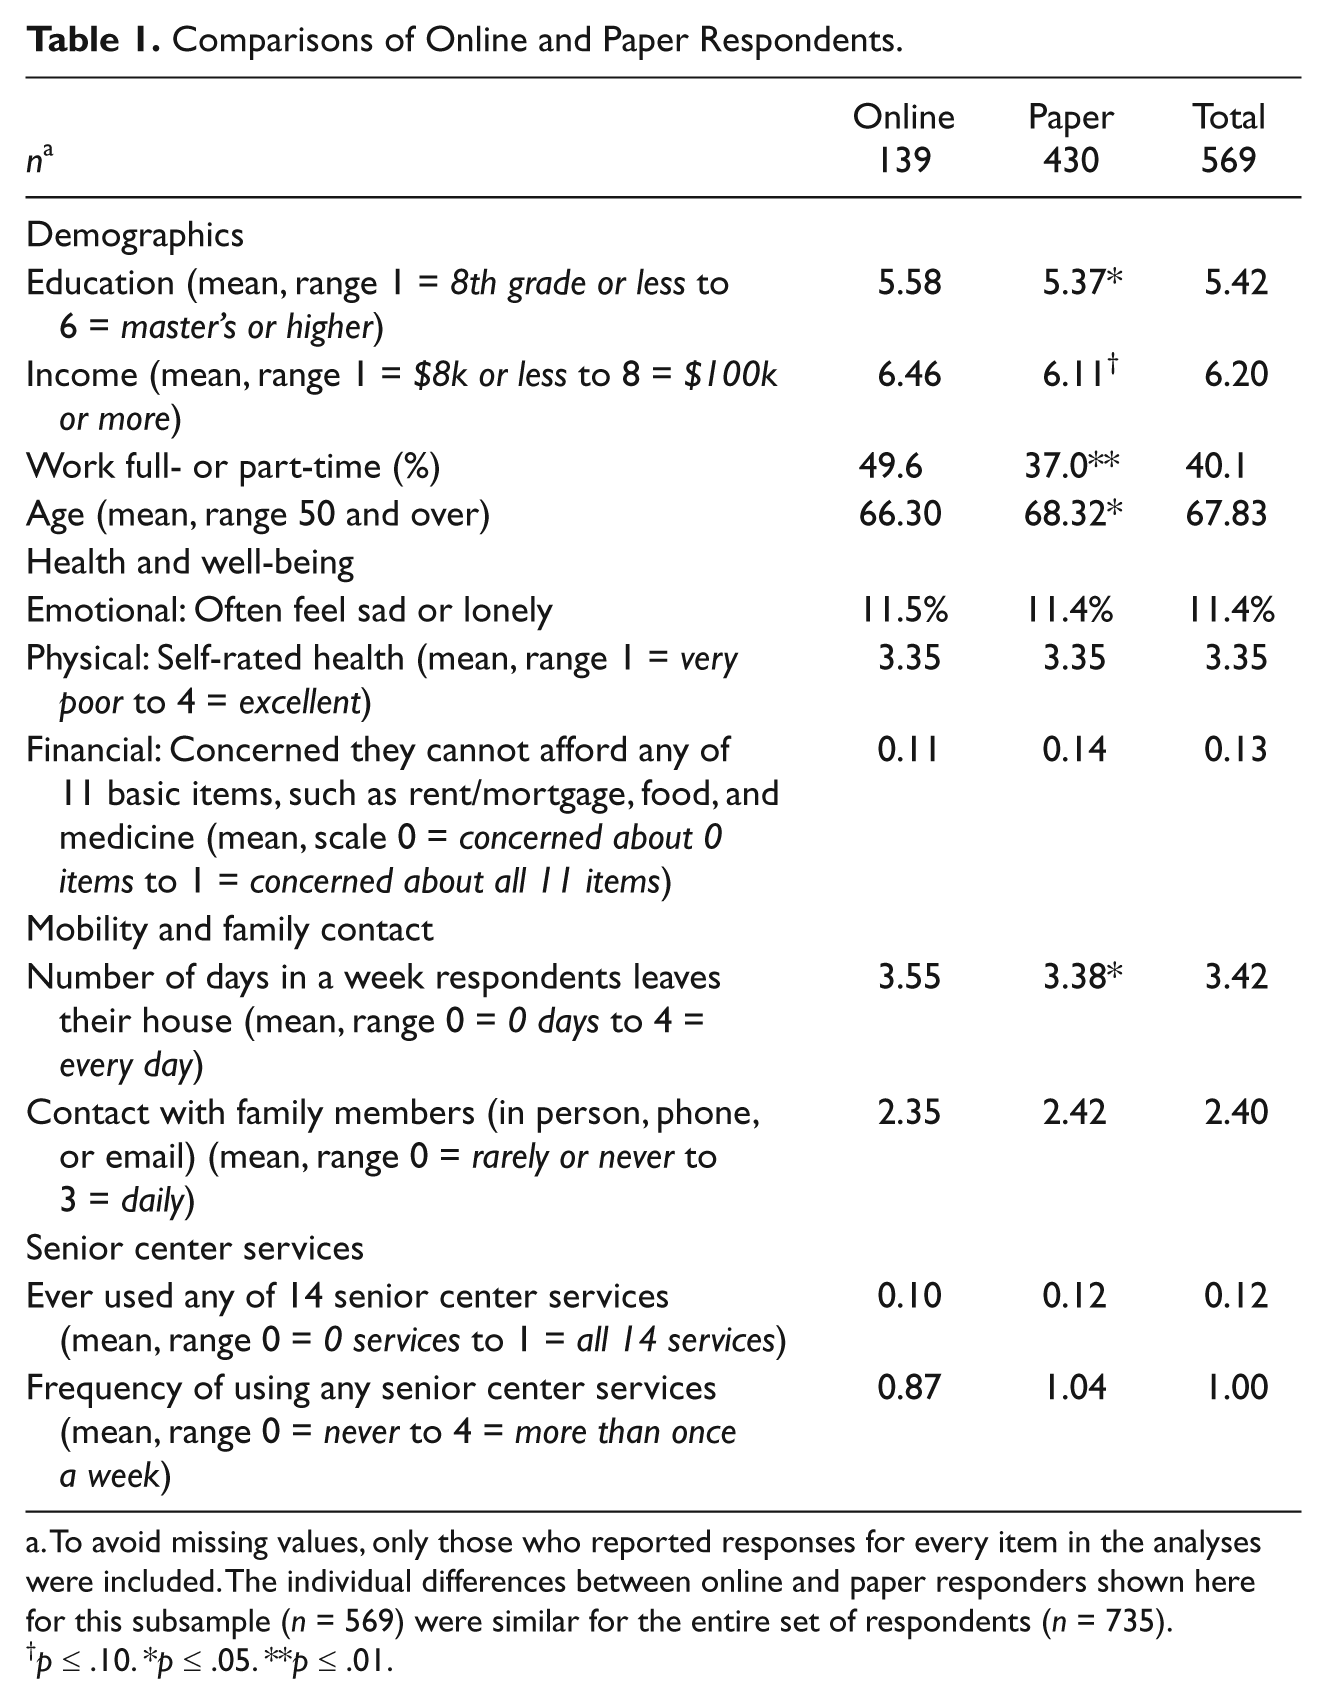
To avoid missing values, only those who reported responses for every item in the analyses were included. The individual differences between online and paper responders shown here for this subsample (n = 569) were similar for the entire set of respondents (n = 735).
p ≤ .10. *p ≤ .05. **p ≤ .01.
We expected to see some differences in health and well-being, independence, and family contact when we compared online and paper respondents because we suspected that for this age group, respondents with ready access to technology and facility with the Internet might be more active or have more outside contact when compared with other seniors. As shown in Table 1, both online and paper responders reported low rates of feeling sad or lonely, rated their own health quite high, and were not concerned about many basic living expenses. Those who responded online left their house more frequently during an average week, but there were no differences between the groups in the frequency of their contact with family members. There were also no significant differences between online respondents in terms of whether or not they had ever used senior center services, and there were no significant differences in the frequency with which respondents used senior center services.
Having established that there were no significant differences on the substantive measures of interest to the ASC but that there were significant demographic differences between response modes, we devised OLS regression models to test the effect of response mode when accounting for demographic variables. We employed the Heckman two-step correction (lambda variable) to address selection bias that may be present as a result of self-selection to response mode. Finally, we constructed an alternative model to investigate additional factors, such as health and well-being, that could have a more significant effect than response mode on mobility, family contact, and use of the senior center, and also tested that model using the Heckman correction. Having established that the mixed-mode method is an appropriate way to survey the population, this last model is designed to consider alternative explanations for differences among older adults in a community-based needs assessment.
Health and well-being
In initial analyses, there were no apparent differences between online and paper respondents in terms of their self-reported emotional, physical, and financial health, and for the most part OLS regression analyses returned similar results. The only significant difference was on the emotional health item (often feeling sad or lonely), shown in Table 2. The inclusion of the lambda variable in the model (to account for self-selection bias between online and paper responders) affected the results so that online responders were significantly less likely to feel sad or lonely compared to paper responders (Model B).
Ordinary Least Squares Regressions on Respondents’ Health and Well-Being.
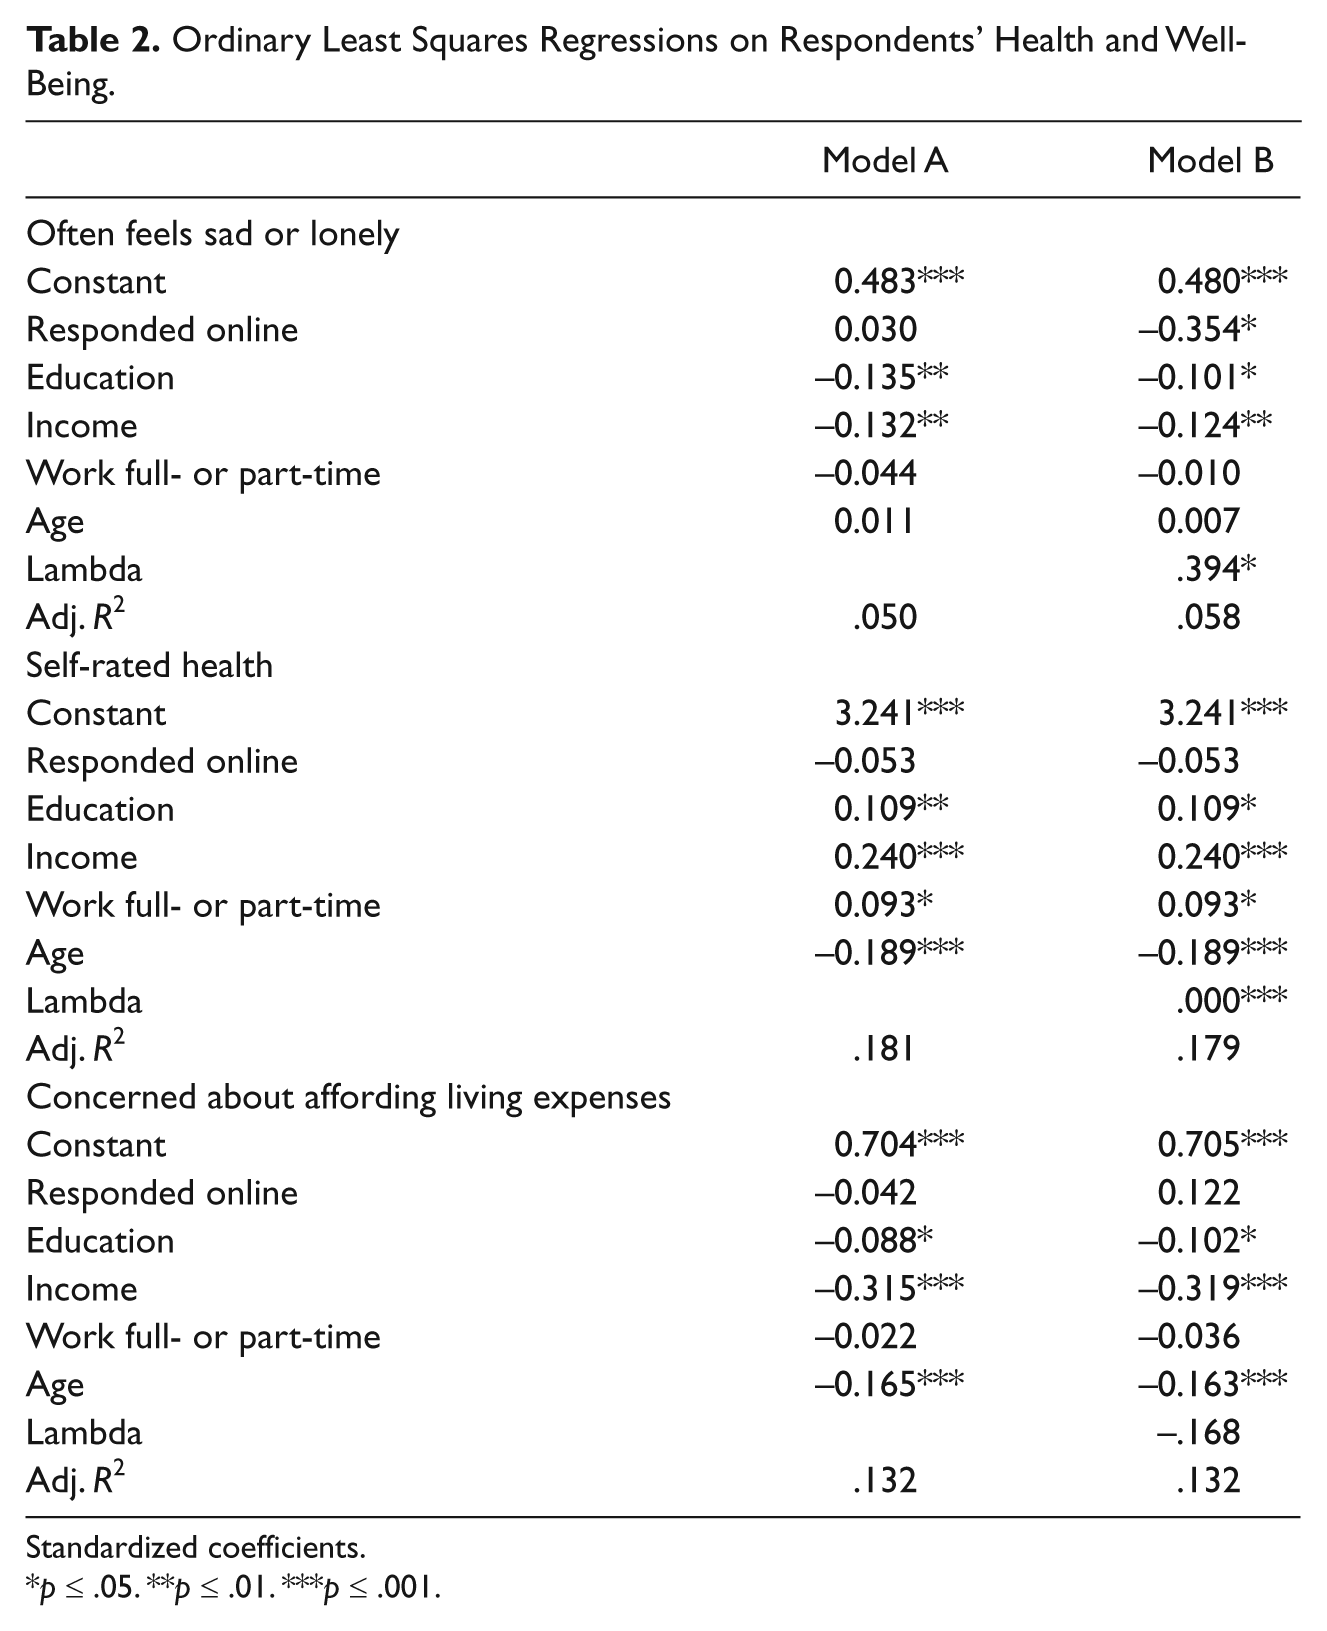
Standardized coefficients.
p ≤ .05. **p ≤ .01. ***p ≤ .001.
Mobility and family contact
Although descriptive analyses pointed to slight differences in respondents’ mobility (online respondents left the house more days in a week than paper respondents), OLS regression results showed that when key demographic variable were accounted for, response mode did not have any correlation. As shown in Table 3, respondents’ education, income, work status, and age were all far more important in understanding respondents’ mobility than the response mode for the survey (Model A). The addition of the lambda factor to account for selection bias did not change the explanatory power of the model, and it had only a modest impact on the effect of each of the significant factors (Model B).
Ordinary Least Squares Regressions on Respondents’ Mobility and Family Contact.
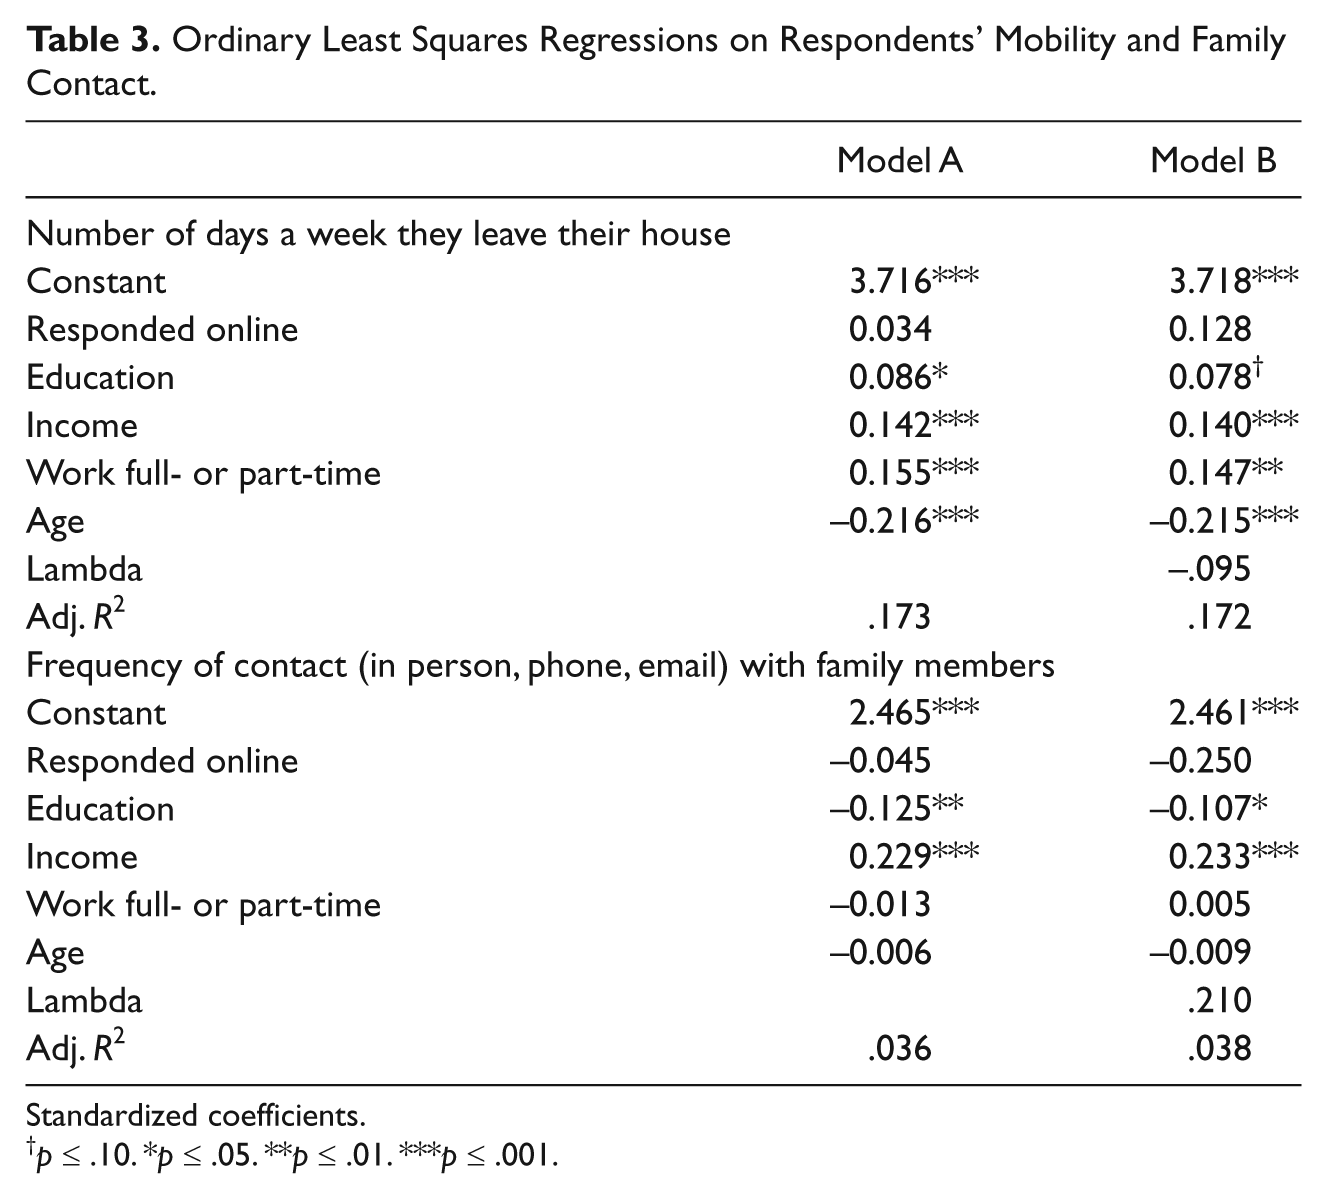
Standardized coefficients.
p ≤ .10. *p ≤ .05. **p ≤ .01. ***p ≤ .001.
Similar analyses were conducted for frequency of contact with family, with slightly different results, also shown in Table 3. Again, response mode had no significant relationship to frequency of family contact, and the model changed very little with the introduction of the Heckman correction. Education was significant and had a negative relationship to frequent family contact, and income was significant with a positive relationship to frequent family contact.
Use of ASC services
Ever using any ASC services and the frequency of using ASC services were examined employing the same series of OLS regression models, as shown in Table 4. We confirmed that response mode did not have any relationship to whether or not respondents reported using senior center services, and demographic variables were the strongest predictors of using ASC services. In all three models, education and age were significant and positively correlated with using ASC services, and income and working full- or part-time were significant and negatively correlated. The introduction of the Heckman correction had no notable effect on the analyses for using ASC services. The demographic variables were all significant in the health and well-being models.
Ordinary Least Squares Regressions on Respondents’ Use of Senior Center Services.
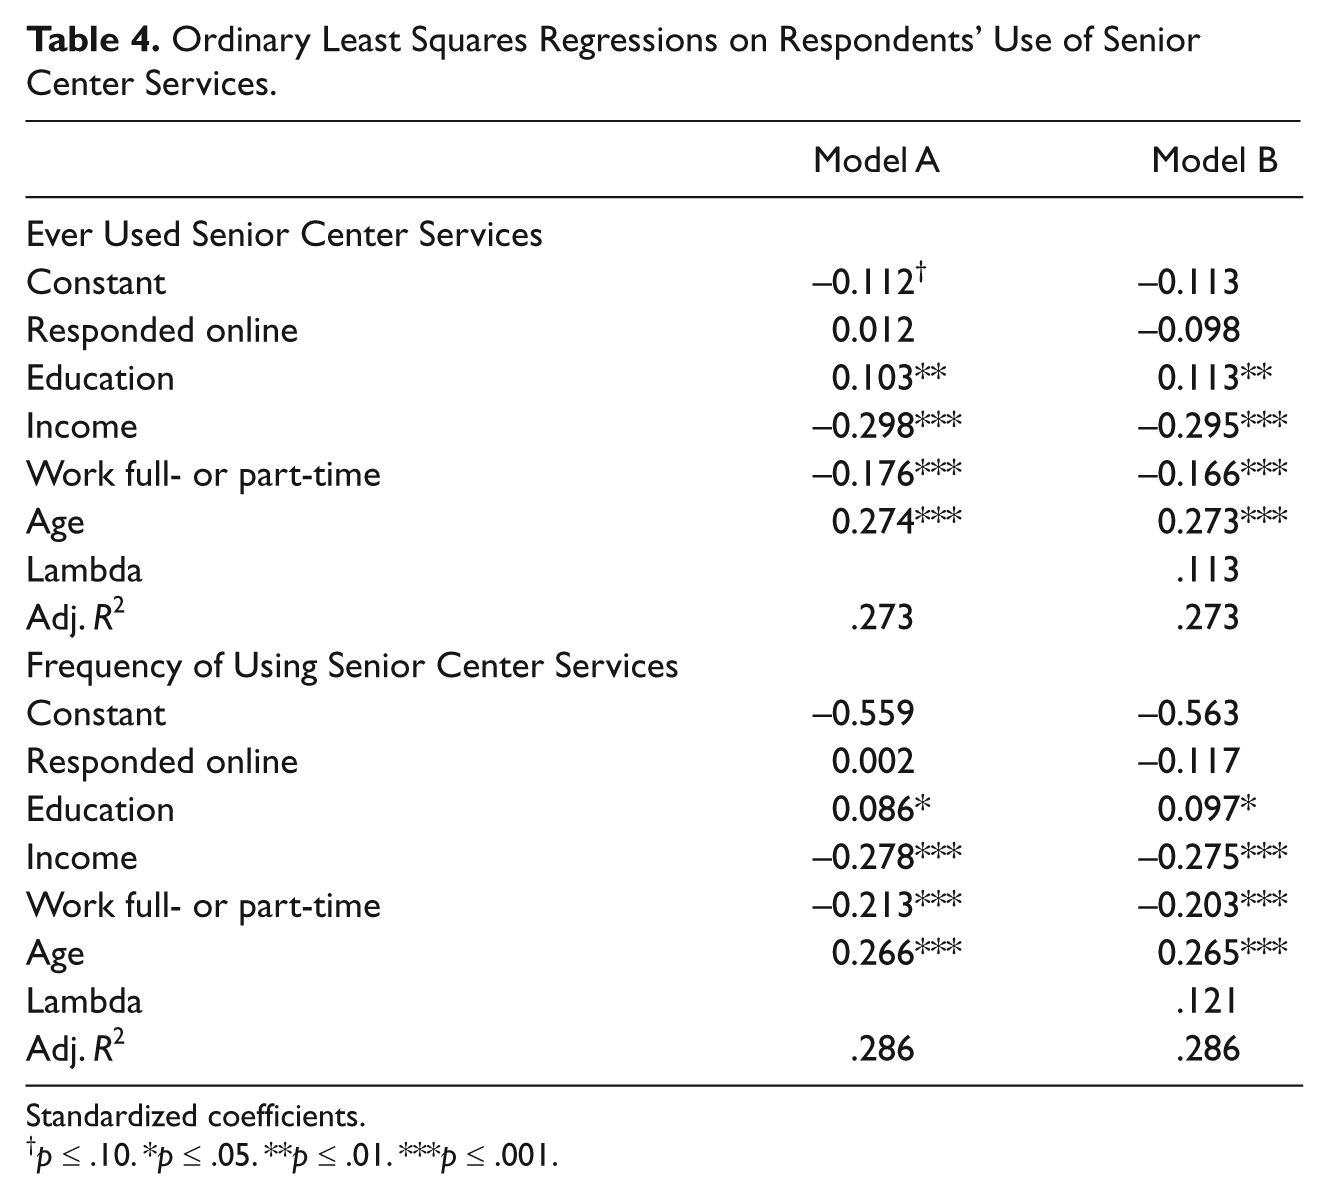
Standardized coefficients.
p ≤ .10. *p ≤ .05. **p ≤ .01. ***p ≤ .001.
Discussion
The results discussed above indicate that there were few differences between the online and paper respondents, suggesting than an online option for surveys is a reasonable strategy for researchers seeking to access older populations, including seniors ages 65 and over. The small demographic differences were expected (online respondents had a little more education and a little more income, were more likely to work, and were a little younger) and were consistent with other studies that found positive correlations between higher income and education and increased Internet use. We used the Heckman two-step correction to account for those differences between groups within the survey and found that the introduction of the resulting factor did little to change the OLS regression models that were constructed without it. There is evidence of few differences between online and paper respondents to surveys of younger populations (Carini et al. 2003), and this study confirms that the same is true for older populations.
We expected that demographic differences would be more important than response mode in predicting respondents’ mobility, family contact, and use of the ASC services. We found that when it came to issues of interest in a community survey of senior citizens, demographic factors—such as higher education or employment status—far outweighed the differences between the two self-selected response modes. That is, response mode did not account for the most significant variations among respondents. There was one result (Table 2, Model B) where once we accounted for self-selection, online responders were less likely to feel sad or lonely than paper responders, a finding consistent with literature linking Internet use to emotional health among older adults (White et al. 2002).
The Internet’s value as a research tool is undeniable; and yet it is important for researchers to examine the best ways to use the Internet to effectively collect data. Most studies comparing online and paper respondents are designed by randomly assigning participants to a response group rather than allowing respondents to self-select their response mode. Self-selected response mode alone did not have any significant effects on the issues of interest for the senior center survey. But the demographic factors that were significantly different between the online and paper respondents (i.e., age, work status) were also significantly correlated with the issues of interest. These findings suggest that by giving respondents an option for how to complete a survey, mixed-mode survey administration may still reach a broad population, and the self-selected mode itself has little influence on the major outcomes of interest.
Furthermore, given that a large percentage of the population is increasingly comfortable with technology, as more computer-savvy generations age it is increasingly feasible to conduct online surveys with older populations. Our findings suggest that researchers may benefit from including online surveys as part of their work when they are collecting data from those 50 and over. Where practical, researchers may also consider oversampling nonworking, older, less educated respondents with lower incomes as one way to address discrepancies between the likely online response pool and the overall population.
In addition, our data collection methods used a sample that drew from seniors living in the community, supplemented with but not wholly drawn from lists provided by the local senior center and/our Council on Aging. While some studies of older populations used convenience samples—conducting online surveys with groups of seniors who were already online (Wu and Ozok 2009) or needs assessments with seniors who were already participating in senior programming (Beverly et al. 2005)—this sampling method expanded the response pool so that the ASC could potentially learn from a cross section of older adults living in their community, not just older adults who were already part of an online community or on the senior center mailing list. The findings in this article strengthen the argument that offering older adults the option to respond online can assist senior centers in improving services to their community and increase recruitment for health assessment surveys of senior populations.
One limitation to this study is that the population surveyed was more highly educated when compared with the general U.S. senior population. Given that the study occurred in a college town and did not extensively survey those who lived in institutional settings such as nursing homes, the level of education in the respondent population is not surprising, and it limits the generalizability of the findings. Furthermore, online surveys do not appear to redress a major issue in all data collection: Less educated individuals are less inclined to fill out surveys (Couper et al. 2007; Dillman et al. 2009). Mixed-mode survey administration may not address this concern over nonresponse that is common to survey research. Related to this, there were no opportunities to compare respondents to nonrespondents, as the lists were drawn from a community list that did not provide data on nonrespondents; this is a common limitation to community-based research. The sample included for these analyses was not only highly educated but also highly responsive, as they were able to answer (positively or negatively) all of the items that were used to construct our models, and so another limitation was our choice to use listwise elimination for missing values rather than imputing missing data. While the choice was appropriate given the uncertainty of nonresponse and hazards of imputation, this introduced bias toward respondents who are more comfortable completing such a questionnaire, a bias perhaps consistent with the high level of education of the possible response pool. Finally, two thirds of respondents still chose to complete paper (71% of respondents) rather than online (29%) questionnaires, so while online surveys are useful with this population, we would not say that older adults are universally likely to respond to online surveys.
Conclusion
Factors other than response mode explain the variations in the results between online and paper surveys. For senior center administrators and those conducting community-wide health assessments, the findings from this study suggest that a mixed-mode approach can be used to increase efficiency and reduce costs (paper, postage, data entry) associated with mailed surveys and should be considered for use in large-scale data collection among an older population, including a senior population ages 65 and older.
Footnotes
Acknowledgements
Thanks to Professors Randall Stokes and Doug Anderton for their support.
Declaration of Conflicting Interests
The author(s) declared no potential conflicts of interest with respect to the research, authorship, and/or publication of this article.
Funding
The author(s) disclosed receipt of the following financial support for the research, authorship, and/or publication of this article: These data were available through a community research study funded by the Amherst Senior Center and the Amherst Council on Aging.