
Abstract
Automated vehicles (AVs) have the potential to improve road safety and improve transportation access, particularly for older adults. As a cutting-edge technology where few have personal experience, individuals’ initial perceptions of the safety of AVs will likely stem from communications originating from various stakeholders. A survey instrument was developed to both implicitly and explicitly estimate how personal perceptions of AV safety are influenced by safety messages from different sources. The implicit measure revealed that younger adults were particularly influenced by positive safety-related information provided by average AV crash rates and official statements from AV companies. When measured explicitly, older adults reported a larger preference for safety-related messages from safety advocacy groups and a decreased preference for information from average crash rates and AV companies. Results are discussed in terms of how safety related messages from various stakeholders might be utilized to affect perceptions of AVs across adulthood.
Age Differences in the Influence of the Source and Content of Safety-Related Messages on the Perception of Safety of Automated Vehicles
Automated vehicles (AVs) present the next step forward in motor vehicle technology. Promising transportation that is safe, accessible, and cheap, the benefits of AVs are framed as an opportunity for all age and ability groups, but especially for those who face driving restrictions or do not drive. Physical and cognitive declines associated with aging result in decreases in driving ability (Anstey et al., 2005), resulting in older adults self-regulating by restricting (Molnar & Eby, 2008) and ceasing driving (Edwards et al., 2008). As such, older adults may stand to particularly benefit from AVs. But in order for AVs to fulfill any potential or promise, individuals must be willing to use them.
Older Adults and Automated Vehicles
Older adults represent a population that could particularly benefit from AVs because they combine a need for alternatives to traditional transportation options with large population size. There are over 47 million older adults (age 65+) in the United States, and this number is growing (U.S. Census Bureau, 2017). The transportation needs of older adults do not diminish as they age. Currently, approximately 90% percent of older adults hold a driver’s license (Office of Highway Policy Information, 2024), 80% of whom live in areas that require a car (Transportation for America, 2011), and 90% of whom intend to age in place (Harrel et al., 2014).
While the older adult population is incredibly diverse, some generalities can be made. First, older drivers cease driving an average of 6 to 10 years before death (Foley et al., 2002). Second, there may be a lack of financial planning around transportation, the second biggest post-retirement expense (Coughlin, 2019). Last, older adults may face diminished driving capacity due to morbidities, impaired function, or polypharmacy, and lessening comfort with driving (American Geriatrics Society and Pomidor, 2016). Driving cessation is associated with negative health outcomes, including social isolation, depression, early entry into a long-term care facility, and challenges for caregivers (AGS, 2016; Breen et al., 2007; Brown et al., 2005; Freeman et al., 2006).
Early research suggests commercially available in-vehicle technology (e.g., advanced driver assistance systems [ADAS]) can extend an older adult’s driving life span (Eby et al., 2015, 2016), and that older adults are accepting of such technology (Abraham et al., 2017) and willing to pay relatively higher amounts for them (Souders et al., 2017). AVs are a natural extension (Halpert, 2018). Guides from older adult and mobility advocacy groups enthuse about AVs as a resource for older adult transportation (Grantmakers in Aging, 2018; National Center for Mobility Management, 2018), but remain vague about whether older adults would engage with this technology.
Attitudes towards Automated Vehicles
While AVs have the potential to improve the safety of the roadway, people must still “buy-in” and agree to use AVs for them to have their intended impact. UTAUT2 (Venkatesh et al., 2003), a leading contemporary theoretical model of technology acceptance and usage behavior, has been extended to apply to automated technologies (Ghazizadeh et al., 2012) and specifically automated vehicles (Choi & Ji, 2015). This family of models all highlight the influence of perceptions of usefulness and perceived ease of use on attitudes, behavioral intention, and actual use of technology. The updated models also incorporate factors around trust, perceived risk, and positive and negative affect (Liu, Xu, & Zhao, 2019) which, depending on the particular model, influence perceptions of usefulness and ease of use as well as AV attitudes (Choi & Ji, 2015) directly. Barriers relating to trust and attitudes towards technology are also recognized as key factors in planning for the implementation of new mobility and AVs for older adults (Fraade-Blanar et al., 2021).
Experience with AVs – and in particular, the first experience (Hartwich et al., 2019) – also increases trust and perceptions of AV safety (Liu, Zhang, & He, 2019; Mason et al., 2023). This effects also holds for older adults, regardless of whether the initial experience was in a physical vehicle or simulator (Classen et al., 2021; Sisiopiku et al., 2023). But, the vast majority of the population does not currently have access to AVs. Even as commercial AVs are expanding to additional markets, they are still limited to a select number of metropolitan areas (D’Onofrio, 2025). Rather than stemming from experience, the greater public’s current perception of AVs has likely been developed from communication about AVs originating from a variety of sources, including industry insiders, government, and media. In lieu of experience, this information will likely drive individuals’ perceptions of trust, risk, usefulness, and the ease of use of AV technologies, and will resultingly affect attitudes and behavioral intentions for AVs.
Though few adults have experience with AVs, there is some evidence that having prior knowledge or being exposed to information about ADAS and AVs lowers concerns and increases willingness to use vehicles equipped with these systems (Charness et al., 2018; Greenwood & Baldwin, 2022). This effect may be particularly heightened for older adults (Baringer et al., 2024). Though findings showing the positive effect of prior knowledge are robust (Batbold et al., 2025), only a few studies have investigated differences in preferences for sources of information. In a study investigating source preferences for information about ADAS systems, older adults reported an increased preference for “fact-based” sources and a decreased preference to receive information from social media and individuals in their social network (Greenwood & Baldwin, 2022). Specific to AVs, a European study found that older adults were less willing to receive information about AVs from most media sources compared to younger adults. Within age groups, younger and middle-aged adults preferred to receive information about AVs on the internet, while older adults were most willing to receive information through television (Havlíčková et al., 2019). Though there are differences in preferences, it is important to note that older adults still report consuming news through digital means, just at rates that lag behind younger adult groups where digital news consumption is more ubiquitous (St. Aubin & Liedke, 2025). Though there is some evidence for age differences in preferences for information sources, to the authors’ knowledge, the current study is the first to explore age differences in the influence of messages from different sources on perceptions of safety.
Information about AVs received prior to experience with the technology will be important factors in the development of perceptions and future use of AVs. This may be particularly true for older age groups (Baringer et al., 2024), as they already lag behind in the adoption of new technologies (Smith, 2014) and might also be late adopters of AVs. Information about AVs will come to all future consumers through messages of differing content originating from various sources. The current exploratory study is designed to investigate if there are age differences in the influence of safety messages originating from different sources on perceptions of safety of AVs. Our expectations, supported by limited previous findings (Greenwood & Baldwin, 2022; Havlíčková et al., 2019), are that older adults will be less influenced by safety messages originating from friends and family and AV companies – sources that may be more likely to disseminate information on the internet (e.g., emails or social media posts from friends and family). Alternatively, we expect older adults to be more influenced by data driven and governmental messages – fact-based sources which may be more likely to appear in print and television media.
Methods
Data for the survey-based study was collected from 2203 adult members (23 – 90 years, M age = 58.42, SD age = 13.87, 56.7% female) of the RAND American Life Panel (ALP), a nationally representative, probability-based Internet sample comprised of more than 6000 individuals. Most ALP members use their own internet connection, but those without are provided laptop computers, internet access, or both. The survey was administered digitally in the month of April, 2020 and the data is available online (Survey ID: 543 – Autonomous Vehicle Safety; https://alpdata.rand.org/). ALP members must read and agree to the consent material prior to completion of ALP surveys.
As the sample population is not precisely representative of the overall population, weights were used in the analyses to correct for sampling error. Using demographic data from the 2019 Current Population Survey (U.S. Census Bureau, 2020) as a benchmark, raked weights were calculated by the ALP to match population proportions along five two-way distributions: gender by age, gender by ethnicity, gender by education, gender by household income, and household income by number of household members. These weights were included into the regression analyses to correct for demographic differences between the sample and the US population (e.g., ALP participants in the current study are older and include more Caucasians compared to the US population).
Materials
A survey instrument was created to investigate how respondents’ ratings of safety of AVs are influenced by safety-related messages originating from eight separate messages sources: 1. Average crash rates of AVs compared to human drivers, 2. Average near-miss rates for AVs compared to human drivers, 3. Whether the performance of AVs met or failed to meet federal safety requirements, 4. Official declarations on AV safety from the federal government through the Department of Transportation, 5. Official declaration on AV safety from the respondent’s state and local government, 6. AV technology companies’ statements (e.g., press releases) on AV safety, 7. The official position on AV safety of advocacy groups like Consumer Reports, AAA, AARP, etc., and 8. The experiences or recommendations given to you about AVs from a friend or family member.
There is a conceptual difference between some of these message sources, namely between the quantitative sources, where something is measured or a threshold is met (crash rates, near miss rates, and federal vehicle requirements), and the qualitative sources. We chose to combine these different types of messages even though there might be real-world scenarios where one or more of the quantitative sources are communicated to the public by one or more of the qualitative sources. We made this choice because messages from these two different sources may not always agree with one another. For example, in U.S. areas where AV testing is currently being conducted on roadways (https://www.nhtsa.gov/automated-vehicle-test-tracking-tool), state and local governments and AV companies have communicated to the public that AVs are safe for testing even though near-miss rates or other metrics are unable to provide any information about safety. As such, for each of the quantitative information sources the origin or measuring agency was not explicitly described (e.g., average crash rates were not described as originating from the National Highway Traffic Safety Administration).
1. Strongly show that AVs are unsafe, 2. Mostly show that AVs are unsafe, 3. Provide no information about AV safety, 4. Mostly show that AVs are safe, 5. Strongly show that AVs are safe.
These messages were communicated in the tables as two bright-red thumbs down, one dull-red thumbs down, the text “no information”, one dull-green thumbs up, and two bright-green thumbs up, respectively. A sample item is shown in Supplemental Figure 1.
For each scenario, participants then rated their perception of the safety of AVs based on that pattern of communication. Specifically, for each of the 20 scenarios, after considering the safety messages provided by the eight sources, participants indicated their perception of the safety of AVs using a slider on a scale ranging from “not at all safe” to “completely” safe. The scale also included labeled markers at positions along the scale length labeled “a little safe”, “generally safe”, and “very safe.”. For analysis purposes, the slider data was recorded as a numerical value ranging from 0 (“not at all safe”) to 100 (“completely safe”).
Analyses were conducted including 18 of the 20 scenarios for which data was collected. The two excluded items represented message patterns where all sources provided homogenous messages that AVs were unsafe (all messages either strongly or mostly unsafe) or safe (all messages either strongly or mostly safe) and were initially included to the item-set as manipulation checks. These items were removed for the analyses, as the weight of one message source cannot not be discerned from the others because they are all in agreement. This left a pool of 18 items characterized by mixed valence messages (a combination of positive, negative, and a lack of information from the eight different sources) about AV safety.
Using multiple regression analyses, the data was used to estimate the subjective weights attributed to each of the message sources and determine their relative influence on perceptions of safety. The data were fit to a linear mixed-effects regression model, included perceived safety as the dependent variable and participant as a random factor. Age, gender, and the eight safety messages from the different sources were included in the model as fixed factors. By comparing the regression coefficients, the results provided an implicit ranking of messaging sources.
Preference for message sources was also measured explicitly using a rank order measure. Participants were asked to rank the eight message sources from their most preferred to their least preferred. Lastly, participants responded to four questionnaire items related to technology and AVs. The four items were measured using seven-point Likert scales and read: “In general, how would you rate your comfort with technology?”, “I would be comfortable with riding in an AV,” “I would be concerned about riding in an AV,” and “I think advances in science and technology in the next 10 years will allow AVs to be as safe or safer than human drivers.” These results were explored descriptively.
Procedure
The survey was administered in a browser-based format and respondents were able to respond using either mobile, tablet, or computer devices. The ALP provides an Internet-connected device if the respondent does not have one themselves. Upon beginning the study, participants were first provided a brief introduction to the concept of AVs and then were introduced to the experimental items. The participants were shown an explanation of how perceived safety ratings would be provided with the response slider, the identity of the message sources, and the images indicating the different safety-related messages. Afterwards, an example item was shown and described in prose. Following the example, participants completed the 20 experimental items which were presented in a randomized order. After the 20 experimental items, participants were asked to rank order their preference for the eight message sources. Lastly, participants then responded to the four additional questionnaire items intended to gauge their comfort with technology and attitudes towards AVs. Demographic data was collected separately and provided by the ALP.
Results
The results presented in the current paper reflect a post hoc data analysis focusing on age differences in the influence of safety-related messages originating from different message sources of the subjective perception of AV safety. For the original, more general analysis, see (Blumenthal et al., 2020) and the brief summary provided below. Outlier values were removed for individuals that rated perceived safety consistently low (mean <5) or high (mean >95) across all 20 items. A total of 48 individuals were removed through this process, 46 of which responded with a mean perception of safety <5, leaving a final sample of 2155 individuals. After outliers were removed, the highest mean safety rating was 88.3 and the lowest was 5.15. Demographic information for the final sample is listed in Supplemental Table 1.
Implicit Measure of Message Source Weight
The weighting of differing safety message sources was measured implicitly using a Social Judgement Analysis design (Stefl-Mabry, 2003). For each experimental item, the five possible safety messages were numerically coded with values 1 through 5 – from “strongly show that AVs are unsafe” to “strongly show that AVs are safe” – for each of the eight message sources. These values were entered into a regression model as independent variables and used to predict perceived safety score, the dependent variable. Using this design, the influence of the messages from one source can be calculated while controlling for the messages provided from the other sources.
Linear-Mixed Models Analyzing Implicit Measures of Information Source Weights
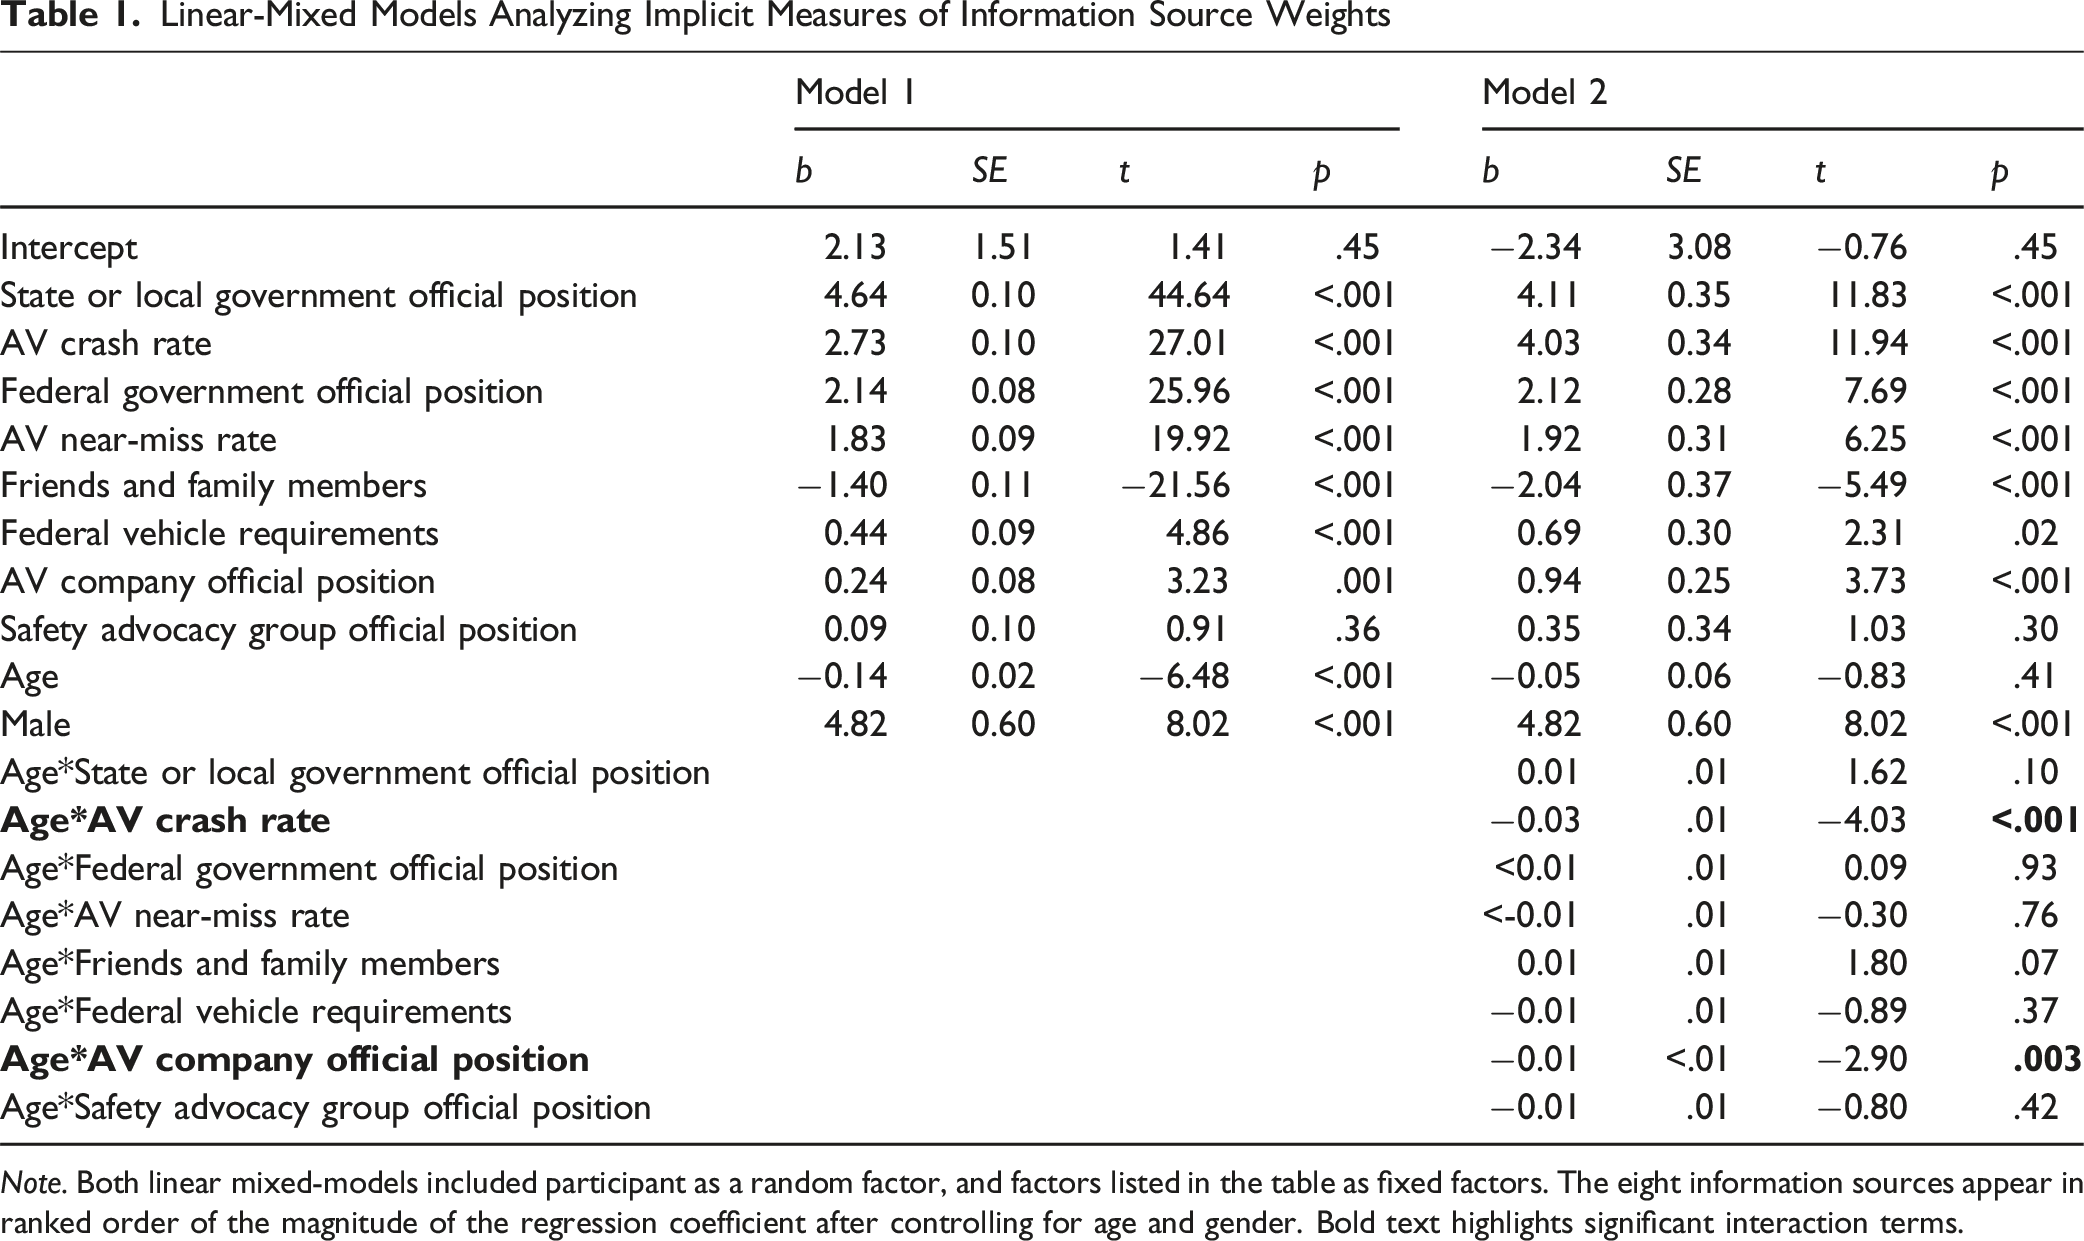
Note. Both linear mixed-models included participant as a random factor, and factors listed in the table as fixed factors. The eight information sources appear in ranked order of the magnitude of the regression coefficient after controlling for age and gender. Bold text highlights significant interaction terms.
As the purpose of this analysis was to investigate age differences, a second linear mixed-model was conducted including the interaction terms between age and safety messages from the eight sources as fixed factors. This analysis found two significant interactions. The influence of safety messages provided by average AV crash rates and by AV companies on perceptions of AV safety each significantly differed across adulthood. These interactions are interpreted in Figures 1(B) and 1(G). As expected from the results of the first model, increased age was generally associated with a decrease in perceived AV safety ratings for all messages from each of these sources. It appears that in the case of average AV crash rates, the youngest participants in the sample gave comparatively higher weight to messages that did not show that AVs were unsafe, with a relatively larger increase in perceptions of safety for the “no information” and two positive messages (Figure 1(B)). A similar trend was found for safety messages from the AV companies. The younger participants seemed to overweight positive messages from AV companies compared to adults from older age groups, showing comparatively higher perceived safety scores in response to the two positively valanced messages (Figure 1(G)). Average perceived safety rating by message from each information source. Note. For the x-axis, messages were coded as: 1 = strongly shows that AVs are unsafe, 2 = mostly shows that AVs are unsafe, 3 = no information provided, 4 = mostly shows that AVs are safe, 5 = strongly shows that AVs are safe. The figures appear in order of their regression weights from the first model, without the interaction terms. In each figure, the dotted black line indicates the average perceived safety rating across the messages from each information source. Solid colored lines represent age groups. The age groups are only used to aid interpretation of the significant interactions from the second linear mixed-effect model, where 44 and under, n = 420; 45-54, n = 347; 55-64, n = 582; 65-74, n = 555; 75 and above, n = 236. The regression models include age as a continuous predictor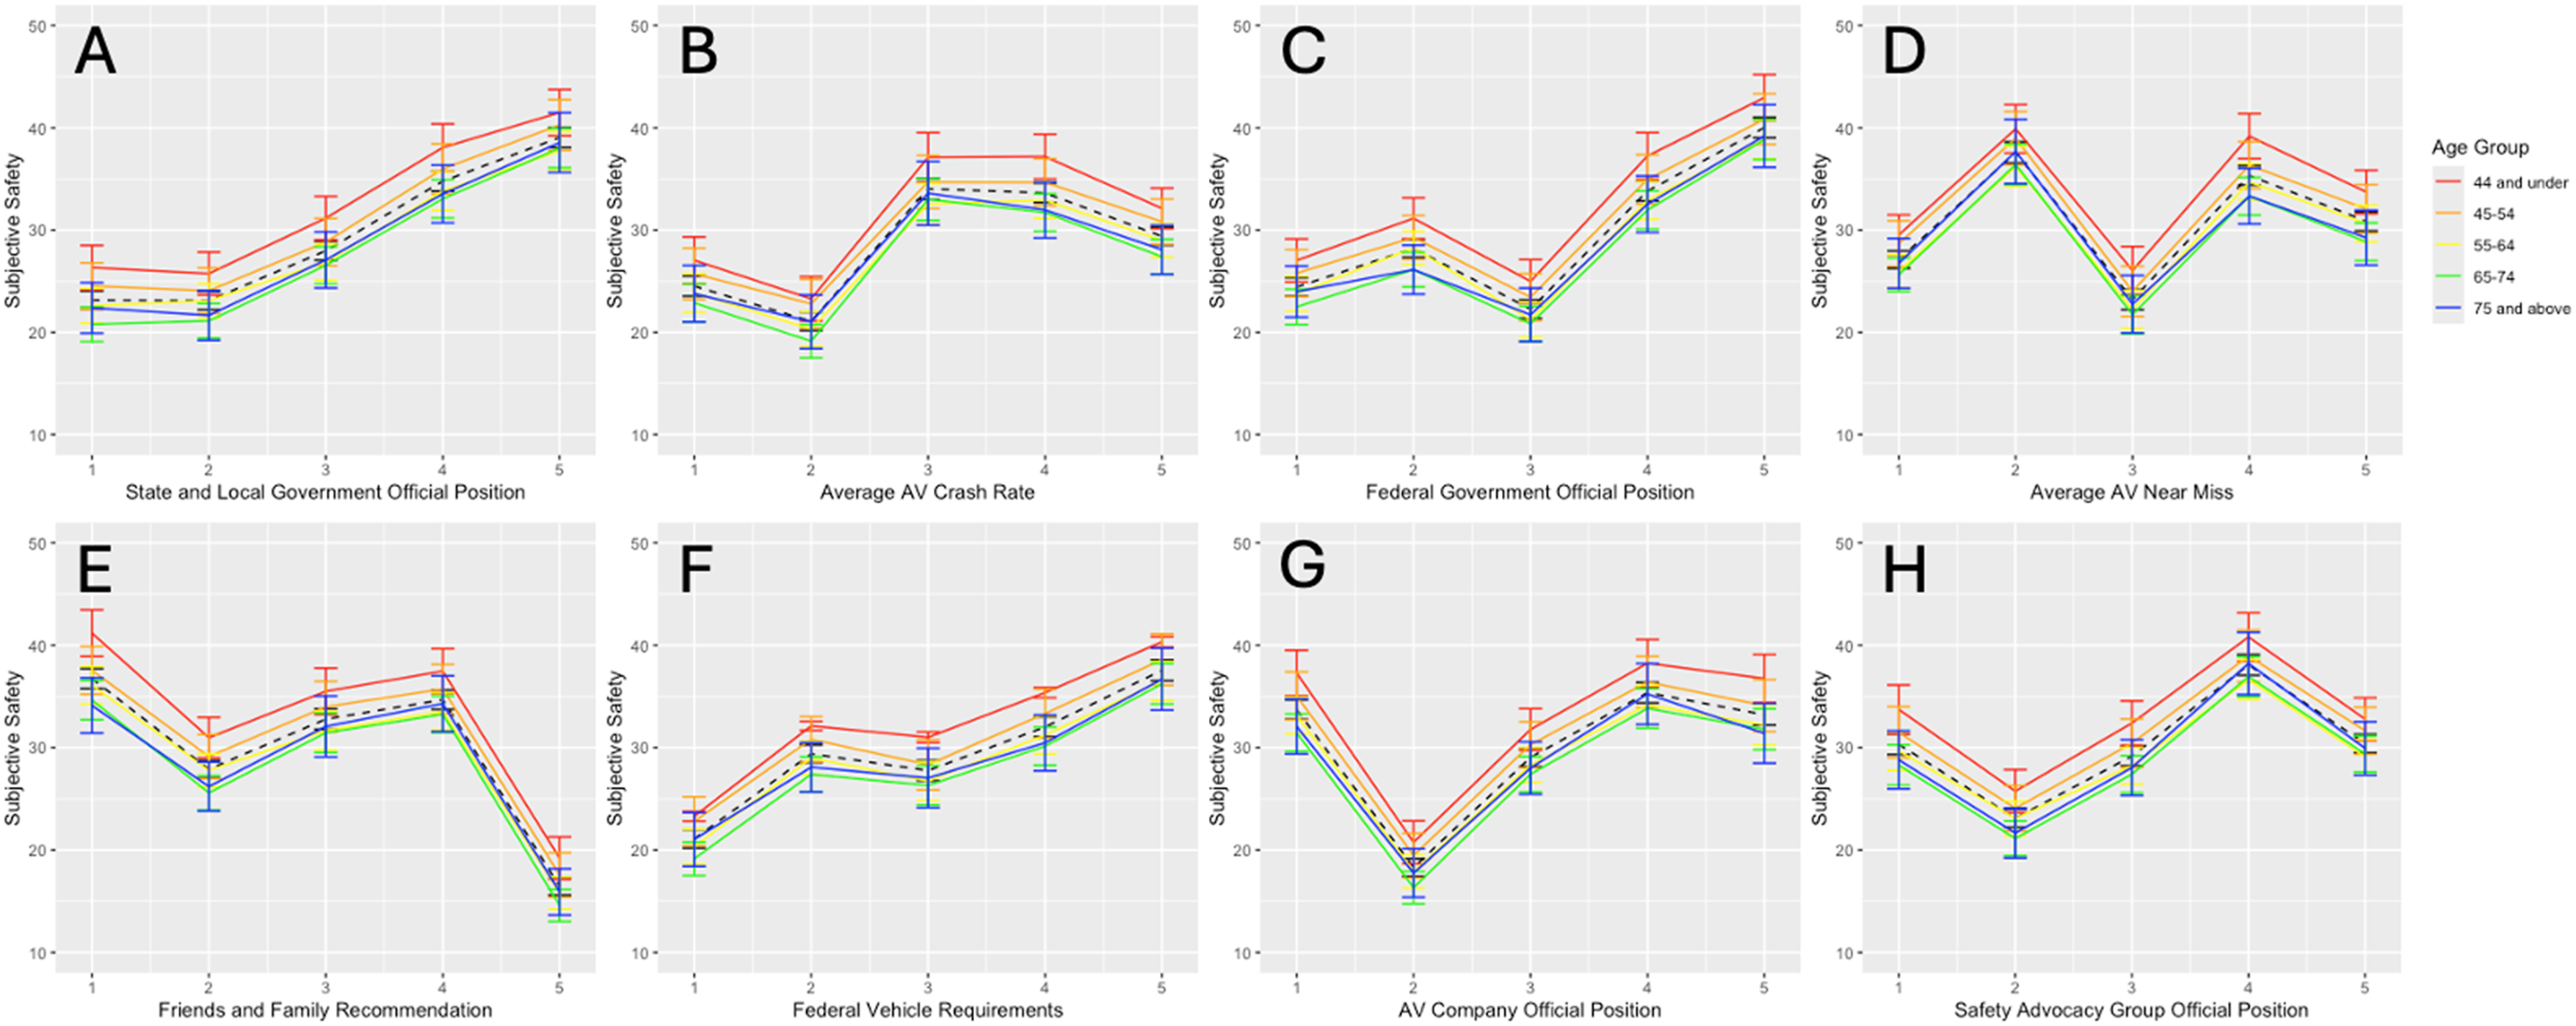
Explicit Measure of Message Source Weight
Explicit Rank Order Measure of Information Source Preference
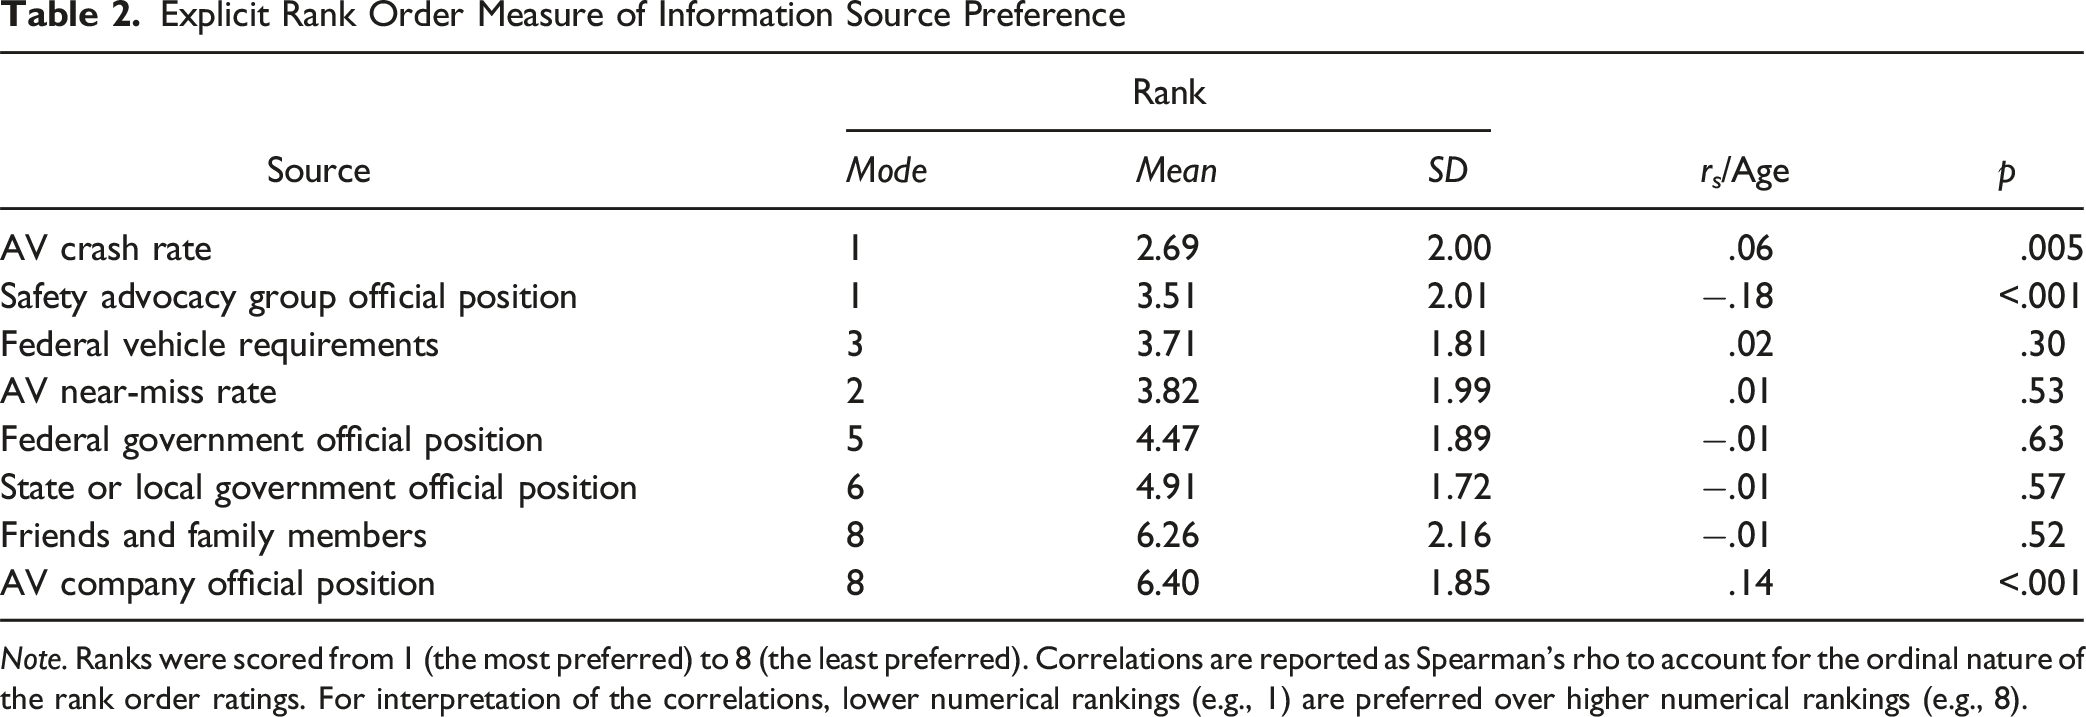
Note. Ranks were scored from 1 (the most preferred) to 8 (the least preferred). Correlations are reported as Spearman’s rho to account for the ordinal nature of the rank order ratings. For interpretation of the correlations, lower numerical rankings (e.g., 1) are preferred over higher numerical rankings (e.g., 8).
We computed Spearman’s rho correlations between age and the ranking of each of the message sources. Five of the eight source ranks did not differ with age. Decreasing age was associated with a higher ranking of messages stemming from average AV crash rates, r s = .06, p = .005, and AV companies, r s = .14, p < .001. Increasing age was associated with a higher ranking of messages stemming from safety advocacy groups, r s = −.18, p < .001.
Questionnaire Items Measuring Technology and AV Attitudes
Four additional questionnaire items were completed by the participants pertaining to technology and AV attitudes. Age was significantly associated with a decrease in comfort with technology (r s = −.19, p = <.001), AVs (r s = −.21, p = <.001), and an increase in concern about AVs (r s = .10, p = <.001). Age was not significantly associated with the perception that AVs will be as safe or safer than human drivers in the next 10 years, though older adults trended towards lower scores (r s = −.04, p = .10).
Discussion
The analyses presented above had two goals: (1) to investigate if messages from different sources were weighted differently when rating the perceived safety of AVs, and (2) if there were age differences in these weights.
Influence and Preference of Message Sources
Using a social judgment analysis design, the results of our exploratory analysis show that messages originating from various sources had different impacts on the perception of safety of AVs. When measured implicitly, safety messages from government sources (both from state and local governments as well as federal) and data driven sources (AV crash rates and AV near-miss rates) showed significantly positive linear relationships with perceived AV safety, controlling for age, gender, and the messages from the other message sources.
Preferences for message sources were also measured explicitly, and the order of stated preferences differed from the ranked weights calculated from the linear mixed regression models. Compared to the implicit measures from the regression models, participants explicitly ranked messages originating from government much lower. In other words, when asked to indicate their preference, participants generally stated that they did not prefer messages from federal or state and local governments (ranked fifth and sixth, respectively), but these two sources were among the message sources with the largest influence on perceived safety ratings (third and first largest, respectively).
Although this discrepancy may appear paradoxical, it aligns with prior findings. National surveys show that Americans report low trust in the federal government with substantially higher, but still limited, trust in state and local governments (Jones, 2023). But this reported distrust is not always reflected in information seeking behavior. In a European context, British voters were only responsive to information originating from the national government compared to the European Union, regardless of their expressed support for the national government (Hobolt et al., 2013). In a specific American context, an experimental study investigating how the source of information influences click-through behavior on safety messages about wildfire smoke exposure demonstrated that participants were equally likely to click on messages framed as originating from academic compared to government sources (Aminpour et al., 2022).
In general, data-driven message sources (average AV crash and near-miss rates) were explicitly ranked in the top half of the message sources and had a similar influence on perceived safety ratings. This partially supports prior research showing that older adults preferred “fact-based” sources of information about ADAS systems (Greenwood & Baldwin, 2022), though our results suggest that this preference is true across age groups.
Age Differences in Influence and Preference of Message Sources
Overall, increased age was associated with lower perceptions of AV safety while controlling for gender and the safety messages from the various sources. Interaction terms in the linear mixed-model revealed few overall age differences in the influence of safety messages on perceptions of safety of AVs. Two significant interactions were found across the eight different information sources. Against our expectations, younger adults rated their perceived safety as differentially higher than did older adults in response to positive messages from AV crash rates (Figure 1(B)), a “fact-based” message source that we predicted would be more influential for older adults (Greenwood & Baldwin, 2022). In line with our expectations based on prior research, older adults were less influenced by positive messages from AV companies compared to younger adults (Havlíčková et al., 2019; Figure 1(G)).
Age differences in the explicit measures were investigated using a Spearman’s correlation between the ranking and age (Table 2). The rank of messages originating from safety advocacy groups improved with age, so older adults on average ranked this source higher compared to younger adults. The ranks of messages originating from AV crash rates and the AV companies were both decreased with age – older adults ranked these message sources lower on average compared to younger adults. The discrepancy between AV companies and safety advocacy groups across age groups is important to note. While AV companies were ranked the lowest and safety advocacy groups were ranked second highest across the entire sample, this may indicate that younger adults are shifting some of their preference for messages about safety away from third party groups and back to the companies themselves. Older adults do not show this trend. This may reflect older adults’ greater familiarity with safety advocacy groups. For example, the average AAA member is 55 years old (Ferris, 2018) and the average reader of Consumer Reports is 51 years old (Ferris, 2018).
Implications
Previous research has found that increasing age is associated with greater concern, lower perceptions of safety, and less awareness of AV technologies (Charness et al., 2018; Liu, Zhang, & He, 2019; Moody et al., 2020). Our results generally support these assertions. Using questionnaire items more similar to the previous literature, age was related to a lower rating of comfort and a higher rating of concern pertaining to AVs. Likewise, age was associated with overall lower ratings of perceived safety in response to the safety messages. Inspection of Figure 1 shows that the perceived safety ratings generally fell from young adulthood until approximately later middle adulthood, 55+ years old, where they stabilized. While this general difference was apparent for all of the different sources, it is important to note that the general trends were similar across age groups, with significant interactions found for the average AV crash rates and AV company sources (though messages from state and local governments and friends and family trended towards significance). In each of these cases, it appears that the interactions were due to specific messages that elicited particularly high perceived safety ratings in the younger respondents. In summary, all adults are similarly receptive to messages about AV safety in the expected direction for the majority of sources: messages of increased safety of AVs related to higher perceptions of AV safety.
The results from the current study show that a single approach to the communication of safety of AVs to the public may not be the most effective method. While safety messages from local governments had the highest influence, data driven messages (average crash and near-miss rates) and those from the federal government also significantly affected perceived safety ratings. Through the combination of these results, it appears that the most effective approach to communicate the safety of AVs to the public should include safety messages referencing improvements in tangible metrics (crashes and near-misses) delivered by sources that have some authority and expertise without clear conflicts of interest (e.g., government rather than friends and family or AV companies). It is important to note that the messages from government are highly influential on perceptions of safety even though they are explicitly ranked as low-preference information sources. These low explicit rankings likely reflect contemporary trends towards distrust of government among Americans (Raine et al., 2019). Regardless of a general sense of trust or stated preference for government as an information source, it appears that messages pertaining to safety from government still influence perceptions.
Limitations
There are several limitations for the current study. First, the sample included in the current study is relatively old, including few individuals that would normal be considered members of a “young adult” age group (e.g., only 123 individuals in the current sample were in the 18-34 year old age range). Particularly because this study investigates attitudes towards a cutting-edge technology, overall attitudes may have been more negative than they would have been had younger adults comprised a larger portion of the sample. The study design also included limitations. The originating agency for the data driven information sources was not explicitly identified and participants may be differentially influenced by data collected by different sources. For example, data on average crash rates may be more influential if collected by government sources rather than private companies. There may be individual differences in the perception that the quantitative data was collected and reported by a credible source, though the results would suggest that the presumed source of the data driven messages was perceived as credible. Though we considered these factors separately, future research could investigate interactions between message content (e.g., raw or interpreted data) and sources.
While a clear strength of the current study was the use of a large, probability-based online sample, this design also introduced some limitations. First, collecting data from panels of this type can be expensive. Financial constraints limited the length of the survey that we could field to participants. The original publication from which we modeled our design (Stefl-Mabry, 2003) used 40 experimental items, but in our study we were only able to include 20 items for the implicit measure portion of the survey. Second, though the generalizability of the sample is a clear strength of the study, this design did not allow for us to investigate the potential moderating role of experience with AVs on the relationship between safety messages and perceived safety of AVs. Such a design would have required targeted sampling in markets that are currently conducting AV testing. Future research is needed to address this issue, particularly as AVs become more prevalent.
Conclusion
While experience and habituation to AVs will ultimately inform perceptions of their safety, until they become more prevalent, our initial perceptions will likely stem from communication from various sources, including AV companies, government, and safety advocacy groups. Our study shows that messages that endorse the safety of AVs generally improve the subjective perception of their safety. Furthermore, some message sources influence subjective perceptions more than others, and the perceptions of middle aged and older adults are less influenced by positive safety endorsements from some sources when compared to younger adults.
Supplemental Material
Supplemental material - Perception of Safety of Automated Vehicles: Age and the Influence of the Source and Content of Safety-related Messages
Supplemental material for Perception of Safety of Automated Vehicles: Age and the Influence of the Source and Content of Safety-related Messages by Ryan Best, Laura Fraade-Blanar, Marjory S. Blumenthal in Research on Aging
Footnotes
Author note
Laura Fraade-Blanar is now at Waymo LLC.
Ethical Considerations
The study and all its data collection protocols were approved by RAND’s Institutional Review Board. The study’s methods were carried out in accordance with all relevant guidelines and regulations.
Consent to Participate
Informed consent was obtained from all participants by the RAND American Life Panel.
Author Contribution
RB contributed to the conception and design of the project, analyzed and interpreted the data, and drafted and revised the manuscript. LFB contributed to the conception and design of the project, interpreted the data, and drafted and revised the manuscript. MSB contributed to the conception and design of the project, interpreted the data, and drafted and revised the manuscript. RB, LFB, and MSB have provided final approval of the submitted version of the manuscript and agree to be accountable for all aspects of the work.
Funding
The authors disclosed receipt of the following financial support for the research, authorship, and/or publication of this article: Data collection for this project was supported by the Uber Advanced Technologies Group as part of a larger RAND report titled: Safe enough: Approaches to assessing acceptable safety for automated vehicles, RRA569-1 (Blumenthal, Fraade-Blanar, Best, & Irwin, 2020).
Declaration of Conflicting Interests
The authors declared the following potential conflicts of interest with respect to the research, authorship, and/or publication of this article: RB is a consultant to and LFB is an employee of Waymo LLC, a company that may be affected by the research reported in the enclosed paper. At the time that the research was conducted, RB and LFB were not associated with this company.
Data Availability Statement
Supplemental Material
Supplemental material for this article is available online.
Author Biographies
References
Supplementary Material
Please find the following supplemental material available below.
For Open Access articles published under a Creative Commons License, all supplemental material carries the same license as the article it is associated with.
For non-Open Access articles published, all supplemental material carries a non-exclusive license, and permission requests for re-use of supplemental material or any part of supplemental material shall be sent directly to the copyright owner as specified in the copyright notice associated with the article.