
Abstract
Older adults are increasingly engaging in digital games, although little is known about older gamers on a large scale. This study seeks to examine the lifestyle, health, and well-being profiles of older computer gamers versus non-gamers, considering the relevance of our findings on older gamer profiles to key stereotype theories. We reported findings from the UK Biobank data with 73,359 participants aged 50 to 70. Participants were classified as non-gamers (N = 60,540; 82.53%), occasional gamers (N = 10,961; 14.94%), and frequent gamers (N = 1,858; 2.53%). Group comparison results suggested mostly negligible differences between older gamers and non-gamers in the domains of demographics, active/passive lifestyle, social engagement, sleep patterns, physical health, and psychological well-being. Small group differences were found in walking, moderate exercise, TV watching, body mass index, body fat percentage, and self-reported health. These findings help unveil the unique profile (or lack thereof) of older gamers versus non-gamers and provide insights for gerontologists and the gaming industry.
Digital gamers are often stereotyped as young pale male “couch potatoes” (Williams et al., 2008). Recently, digital gaming has grown substantially beyond this demographic, with as many as 45% of adults aged 50 or older playing digital games at least once per month (Kakulla, 2023). Research has worked to debunk the stereotypes against digital gamers as predominantly young males (e.g., Paaßen et al., 2017; Williams et al., 2008). Yet, little is known about older gamers and how their demographic, lifestyle, health, and well-being profiles compare to non-gaming older adults.
Negative stereotypes against digital gamers include being perceived as unpopular, unattractive, socially isolated, physically idle and unhealthy (Kowert et al., 2012, 2014a; Williams et al., 2008). The Stereotype Content Model (Fiske et al., 2002) identifies distinct negative stereotypes directed at older adults, notably perceptions of low competence, particularly in relation to technology use (Birkland, 2024). Older adults can also be stereotyped as lonely and frail (Rothermund & de Paula Couto, 2024). Although these two stereotype traditions differ in their origins, older gamers may face compounded negative stereotypes from both. That is, older gamers may be perceived as physically idle, socially isolated, and unhealthy (see Figure 1). This overlap suggests that older gamers may be in a uniquely stigmatised position relative to either group alone. Overlaps between negative stereotypes against gamers and those against older adults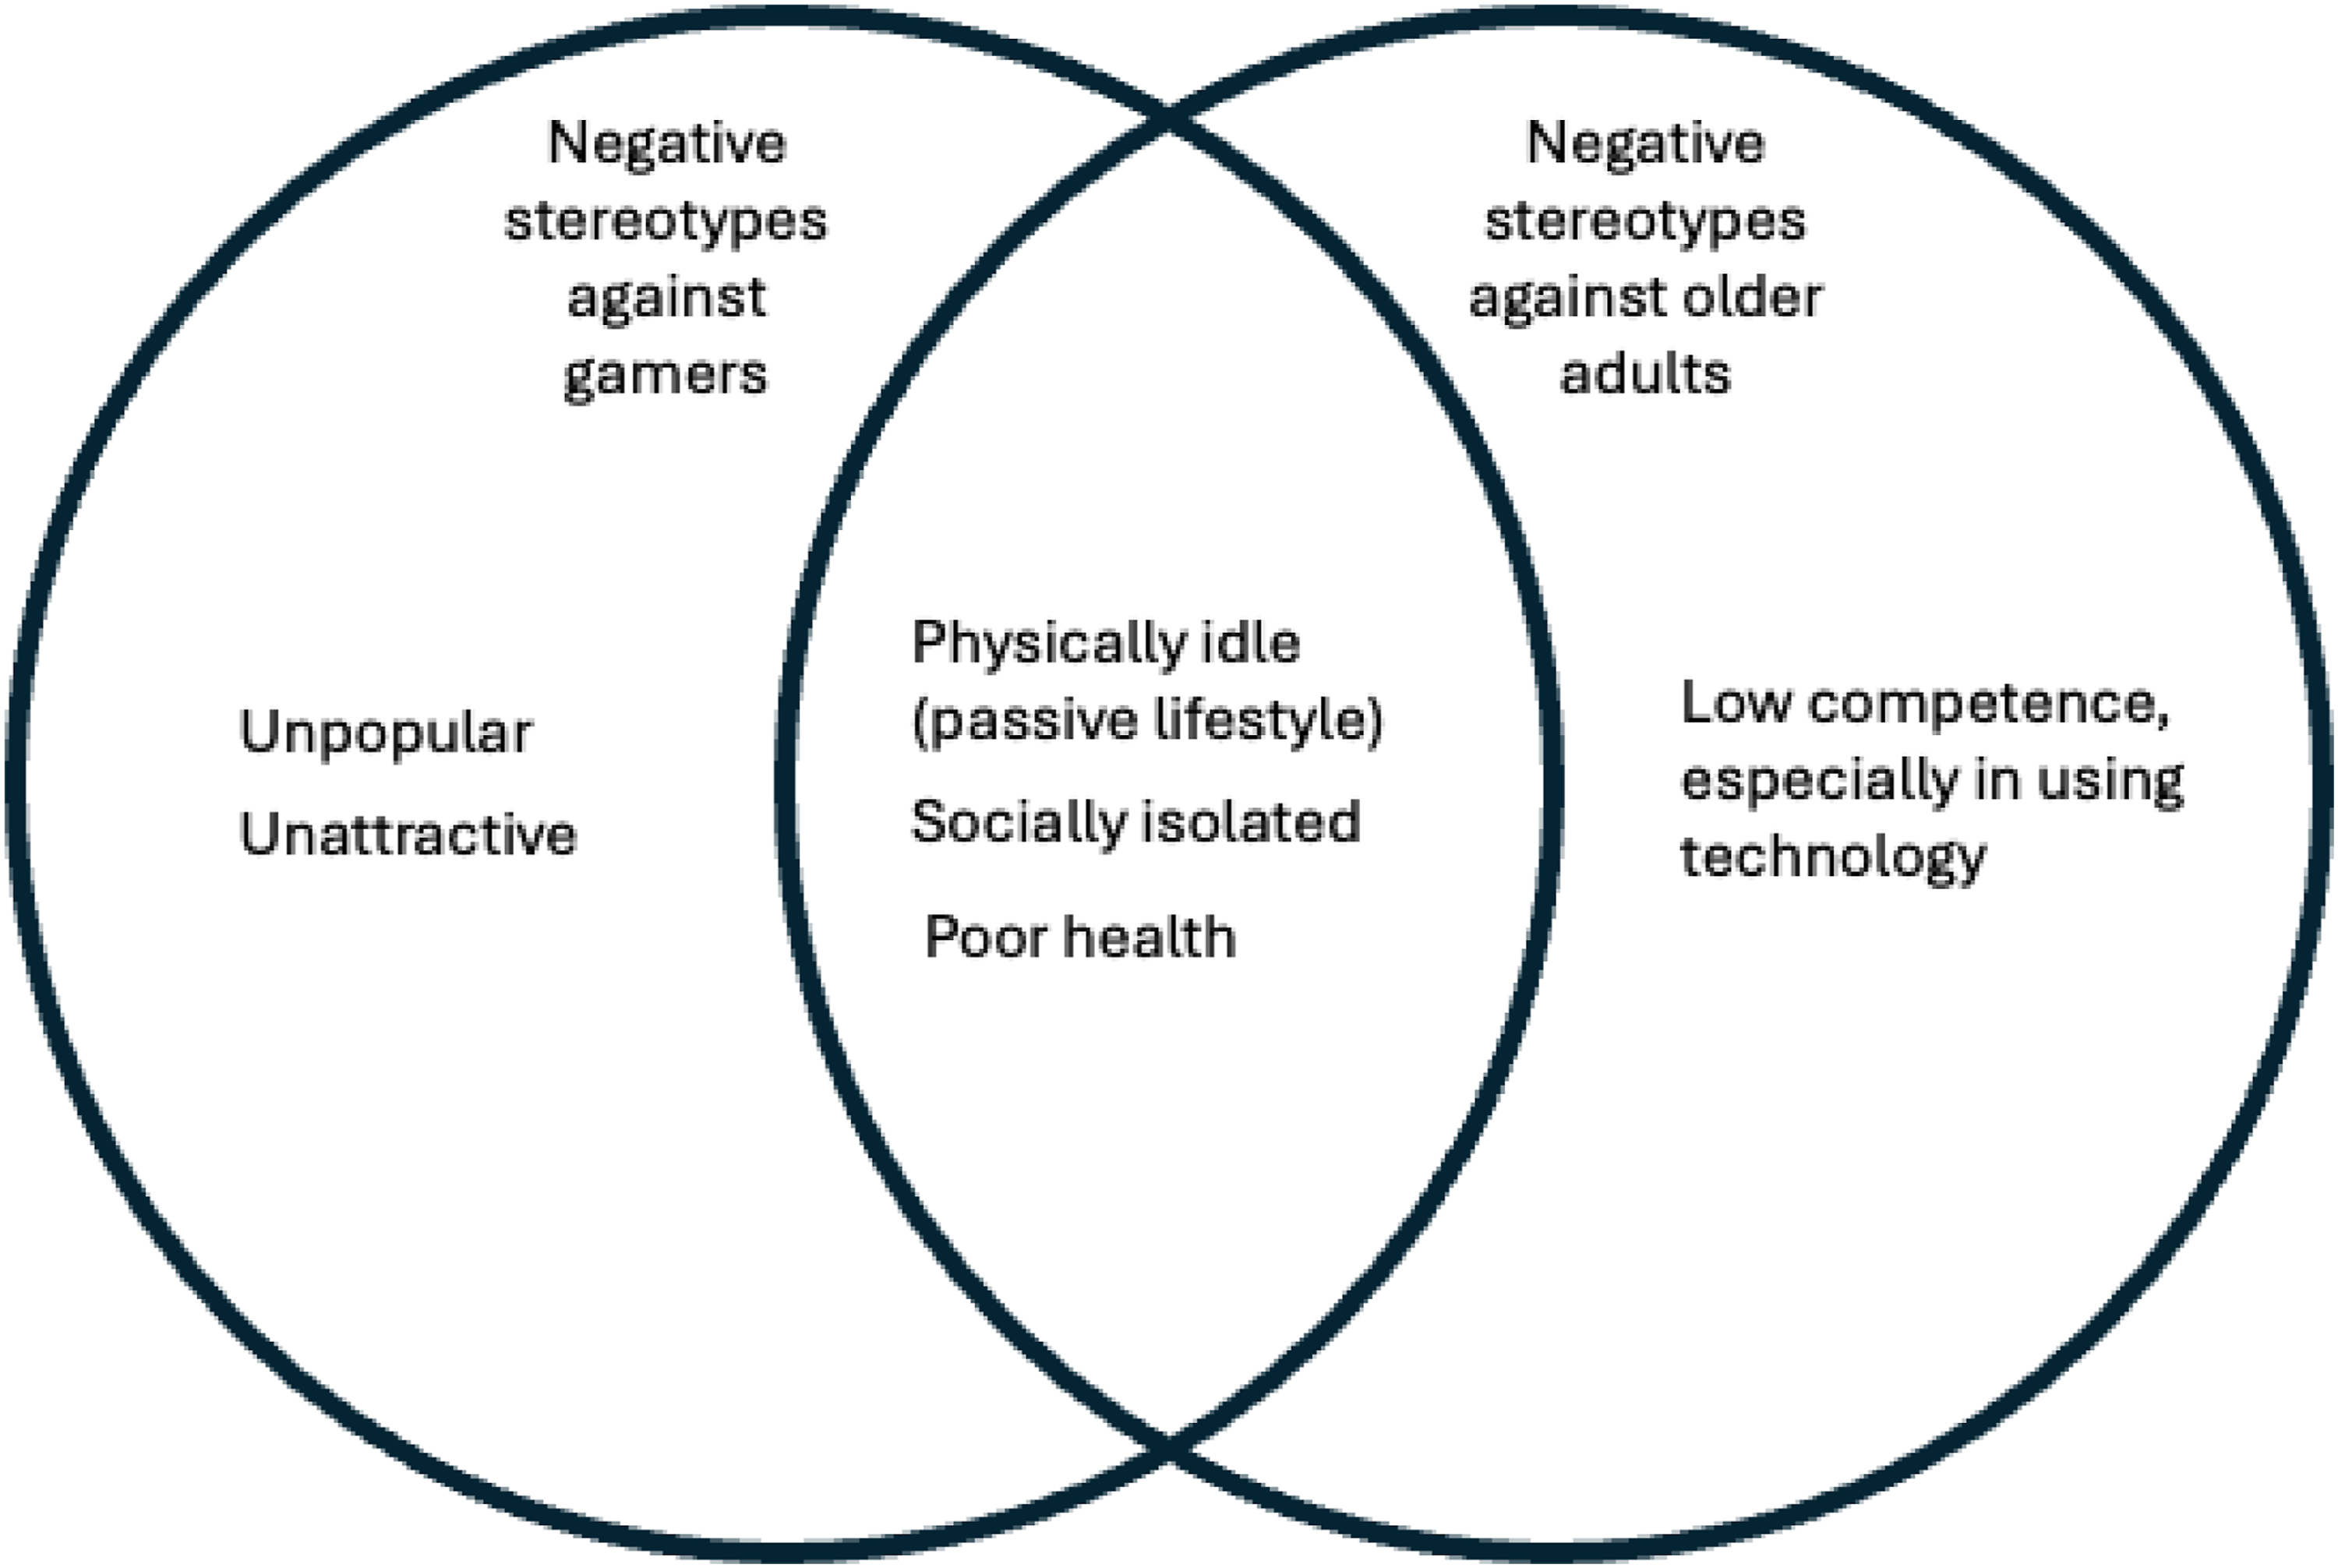
Such compounded stereotyping may bring undesirable consequences. Stereotype Embodiment Theory (Levy, 2009) posits that internalized stereotypes can shape self-perception and behaviour, with downstream implications for health and well-being. Although a fuller consideration of these mechanisms is beyond the scope of this study, examining the profiles of older gamers against non-gaming older adults provides a foundation for evaluating the truthfulness of the overlapping negative stereotypes. This is particularly timely considering literature challenging negative stereotypes surrounding both gamers (e.g., Morgenroth et al., 2020) and older adults (e.g., Rothermund & de Paula Couto, 2024) in isolation but not their intersections.
This study is a large-scale investigation of older gamers and non-gamers in the United Kingdom, drawing on variables from the UK Biobank dataset. In line with the identified overlapping stereotypes, the primary focus is on comparing older gamers and non-gamers across (a) active/passive lifestyles, (b) social engagement, and (c) physical health. Given evidence in the broader gaming literature linking gaming habits to (d) sleep health and (e) psychological well-being (see literature review below), these domains are also examined.
Active/Passive Lifestyles
As many as 67% of older adults are considered sedentary for over 8 hours each day, potentially increasing in future as older adults’ familiarity with technology, which is usually a sedentary activity, increases (Harvey et al., 2013). Digital gaming has also been associated with lower physical activity levels (Arnaez et al., 2018), although game play requiring movement could encourage physical activity among older adults (Kappen et al., 2019).
Social Engagement
Social engagement could be an important motivation for older gamers, with gaming providing opportunities to interact with current friends and family, and individuals they have met online (Zhang & Kaufman, 2016). Research suggests where grandchildren and grandparents play digital games together, in game chat features increase enjoyment for both parties (Derboven et al., 2012). Thus, digital gaming may be a viable vehicle for older adults’ intergenerational social engagement.
However, gaming could be associated with loneliness, with one study revealing digital gaming was associated with loneliness among adults in a way digital gaming among children was not (Luo et al., 2022). One possibility is that older adult gamers can face stigma as gaming is considered an “age-inappropriate” hobby, placing strain on family relationships (Quandt et al., 2009). As such, social isolation can be salient among older gamers.
Physical Health
The current literature offers limited insight regarding the relationship between digital gaming and older adults’ physical health specifically. However, positive associations have been found between recreational screen time and poorer self-rated health (Biaani et al., 2020) as well as between gaming and increased upper body pain (Forman & Holmes, 2023) across age groups. Associations have been found between sedentary behaviour (including that linked to digital gaming) and obesity, although the mechanism behind this association is unclear (Chastin et al., 2015).
Sleep Health
Around 50% of older adults report sleep problems, potentially linked to sedentary behaviour and a lack of time outdoors, which digital gaming could exacerbate (Yang et al., 2017). Digital gaming is related to increased alertness and cognitive arousal that negatively impact sleep and subsequent daytime sleepiness (Exelmans & Van den Bulck, 2015). Nevertheless, De Rosa and colleagues’ systematic review (2024) found that whilst excessive gaming was negatively associated with sleep quality, occasional gaming may have a minimal to positive relationship with sleep, suggesting the link between sleep and gaming habits can be nuanced.
Psychological Well-Being
Theoretically, digital gaming has potential to enhance older adults’ psychological well-being. According to flow theory (Csikszentmihalyi & LeFevre, 1989), digital games can provide a psychological state of complete absorption and enjoyment (i.e., “flow experience”) when gamers are optimally challenged (Nacke et al., 2009). Flow state, in turn, contributes to better psychological well-being and flourishing among older adults and other age groups (Tse et al., 2021).
Research found regular and occasional older gamers reported better overall well-being and social functioning, and less depressive symptoms and negative affect compared to older non-gamers (Allaire et al., 2013). However, excessive internet use could increase risk of depression and anxiety (Ho et al., 2014), potentially through negatively impacting sleep and social engagement (Twenge, 2019). Overall, it is unclear whether digital gaming is associated positively or negatively with older adults’ psychological well-being.
The Current Study
Although research has examined gaming in relation to each of these domains separately, studies have rarely compared older gamers directly to their non-gaming peers systematically across all these domains together (cf., Allaire et al., 2013; Nakagomi et al., 2025). This literature gap is significant because older gamers are subject to compounded negative perceptions from both gaming and ageing discourses. Without a broader picture of who older gamers are, whether these stereotypes are borne out empirically has not been directly examined.
The present study addresses this gap through a large-scale comparison of older computer gamers and non-gamers in the United Kingdom. The primary focus is on domains directly implicated by the overlapping stereotypes outlined above: demographics, active/passive lifestyle, social engagement, and physical health. Given the literature linking gaming to sleep health and psychological well-being we also investigate these as secondary areas of interest. Due to the absence of consistent evidence, we do not propose directional hypotheses. Instead, we pose an open research question of whether older gamers and non-gamers differ across these domains. This investigation will shed light on whether the negative stereotypes surrounding older adult gamers are empirically supported or warrant revision.
Methods
Data and Sample
Data was gathered from the UK Biobank: a large database of genetic, lifestyle and health information from participants in the United Kingdom between 2006 and 2010 (UK Biobank, 2024). Analysis only included data from participants who completed all questionnaires being investigated by the current study. The numbers of non-gamers (“never/rarely”), occasional computer gamers (“sometimes”), and frequent computer gamers (“often”) were 60,540 (82.53%), 10,961 (14.94%), and 1,858 (2.53%), respectively. Thus, the present study included a sample of 73,359 individuals. Participants were aged 50–70 (Mage = 60.42, SD = 5.38; 52.06% female; 47.94% male). We lowered the age limit from 60 to 50 to represent a wider cohort of older gamers, as in other large-scale older adult research (e.g., Kakulla, 2023). The UK Biobank obtained approval from the North-West Multi-centre Research Ethics Committee (MREC; 21/NW/0157). This project was conducted using application number 91331 of the UK Biobank resource.
Procedure and Measures
The UK Biobank data included online self-report and interview style questions, and physical tests administered during laboratory visits. For each domain, we used multiple indicators to triangulate our findings.
Computer Gaming
We grouped individuals by their gaming habits based on their responses to the question “do you play computer games?”. Three groups were categorised: (1) non-gamers, (2) occasional gamers, and (3) frequent gamers. Notably, data was collected in 2006–2010, years before mobile gaming became more prevalent. This classification is limited by the UK Biobank data available but is consistent with other large-scale comparisons of older gamers and non-gamers (e.g., Nakagomi et al., 2025; see also Discussion).
Demographics
Data was gathered on individual’s age, sex (1 = male, 0 = female), ethnicity (1 = white, 0 = other), household size (number in household), pre-tax annual household income in GBP (1 = < £18,000, 2 = £18,000–£30,999, 3 = £31,000–£51,999, 4 = £52,000–£99,999, 5 = £100,000), and education level achieved (1 = college or university degree, 0 = other education levels).
Active/Passive Lifestyle
Weekly frequencies of engaging in three types of physical activity (i.e., walks, moderate exercise, and vigorous exercise) for 10 minutes or more per day were recorded as a score out of 7 (1 = one day a week, 7 = every day in a week). Time (i.e., hours) spent watching television, and spent outdoors per day in both summer and winter separately, were each recorded as a score out of 24 (0 = 0 hours, 24 = 24 hours).
Social Engagement
Frequency of friend and family visits was measured on a scale of 1 (“almost daily”) to 6 (“no friends/family outside household”). Ability to confide with someone close was measured on a scale of 1 (“almost daily”) to 5 (“never or almost never”). Both scores were reverse coded during analysis to indicate higher scores for more social visits and greater ability to confide. A checklist measured any leisure or social activities (e.g., “gym”) respondents attended once a week or more: responses were recoded as a binary variable (1 = any leisure/social activities selected, 0 = none selected). Finally, loneliness was captured by the question “do you often feel lonely?” (1 = “often lonely”, 0 = “not often lonely”).
Physical Health
Self-reported physical health was rated from 1 (“excellent”) to 4 (“poor”). Responses were reverse coded so higher scores indicated better physical health. Respondents also reported types of pain (e.g., “headache”, “back pain”) experienced in the past month that interfered with their usual activities; responses were recoded as a binary variable (1 = any pain reported, 0 = none selected).
Objective measures of physical health gathered include body mass index (BMI), body fat percentage (on a scale of 1–100; estimated by impedance measurement), and hypertension (1 = yes, 0 = no; calculated by systolic blood pressure >140 or diastolic blood pressure >90 from two measures).
Sleep
Sleep duration (i.e., hours), including naps, was measured as a score out of 24 (0 = 0 hours per day, 24 = 24 hours per day). Chronotype was measured on a scale of 1–4 (1 = “definitely a ‘morning’ person,” 4 = “definitely an ‘evening’ person”). Sleep quality indicators were measured on a scale from 1 (“never/rarely”) to 3 (“usually/often”) for the following prompts: (a) had a nap during the day, (b) had trouble falling asleep at night or woke up in the middle of the night, and (c) were likely to doze off or fall asleep during the daytime. These responses were recoded into binary variables (0 = never nap/feel sleepless/doze off, 1 = sometimes to usually nap/feel sleepless/doze off).
Psychological Well-Being
For negative psychological well-being indicators, frequency of depressed mood, unenthusiasm/disinterest, tenseness/restlessness and tiredness/lethargy in the last two weeks were measured on a scale from 1–4 (1 = “not at all”, 4 = “nearly every day”). For positive well-being, happiness was measured on a scale of 1–6 (1 = “extremely happy”, 6 = “extremely unhappy”). Ratings were reversed such that higher scores indicated greater happiness.
Analysis Plan
Non-gamers were compared against occasional and frequent computer gamers across the indicators in each domain. With a large sample size (N = 73,359), null hypothesis testing would likely lead to statistically significant results, even when only a negligible effect size exists. Indeed, post-hoc sensitivity power analyses revealed that a Cohen’s d as small as 0.08 and an odds ratio between 0.96 and 1.04 could be detected with statistical power at .95. Additionally, multiple testing in an outcome-wide approach would likely inflate the family-wise Type I error, yet p-value-based corrections (e.g., Bonferroni’s correction) could be overly conservative, reducing statistical power and increasing the risk of missing true differences. Instead of interpreting results based on p values we used standardized effect sizes. Following widely used rules-of-thumb (Cohen, 1988), we considered Cohen’s d of 0.2, 0.5, and 0.8 and odds ratios (ORs) of 1.68, 3.47, and 6.71 as small, medium, and large effect sizes, respectively. Any effect sizes falling below would be considered minimal or negligible. Below, we use these thresholds to highlight associations with the largest effect sizes found. However, our effect sizes should be interpreted as indicative of the magnitude of effect rather than dichotomously as demonstrating either an effect or no effect.
Results are reported with 95% confidence intervals, providing information on the precision of effect size estimates and the statistical significance of comparisons (i.e., if they did not overlap with zero). We reported unadjusted effect size estimates (i.e., without covariates) as they reflected the zero-order bilateral relationships between gaming habits and other variables of interest, consistent with our study purpose of understanding the profiles of older gamers and non-gamers instead of inferring causality. As a sensitivity measure, we conducted the same analyses adjusted for the participants’ demographics (e.g., age, sex). The statistical conclusions from these adjusted models were identical to those from the unadjusted analyses reported below (see Supplemental Table S1 for the effect size estimates obtained from the adjusted models).
Results
Unadjusted Group Comparisons Among Non-Gamers, Occasional Gamers, and Frequent Gamers
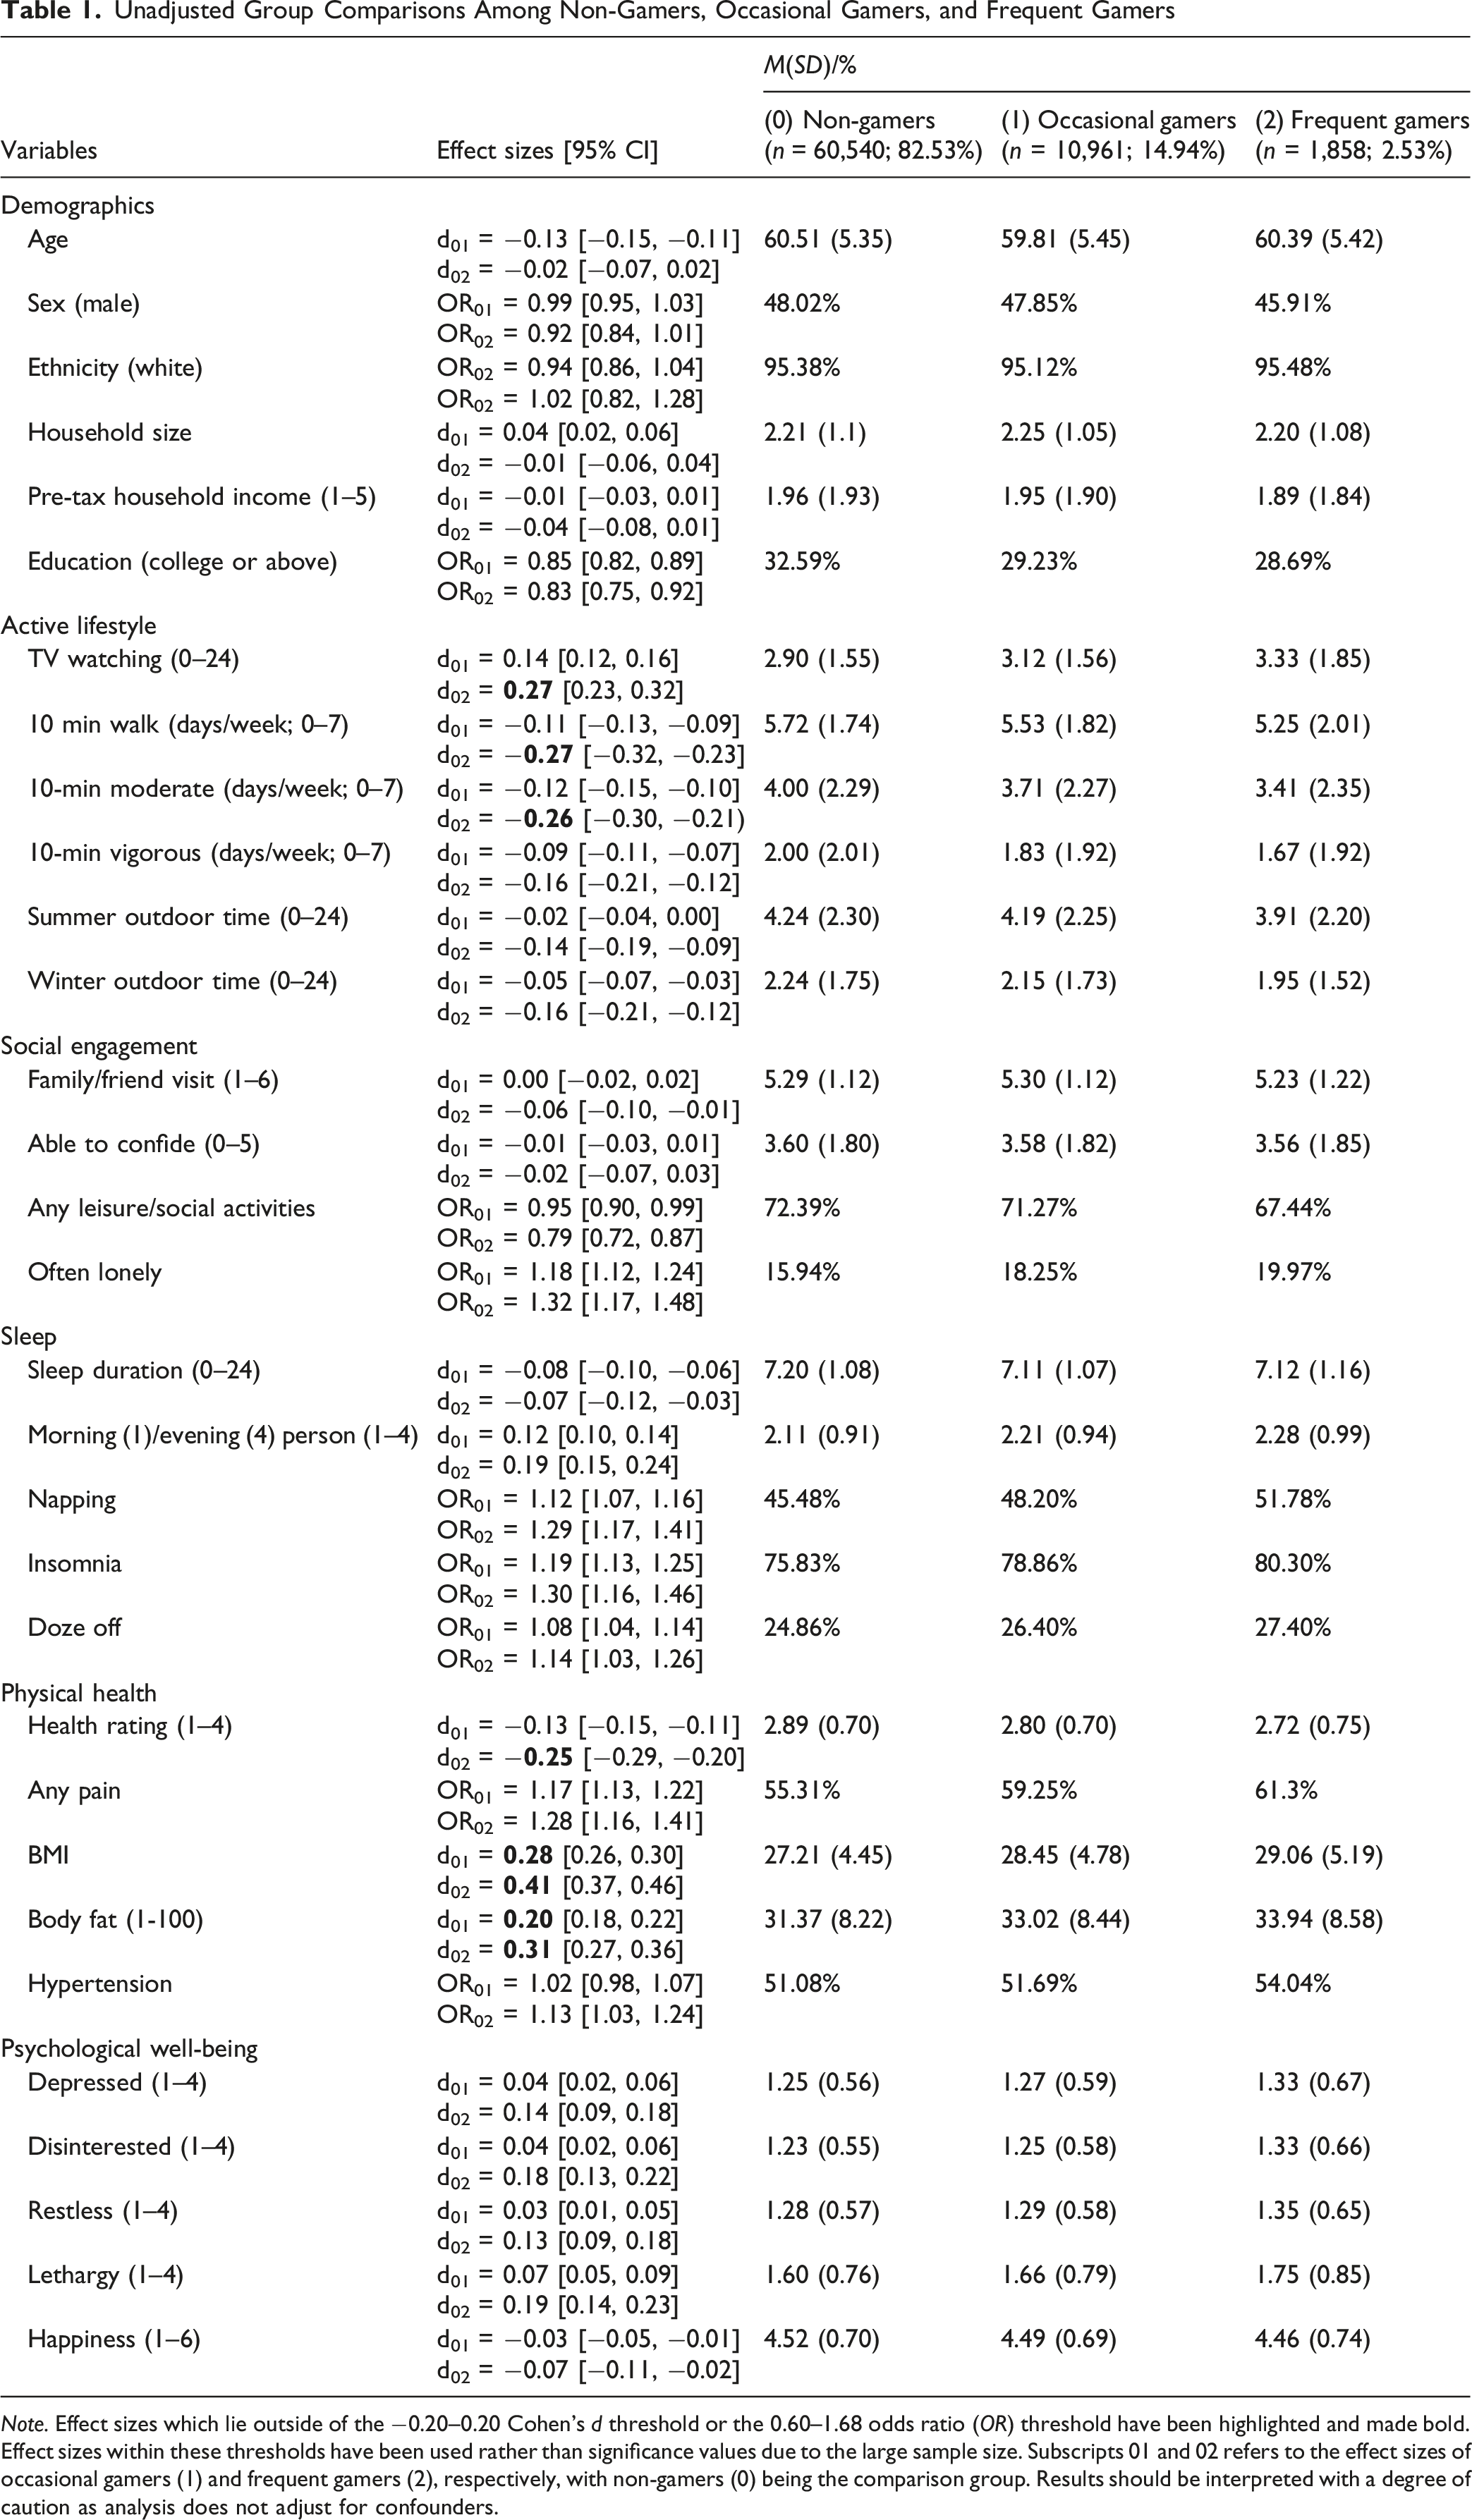
Note. Effect sizes which lie outside of the −0.20–0.20 Cohen’s d threshold or the 0.60–1.68 odds ratio (OR) threshold have been highlighted and made bold. Effect sizes within these thresholds have been used rather than significance values due to the large sample size. Subscripts 01 and 02 refers to the effect sizes of occasional gamers (1) and frequent gamers (2), respectively, with non-gamers (0) being the comparison group. Results should be interpreted with a degree of caution as analysis does not adjust for confounders.
Demographics
No notable differences were found between groups in age, sex, ethnicity, household size, pre-tax household income or education level (all |d|s < 0.13; 0.83 < ORs < 1.02; see Table 1). This suggests similar demographic profiles for each computer gaming group.
Active/Passive Lifestyle
No notable difference in TV watching was found between occasional gamers (M = 3.12, SD = 1.56) and non-gamers (M = 2.90, SD = 1.55; d = 0.14), but frequent gamers (M = 3.33, SD = 1.85) watched more TV per day than non-gamers (small effect; d = 0.27). Likewise, walking and moderate physical activity (MPA) differences were only notable between frequent gamers and non-gamers. Small effect sizes were found between non-gamers (MWalking = 5.72, SDWalking = 1.74; MMPA = 4.00, SDMPA = 2.29) and frequent gamers (MWalking = 5.25, SDWalking = 2.01; MMPA = 3.41, SDMPA = 2.35) for walking (d = −0.27), and moderate physical activity (d = −0.26). No notable differences between groups were found for vigorous physical activity or time spent outdoors, regardless of season (|d|s < 0.16; see Table 1).
Social Engagement
No notable differences were found between gamers and non-gamers for family/friend visits, ability to confide, leisure/social activities, and loneliness (|d|s < 0.06; 0.79 < ORs < 1.32; see Table 1), suggesting that older adults of different gaming habits demonstrated similar social engagement patterns and levels of loneliness.
Physical Health
Non-gamers (M = 2.89, SD = 0.70) were more likely to rate themselves as having better health than frequent gamers (M = 2.72, SD = 0.75), as indicated by a small effect size (d = −0.25), but the difference in health rating between non-gamers and occasional gamers (M = 2.80, SD = 0.70) was not notable (d = −0.13). For BMI, a small group difference (d = 0.28) was found between non-gamers (M = 27.21, SD = 4.45) and occasional gamers (M = 28.45, SD = 4.78) whilst a small-medium effect size (d = 0.41) was found between non-gamers and frequent gamers (M = 29.06, SD = 5.19). Similarly, for body fat, we found small group differences (d = 0.20) between non-gamers (M = 31.37, SD = 8.22) and occasional gamers (M = 33.02, SD = 8.44) as well as between non-gamers and frequent gamers (M = 33.94, SD = 8.58; d = 0.31). Regarding pain and hypertension, no notable differences were found between groups (ORs < 1.28; see Table 1).
Sleep
No notable differences were found between gamer and non-gamer groups (|d|s < 0.19; 1.12 < OR <1.30; see Table 1), with older computer gamers demonstrating similar sleep patterns and habits (sleep duration, morning/evening person identification, napping habit, self-reported insomnia, and likelihood of dozing off) compared to non-gamers.
Psychological Well-Being
The effect sizes for all psychological well-being indicators were negligible, including depression, disinterest, restlessness, lethargy, and happiness (|d|s < 0.19; 1.18 < ORs < 1.32; see Table 1). This suggests minimal associations between computer gaming habits and older adults’ well-being.
Discussion
The study purpose was to investigate whether self-reported computer gaming frequency was related to differences in demographic, lifestyle, health, and well-being variables in older adults. Based on the UK Biobank data, the results suggest older adult computer gamers and non-gamers were largely similar across the variables investigated. We found a few exceptions, such as small associations between occasional gaming and higher BMI and body fat percentage, and those between frequent gaming and higher TV watching, BMI and body fat percentage and less walking activity, moderate physical activity and self-rated health. Despite them, most of our findings suggest older adult computer gamers do not entirely fit overlapping stereotypes against gamers and older adults, especially in domains such as outdoor activities, social engagement, specific health problems (e.g., pain, hypertension, sleep problems), and psychological well-being (Fiske et al., 2002; Williams et al., 2008; see Figure 1). Likewise, another large-scale comparison between older gamers and non-gamers in Japan reported minimal differences in flourishing with a similar outcome-wide analytic approach (Nakagomi et al., 2025). Indeed, the literature reveals that gamer profiles are more diverse than the “stereotypical gamer” (e.g., Kowert et al., 2014a).
Stereotype Embodiment Theory would posit that negative stereotypes associated with “old age” and “gamer” could mean older gamers were more likely to demonstrate poorer health and well-being (Levy, 2009). However, the current study reported highly similar health and well-being profiles between older gamers and non-gamers. These findings could be viewed as suggesting that older gamers do not strongly internalize gamer stereotypes. Research suggests those who play casual games, such as those commonly played among older adults, do not always view themselves as “true gamers”. Older gamers may not perceive themselves fitting the typical “gamer” impression (Paaßen et al., 2017), especially when stereotypical gamers are usually young males (Williams et al., 2008).
An alternative explanation is that separate stereotypes could exist for older gamers and younger gamers. Older gamers may overcome negative stereotypes associated with both ageing and gaming, with their older gamer status instead being viewed as ‘cool’ (Costa et al., 2019). For example, Shirley Curry, also known as Skyrim Grandma, has gained huge popularity streaming her gameplay (over 1 million subscribers as of 2025). This is consistent with the reciprocal relationship between ageism and digital engagement proposed by Mannheim and Köttl (2024), suggesting older adults demonstrating greater digital engagement (gaming in our context) may counteract negative views of old age. As such, our findings appear to suggest computer gaming was, at the very least, a relatively benign leisure activity for older adults associated with less negative stereotypes. However, we have picked up some nuances as follows.
Demographics
The current study reported no associations between demographic factors and computer gaming frequency. Likewise, a previous study of Japanese older adults reported most sedentary behaviours (including gaming) were either weakly or not at all associated with employment status, living arrangements, education level, gender or household income (Ishii et al., 2013). Considering gaming has many positive benefits for older people (e.g., see Hall et al., 2012 for physical and mental health benefits), it is unsurprising that computer games appeal to older adults from various backgrounds with different needs.
Active/Passive Lifestyles
Our findings revealed that frequent gaming was associated with watching more TV than non-gamers. Previous research has suggested older adults game alongside, rather than as an alternative to, watching television (Dal Cin et al., 2021). In our study, frequent gamers reported less walking and moderate physical activity than non-gamers. Similarly, research has revealed negative associations between time spent gaming at the weekend and the likelihood of fulfilling recommended physical activity guidelines among younger and middle-aged adults (Arnaez et al., 2018). These findings offer a degree of support for the stereotype that gamers are less physically active than non-gamers.
However, the current study reported no notable differences between gaming groups for vigorous physical activity. Research suggests that among UK older adults, sports activity significantly declines with age, whilst walking behaviours decrease with age but at a slower rate (Jones et al., 2011). Thus, the current study’s findings of a lack of difference between gaming groups could indicate age and gamer identities may interact to produce a unique older gamer profile. Additionally, no notable differences were observed between gaming groups for time spent outdoors, as in recent older gamer research (see Nakagomi et al., 2025).
Social Engagement
Contradicting the stereotype of gamers as socially isolated and lacking in social skills (Williams et al., 2008), no notable differences were found in face-to-face time spent with others, ability to confide, engagement in other activities, or loneliness, across gaming groups. This implies social engagement (or the lack thereof) only had negligible associations with older adults’ gaming habits. Although the current study did not distinguish between multi-player and single-player gaming, older gamers were neither more nor less able to confide in others or more lonely, rejecting the impression of lone gamers that often applies to younger adults (e.g., Luo et al., 2022).
We propose Socioemotional Selectivity Theory (SST; Carstensen, 1993) may be relevant to the minimal associations between gaming and social engagement. SST posits that older adults are more motivated by emotionally meaningful and close relationships than younger adults. Gaming among older adults may serve as a means of maintaining close bonds (e.g., through gameplay with grandchildren; Derboven et al., 2012). In contrast, younger adult gamers may be more motivated to build new but wider and shallower social networks through gaming. Indeed, research involving adolescent gamers has reported associations between online gaming and fewer, lower quality social relationships (Kowert et al., 2014b), with lower social capital mediating a positive association between gaming time and loneliness (Kim et al., 2022). Our lack of notable differences in social engagement across groups could be explained through our measures of social engagement. As older adults’ gaming engagement may be oriented toward maintaining close relationships rather than forming new ones, our measures which focused predominantly on close relationships may not have captured differences in wider social engagement. Thus, future research should investigate whether the null findings could reflect a fundamentally different relational orientation toward gaming in later life.
Physical Health
Frequent gaming was associated with worse self-rated health, consistent with previous research reporting high recreational screen time as a risk factor for poorer self-rated health (Biaani et al., 2020). Greater sedentary behaviour is a possible mechanism of this association between gaming and poor health (e.g., Biaani et al., 2020). Additionally, both frequent and occasional gaming were correlated with higher BMI and body fat percentages, compared to non-gamers. Increased sitting time during gaming has previously been associated with greater obesity risk (Arnaez et al., 2018), and digital gaming has been associated with poorer diet (Avci et al., 2022). However, links between BMI and food intake among older adults are somewhat unclear (Hsiao et al., 2011). Additional research is required to determine the extent to which sedentary behaviour and diet contribute to obesity and BMI in older gamers.
Nonetheless, it is important to contextualise these findings. Despite self-rated health, BMI, and body fat representing the largest associations observed, their effect sizes were small. To put this in perspective, exercise as another health-related behaviour shows considerably stronger associations with these outcomes. For example, a meta-analysis of exercise interventions for healthy older adults reported a medium-sized effect on self-rated health (Tao et al., 2025). Another meta-analysis reported moderate effects of aerobic and resistance exercise on body fat percentage (González-Rocha et al., 2022). Indeed, guidelines have suggested that a significant 5–10% reduction in weight is indicative of improved obesity-related health outcomes (Jensen et al., 2014). As such, the modest differences across gaming groups are unlikely to be of high clinical significance.
Beyond these variables, other physical health indicators showed minimal differences across gaming groups. We found minimal group differences in hypertension, despite it being common in this sample (over 50%). Considering risk of hypertension has been linked to physical activity, weight, diet and stress management (Oliveros et al., 2020), future research should consider whether these factors impact associations between gaming and cardiovascular health. Similarly, no notable differences in pain were found across gaming groups. This contradicts gamer stereotypes and differs from previous research reporting a relationship between gaming and increased upper body pain, although likely numerous individual genetic, psychological and lifestyle factors play a role (Forman & Holmes, 2023). Given that bodily pain is a common complaint among older adults, future research can investigate its complex relationship with gaming habits.
Sleep
Past systematic reviews have revealed a positive association between gaming (specifically problematic/addictive gaming) and poor sleep (e.g., Lam, 2014; Männikkö et al., 2020). Yet, none of the sleep measures in the current study (i.e., duration, chronotype, insomnia prevalence and dosing frequency) demonstrated differences across gaming groups, suggesting sleep habits and sleep quality have minimal relationships with gaming frequency among older adults. This contradicts a previous study which reported that among adults aged 18–94, time spent video gaming significantly predicted sleep quality, fatigue, insomnia, bedtime and risetime, associations which remained significant when controlling for age (Exelmans & Van den Bulck, 2015).
The lack of association between gaming and sleep in the current sample may be linked to older adults’ tendency to experience sleep problems in general. Regardless of gaming frequency, 50% of older adults report sleep problems (Yang et al., 2017). Additionally, playing cognitively challenging games before bedtime has been found beneficial to subjective and objective measures of sleep quality among young-to-middle aged adults with poor sleep (Cerasuolo et al., 2019). Here, the benefits of cognitively challenging games, such as puzzle games, which are popular among older adults (Kakulla, 2023), may counteract the potentially negative impact of gaming on sleep. However, future research should consider whether specific elements of games, or the time of day or night at which games are played at, could influence sleep among older gamers (De Rosa et al., 2024).
Psychological Well-Being
The term ‘Game-Ageism’ describes the negative “stereotype, prejudice or discrimination against gamers, based on their age and the assumption that being youngster is the gamers’ standard” (Costa et al., 2019, p. 250). Furthermore, the gaming industry contributes towards negative stereotypes surrounding older gamers by overlooking older characters, or including those based on stereotypical perceptions which reinforce negative views of ageing (Kakulla, 2025). As such, older gamers (vs. non-gamers) may face stronger internalization risks and demonstrate poorer well-being. In our study, however, no associations between gaming frequency and any of the psychological well-being measures (i.e., depression, disinterest, restlessness, lethargy and happiness) were found. This could be because, due to the nature of secondary data analysis, we did not measure gaming addiction, which has been suggested problematic to well-being (Ho et al., 2014). However, our results also differ from past findings of an association between gaming and better well-being in older adults (Allaire et al., 2013). Previous research has suggested a negative relationship between screen time and well-being through impacting sleep or engagement in social activities among adolescents and younger adults (Twenge, 2019). As no differences were found in social engagement or sleep variables across gaming groups in our study of older adults this could help explain the lack of association between gaming and well-being.
Recent Changes in Older Adults’ Gaming Landscape
The UK Biobank data were restricted to computer gaming in 2006–2010 only. The gaming industry and gamer population have evolved substantially over the past decade and a half. Mobile gaming now offers a highly portable mode of play, is often free to download, and is easy to use, encouraging increased game play (Syvertsen et al., 2022). We argue that the data are still valuable, given that both computer gaming and more recent forms of gaming (e.g., mobile gaming) are predominantly sedentary activities and share similar “gamer” stereotypes. Nevertheless, research suggests mobile gaming could have a unique impact on health compared to computer gaming. For example, the smaller screens on mobile phones could result in eye strain whilst poor posture during mobile gaming can cause pain (Shah & Parkar, 2024). Age-related stereotypes can mean these health problems are attributed to age rather than to environmental factors, in this case gaming, subsequently reinforcing negative age-related stereotypes (Levy, 2009).
Additionally, the older gamer population has increased in recent years and is expected to continue growing. Yet, older adults remain underrepresented in games and where older game characters exist these are often portrayed through narrow stereotypes such as the elder in distress (Kakulla, 2025), overlooking older gamers and reinforcing negative views of aging. However, representation of older adults within gaming content has demonstrated some improvement in recent years (Kakulla, 2025). Increased opportunity for personalisation in games such as more realistic avatar profiles allows older adults to connect with aspects of both their present self (i.e., positive aspects associated with aging such as wisdom), and their past self (i.e., engaging in nostalgic reflection related to game content; Carrasco et al., 2018).
At present, the impact of these modern gaming developments on older gamers is unknown. Research with more recent data is required to further investigate the impact of changes within the gaming landscape on ageing outcomes and societal perceptions of aging, including the stereotypes surrounding older gamers.
Implications
The gaming industry has evolved in recent years, such that caution must be taken in interpreting the results in contemporary gaming contexts. However, more recent literature (beyond 2010) continues to highlight a lack of diverse and realistic representation of older adults within the gaming industry (e.g., Kakulla, 2023). Thus, game developers should consider how digital games could be better suited to the older adult population, especially regarding playability features. Here, games for older adults must not be developed based on negative stereotypical assumptions that could perpetuate ageism. On the other hand, portraying older adults based on overly positive traits (e.g., healthy, active) can produce unrealistic idealised representations of older adults. Overall, realistic and positive representation of older adults within gaming for all ages could help tackle age-related stereotypes in society. Yet, negative representations of older adults are difficult to change and must be addressed by large-scale interventions targeting the whole population (Bétrisey et al., 2024).
Policy could also consider the associations between gaming and ageing outcomes, and recommended gaming guidelines could be developed for older adults. Considering links found of computer gaming with health and active lifestyle domains, promoting increased physical activity among the older adult gaming population could be beneficial. Current guidelines recommend 150 minutes per week of moderate-to-vigorous physical activity. Whilst research suggests most older adults do not meet these guidelines, small increases in moderate-to-vigorous physical activity among older adults could offer health benefits (Hupin et al., 2015). Although gaming has once been associated with sedentary behaviour, promoting an active lifestyle among older adults does not necessarily mean discouraging gaming altogether. Recently, mobile games with GPS tracking features provide examples of promoting an active lifestyle through game-required activities (Gabbiadini et al., 2018). In fact, research demonstrates gaming can improve mental and physical functioning in older adults through encouraging use of cognitive skills and physical activity (e.g., Hall et al., 2012). Since 2010, the gaming industry has witnessed a continuous growth of exercise-focused digital games, with some using more cutting-edge technology including virtual reality headsets. Many exercise-focused digital games have been deemed suitable for the older adult population, with engagement in these games being associated with improved physical and psychological health (Kappen et al., 2019). Finally, besides physical activity and sleep health, future studies can also further investigate other lifestyle factors such as diet that may be associated with older adult gaming habits.
Strengths, Limitations, and Future Directions
The UK Biobank data provided a large sample size of gaming and non-gaming older adults for this study. Given the wide range of health and lifestyle variables with self-report and objective measures, our study could address a literature gap by focusing on the similarities and differences between older adult computer gamers and non-gamers.
The UK Biobank data demonstrates evidence of a selection bias, a potential limitation. Compared to the general population, UK Biobank participants are less likely to live in socioeconomically deprived areas and report health conditions (Fry et al., 2017). Gaming may disproportionately impact those from disadvantaged groups, as demonstrated in youth screen time research (Oswald et al., 2020). Thus, our findings may have underestimated the effect sizes of associations between gaming and health and well-being outcomes in the wider population of older adults. Future research seeking to recruit a more diverse group of gamers would help address this.
A second study limitation was the classification of gamers. Due to the constraints of secondary data analysis, gaming groups were defined using self-reported frequency (“never/rarely,” “sometimes,” “often”). This simple classification approach was necessary for a large-scale project like the UK Biobank, which included extensive measures beyond the scope of our analyses, and ensured accessibility for older adults with diverse educational and cognitive backgrounds. Given the lack of universally agreed thresholds distinguishing light from heavy gaming across age groups, subjective frequency remains a valid method. The coarse categorization of participants aligns with epidemiological studies where ordinal groupings reliably detect health-behaviour associations despite limited granularity (e.g., Stamatakis et al., 2011; see also Nakagomi et al., 2025 for a similar approach to classify Japanese older gamers and non-gamers), prioritizing generalizability for exploratory analyses in understudied areas like older adult gaming.
Notably, the Biobank also lacks detail on gaming characteristics, which have been found to influence gaming experiences and outcomes, including game genre or platform (Ngah et al., 2024) and whether games are single-player or multi-player (e.g., Zhang & Kaufman, 2016). This is a particular limitation with regards to interpreting social engagement variables in the current study. Additionally, the Biobank did not provide data on time spent gaming or problematic gaming. Past research involving younger gamers suggested that individuals engaging in frequent game-play, with greater tendency towards problematic gaming, demonstrated a stronger likeness to gamer stereotypes compared to more causal players (Kowert et al., 2014a). Future research could incorporate time spent gaming, time-of-day, game type, and mode of play (De Rosa et al., 2024), as well as consider alternative methods such as day reconstruction or experience sampling to capture gaming habits and contexts.
Notably, because our study compared older gamer versus non-gamer profiles, potential for reverse causality was not investigated. For example, frequent gaming may be linked to reduced time spent on moderate physical activity and walking behaviours. However, it is equally possible that individuals who are already less active (for example due to physical conditions) are more likely to engage in gaming as leisure. Further research should investigate their directionality, as a lack of interest in engaging in physical activity has been associated with greater chances of leading a sedentary lifestyle (Martins et al., 2021), and gaming is generally a sedentary activity.
Conclusions
Our analysis on a national sample of UK older adults reveals limited associations between occasional computer gaming and health and well-being indicators, apart from higher BMI and body fat percentage. Besides these, compared to non-gamers, older frequent computer gamers also demonstrated less walking and moderate physical activity behaviour, higher TV watching, and poorer self-rated health, but the group differences are all small in magnitude. As the older gaming population continues to grow, there is a need for the gaming industry to ensure digital games which meet the needs of older adults are widely available.
Supplemental Material
Supplemental Material - Older Computer Gamers and Non-Gamers in the United Kingdom: Findings From the UK Biobank
Supplemental Material for Older Computer Gamers and Non-Gamers in the United Kingdom: Findings From the UK Biobank by Dwight C. K. Tse, Emma Anderson in Research on Aging
Footnotes
Acknowledgements
We thank Tess Davis for her feedback on the manuscript.
Ethical Considerations
The UK Biobank obtained approval from the North-West Multi-centre Research Ethics Committee (MREC; 21/NW/0157) and this research has been conducted using the UK Biobank Resource under Application Number 91331.
Funding
The authors disclosed receipt of the following financial support for the research, authorship, and/or publication of this article: This work was supported by University of Strathclyde HaSS Bridging Disciplines Initiative.
Declaration of Conflicting Interests
The authors declared no potential conflicts of interest with respect to the research, authorship, and/or publication of this article.
Supplemental Material
Supplemental material for this article is available online.
Author Biographies
References
Supplementary Material
Please find the following supplemental material available below.
For Open Access articles published under a Creative Commons License, all supplemental material carries the same license as the article it is associated with.
For non-Open Access articles published, all supplemental material carries a non-exclusive license, and permission requests for re-use of supplemental material or any part of supplemental material shall be sent directly to the copyright owner as specified in the copyright notice associated with the article.