Abstract
This study assessed sociodemographic and health behavior-related factors associated with better cognitive transition in Chinese older adults. We analyzed four waves of the Chinese Longitudinal Healthy Longevity Survey (2008–2018), including 22,392 participants aged ≥65 years with 32,348 person-wave observations, to examine transitions in cognitive states using sequentially adjusted multistate Cox models. Approximately 68.44%, 19.45%, and 12.11% reported normal cognitive function, moderate, and severe cognitive impairment, respectively. Sociodemographic advantages, including education, marital status, income, and urban residence, were associated with more favorable MMSE-defined cognitive transitions. Physical activity and higher life satisfaction were also associated with more favorable MMSE transitions, but smoking and alcohol consumption demonstrated no consistent associations. Interventions targeting modifiable factors, such as physical activity and wellbeing, may enhance cognitive impairment and help maintain good cognitive function among older adults.
Introduction
As populations continue to age worldwide, cognitive impairment remains a critical public health and medical challenge for older adults. Mild cognitive impairment may affect memory, language, attention, and executive function, often leading to difficulties in managing daily activities (Pais et al., 2020). Early signs of cognitive impairment are often subtle, leading to delayed diagnosis and intervention (Jin, 2020). Studies estimate that over 20% of older adults may experience some form of cognitive impairment, emphasizing the importance of understanding its key contributing factors (Qin et al., 2022). Currently, approximately 23.7% suffer from mild cognitive impairment worldwide (Salari et al., 2025). In China, the prevalence of severe cognitive impairment is approximately 6.0%, while this number is even higher in the United States at 10% (Manly et al., 2022; Qin et al., 2022). These numbers are expected to grow in the future.
Cognitive health is influenced by a range of factors, including age, education, lifestyle behaviors, chronic conditions, and psychological stressors (An & Liu, 2016; Chen & Chang, 2016; Han et al., 2022; Lee et al., 2024; Pengpid et al., 2019). One of the most concerning aspects of cognitive impairment is its gradual onset among older adults. In the long term, this may bring both financial and mental challenges to patients and their family members. However, early symptoms are often overlooked, allowing the condition to progress before intervention is sought (Jin, 2020). Nevertheless, research suggests that early-stage cognitive decline, particularly mild cognitive impairment, may be slowed or potentially reversed with appropriate interventions (Gallaway et al., 2017; Shimada et al., 2019). Therefore, identifying and addressing modifiable risk factors is imperative for preventing cognitive impairment from progressing to more severe stages, highlighting the need for continued research on this critical health issue.
China’s rapid population aging is creating a significant public health challenge. With the world’s largest population of older adults, China faces an unprecedented increase in age-related health conditions, including non-communicable diseases and cognitive impairment. The proportion of older adults in the Chinese population rose from 7% in 2000 to 11.4% in 2017, and by 2050, older adults are expected to make up over 26.1% of the total population, totaling approximately 366 million people (Han et al., 2020). This demographic shift presents a growing burden on the healthcare system, with the costs of managing NCDs, including diabetes and dementia, projected to rise sharply in the coming decades (Xu, 2020). For example, healthcare spending on diabetes is expected to triple by 2030 (Zheng et al., 2016). For dementia alone, an advanced form of cognitive impairment, annual costs in China are expected to exceed $114.2 billion USD by 2030 (Xu et al., 2016). As the aging population continues to grow rapidly in China, preventing complex chronic conditions such as cognitive impairment may help improve older adults’ quality of life and reduce healthcare expenses.
In the present study, we aimed to assess the sociodemographic and health behavior–related factors associated with different transitions in cognitive function among Chinese older adults. The unique aspect of this research effort was the examination of a better cognitive transition. We used hierarchical Cox multi-state regression models to capture the changes in cognitive impairment among older adults. This approach was originally intended to study cardiovascular diseases and cancer (Hajihosseini et al., 2016; Le-Rademacher et al., 2018), but this modeling technique has also been used to study cognitive impairment in older adults (Lee et al., 2021). We used a large and nationally representative dataset, the Chinese Longitudinal Healthy Longevity Survey (CLHLS), to examine this topic of interest. The use of this large, nationally representative dataset enhances the generalizability of the findings and informs more comprehensive interventions supporting reversible cognitive impairment among older adults.
Method
Data Source
We extracted four survey-wave datasets from the CLHLS, collected during 2008–2009, 2011–2012, 2014, and 2017–2018. The CLHLS is a publicly available dataset established through the joint effort of the Peking University and Duke University, with the aim of examining and improving health outcomes and longevity among Chinese older adults. The research ethics committees of Duke University and Peking University approved the CLHLS study and design (IRB00001052-13074). All participants provided informed consent to the data investigators.
The CLHLS was first launched in 1998, with follow-up surveys conducted every 2–3 years. It covers a wide range of topics related to geriatric health, including mental health, lifestyle behaviors, cognitive function and more. Data was collected through face-to-face, home-based interviews with randomly selected respondents, following informed consent procedures. The surveys covered half of the counties and city districts in 23 out of 31 Chinese provinces, municipalities, and autonomous regions, representing about 85% of the national population. Across these regions, over 113,000 interviews have been conducted, with response rates consistently exceeding 90% across survey waves. More details about the CLHLS can be found in Zeng’s publications (Zeng, 2012).
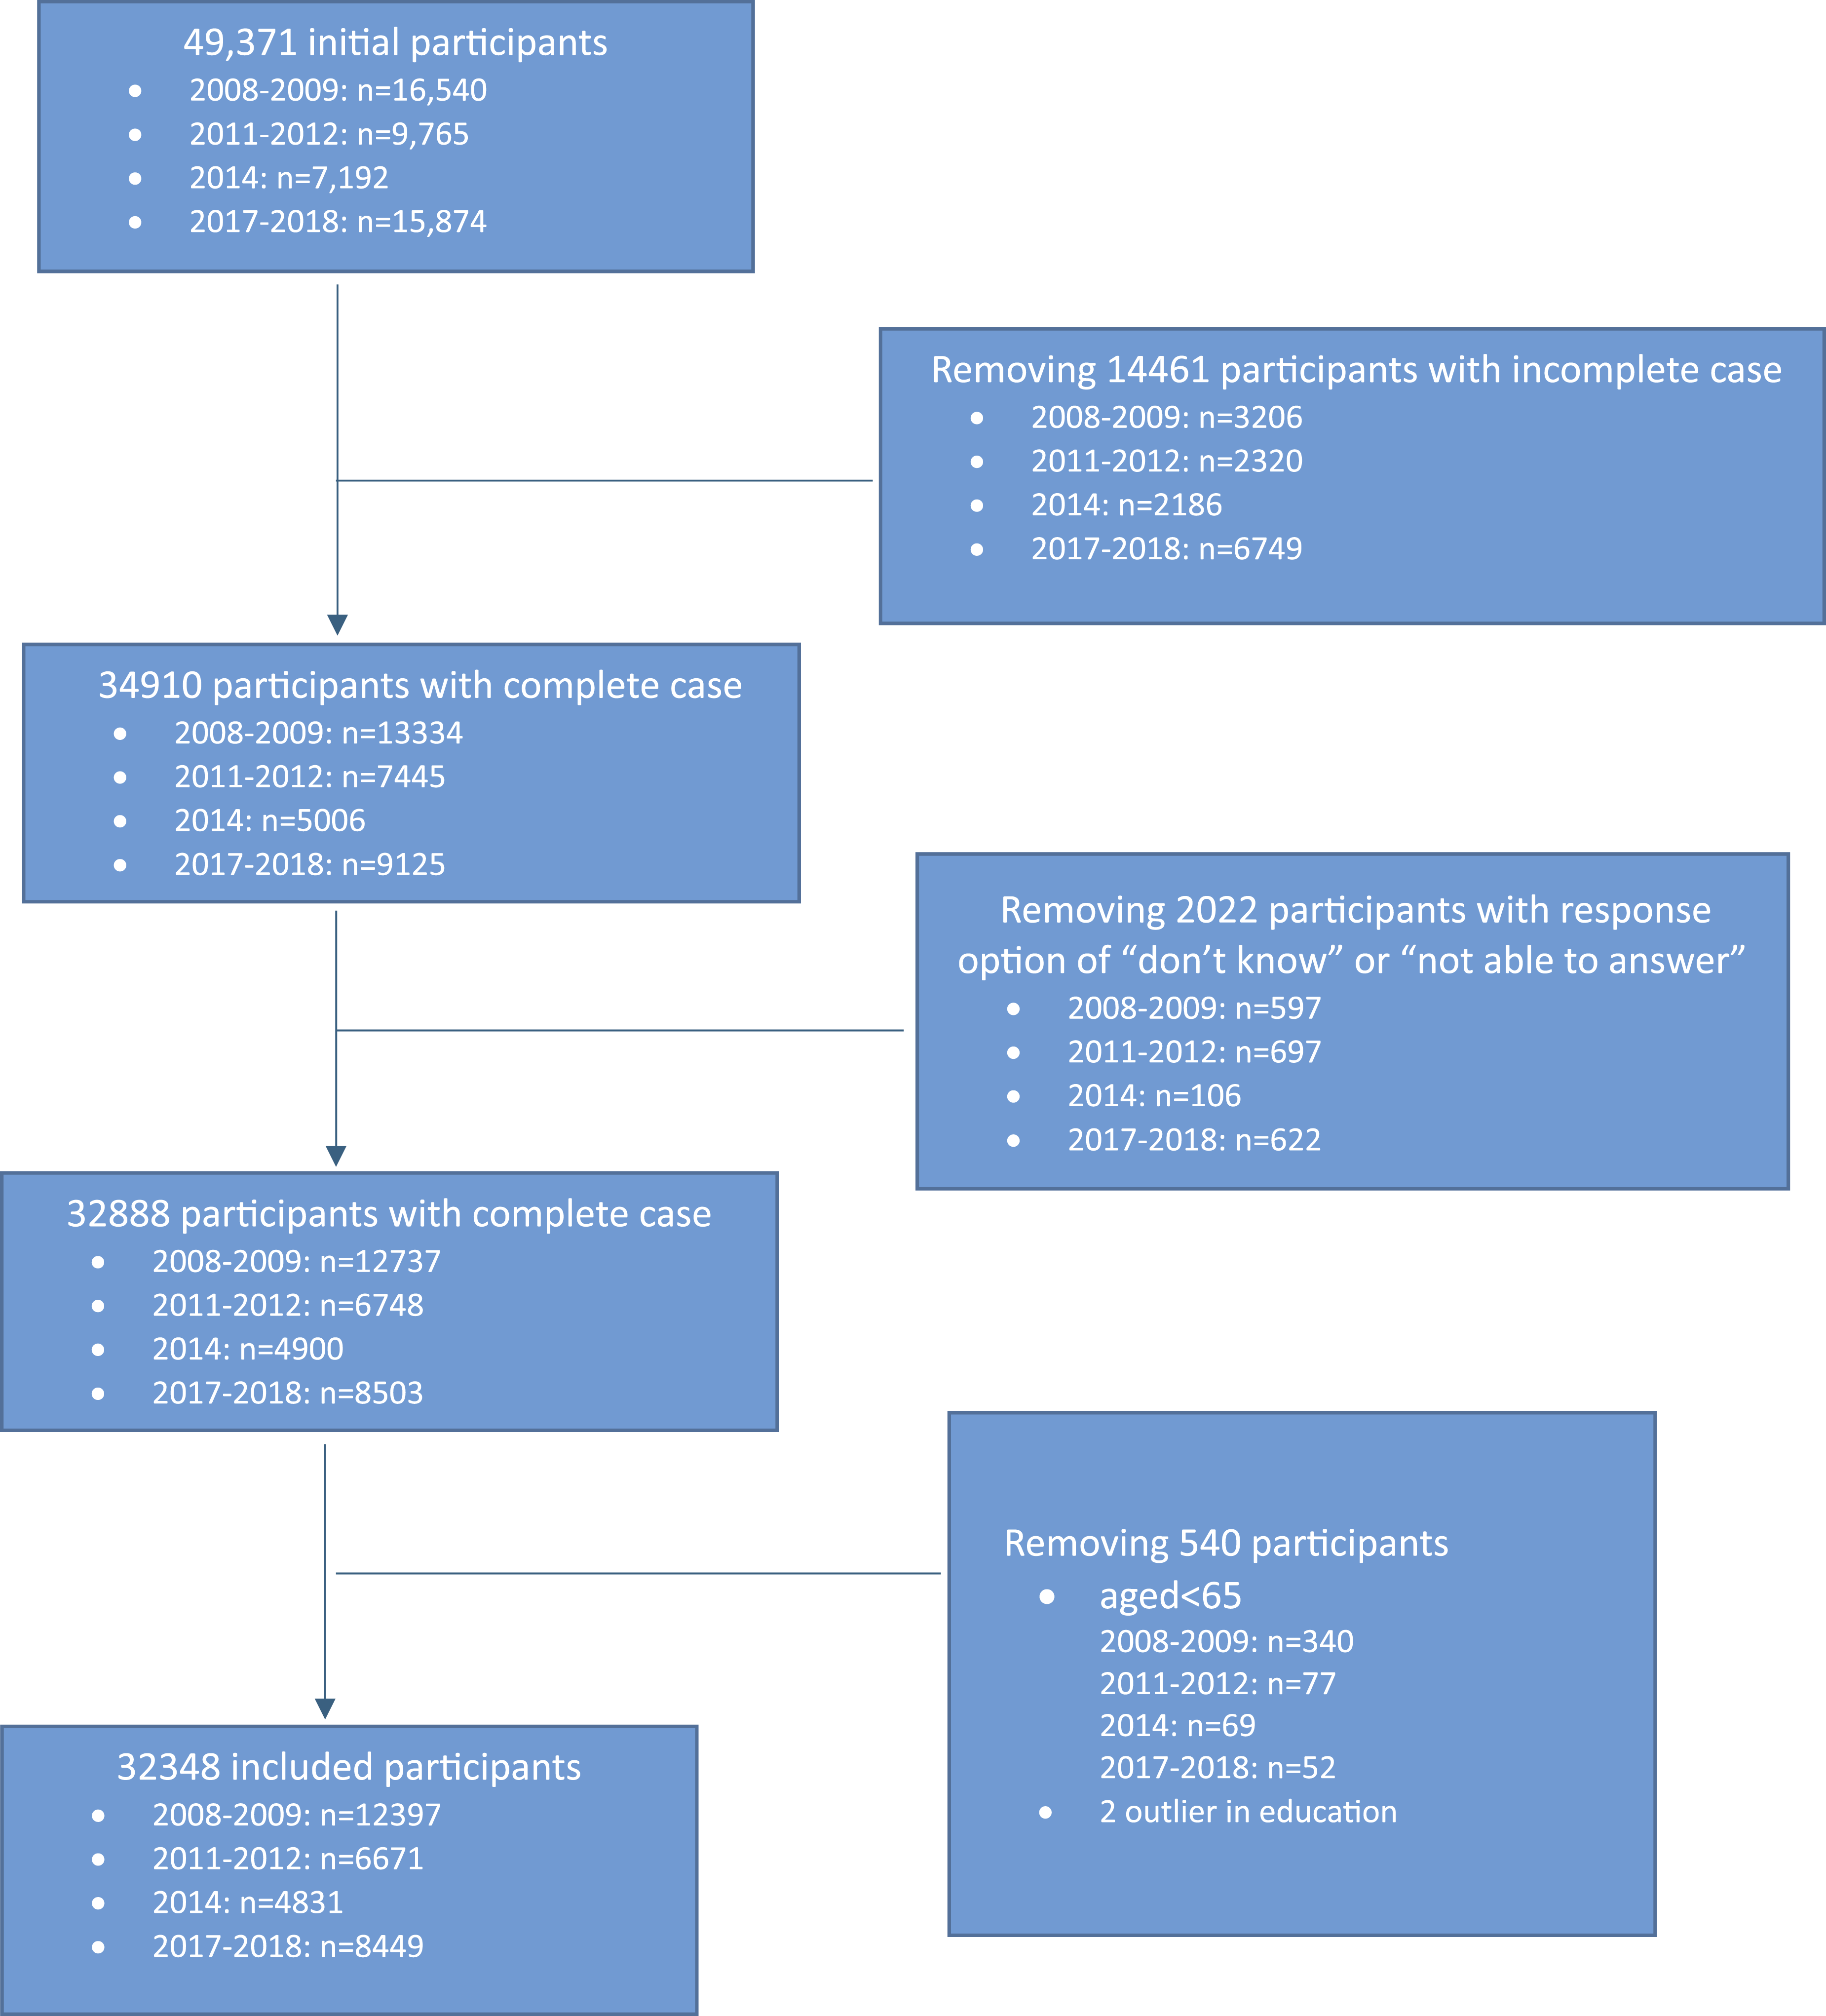
This study investigated the significant factors associated with changes in cognitive impairments, especially better cognitive transition. The inclusion criteria included only observations with complete data on all variables of interest across the four study waves for Chinese older adults aged 65 years and above. We ultimately derived a final sample of 32,348 person-wave observations from 22,392 unique participants (see Appendix Figure 1 for the sample selection procedure). Because the authors of this research only relied on a secondary and de-identified dataset in the public domain, this study was not classified as human subjects research.
Outcome Variables
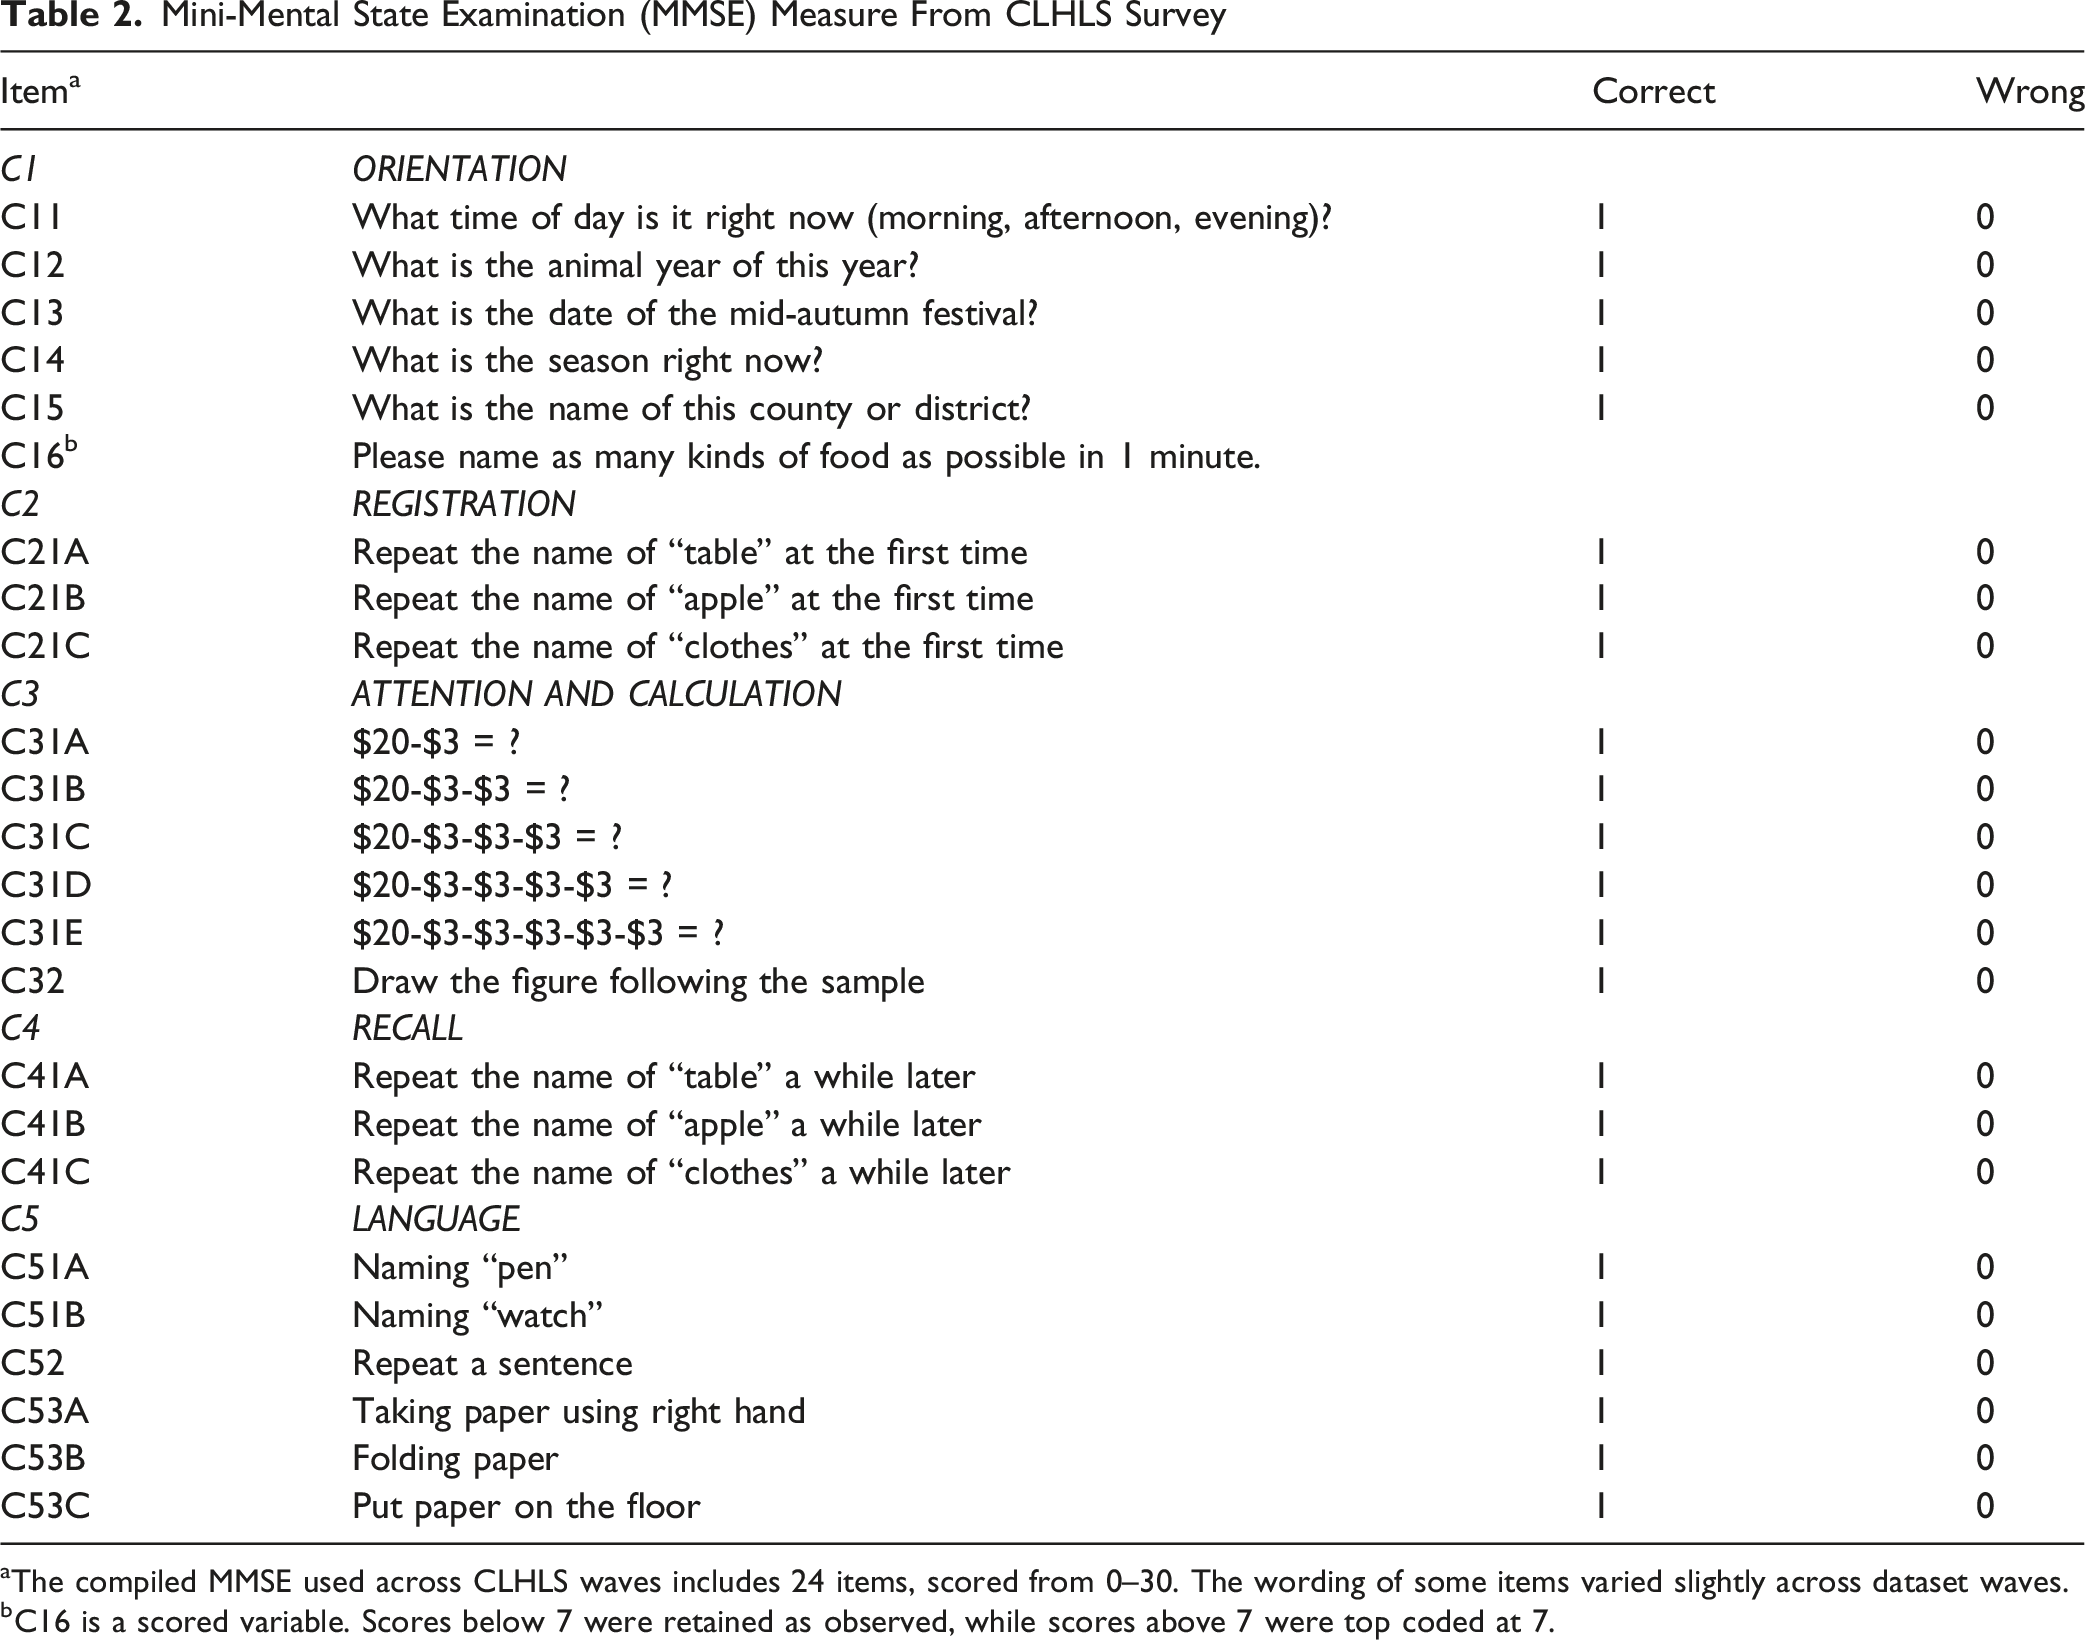
The outcome variable in this study was the cognitive impairment status of older adults, measured using the culturally adapted Chinese version of the Mini-Mental State Examination (MMSE) (Zhang, 2006), which takes into account cultural aspects and socioeconomic conditions of Chinese older adults (Folstein et al., 1975). This mini-MMSE questionnaire consists of 13 items covering different domains of cognitive functioning, including calculation, language, orientation, and recall ability, with scores ranging from 0 (incorrect responses) to 30 (correct responses). Previous studies have used a cutoff of 17 or lower on the MMSE to primarily identify severe cognitive impairment (Lee et al., 2021). To align with prior population-based studies and to examine changes in mental health status, we adopted a more nuanced classification to identify different stages of cognitive function: normal cognitive function (MMSE ≥ 25), moderate cognitive impairment (18 ≤ MMSE ≤ 24), and severe cognitive impairment (MMSE ≤ 17) (Lee et al., 2024). Given that a substantial proportion of participants (approximately 53.5%) had little or no formal education in this study, using a lower cutoff for severe impairment helps reduce the risk of misclassification. This approach ensures that cognitive impairment is more accurately identified, regardless of educational background (An & Liu, 2016).
Independent Variables
We selected a diverse array of independent variables to characterize participants across different dimensions. Biological factors included age group (65–80, 81–95, and above 95) and gender (female, male). Sociodemographic factors encompassed years of formal education (no formal education, any formal education), marital status (married or others, including never married, divorced, or widowed), living arrangement (living alone, with household member(s), or in an institution), household income in RMB (no income, ≤¥20,000, >¥20,000), and community of residence (rural or urban). Health behaviors and health status history included the number of times participants had suffered from chronic diseases requiring inpatient treatment in the past two years (none, 1–2 times, more than 2 times), life satisfaction measured by self-rated quality of life (bad/very bad, neutral, good/very good), and health behaviors including smoking, exercise, and alcohol consumption, each coded as yes or no. These variables were selected and structured based on a multidimensional framework of cognitive aging that integrates biological, sociodemographic, and behavioral–health domains. This framework is consistent with established theoretical and empirical evidence on determinants of cognitive aging and dementia risk (See Appendix Table 1) (Ekström et al., 2024; San Martín et al., 2025).
Statistical Analysis Strategies
We applied a Cox multi-state regression model to examine various changes in cognitive impairment status among older adults, including transitions from severe to normal, normal to normal, and moderate to normal. The Cox multi-state model, an extension of traditional time-to-event survival analysis, was chosen because it is well-suited to capture changes in cognitive status over time, reflecting its bidirectional and time-varying nature (Lee et al., 2024; Lee et al., 2025; Xu et al., 2026). Choosing the multi-state model was important for this work because cognitive status may change in multiple directions over time. Therefore, this approach allowed us to examine favorable transitions, maintenance, and deteriorating patterns across MMSE-defined cognitive stages.
To examine the associations between different sets of variables and cognitive function (MMSE), we conducted a series of sequentially adjusted Cox multi-state regression models. Variables were entered sequentially in three blocks: Model 1 included biological factors; Model 2 was additionally adjusted for sociodemographic factors; and Model 3 was further adjusted for health behaviors and health status history. This stepwise approach allowed us to assess how the inclusion of additional variables influenced the significance and magnitude of the effects of previously entered factors (Xu & Shelley, 2024).
To enhance transparency in model development, model performance across the three specifications was assessed using the concordance index (C-index) and likelihood ratio test statistics. Hazard ratios (HRs) with their corresponding 95% confidence intervals (CIs) were estimated, and all statistical tests were two-sided with a significance level of 0.05. Analyses were conducted using R (version 4.5.1) in the R programming environment, employing the “survival” package for Cox regression modeling and the “psych” package for descriptive statistics.
Results
Sample Characteristics
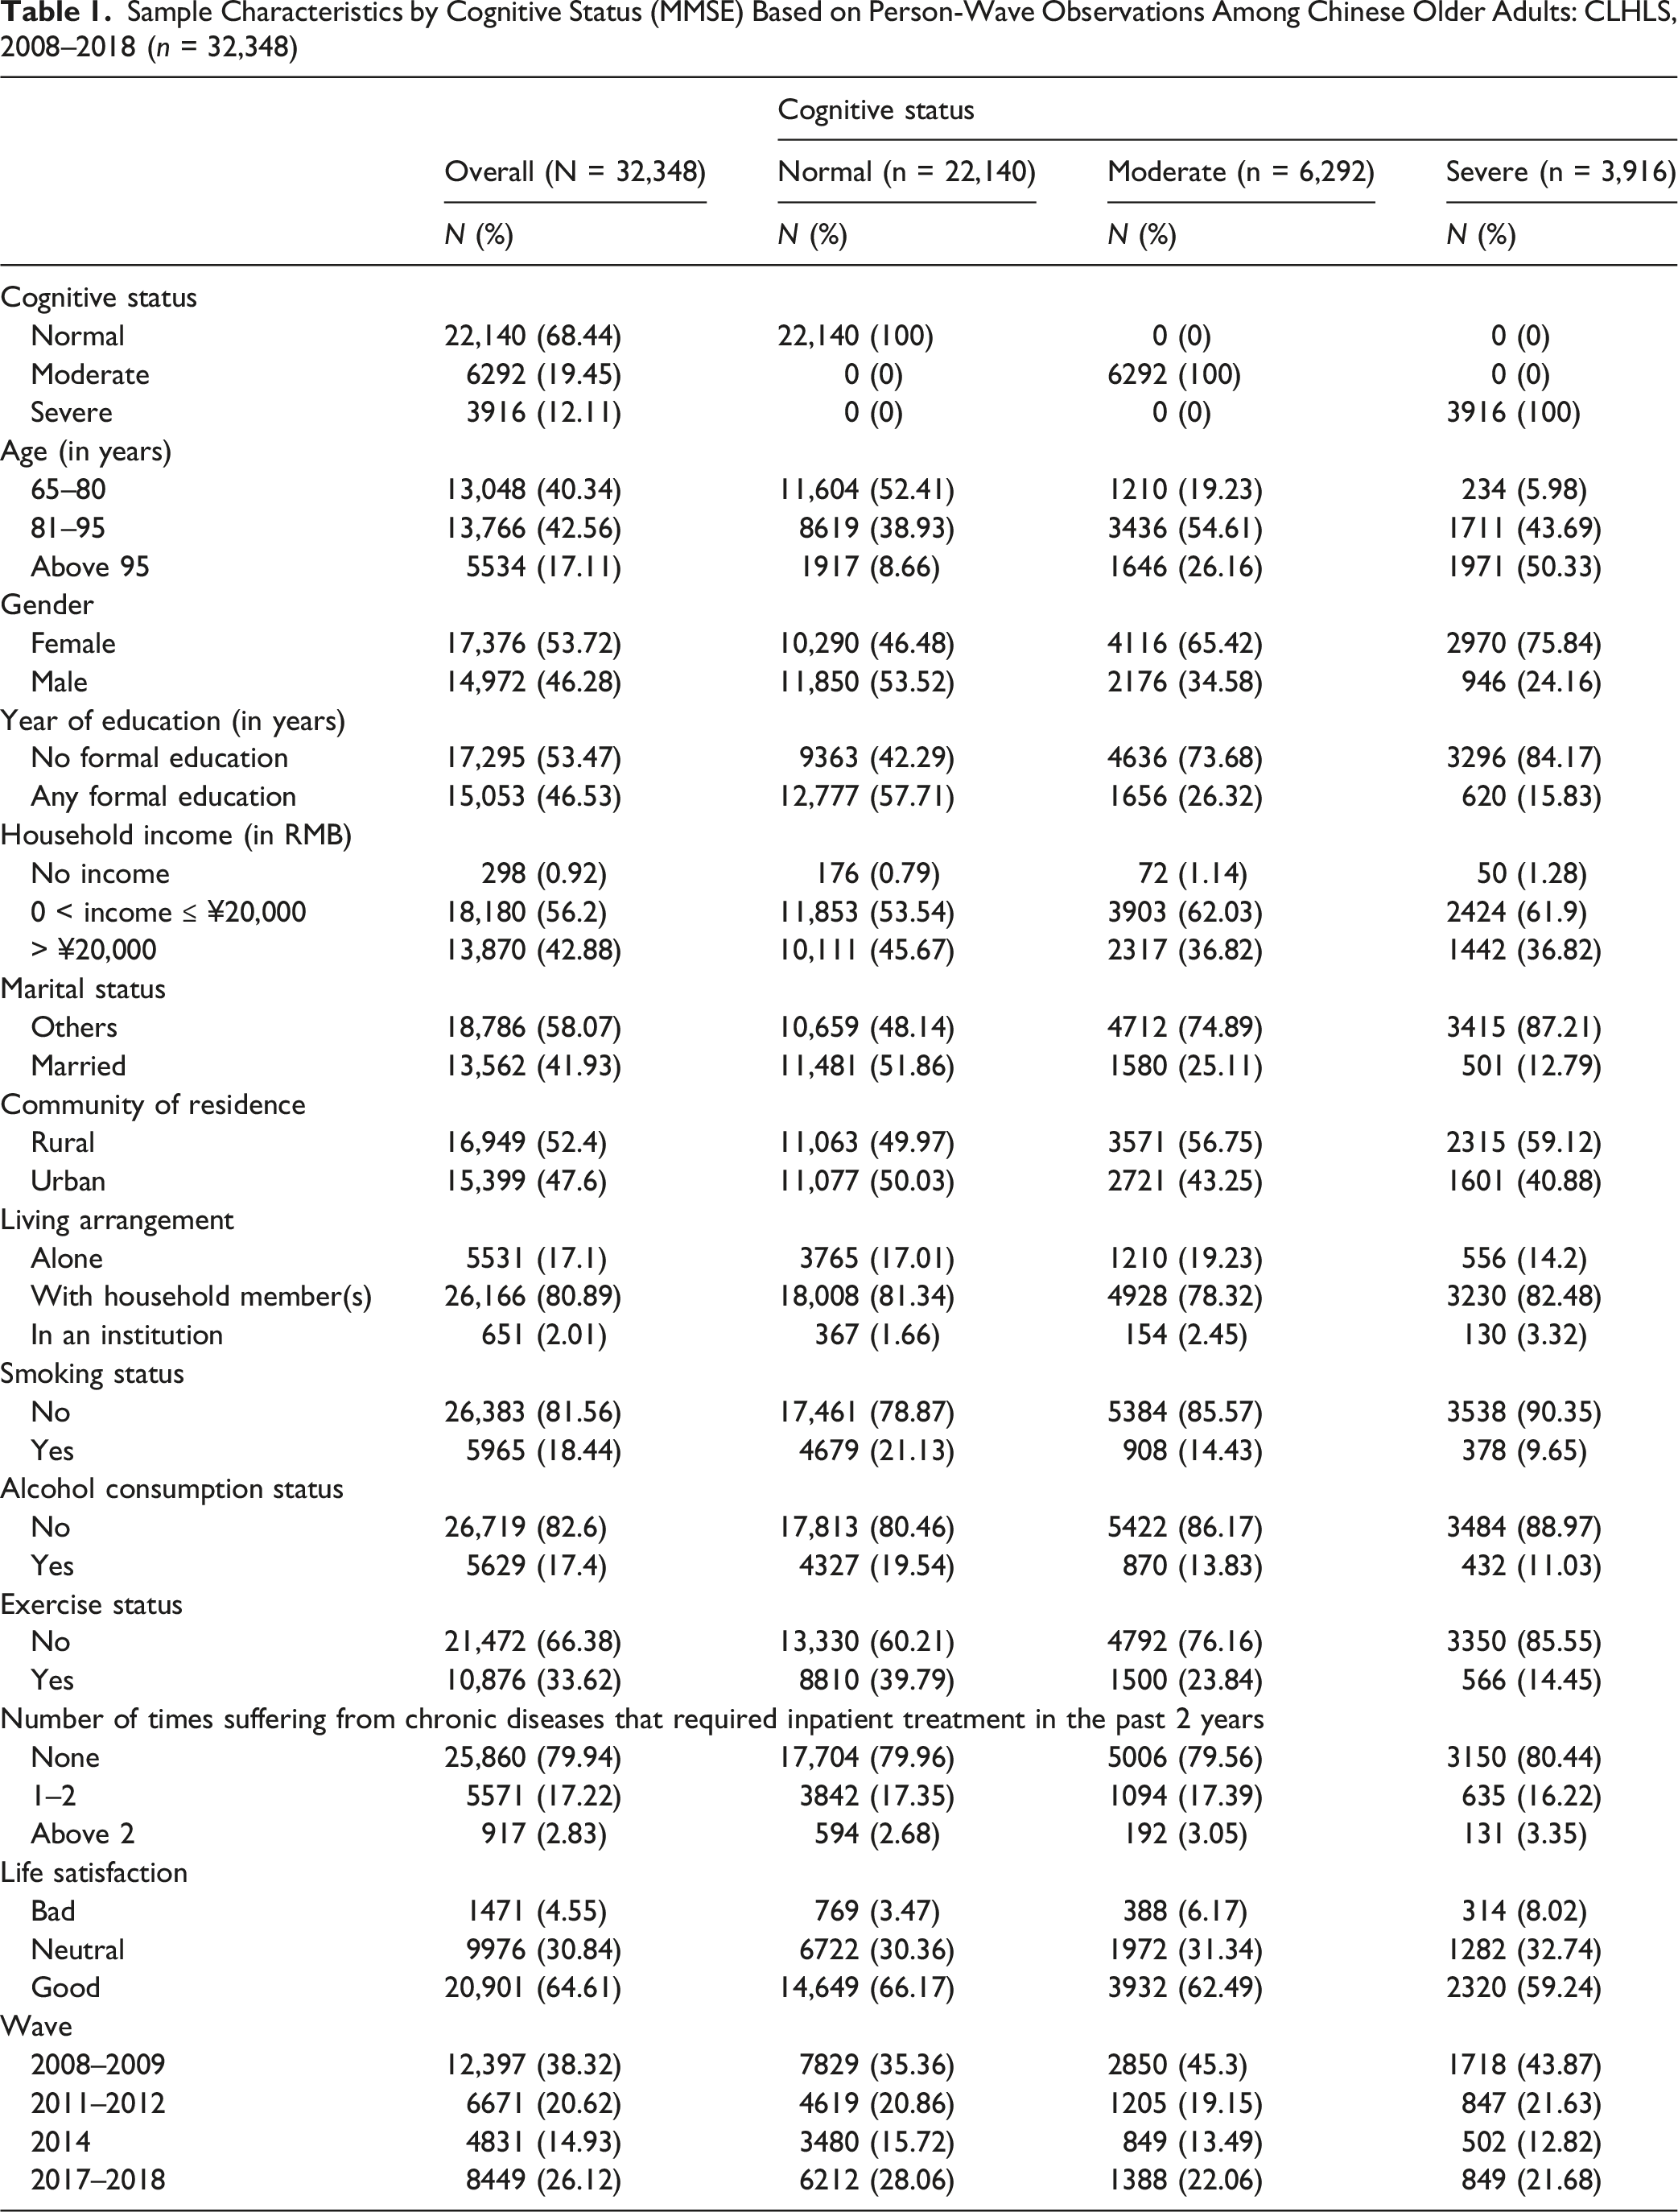
Sample Characteristics by Cognitive Status (MMSE) Based on Person-Wave Observations Among Chinese Older Adults: CLHLS, 2008–2018 (n = 32,348)
Results of the Sequentially Adjusted Cox Multi-State Regression Models on the Associations of Relevant Factors With Changes in Cognitive Impairment Status
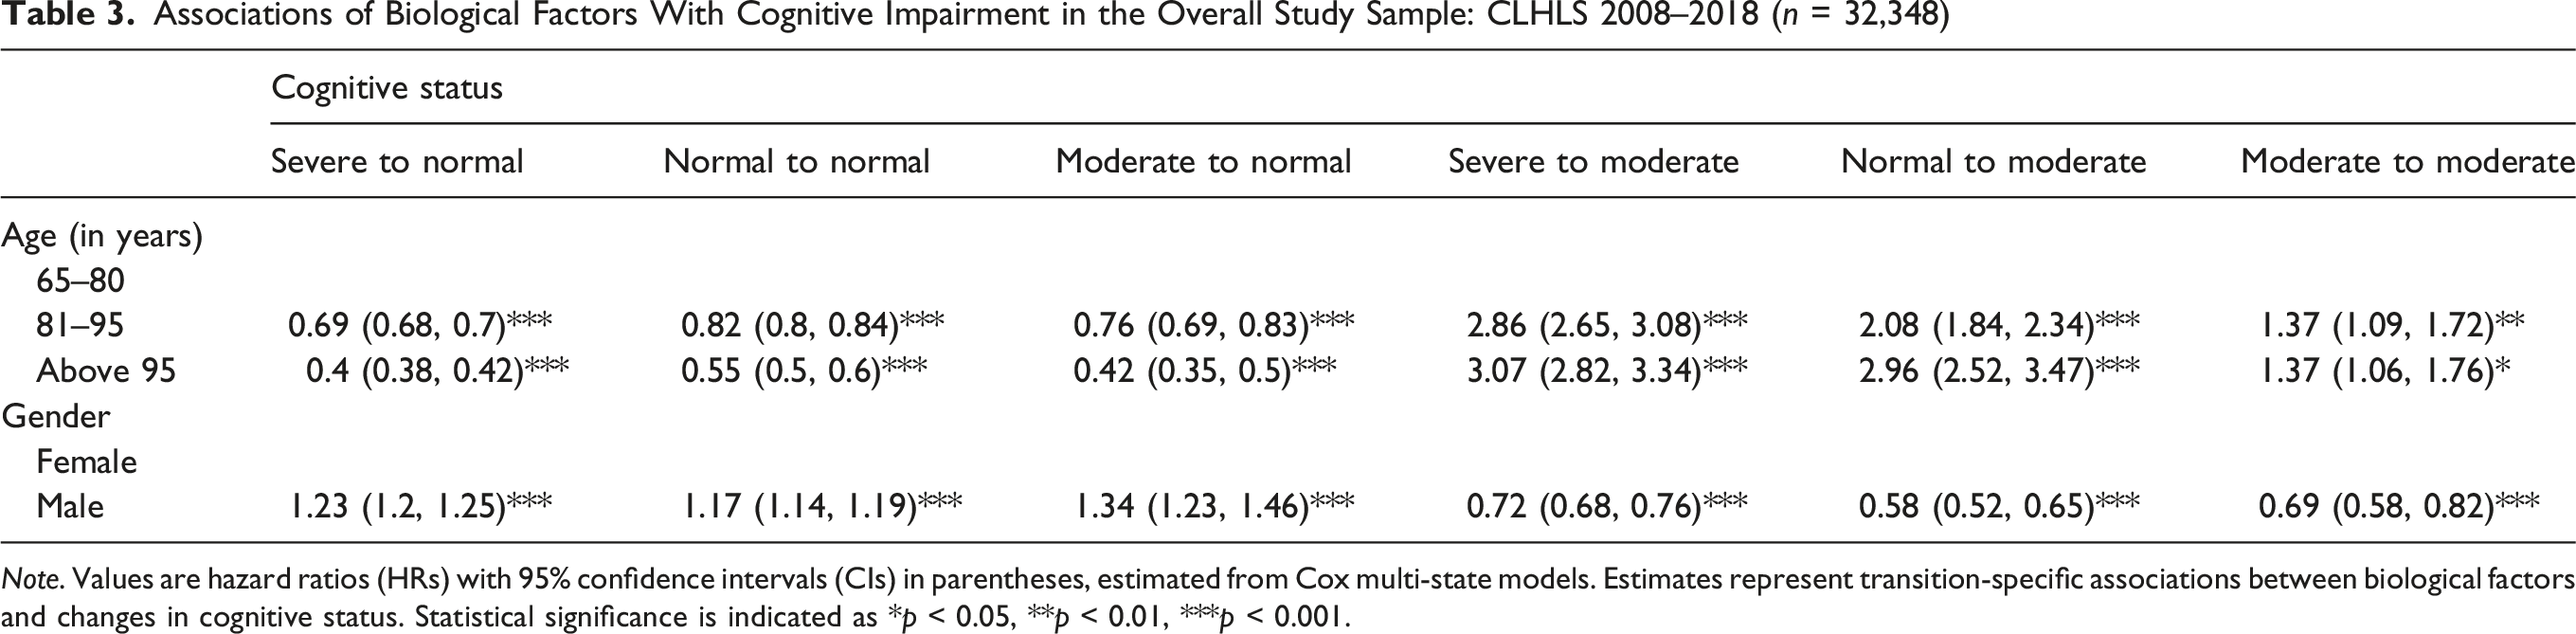
Associations of Biological Factors With Cognitive Impairment in the Overall Study Sample: CLHLS 2008–2018 (n = 32,348)
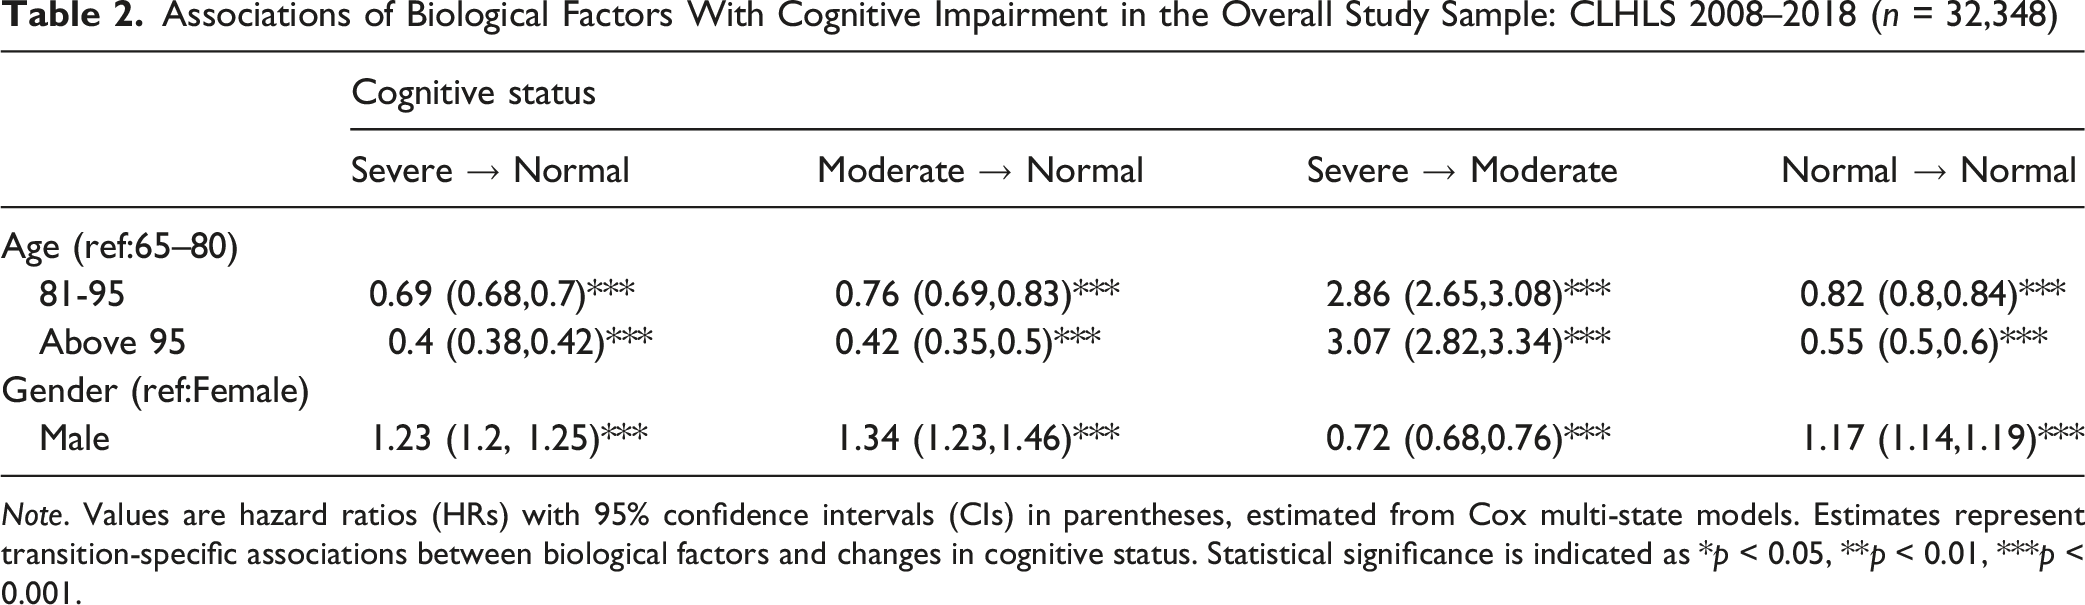
Note. Values are hazard ratios (HRs) with 95% confidence intervals (CIs) in parentheses, estimated from Cox multi-state models. Estimates represent transition-specific associations between biological factors and changes in cognitive status. Statistical significance is indicated as *p < 0.05, **p < 0.01, ***p < 0.001.
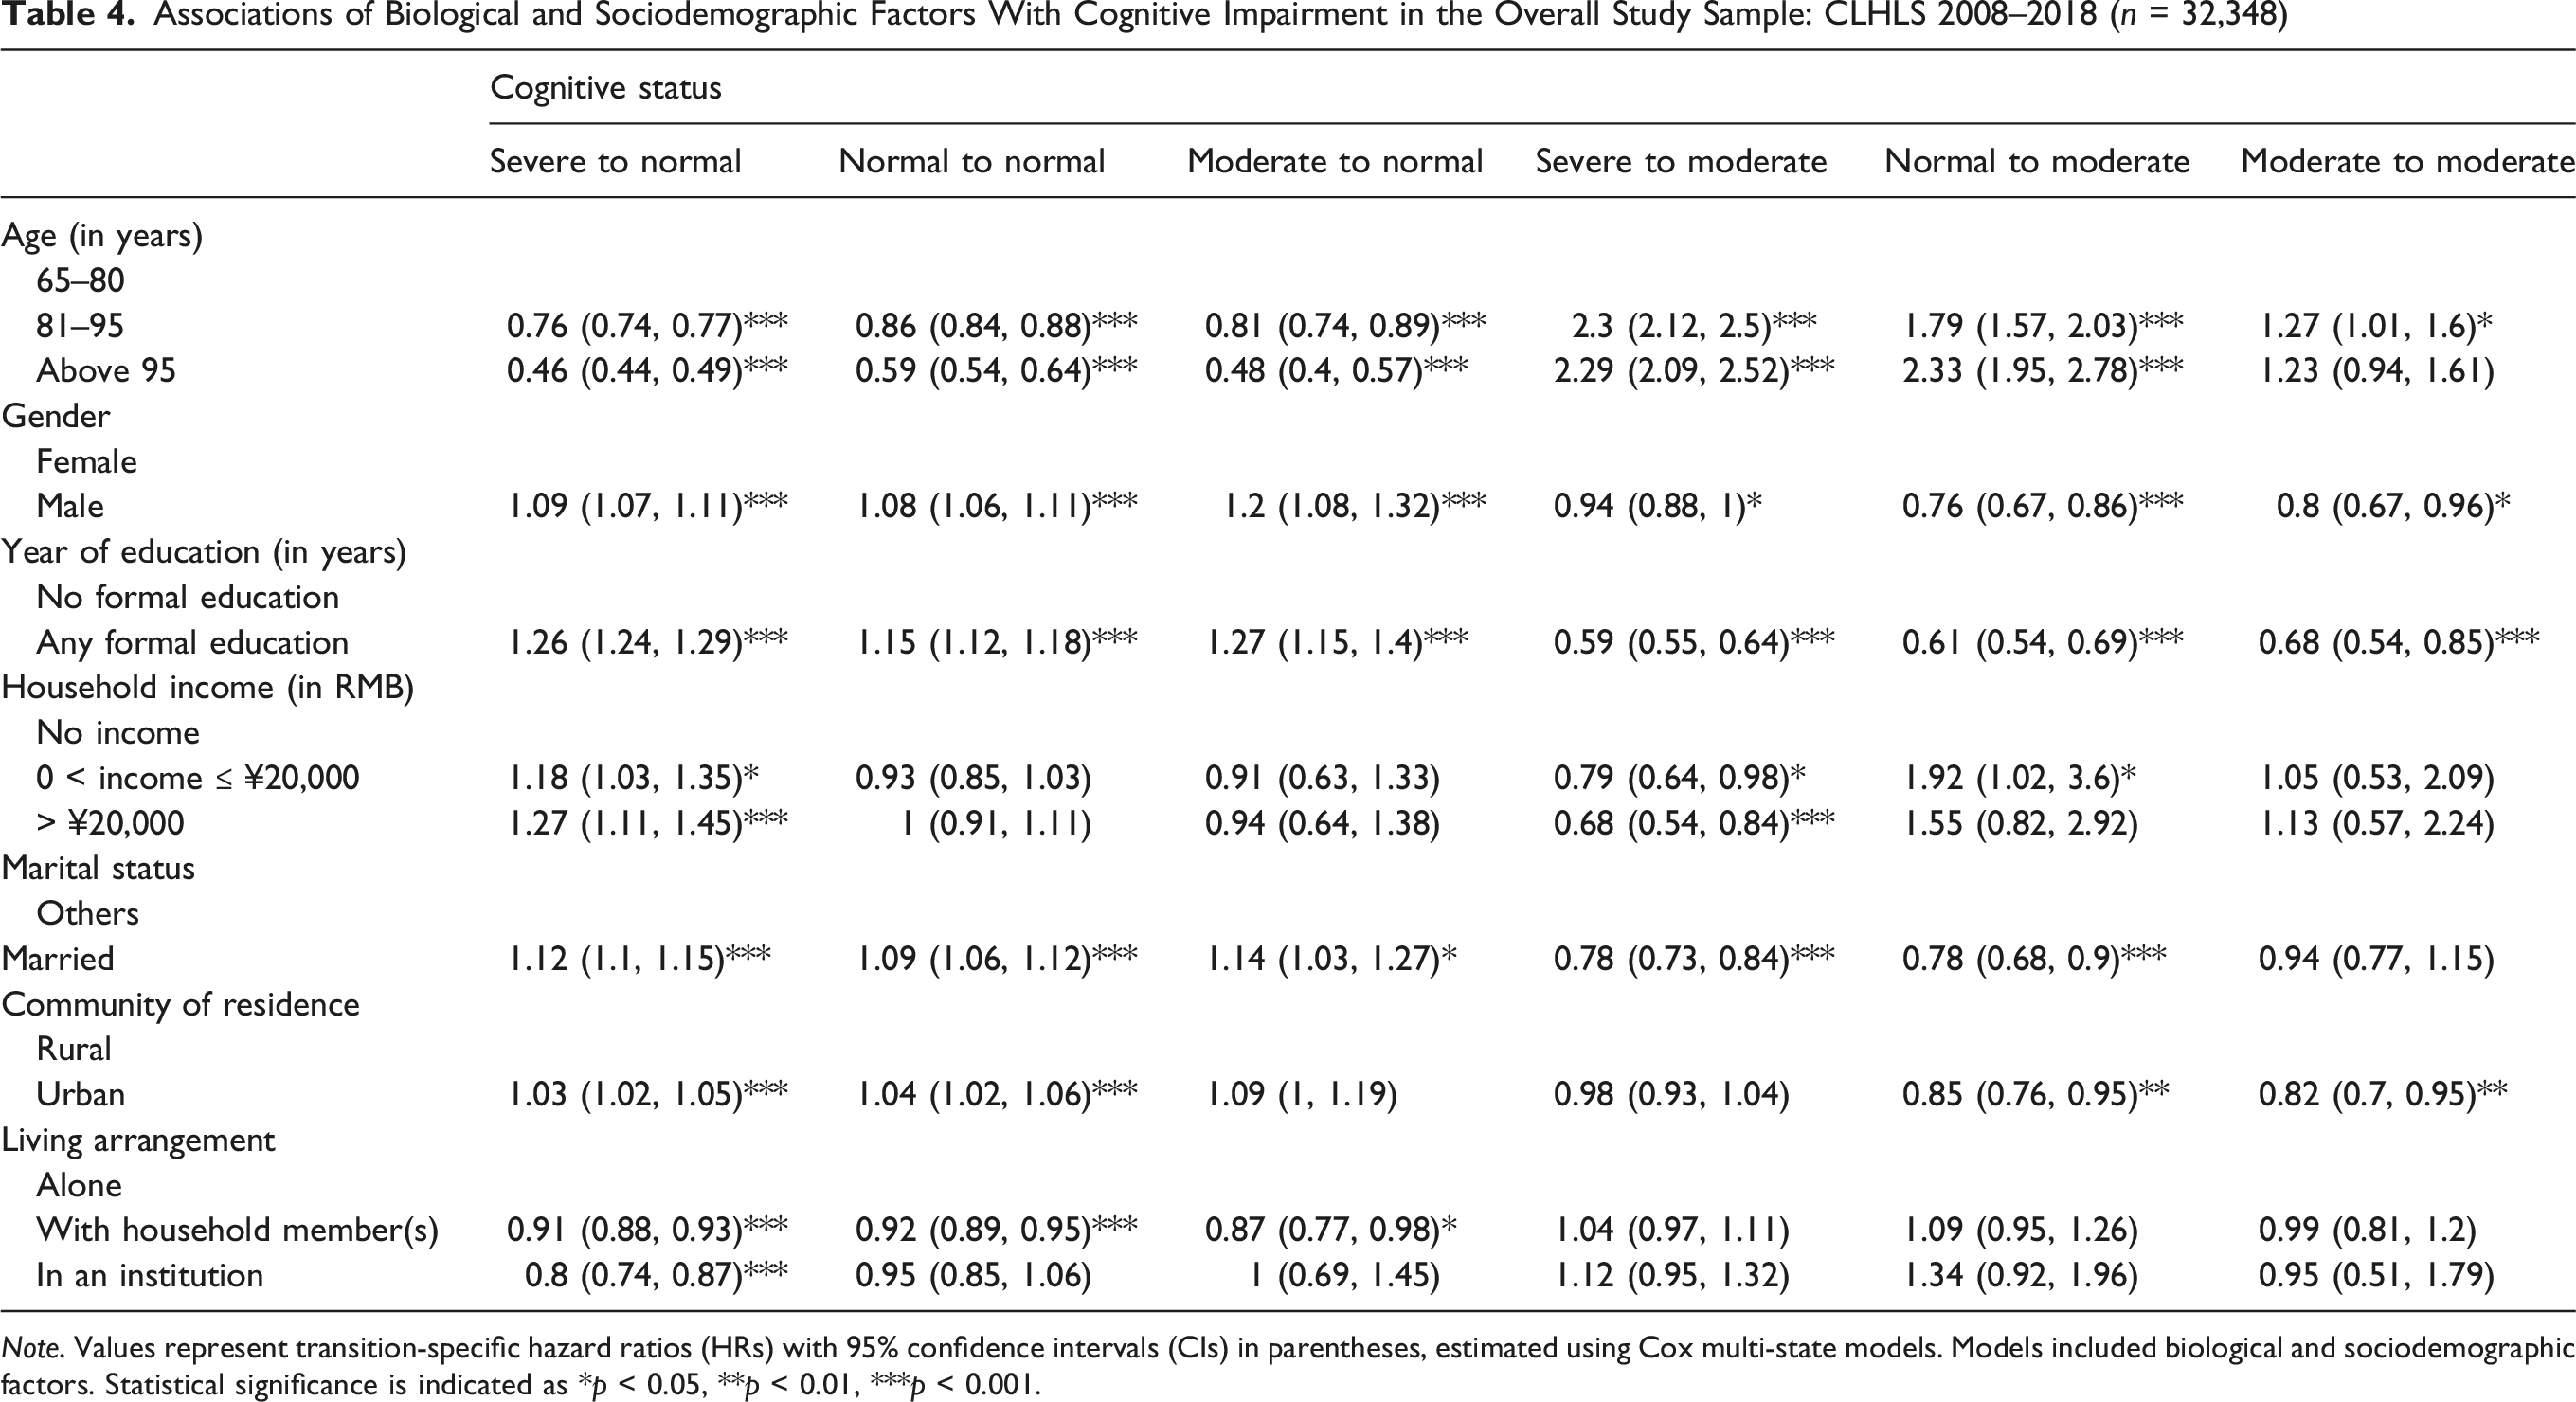
Associations of Biological and Sociodemographic Factors With Cognitive Impairment in the Overall Study Sample: CLHLS 2008–2018 (n = 32,348)
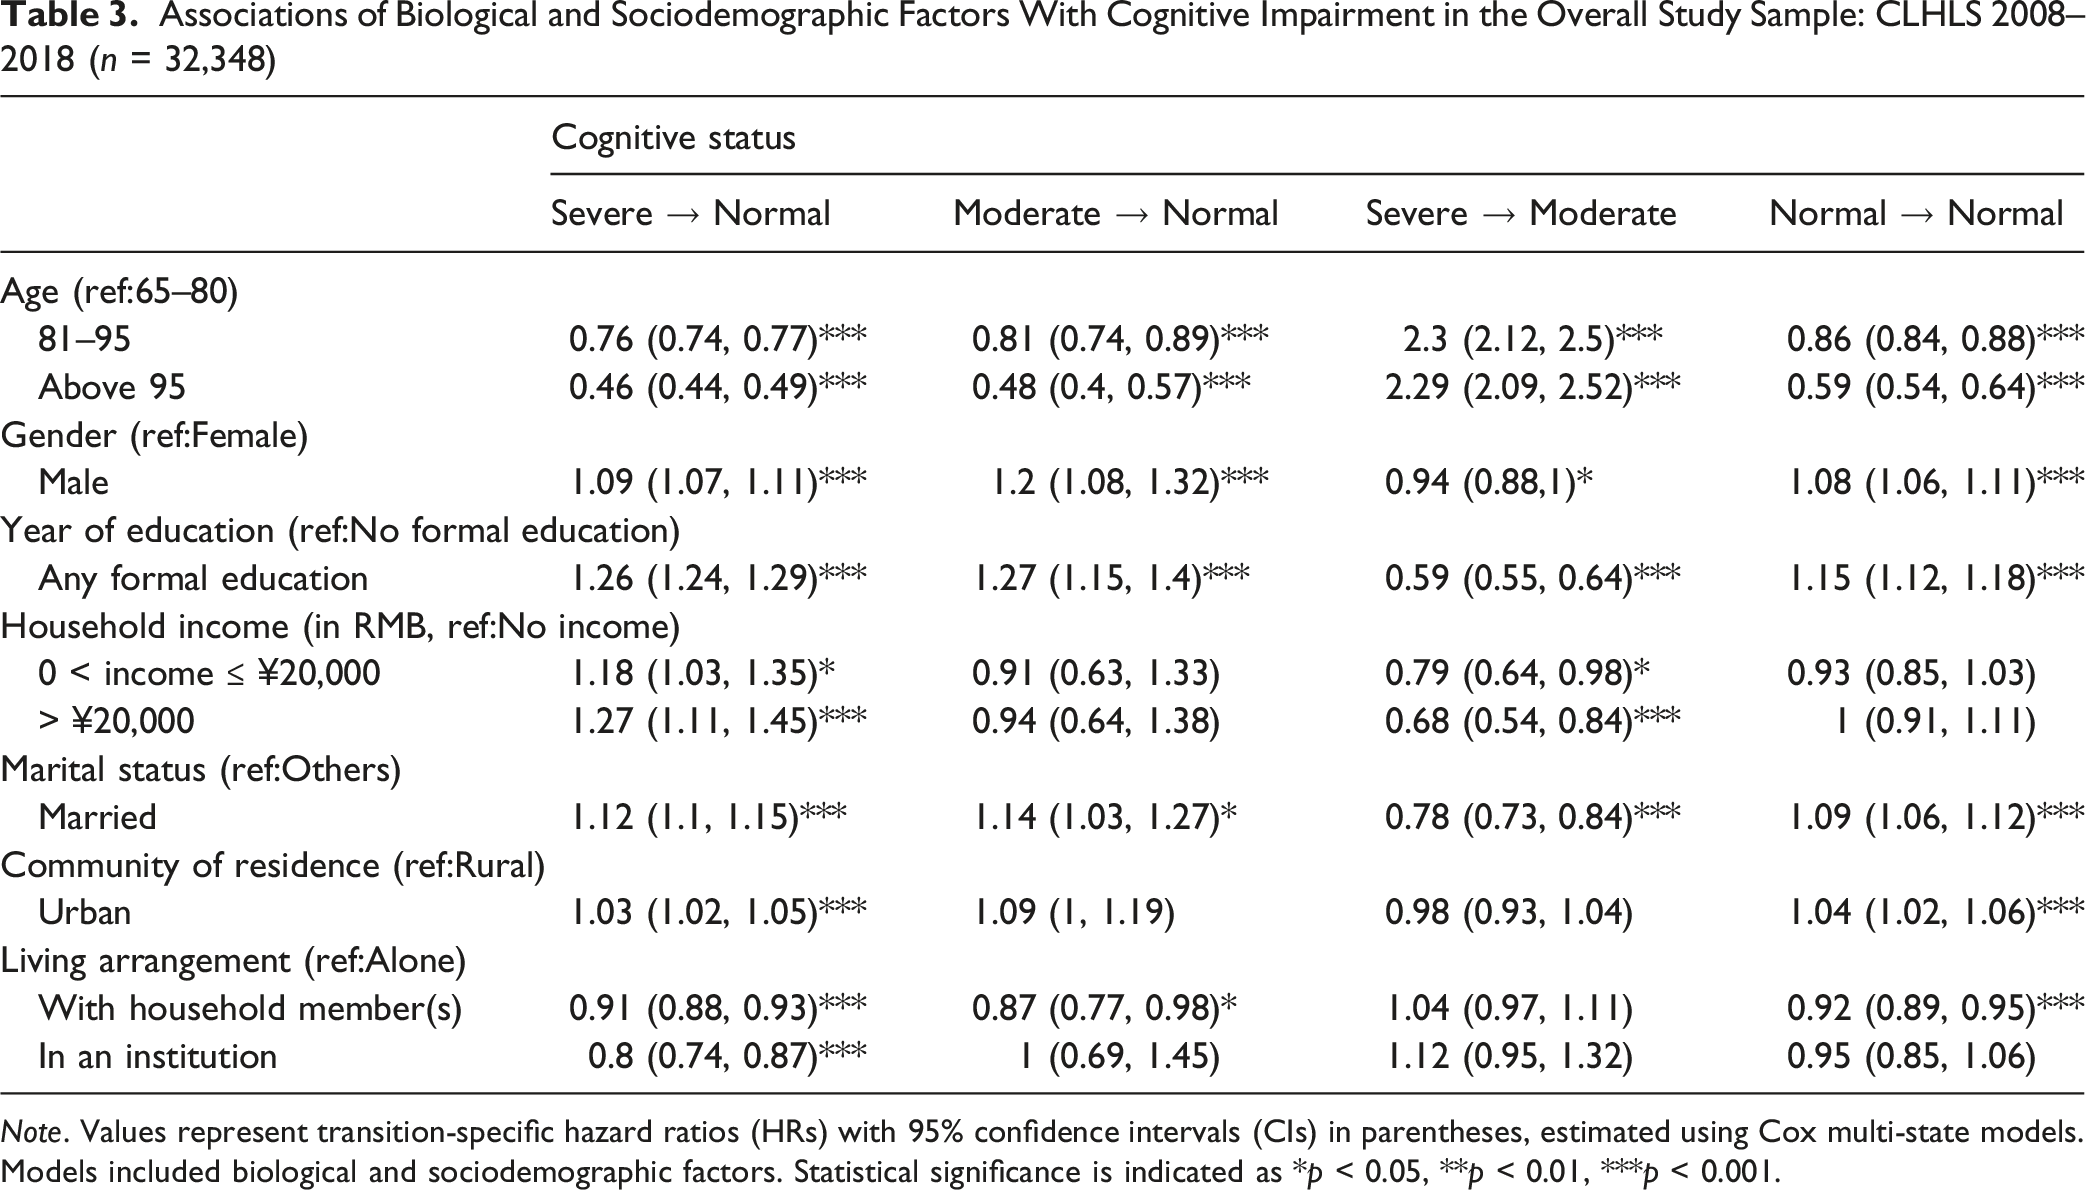
Note. Values represent transition-specific hazard ratios (HRs) with 95% confidence intervals (CIs) in parentheses, estimated using Cox multi-state models. Models included biological and sociodemographic factors. Statistical significance is indicated as *p < 0.05, **p < 0.01, ***p < 0.001.
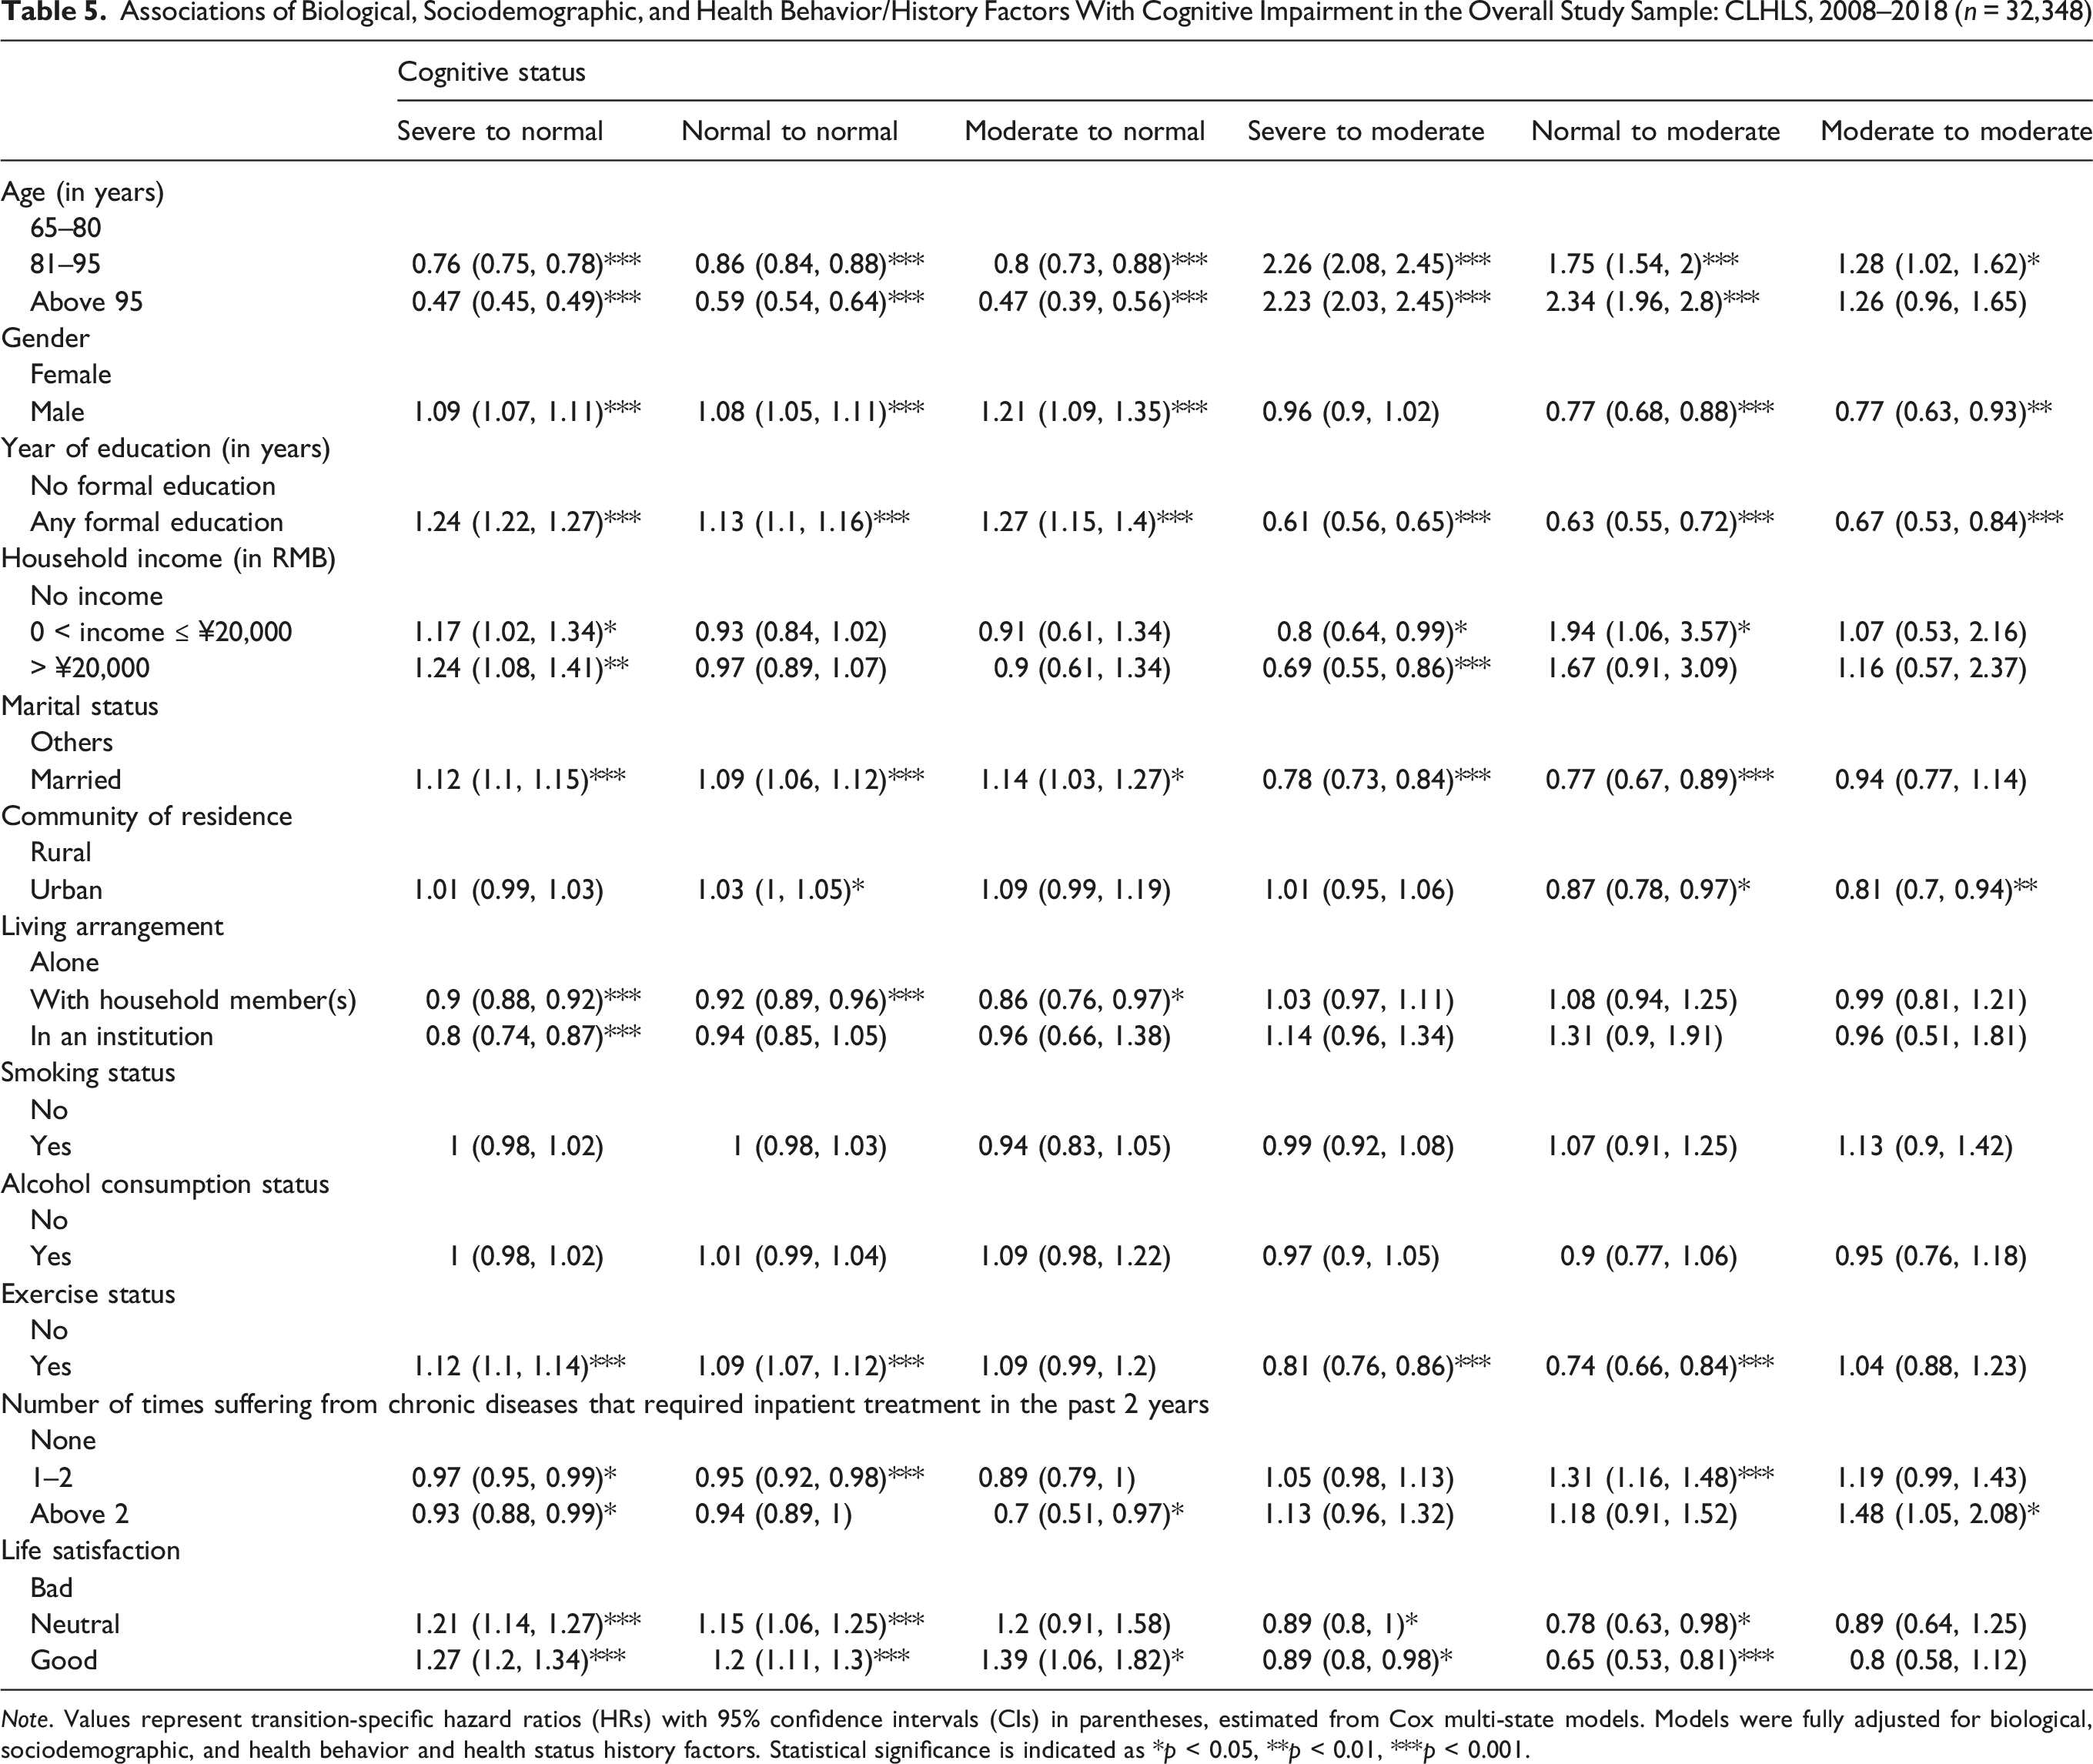
Associations of Biological, Sociodemographic, and Health Behavior/History Factors With Cognitive Impairment in the Overall Study Sample: CLHLS, 2008–2018 (n = 32,348)
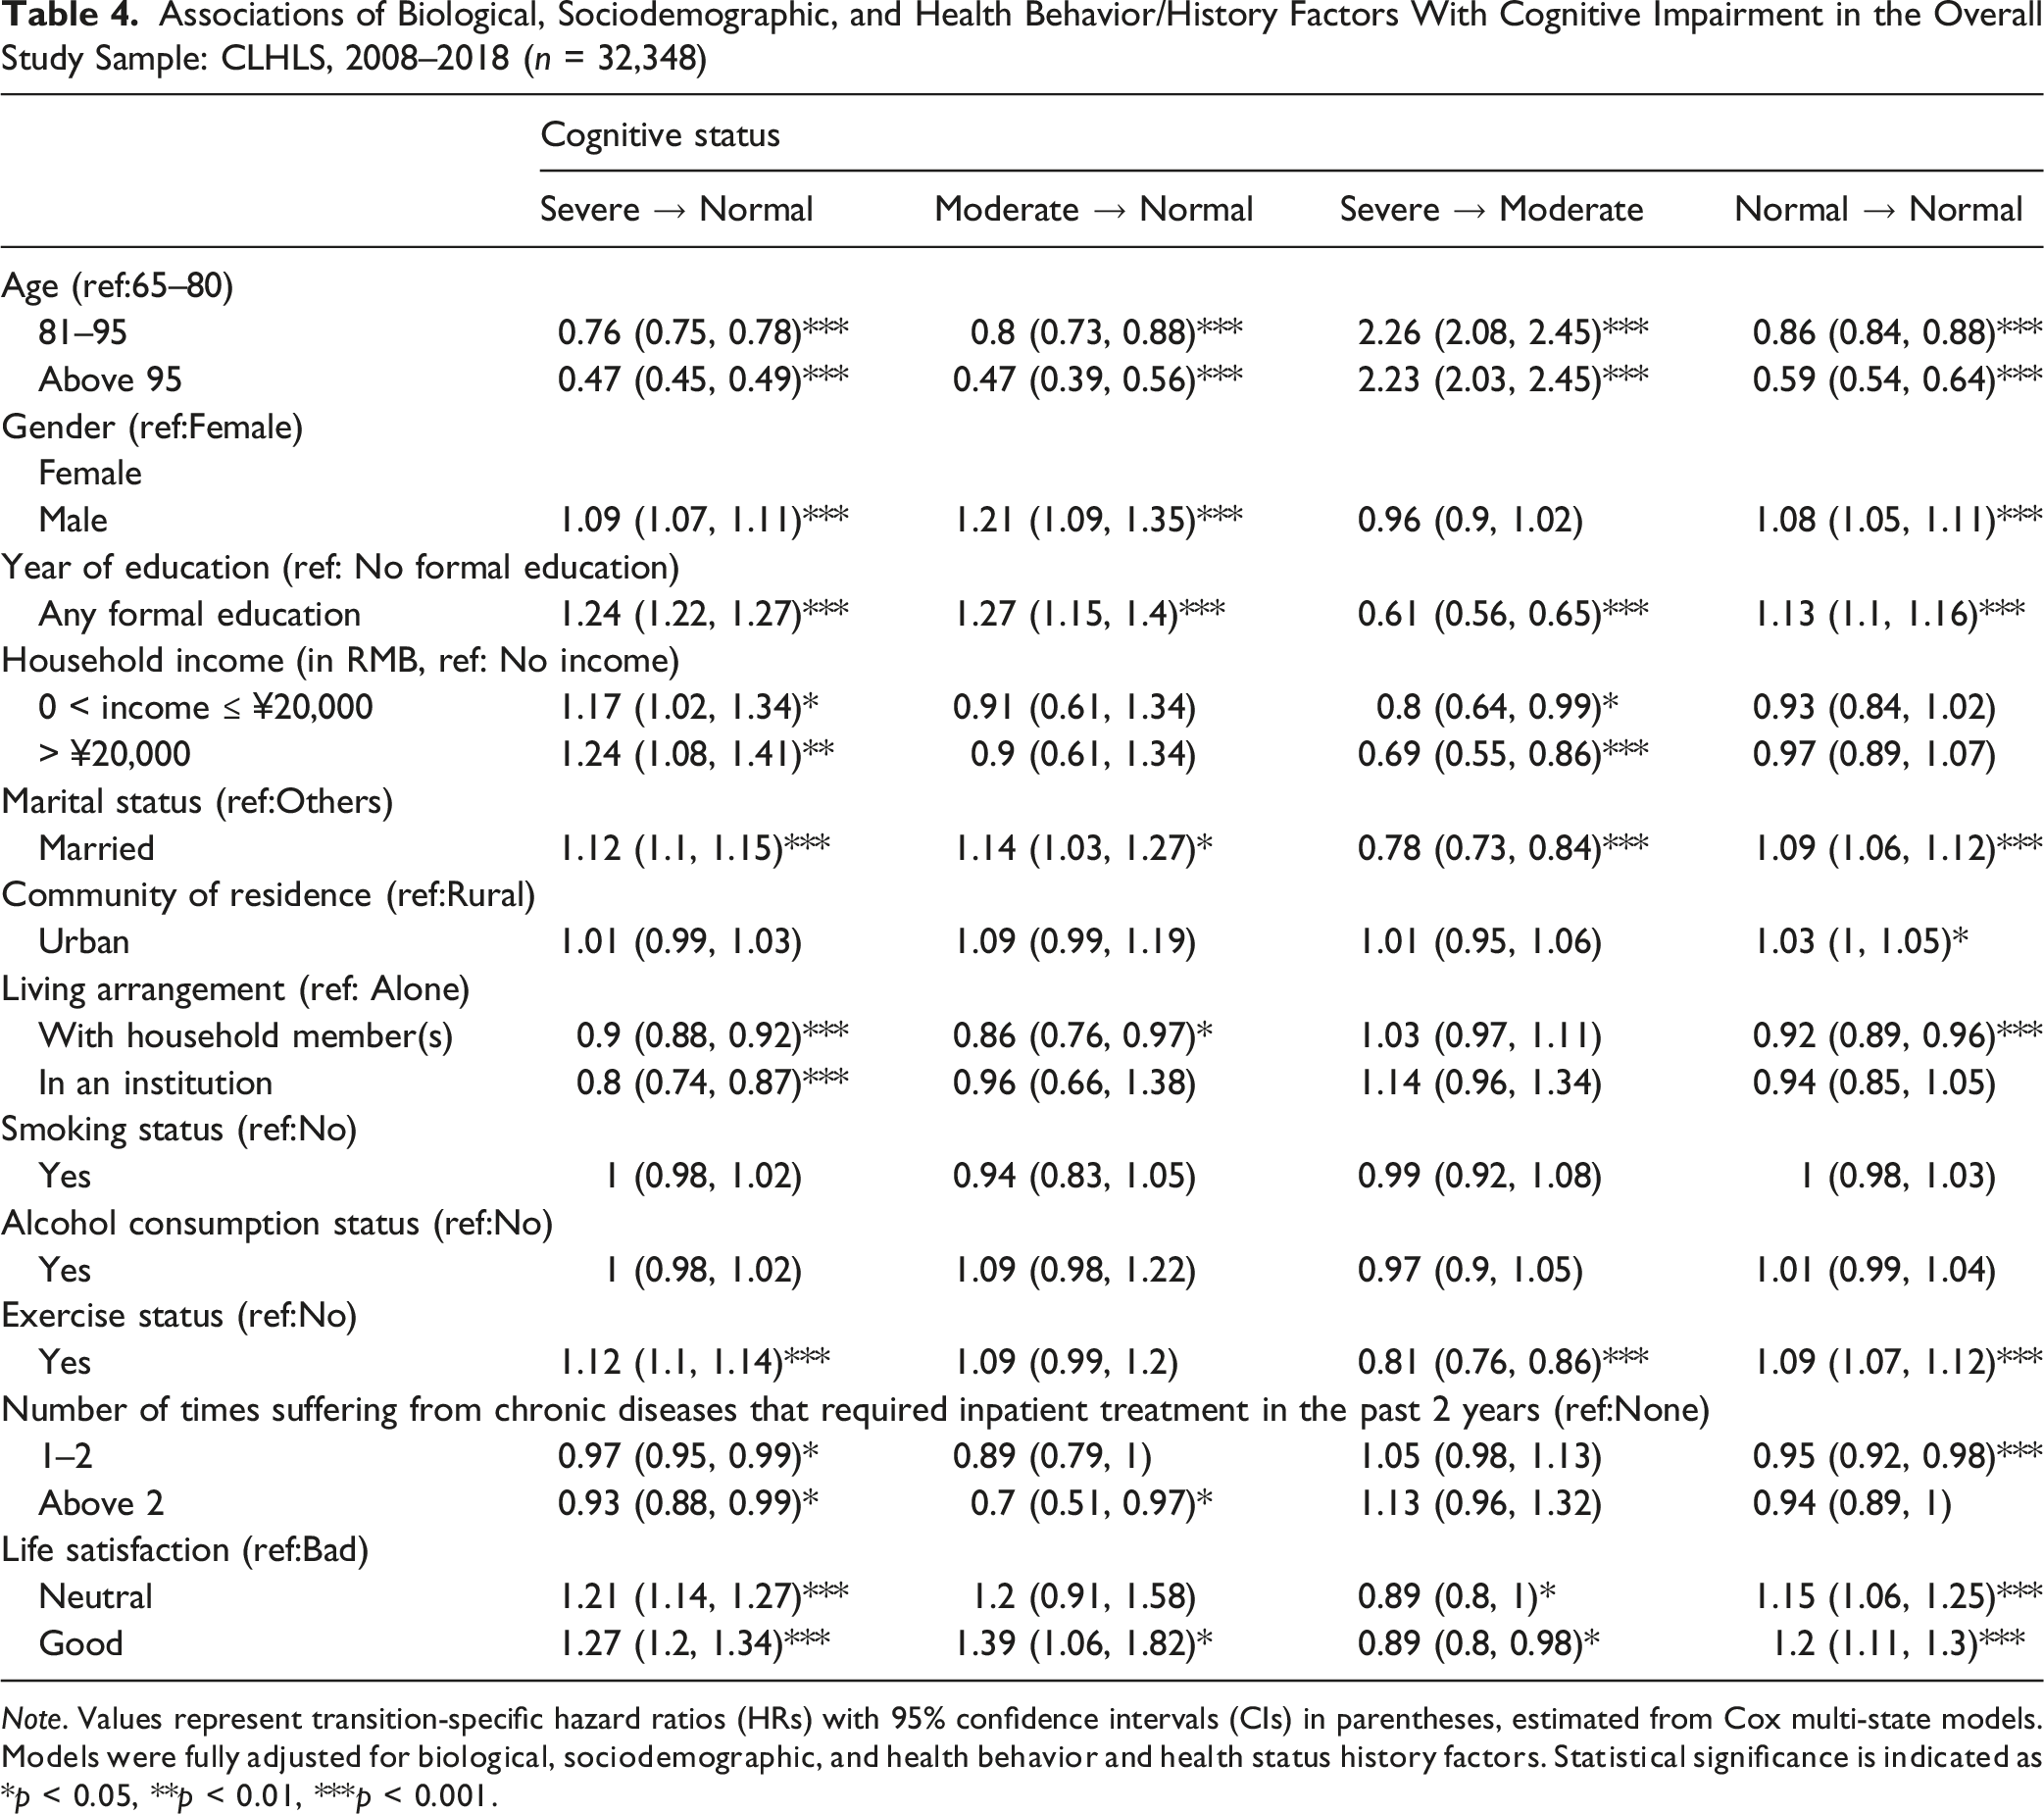
Note. Values represent transition-specific hazard ratios (HRs) with 95% confidence intervals (CIs) in parentheses, estimated from Cox multi-state models. Models were fully adjusted for biological, sociodemographic, and health behavior and health status history factors. Statistical significance is indicated as *p < 0.05, **p < 0.01, ***p < 0.001.
After including health behavior and health history factors, these associations remained largely consistent. Regular exercise was associated with a higher likelihood of better cognitive transition from severe to normal (HR = 1.12, 95% CI: 1.10–1.14), whereas smoking and alcohol consumption were not significantly related to such a cognitive transition. Higher life satisfaction also predicted improvement from severe to normal, with participants in the “good” group showing higher likelihoods compared with those in the “bad” group (HR = 1.27, 95% CI: 1.20–1.34).
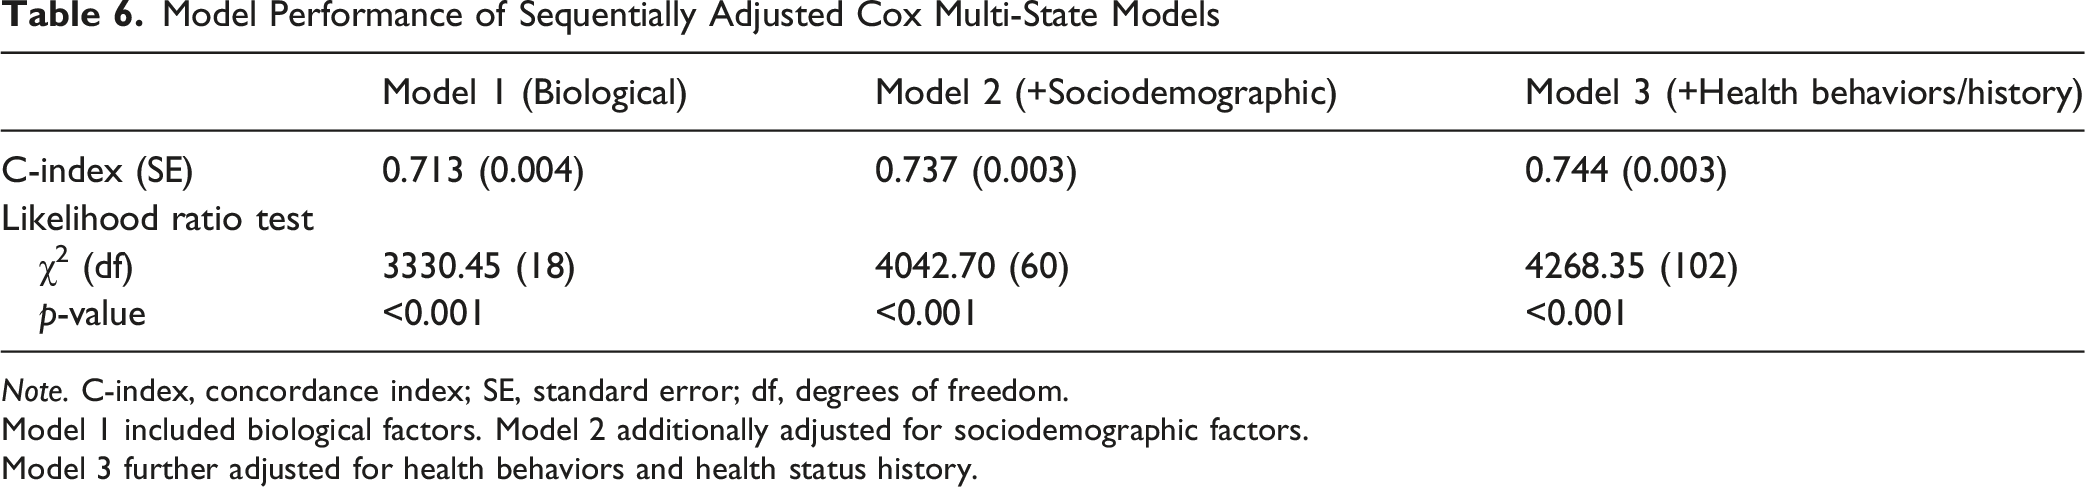
The C-index increased progressively from the Cox model including biological factors only to the fully adjusted model (0.713 to 0.744), indicating improved model discrimination with additional covariate adjustment. All models were statistically significant based on likelihood ratio tests (p < 0.001; see Appendix Table 6).
Discussion
We used a large and nationally representative dataset, the CLHLS, to examine factors associated with improving cognitive function over time among Chinese older adults. We applied hierarchical Cox multi-state models to assess transitions across different stages of cognitive impairment. Compared with traditional Cox models, which often examine a single direction of change, this approach can better capture the dynamic and bidirectional nature of cognitive transitions (Lee et al., 2021; Le-Rademacher et al., 2022). Multi-state models may also provide useful insights into the progression and potential improvement of complex chronic conditions, including cognitive impairment (Le-Rademacher et al., 2022).
Our empirical evidence showed that better cognitive transition was associated with key sociodemographic factors and psychosocial dimensions. First, we noticed that male participants had a higher likelihood than female older adults of reporting better cognitive transitions from severe or moderate impairment to normal cognition. This observation was remarkable, given that women usually have longer life spans than men (Chen et al., 2022; Deng et al., 2025). Furthermore, men were also more likely to report higher medical expenses than women due to poorer health outcomes, including hospitalizations (Song & Bian, 2014). However, in a report assessing the path to healthy ageing in China (Chen et al., 2022), the authors pointed out that women were more likely to be widowed in their later lives, in which case their health status would be worse off in almost all dimensions compared with older men.
Interestingly, when looking into other health outcomes such as sleep quality and duration, older females had lower odds of reporting good sleep quality but higher odds of having shorter sleep duration (fewer than 7 hours per day) than their older male counterparts (Lee et al., 2022). At the global level, women usually report worse health than men, but the gender gap in China may differ from that in Western countries due to cultural and behavioral differences (Zhang et al., 2015).
Additionally, we would like to point out that our sequentially adjusted models may provide insight into the observed gender differences. The association between being male and better cognitive transition declined after we added sociodemographic factors in Model 2. For example, the calculated HR for severe impairment to normal cognition decreased from 1.23 to 1.09, and the HR for moderate impairment to normal decreased from 1.34 to 1.20. Our observed findings may demonstrate that sociodemographic factors like education may explain the observed gender differences partially. Nevertheless, we should point out that the male gender remained statistically associated with different transitions for better cognition in the fully adjusted models. It is plausible that social, behavioral, and/or other health-related mechanisms may contribute to the gender disparities in cognitive transitions. Therefore, further research is warranted to examine the gender disparities associated with health outcomes in later life, especially chronic diseases such as cognitive impairment.
Next, having higher educational attainment, reporting greater household income, being married, and residing in urban regions were associated with a higher likelihood of better cognitive transition in this research. These findings may highlight that cognitive impairment in later life is a complex health issue involving structural, sociodemographic, and contextual environments (Wang et al., 2024; Zihl & Reppermund, 2023). These findings emphasize the importance of examining a broad range of factors associated with cognitive function rather than focusing on a single factor when aiming to promote better cognitive transition among older adults. Better living environments may be particularly beneficial for those with cognitive impairment.
Nevertheless, our observations regarding marital status and educational attainment deserve further attention. First, it has been documented that females have a higher life expectancy than men, but the health ratio is lower than that of men, including activities of daily living (Chen et al., 2025). However, females with higher educational levels tend to live longer and report a healthier life than men (Chen et al., 2025). Additionally, educational attainment has been examined as a strong predictor of human health and healthcare-seeking behavior (Winkleby et al., 1992). For example, in the United States, individuals with higher educational attainment may be more likely to report greater vaccination rates, while individuals in China with higher levels of education had higher odds of using preventive care services and had better health insurance coverage compared with their counterparts with lower education (Fletcher & Frisvold, 2009; Lee, Chiang, & Liu, 2018; Lee, Chiang, Shelley, et al., 2018). Furthermore, consistent with prior research (Zhang et al., 2015), the disadvantages in women’s health in China indicate real inequalities rather than self-reporting bias, which suggests that lower educational attainment may be associated with higher rates of chronic conditions and functional limitations.
Marital status is another complex issue. When women become widowed in later life, their health conditions may deteriorate (Chen et al., 2022). In a study examining older adults’ marital status and transitions, both middle-aged and older men and women who were divorced, single, or widowed were positively associated with poor quality of life and happiness (Pengpid et al., 2024). Furthermore, for all-cause mortality, the risk was also higher among older adults who were widowed (Wang & Yi, 2023). In general, being unmarried may be associated with health risk behaviors and mental health issues (Wang & Yi, 2023).
We also observed that living in urban areas was associated with better cognitive transitions among Chinese older adults. Because of increased access to healthcare services, transportation, and human development opportunities, living in urban areas may lead to better health outcomes for older adults compared with their rural counterparts (Song et al., 2024). Additionally, living in urban areas may be disadvantageous for younger older adults, but this disadvantage might be offset in later life, when living in urban areas could become beneficial to older adults’ health, considering their age and physiological conditions (Zhu et al., 2021). Although the positive effects of urbanization on human health have decreased over time (Jiang et al., 2021), the overall advantages and resources, such as healthcare and human development, in urban areas may still provide substantial benefits for older adults. This may also indicate that older adults in rural regions experience limited access to healthcare and developmental resources, which could exacerbate cognitive impairment.
Together with the aforementioned literature, the factors associated with overall health outcomes among older adults may also contribute to better cognitive transitions. We should, however, be cautious in making such a conclusive claim, given that most severe forms of cognitive impairment are likely irreversible. Nevertheless, it has been documented that mild cognitive impairment may be reversible, and that such cases are relatively common (Koepsell & Monsell, 2012). Currently, the global prevalence of mild cognitive impairment is approximately 23.7%, and this number is expected to increase in the future (Salari et al., 2025). Therefore, it is imperative to identify potential solutions and preventive strategies to avoid exacerbating cognitive impairment among older adults.
The empirical evidence in our research, such as higher educational attainment, greater household income, being married, and residing in urban regions, may help inform future interventions aimed at promoting better cognitive transition at the early stage. Addressing gender disparities, particularly those affecting women, may also be critical to reducing the disproportionate burden of cognitive impairment among older women. Interventions should specifically target older adults who are unmarried, have lower levels of education and income, and reside in rural areas. However, conclusive claims regarding reversible cognitive impairment cannot be drawn from a single study. This topic certainly warrants further investigation to identify factors that may help reverse cognitive impairment.
Study Limitations
This research is not without limitations. First, as we used an observational dataset, we should be careful not to use any language implying causal effects when interpreting the study findings. The empirical evidence presented in this research should be interpreted as “associations.” Second, the CLHLS questionnaire relies on the MMSE to assess older adults’ cognitive function. Additional assessments, such as the Montreal Cognitive Assessment (MoCA), may help capture mild cognitive impairment among older adults more effectively. Additionally, we should be more cautious in interpreting the findings regarding transitions in MMSE-based cognitive status in large survey datasets like CLHLS. In this research, better cognitive transition refers to favorable changes across MMSE-defined classifications, not clinically adjudicated recovery. Our observed transitions may indicate meaningful changes in survey-based cognitive performance, but measurement variability, interviewer differences, health conditions, or other potential unmeasured contextual factors may also influence these findings. Therefore, we should keep in mind not to interpret our observations as definitive evidence of clinical recovery.
Third, the data collection in CLHLS was based on self-reported questionnaires; therefore, issues related to self-report bias may exist. However, this is a common limitation in most survey-based studies and should not be viewed as a unique concern in this case. Lastly, we should acknowledge the possibility of survivor bias. Older participants who remained in the study and demonstrated more favorable cognitive transitions may have been healthier than those who were lost to follow-up. Older adults with severe disability, advanced cognitive impairment, or multiple chronic conditions may have been less likely to contribute follow-up observations. Thus, our findings may not be fully generalized to more vulnerable older adults or those experiencing severe health decline.
Conclusion
In spite of these study limitations, our study adds to the body of literature by providing new empirical evidence on potential factors associated with better cognitive transitions among Chinese older adults. Our observations emphasized the need to address disparities linked to gender and sociodemographic factors, as discussed in this research, to promote equitable and healthy ageing among older adults, particularly in cognitive health. These factors may jointly contribute to cognitive function in later life. Future research efforts are warranted to explore the mechanisms related to better cognitive transition among older adults in the long term.
Footnotes
Consent to Participate
Not required for this study.
Consent for Publication
Not required for this study.
Author Contributions
The first draft of the manuscript was drafted by Cai Xu and Yen-Han Lee. All authors approved of the final version.
Funding
The authors received no financial support for the research, authorship, and/or publication of this article.
Declaration of Conflicting Interests
The authors declared no potential conflicts of interest with respect to the research, authorship, and/or publication of this article.
Data Availability Statement
The secondary data utilized in this study were extracted from the publicly available data of the Chinese Longitudinal Healthy Longevity Survey (CLHLS).
Code Availability
Available on request.
Author Biographies
Appendix
Brief Introduction of Included Variables for This Current Study Mini-Mental State Examination (MMSE) Measure From CLHLS Survey aThe compiled MMSE used across CLHLS waves includes 24 items, scored from 0–30. The wording of some items varied slightly across dataset waves. bC16 is a scored variable. Scores below 7 were retained as observed, while scores above 7 were top coded at 7. Associations of Biological Factors With Cognitive Impairment in the Overall Study Sample: CLHLS 2008–2018 (n = 32,348) Note. Values are hazard ratios (HRs) with 95% confidence intervals (CIs) in parentheses, estimated from Cox multi-state models. Estimates represent transition-specific associations between biological factors and changes in cognitive status. Statistical significance is indicated as *p < 0.05, **p < 0.01, ***p < 0.001. Associations of Biological and Sociodemographic Factors With Cognitive Impairment in the Overall Study Sample: CLHLS 2008–2018 (n = 32,348) Note. Values represent transition-specific hazard ratios (HRs) with 95% confidence intervals (CIs) in parentheses, estimated using Cox multi-state models. Models included biological and sociodemographic factors. Statistical significance is indicated as *p < 0.05, **p < 0.01, ***p < 0.001. Associations of Biological, Sociodemographic, and Health Behavior/History Factors With Cognitive Impairment in the Overall Study Sample: CLHLS, 2008–2018 (n = 32,348) Note. Values represent transition-specific hazard ratios (HRs) with 95% confidence intervals (CIs) in parentheses, estimated from Cox multi-state models. Models were fully adjusted for biological, sociodemographic, and health behavior and health status history factors. Statistical significance is indicated as *p < 0.05, **p < 0.01, ***p < 0.001. Model Performance of Sequentially Adjusted Cox Multi-State Models Note. C-index, concordance index; SE, standard error; df, degrees of freedom. Model 1 included biological factors. Model 2 additionally adjusted for sociodemographic factors. Model 3 further adjusted for health behaviors and health status history.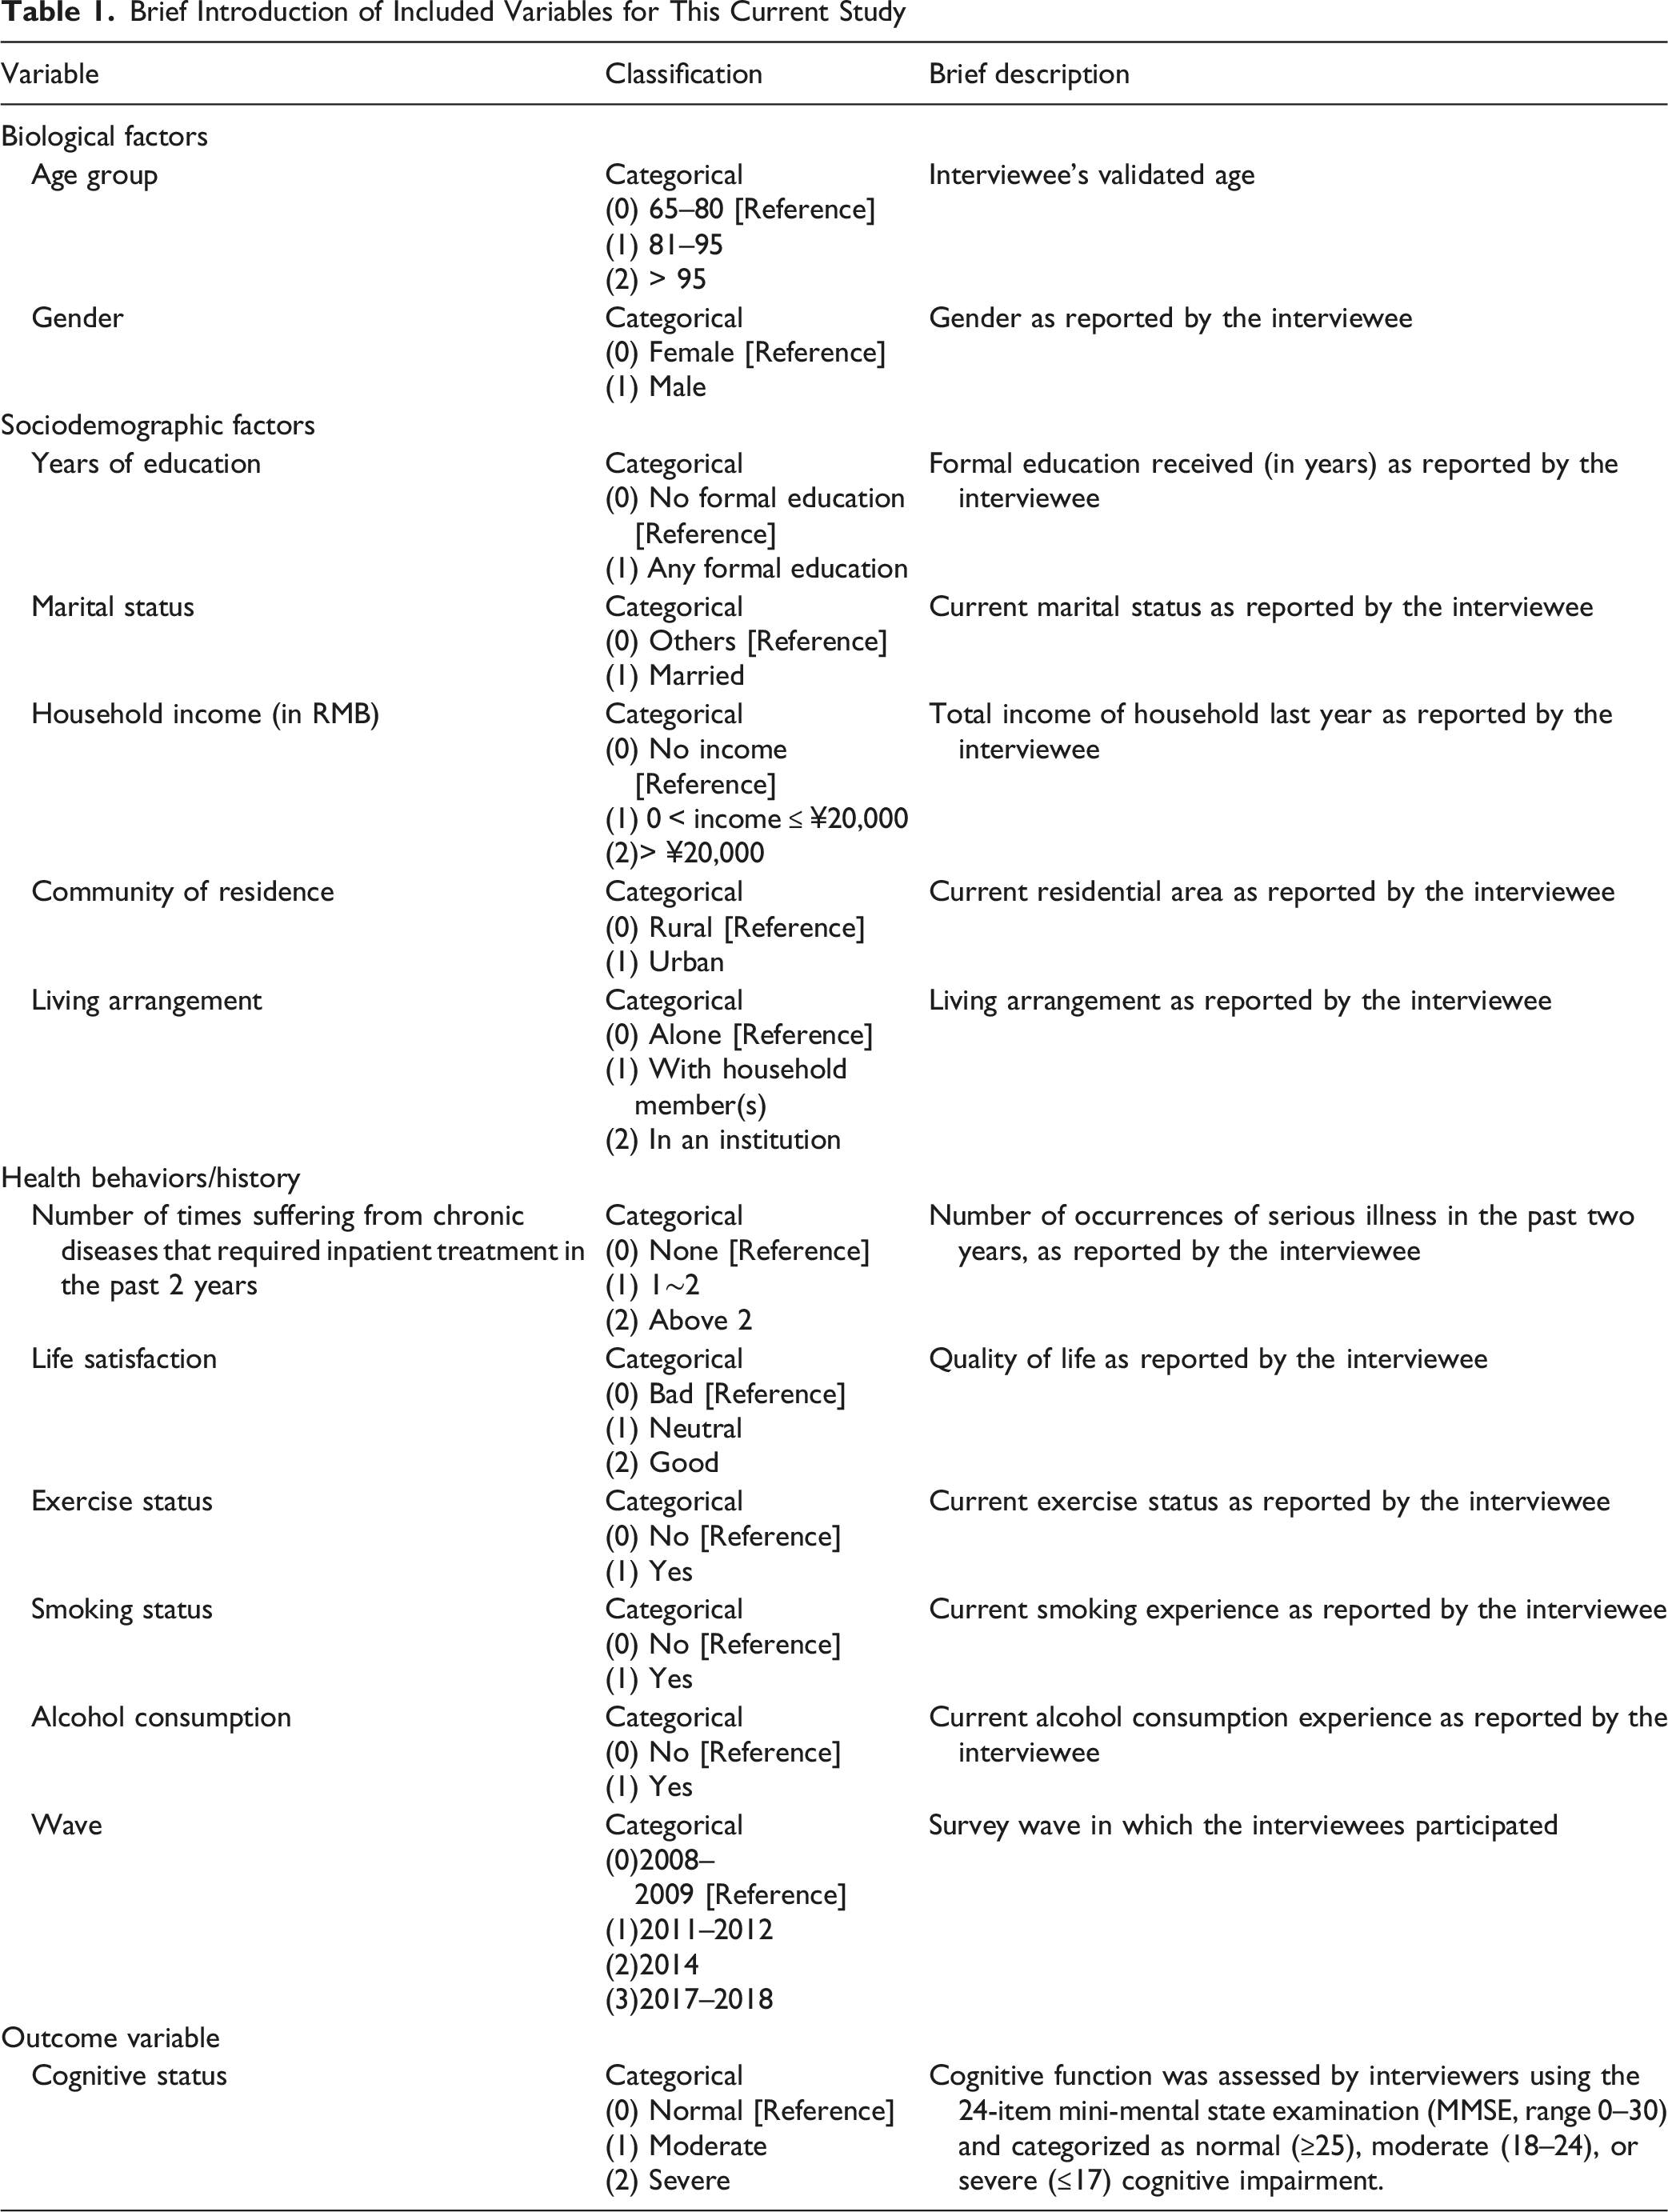
Variable
Classification
Brief description
Biological factors
Age group
Categorical
Interviewee’s validated age
(0) 65–80 [Reference]
(1) 81–95
(2) > 95
Gender
Categorical
Gender as reported by the interviewee
(0) Female [Reference]
(1) Male
Sociodemographic factors
Years of education
Categorical
Formal education received (in years) as reported by the interviewee
(0) No formal education [Reference]
(1) Any formal education
Marital status
Categorical
Current marital status as reported by the interviewee
(0) Others [Reference]
(1) Married
Household income (in RMB)
Categorical
Total income of household last year as reported by the interviewee
(0) No income [Reference]
(1) 0 < income ≤ ¥20,000
(2)> ¥20,000
Community of residence
Categorical
Current residential area as reported by the interviewee
(0) Rural [Reference]
(1) Urban
Living arrangement
Categorical
Living arrangement as reported by the interviewee
(0) Alone [Reference]
(1) With household member(s)
(2) In an institution
Health behaviors/history
Number of times suffering from chronic diseases that required inpatient treatment in the past 2 years
Categorical
Number of occurrences of serious illness in the past two years, as reported by the interviewee
(0) None [Reference]
(1) 1∼2
(2) Above 2
Life satisfaction
Categorical
Quality of life as reported by the interviewee
(0) Bad [Reference]
(1) Neutral
(2) Good
Exercise status
Categorical
Current exercise status as reported by the interviewee
(0) No [Reference]
(1) Yes
Smoking status
Categorical
Current smoking experience as reported by the interviewee
(0) No [Reference]
(1) Yes
Alcohol consumption
Categorical
Current alcohol consumption experience as reported by the interviewee
(0) No [Reference]
(1) Yes
Wave
Categorical
Survey wave in which the interviewees participated
(0)2008–2009 [Reference]
(1)2011–2012
(2)2014
(3)2017–2018
Outcome variable
Cognitive status
Categorical
Cognitive function was assessed by interviewers using the 24-item mini-mental state examination (MMSE, range 0–30) and categorized as normal (≥25), moderate (18–24), or severe (≤17) cognitive impairment.
(0) Normal [Reference]
(1) Moderate
(2) Severe
Item
a
Correct
Wrong
C1
ORIENTATION
C11
What time of day is it right now (morning, afternoon, evening)?
1
0
C12
What is the animal year of this year?
1
0
C13
What is the date of the mid-autumn festival?
1
0
C14
What is the season right now?
1
0
C15
What is the name of this county or district?
1
0
C16
b
Please name as many kinds of food as possible in 1 minute.
C2
REGISTRATION
C21A
Repeat the name of “table” at the first time
1
0
C21B
Repeat the name of “apple” at the first time
1
0
C21C
Repeat the name of “clothes” at the first time
1
0
C3
ATTENTION AND CALCULATION
C31A
$20-$3 = ?
1
0
C31B
$20-$3-$3 = ?
1
0
C31C
$20-$3-$3-$3 = ?
1
0
C31D
$20-$3-$3-$3-$3 = ?
1
0
C31E
$20-$3-$3-$3-$3-$3 = ?
1
0
C32
Draw the figure following the sample
1
0
C4
RECALL
C41A
Repeat the name of “table” a while later
1
0
C41B
Repeat the name of “apple” a while later
1
0
C41C
Repeat the name of “clothes” a while later
1
0
C5
LANGUAGE
C51A
Naming “pen”
1
0
C51B
Naming “watch”
1
0
C52
Repeat a sentence
1
0
C53A
Taking paper using right hand
1
0
C53B
Folding paper
1
0
C53C
Put paper on the floor
1
0
Cognitive status
Severe to normal
Normal to normal
Moderate to normal
Severe to moderate
Normal to moderate
Moderate to moderate
Age (in years)
65–80
81–95
0.69 (0.68, 0.7)***
0.82 (0.8, 0.84)***
0.76 (0.69, 0.83)***
2.86 (2.65, 3.08)***
2.08 (1.84, 2.34)***
1.37 (1.09, 1.72)**
Above 95
0.4 (0.38, 0.42)***
0.55 (0.5, 0.6)***
0.42 (0.35, 0.5)***
3.07 (2.82, 3.34)***
2.96 (2.52, 3.47)***
1.37 (1.06, 1.76)*
Gender
Female
Male
1.23 (1.2, 1.25)***
1.17 (1.14, 1.19)***
1.34 (1.23, 1.46)***
0.72 (0.68, 0.76)***
0.58 (0.52, 0.65)***
0.69 (0.58, 0.82)***
Cognitive status
Severe to normal
Normal to normal
Moderate to normal
Severe to moderate
Normal to moderate
Moderate to moderate
Age (in years)
65–80
81–95
0.76 (0.74, 0.77)***
0.86 (0.84, 0.88)***
0.81 (0.74, 0.89)***
2.3 (2.12, 2.5)***
1.79 (1.57, 2.03)***
1.27 (1.01, 1.6)*
Above 95
0.46 (0.44, 0.49)***
0.59 (0.54, 0.64)***
0.48 (0.4, 0.57)***
2.29 (2.09, 2.52)***
2.33 (1.95, 2.78)***
1.23 (0.94, 1.61)
Gender
Female
Male
1.09 (1.07, 1.11)***
1.08 (1.06, 1.11)***
1.2 (1.08, 1.32)***
0.94 (0.88, 1)*
0.76 (0.67, 0.86)***
0.8 (0.67, 0.96)*
Year of education (in years)
No formal education
Any formal education
1.26 (1.24, 1.29)***
1.15 (1.12, 1.18)***
1.27 (1.15, 1.4)***
0.59 (0.55, 0.64)***
0.61 (0.54, 0.69)***
0.68 (0.54, 0.85)***
Household income (in RMB)
No income
0 < income ≤ ¥20,000
1.18 (1.03, 1.35)*
0.93 (0.85, 1.03)
0.91 (0.63, 1.33)
0.79 (0.64, 0.98)*
1.92 (1.02, 3.6)*
1.05 (0.53, 2.09)
> ¥20,000
1.27 (1.11, 1.45)***
1 (0.91, 1.11)
0.94 (0.64, 1.38)
0.68 (0.54, 0.84)***
1.55 (0.82, 2.92)
1.13 (0.57, 2.24)
Marital status
Others
Married
1.12 (1.1, 1.15)***
1.09 (1.06, 1.12)***
1.14 (1.03, 1.27)*
0.78 (0.73, 0.84)***
0.78 (0.68, 0.9)***
0.94 (0.77, 1.15)
Community of residence
Rural
Urban
1.03 (1.02, 1.05)***
1.04 (1.02, 1.06)***
1.09 (1, 1.19)
0.98 (0.93, 1.04)
0.85 (0.76, 0.95)**
0.82 (0.7, 0.95)**
Living arrangement
Alone
With household member(s)
0.91 (0.88, 0.93)***
0.92 (0.89, 0.95)***
0.87 (0.77, 0.98)*
1.04 (0.97, 1.11)
1.09 (0.95, 1.26)
0.99 (0.81, 1.2)
In an institution
0.8 (0.74, 0.87)***
0.95 (0.85, 1.06)
1 (0.69, 1.45)
1.12 (0.95, 1.32)
1.34 (0.92, 1.96)
0.95 (0.51, 1.79)
Cognitive status
Severe to normal
Normal to normal
Moderate to normal
Severe to moderate
Normal to moderate
Moderate to moderate
Age (in years)
65–80
81–95
0.76 (0.75, 0.78)***
0.86 (0.84, 0.88)***
0.8 (0.73, 0.88)***
2.26 (2.08, 2.45)***
1.75 (1.54, 2)***
1.28 (1.02, 1.62)*
Above 95
0.47 (0.45, 0.49)***
0.59 (0.54, 0.64)***
0.47 (0.39, 0.56)***
2.23 (2.03, 2.45)***
2.34 (1.96, 2.8)***
1.26 (0.96, 1.65)
Gender
Female
Male
1.09 (1.07, 1.11)***
1.08 (1.05, 1.11)***
1.21 (1.09, 1.35)***
0.96 (0.9, 1.02)
0.77 (0.68, 0.88)***
0.77 (0.63, 0.93)**
Year of education (in years)
No formal education
Any formal education
1.24 (1.22, 1.27)***
1.13 (1.1, 1.16)***
1.27 (1.15, 1.4)***
0.61 (0.56, 0.65)***
0.63 (0.55, 0.72)***
0.67 (0.53, 0.84)***
Household income (in RMB)
No income
0 < income ≤ ¥20,000
1.17 (1.02, 1.34)*
0.93 (0.84, 1.02)
0.91 (0.61, 1.34)
0.8 (0.64, 0.99)*
1.94 (1.06, 3.57)*
1.07 (0.53, 2.16)
> ¥20,000
1.24 (1.08, 1.41)**
0.97 (0.89, 1.07)
0.9 (0.61, 1.34)
0.69 (0.55, 0.86)***
1.67 (0.91, 3.09)
1.16 (0.57, 2.37)
Marital status
Others
Married
1.12 (1.1, 1.15)***
1.09 (1.06, 1.12)***
1.14 (1.03, 1.27)*
0.78 (0.73, 0.84)***
0.77 (0.67, 0.89)***
0.94 (0.77, 1.14)
Community of residence
Rural
Urban
1.01 (0.99, 1.03)
1.03 (1, 1.05)*
1.09 (0.99, 1.19)
1.01 (0.95, 1.06)
0.87 (0.78, 0.97)*
0.81 (0.7, 0.94)**
Living arrangement
Alone
With household member(s)
0.9 (0.88, 0.92)***
0.92 (0.89, 0.96)***
0.86 (0.76, 0.97)*
1.03 (0.97, 1.11)
1.08 (0.94, 1.25)
0.99 (0.81, 1.21)
In an institution
0.8 (0.74, 0.87)***
0.94 (0.85, 1.05)
0.96 (0.66, 1.38)
1.14 (0.96, 1.34)
1.31 (0.9, 1.91)
0.96 (0.51, 1.81)
Smoking status
No
Yes
1 (0.98, 1.02)
1 (0.98, 1.03)
0.94 (0.83, 1.05)
0.99 (0.92, 1.08)
1.07 (0.91, 1.25)
1.13 (0.9, 1.42)
Alcohol consumption status
No
Yes
1 (0.98, 1.02)
1.01 (0.99, 1.04)
1.09 (0.98, 1.22)
0.97 (0.9, 1.05)
0.9 (0.77, 1.06)
0.95 (0.76, 1.18)
Exercise status
No
Yes
1.12 (1.1, 1.14)***
1.09 (1.07, 1.12)***
1.09 (0.99, 1.2)
0.81 (0.76, 0.86)***
0.74 (0.66, 0.84)***
1.04 (0.88, 1.23)
Number of times suffering from chronic diseases that required inpatient treatment in the past 2 years
None
1–2
0.97 (0.95, 0.99)*
0.95 (0.92, 0.98)***
0.89 (0.79, 1)
1.05 (0.98, 1.13)
1.31 (1.16, 1.48)***
1.19 (0.99, 1.43)
Above 2
0.93 (0.88, 0.99)*
0.94 (0.89, 1)
0.7 (0.51, 0.97)*
1.13 (0.96, 1.32)
1.18 (0.91, 1.52)
1.48 (1.05, 2.08)*
Life satisfaction
Bad
Neutral
1.21 (1.14, 1.27)***
1.15 (1.06, 1.25)***
1.2 (0.91, 1.58)
0.89 (0.8, 1)*
0.78 (0.63, 0.98)*
0.89 (0.64, 1.25)
Good
1.27 (1.2, 1.34)***
1.2 (1.11, 1.3)***
1.39 (1.06, 1.82)*
0.89 (0.8, 0.98)*
0.65 (0.53, 0.81)***
0.8 (0.58, 1.12)
Model 1 (Biological)
Model 2 (+Sociodemographic)
Model 3 (+Health behaviors/history)
C-index (SE)
0.713 (0.004)
0.737 (0.003)
0.744 (0.003)
Likelihood ratio test
χ2 (df)
3330.45 (18)
4042.70 (60)
4268.35 (102)
p-value
<0.001
<0.001
<0.001
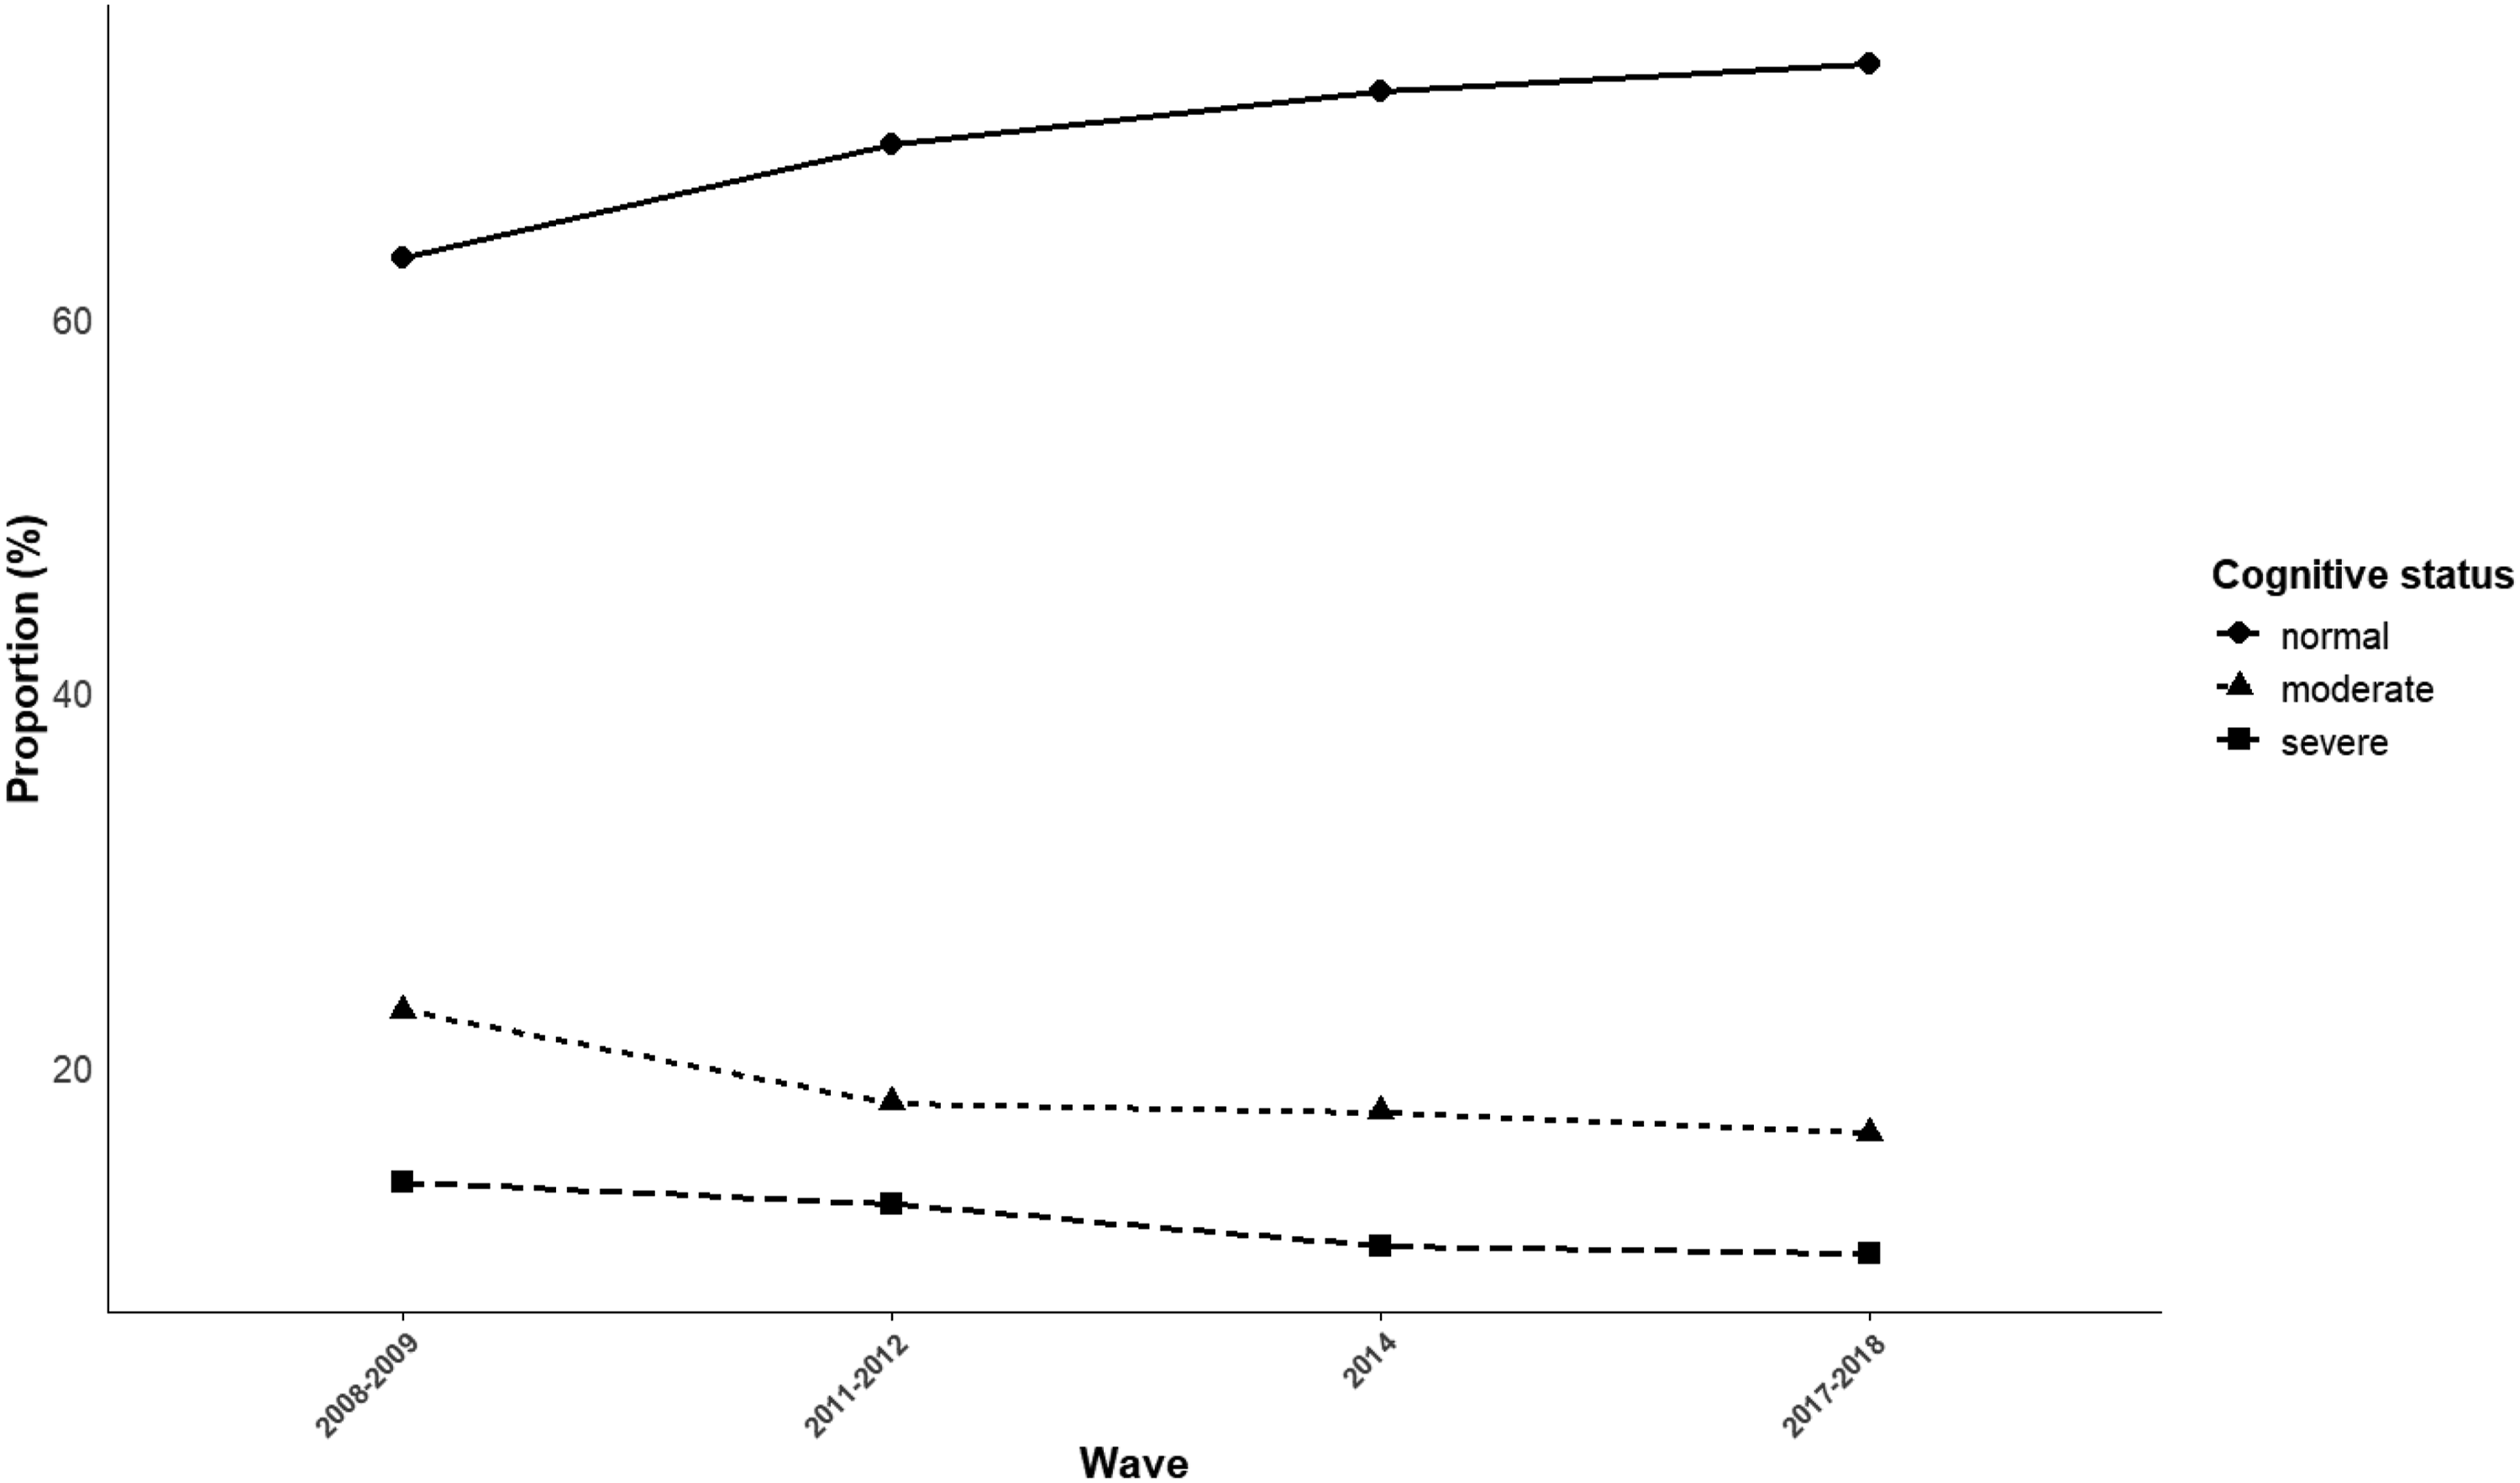
Flowchart of sample selection from Chinese Longitudinal Healthy Longevity 4 Survey waves in 2008-2018 Cognitive impairment status proportion by wave: the Chinese Longitudinal Healthy Longevity Survey, 2008–2018