
Abstract
Panel attrition in adolescent research is not merely a methodological nuisance but often reflects substantive developmental discontinuities during critical transitions. Unlike adult populations, adolescents face unique attrition risks associated with institutional changes and shifting developmental trajectories that traditional linear models often fail to capture. This study investigated the predictors of panel attrition using data from the Korean Education Longitudinal Study 2005, which covers the extensive developmental period from early adolescence to early adulthood. Random survival forests (RSF) were used to capture the complex, nonlinear trajectories of adolescent behavior obscured by traditional linear models. We found that structural instability, specifically school transfer experience, was the strongest predictor of attrition. Crucially, RSF uncovered distinct nonlinear patterns: a threshold effect for academic achievement, whereby risk was concentrated among low achievers, whereas maternal education showed a U-shaped pattern with elevated risk at both extremes. These findings highlight that attrition is associated with divergent developmental mechanisms such as academic disengagement and strategic parental gatekeeping, emphasizing the need for developmentally sensitive methodologies in longitudinal research.
Keywords
Adolescence is a period of rapid behavioral change, characterized by shifting social roles, evolving autonomy, and critical institutional transitions (Eisner et al., 2019). Panel attrition during this stage is not merely a methodological inconvenience but may instead reflect meaningful developmental processes. Behaviors that define adolescent development, such as disengaging from institutional expectations, seeking autonomy, or navigating school transitions, are often associated with departure from longitudinal studies. Therefore, understanding who drops out and when may offer substantive insights into the developmental trajectories that surveys aim to capture. Notably, panel attrition threatens the validity of longitudinal inferences by introducing systematic bias (Lugtig, 2014). In adolescent research, this is particularly critical because attrition often mirrors developmental discontinuities, such as school disengagement or family instability, which studies aim to capture.
These developmental dynamics are amplified by the structural context in which adolescents are embedded. Unlike adults, whose survey participation is primarily tied to household stability, adolescents navigate their development within school systems, which serve as developmental contexts and institutional anchors for longitudinal tracking. Transitions between school levels, such as the shift from middle to high school, represent periods of heightened “institutional vulnerability” during which the risk of losing contact peaks (Malschinger et al., 2023). Critically, attrition during these transitions is not uniform but rather may reflect divergent developmental pathways. Students who experience academic disengagement may withdraw from both school activities and survey participation, whereas those from high-socioeconomic status (SES) backgrounds, often indexed by high maternal education, may leave because of intense educational pressure. In these families, survey participation may be perceived as a distraction from academic pursuits, leading to parental gatekeeping (Fitzgerald et al., 1998; Hill & Willis, 2001). Consequently, attrition patterns in adolescent panels likely mirror the complex, nonlinear nature of behavioral development.
Despite these complexities, previous research has relied predominantly on traditional logistic regression models to predict attrition (e.g., Behr et al., 2005; Eisner et al., 2019; Malschinger et al., 2023; Saiepour et al., 2019). While valuable for identifying average effects, these linear models assume monotonic relationships between predictors and attrition risk. This assumption may not hold for adolescent panels, for which theoretical considerations suggest nonlinear dynamics: both academic disengagement at the lower end of the achievement and SES spectrum and parental gatekeeping at the higher end may elevate attrition risk, potentially producing nonmonotonic patterns such as threshold effects or U-shaped relationships that linear models cannot detect, thereby obscuring the heterogeneity of developmental trajectories within the sample.
Recent methodological work that applied machine learning to general population panels has revealed such nonlinear patterns, including threshold effects and nonmonotonic risk profiles, which traditional regression approaches would obscure (Jankowsky & Schroeders, 2022; Rübsamen et al., 2017). While attrition has been extensively studied in general population panels and youth cohorts that focused on behavioral outcomes (Eisner et al., 2019; Lugtig, 2014; Malschinger et al., 2023), critical questions remain unanswered in educational longitudinal studies. First, the relative importance of various predictors, including individual characteristics, family background, and structural factors, such as school transfer, has not been systematically examined. Second, it remains unclear whether key predictors exhibit nonlinear relationships with attrition risk, potentially revealing differential dropout mechanisms across the developmental spectrum. Third, without understanding these nonlinear patterns, insight is lacking regarding how different developmental profiles relate to longitudinal study participation. Such knowledge is essential for both interpreting existing findings and maintaining representative samples.
To address these gaps, this study employed random survival forests (RSF; Ishwaran et al., 2008), a nonparametric machine learning approach embedded within a survival analysis framework. While logistic regression remains a standard approach for attrition analysis, RSF offers distinct advantages across three critical dimensions relevant to adolescent panel data. First, regarding the outcome type, logistic regression typically treats attrition as a static binary outcome (dropout vs. retention). In contrast, RSF utilizes a time-to-event framework (survival analysis) that accounts for right-censoring, allowing researchers to model when attrition risk peaks across developmental stages. Second, concerning variable selection, standard logistic regression models can become unstable when the number of predictors is large or multicollinear. RSF, however, effectively handles high-dimensional data through its random subspace method, making it ideal for exploratory analyses with a comprehensive set of variables. Third, regarding functional form, RSF is nonparametric and automatically detects complex nonlinear patterns—such as threshold effects or interactions—without the a priori specification required in linear models. Given these capabilities, RSF is particularly advantageous for uncovering the complex developmental patterns hypothesized in this study. Using data from the Korean Education Longitudinal Study 2005 (KELS 2005), which tracks students from middle school to early adulthood, this study addressed the following research questions:
Which individual and structural factors are the strongest predictors of panel attrition during the critical educational transition from early adolescence to early adulthood? (RQ1)
Do key developmental indicators, such as academic achievement and parental SES, exhibit nonlinear relationships with attrition risk, indicating differential dropout mechanisms for distinct developmental subgroups? (RQ2)
What distinct “attrition typologies” emerge from the nonlinear interactions among predictors, and how can these profiles inform developmentally tailored retention strategies? (RQ3)
By answering these questions, we aim to provide a more nuanced understanding of attrition dynamics in adolescent panels and offer practical guidelines for improving panel retention.
Theoretical Background
Dynamic Nature of Attrition in Adolescent Panels
In educational research, attrition is particularly important because it often mirrors the developmental disadvantages under investigation such as low achievement or minority status (Ingels et al., 1998). Building on this foundation, recent studies have demonstrated that attrition is not merely a static respondent characteristic, but rather a dynamic process that unfolds across developmental stages. Malschinger et al. (2023) analyzed a school-to-work transition panel, showing that attrition risk fluctuates systematically across institutional transitions, with dropout clustering at predictable vulnerability points rather than occurring uniformly over time. Similarly, Eisner et al. (2019) found that attrition in youth panels followed distinct temporal patterns linked to participants’ changing life circumstances. This dynamic perspective draws on Lugtig’s (2014) influential typology, which categorized respondents into “loyal stayers,” “fast attriters,” and “lurkers,” demonstrating that dropout is often the culmination of a gradual disengagement process rather than an abrupt event.
For adolescent panels specifically, this dynamic process is heavily influenced by “institutional anchors” such as schools. Adolescents are typically recruited for research through these institutions, and their continued participation is often contingent on remaining within the system. Consequently, educational transitions, such as the shift from middle school to high school, represent periods of heightened “institutional vulnerability,” during which the risk of sample loss spikes significantly due to the severance of these formal ties.
This phenomenon has been consistently observed in educational systems characterized by rigorous academic tracking. For instance, Choi (2022) identified distinct latent classes of panel nonresponse in the KELS 2005 data, classifying nonresponders into “after middle school dropout,” “after high school dropout,” and “continuous participation” groups. This classification suggests that attrition is not uniform over time, but rather clusters around specific institutional transition points. Similarly, Kim and Jung (2015) found that attrition during school transitions was not random but instead was systematically linked to students’ academic trajectories and parental expectations. Thus, attrition during these phases reflects a broader discontinuity in developmental and institutional contexts, requiring focus on structural transitions as key predictors.
Predictors of Attrition: Sociodemographics, Educational Pressure, and Institutional Factors
Predictors of attrition often overlap with key markers of adolescent behavioral development, suggesting that dropout patterns may illuminate divergent developmental trajectories. Previous research has identified a wide range of predictors of attrition, although these findings are often complex and occasionally contradictory. Traditionally, low SES and minority background have consistently been linked to higher attrition rates. Eisner et al. (2019) found that socially disadvantaged groups were significantly more likely to drop out of youth panels, often because of lower social integration or language barriers. Similarly, behavioral risk factors serve as strong predictors; students who exhibit academic disengagement or behavioral noncompliance are likely to disengage from longitudinal monitoring. In the Korean context, Kim and Jung (2012) demonstrated that early “item nonresponse”—a subtle form of noncompliant behavior—was a significant precursor to later unit nonresponse (dropout), while Choi (2022) identified academic nonconformity as a direct predictor of early attrition.
However, attrition is not a problem exclusive to disadvantaged individuals. High-SES individuals are also prone to attrition, a phenomenon often explained by the high opportunity cost of participation. Maternal education often serves as a robust proxy for household SES and educational climate in the context of adolescent education. High-SES parents, particularly mothers who manage their children’s education, may exert protective gatekeeping in environments characterized by high educational competition. In such contexts, activities unrelated to academic achievement, including longitudinal surveys, may be viewed as distractions and discouraged. Fitzgerald et al. (1998) note that attrition rates could be elevated among high-income families because of the higher value placed on time. This duality suggests that the relationship between key developmental indicators and attrition may be nonlinear: achievement may show a threshold effect whereby risk is concentrated among low performers, whereas maternal education may exhibit a U-shaped pattern with elevated risk at both extremes, such that both academic struggle and intense academic prioritization are linked to disengagement from the panel.
In longitudinal educational studies, attrition patterns often cluster around institutional transitions. An analysis of major US educational panels, including NELS:88, revealed that students who transferred schools were significantly more likely to be lost to follow-up, with mobility-based attrition rates varying substantially by grade level and student characteristics (Rickles et al., 2018). Similarly, the transition from school-based to individual tracking, a common feature of educational panels following students beyond compulsory schooling, has been identified as a critical vulnerability point (Malschinger et al., 2023).
Methods
Participants and Procedure
This study used data from the KELS 2005, a nationally representative prospective cohort study. The KELS 2005 initially sampled 6,908 seventh-grade students in 2005. The participants were tracked annually (Waves 1–8) and biennially (Waves 9–12) as they transitioned into early adulthood.
The analytical sample consisted of 6,822 adolescents who completed the baseline student survey. Table 1 presents the number of participants remaining across the 12 waves, illustrating how the analytical sample gradually declined because of attrition. This dataset is particularly suitable for analyzing attrition dynamics because it spans critical developmental transitions: the shift from middle to high school (Waves 3–4) and the transition from high school to post-secondary education or the labor market (Waves 6–7). Consistent with the findings from other youth panels, the survey mode shifted from school-based administration (Waves 1–6) to individual tracking mechanisms in later waves, a structural change known to exacerbate attrition risks due to the loss of institutional anchors.
Panel Attrition Status by Wave.
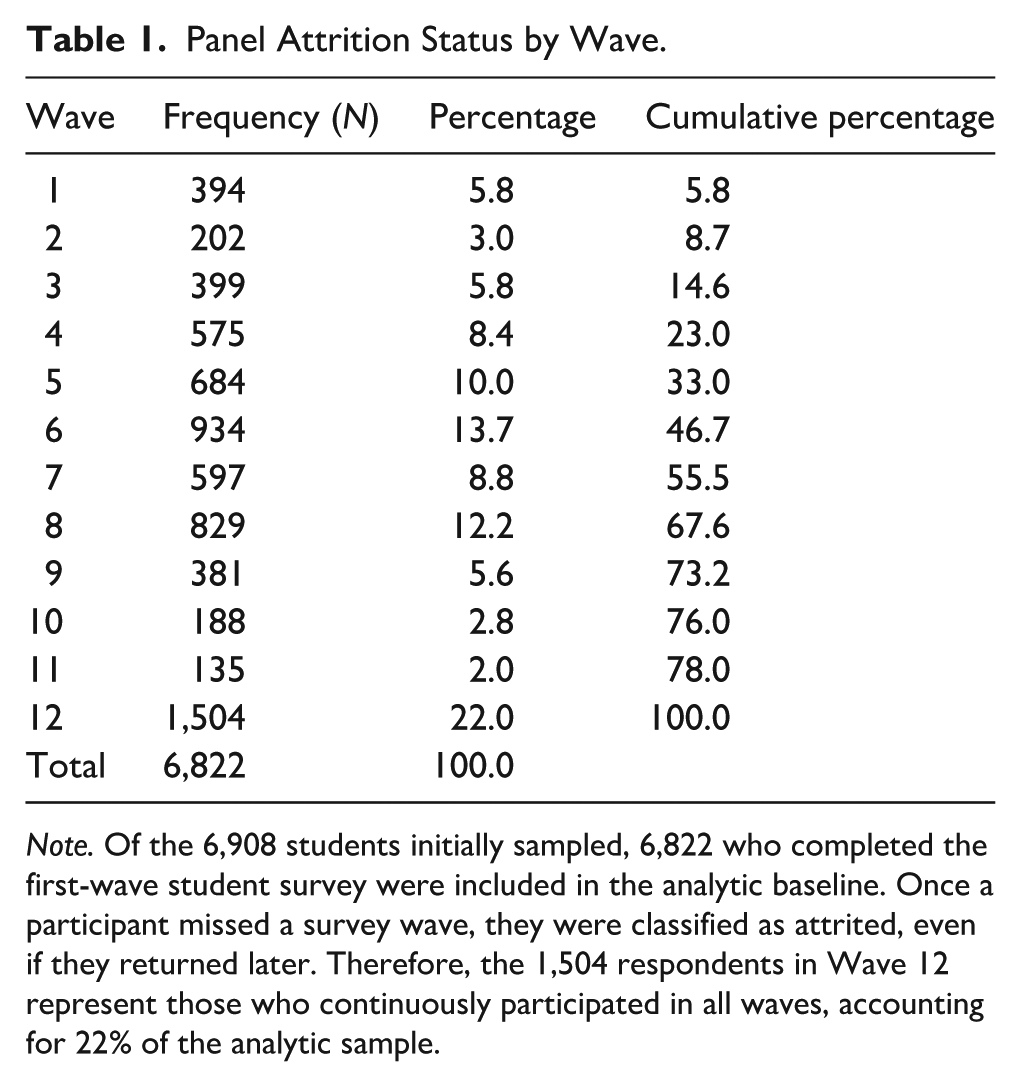
Note. Of the 6,908 students initially sampled, 6,822 who completed the first-wave student survey were included in the analytic baseline. Once a participant missed a survey wave, they were classified as attrited, even if they returned later. Therefore, the 1,504 respondents in Wave 12 represent those who continuously participated in all waves, accounting for 22% of the analytic sample.
Measures
Outcome Variable
Attrition was defined as the “survival time” (measured in survey waves) until the first instance of nonresponse. While attrition processes can be fluid, involving temporary dropouts or “churning,” this study focused on the risk of initial disengagement to identify early warning signs of dropout. Participants were censored if they maintained their participation throughout all 12 waves. By the final wave, approximately 78% of the baseline sample had experienced at least one instance of nonresponse, providing sufficient event data for survival analysis.
Predictors
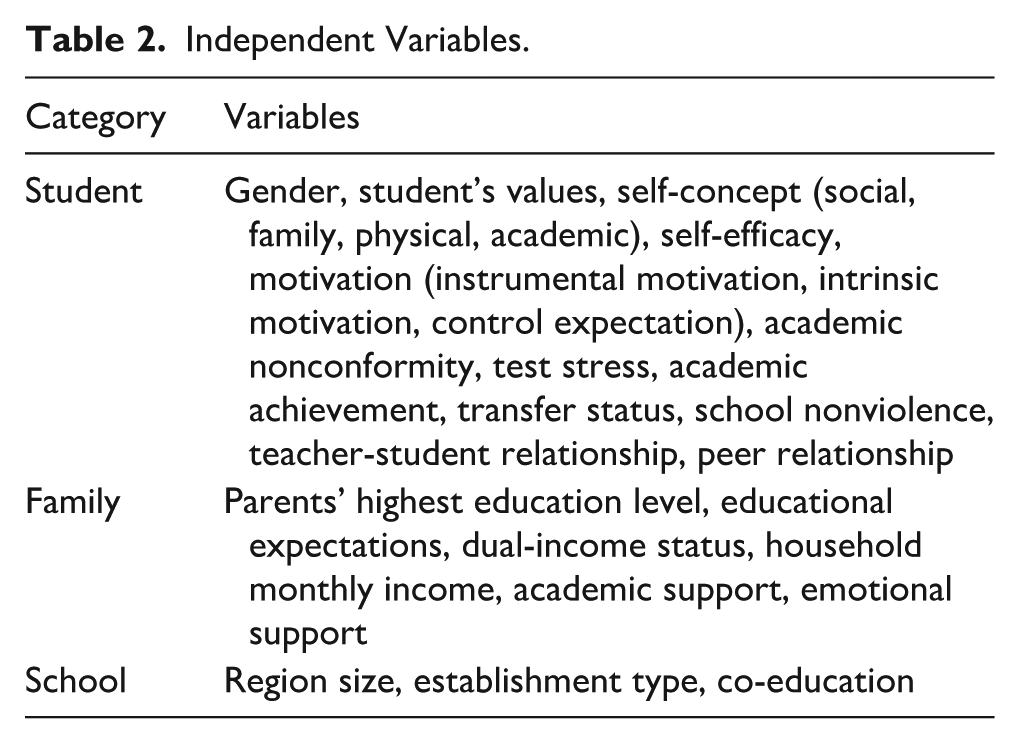
To comprehensively capture the multidimensional nature of adolescent development, we utilized a comprehensive set of 161 predictors measured in middle school. Variable selection was guided by Bronfenbrenner’s ecological systems theory (Bronfenbrenner, 2000) and a systematic review of previous attrition research (e.g., Eisner et al., 2019; Kim & Jung, 2012). This combined approach ensured that predictors were theoretically relevant and empirically grounded. We categorized the predictors into three domains:
Individual Factors (Microsystem): Including cognitive outcomes and psychological attributes. Consistent with previous findings on behavioral disengagement, we specifically included “paradata-proxies,” such as unexcused absences and homework incompletion, which serve as early warning signs of attrition (Kim & Jung, 2012; Rübsamen et al., 2017).
Family Context (Microsystem): Including SES, parental support, and educational expectations, which have been consistently linked to attrition in prior studies (Fitzgerald et al., 1998).
School and Institutional Factors (Mesosystem/Exosystem): Including school region and institutional transitions (e.g., school transfer), reflecting the structural vulnerabilities identified in educational panel research (Malschinger et al., 2023).
This theoretical and methodological framing allows the RSF model to explore complex interactions between individual behavioral markers and broader environmental contexts (see Table 2 for a comprehensive list).
Independent Variables.
Analytical Strategy: RSF
To predict attrition risk, we employed RSF, a nonparametric machine learning ensemble method developed by Ishwaran et al. (2008). While traditional models such as logistic regression rely on strict assumptions of linearity, Jankowsky and Schroeders (2022) demonstrated that machine learning approaches offer superior capabilities for handling complex, nonlinear data structures and identifying variable importance without restrictive assumptions, even if gains in predictive accuracy are marginal.
RSF analysis was conducted using the randomForestSRC package in R (Ishwaran et al., 2008). To ensure model validity with the wave-structured, discrete-time nature of the KELS data, we specified a log-rank splitting rule (splitrule = “logrank”), which maximizes the log-rank test statistic at each node and estimates terminal node survival functions using the Nelson-Aalen estimator. This approach does not invoke the proportional hazards assumption and is appropriate for discrete survival data with tied event times. Hyperparameters were optimized via a systematic grid search using 5-fold cross-validation across 72 combinations of the number of trees (ntree ∈ {500, 1,000, 1,500}), minimum node size (nodesize ∈ {3, 5, 10, 20}), number of candidate variables per split (mtry ∈ {12, 54, 81}), and splitting rule (logrank, bs.gradient). The optimal configuration—ntree = 1,500, nodesize = 20, and mtry = 12 with the log-rank splitting rule—was selected based on the highest mean cross-validated concordance index (C-index = 0.622, SD = .006) and used for all subsequent analyses. The analytical procedure involved two key steps:
1. Variable Selection: We identified the most influential predictors using variable importance (VIMP) and minimal depth (MD). VIMP quantifies the increase in prediction error when a variable is randomly permuted, whereas MD measures how close a variable is to the root of the tree, indicating its role in the early partitioning of the data. Using both metrics ensures a robust selection of predictors. Variables were retained for further interpretation if they ranked within the top 15 on both MD and VIMP simultaneously, representing approximately the top 10% of all 161 predictors.
2. Visualization of Nonlinear Effects: To interpret the black-box nature of machine learning, we utilized partial dependence plots (PDP) and cumulative hazard functions (CHF). PDPs visualize the marginal predictive relationship between predictors and attrition risk to identify nonlinear patterns (e.g., thresholds, U-shapes), whereas CHFs illustrate how attrition risk accumulates over time across different groups.
Results
Model Performance
The final RSF model was selected based on the highest mean cross-validated C-index (0.622, SD = .006) achieved during hyperparameter optimization. The model’s out-of-bag (OOB) C-index, which uses observations excluded from each tree as an internal hold-out set, was 0.612 in a sample of 6,822 students with 5,318 events. The close agreement between these two values confirms model stability and the absence of overfitting. The C-index serves as a global measure of model discrimination, estimating the probability that, between two randomly selected individuals, the one who experienced the event earlier had a higher predicted risk (Harrell et al., 1996). A value of 0.5 represents a theoretical baseline equivalent to random prediction; thus, an OOB C-index of 0.612 indicates meaningful discriminative power beyond chance, successfully capturing the relative order of attrition risk amid the complexity of adolescent developmental data.
While logistic regression is the most common analytical approach in attrition research, we selected a discrete-time hazard model (DTHM)—a logistic regression fitted on a person-period dataset—as the empirical benchmark, as this approach is specifically designed for discrete-time survival data such as the wave-structured KELS dataset. The DTHM yielded a C-index of 0.625 (SE = .005), which is numerically comparable to both the RSF cross-validated and OOB C-indices. This pattern is consistent with Jankowsky and Schroeders (2022), who similarly reported marginal differences in predictive accuracy between machine learning and standard regression approaches. Critically, however, the DTHM assumes log-linear relationships between predictors and the hazard, which would have obscured the nonlinear patterns—specifically, the threshold effect for academic achievement and the U-shaped pattern for maternal education—that constitute the primary contribution of this study.
Key Predictors of Panel Attrition
Table 3 summarizes the 12 variables ranked within the top 15 for both MD (lower values indicate earlier, more central splits) and VIMP. Student transfer status emerged as the most influential predictor across both metrics (MD Rank 1; VIMP Rank 1), with a VIMP value (0.082) substantially larger than that of all other predictors. This was followed by Grade 7 Korean achievement scores (MD Rank 2; VIMP Rank 2) and teacher-rated homework completion (MD Rank 4; VIMP Rank 3). All three core academic achievement measures—Korean, mathematics, and English scores—appeared within the top 5 in MD rankings, underscoring the central role of early academic performance. Behavioral engagement indicators also featured prominently: teacher-rated homework completion (MD Rank 4; VIMP Rank 3), learning-related noncompliance (unexcused absences; MD Rank 10; VIMP Rank 4), teacher-reported absences (MD Rank 7; VIMP Rank 13), tardiness (MD Rank 9; VIMP Rank 15), and in-class attention (MD Rank 13; VIMP Rank 12) collectively highlight that early disengagement behaviors are strong early warning signals of attrition. Among family background variables, household income (MD Rank 8; VIMP Rank 11) and mother’s highest education level (MD Rank 12; VIMP Rank 6) both appeared in the upper range of both metrics. Intended high school type also ranked consistently across both metrics (MD Rank 6; VIMP Rank 10), indicating that future educational plans carry meaningful predictive relevance. Together, these findings indicate that structural instability, academic performance, behavioral disengagement, and family socioeconomic background jointly contribute to panel attrition risk.
Summary of Predictor Importance: Minimal Depth (MD) and Variable Importance (VIMP).
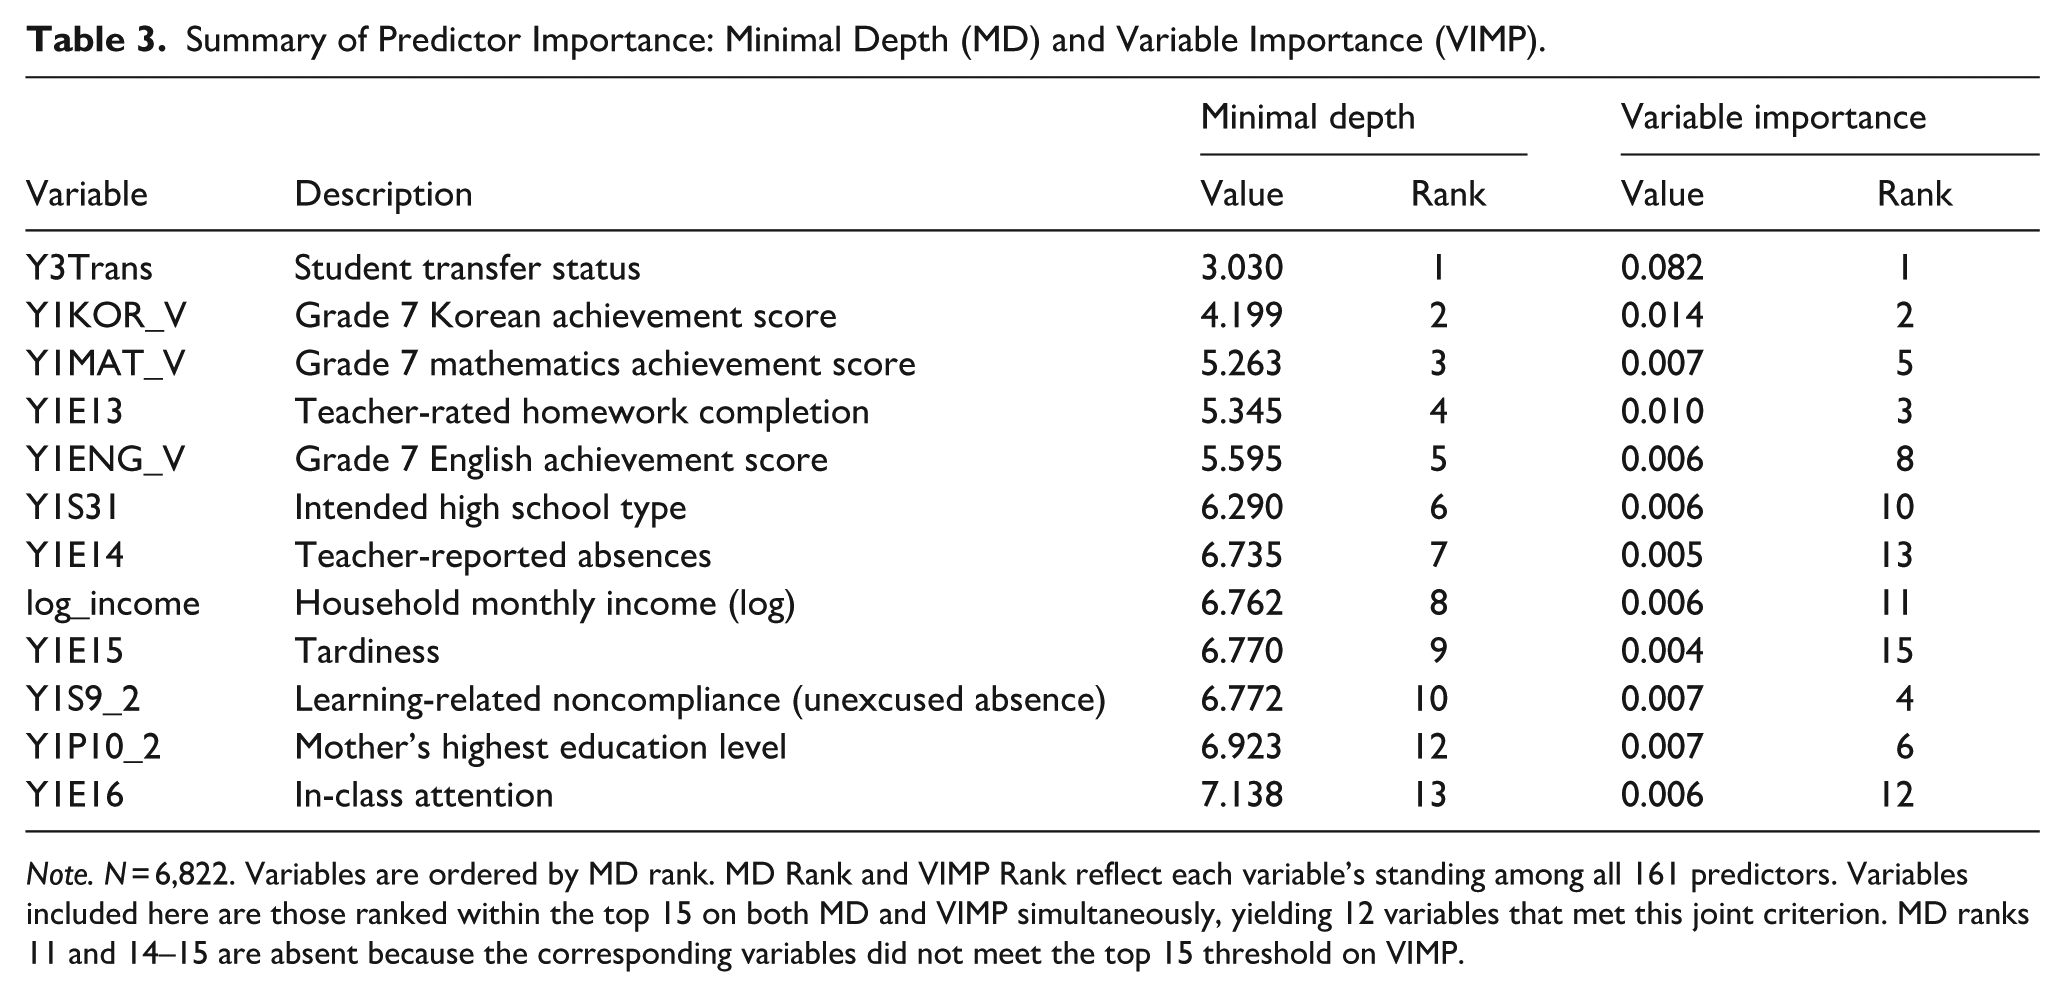
Note. N = 6,822. Variables are ordered by MD rank. MD Rank and VIMP Rank reflect each variable’s standing among all 161 predictors. Variables included here are those ranked within the top 15 on both MD and VIMP simultaneously, yielding 12 variables that met this joint criterion. MD ranks 11 and 14–15 are absent because the corresponding variables did not meet the top 15 threshold on VIMP.
Visualizing Nonlinear Attrition Dynamics: Partial Dependence Plots and Cumulative Hazard Functions
Having identified the most influential predictors through the MD and VIMP rankings, we next examined how these variables shaped panel attrition risk over time using PDPs and CHF curves. Before interpreting the specific findings, it is essential to clarify the distinct roles and selection criteria for these visualizations.
In the PDPs, the solid line represents the estimated marginal predictive relationship between a specific predictor and attrition risk, and the red dashed lines indicate variability bands (confidence intervals). For continuous predictors, the red dots represent partial dependence estimates at evenly spaced grid points; their density along the curve reflects the concentration of observed data, and interpretations in regions with sparse dots and wide variability bands should be made with caution. While PDPs effectively visualize the shape of risk (e.g., thresholds) for both continuous and categorical variables, CHF curves are specifically used to illustrate how risk accumulates over time between groups. However, to ensure visual clarity, we restricted the CHF presentation to a binary school transfer variable. Applying CHF to continuous variables is less intuitive, and for categorical variables with numerous levels (e.g., mother’s education), the resulting plots often suffer from visual clutter that obscures distinct trajectories. Thus, the CHF is presented solely for school transfer to provide a clear, paradigmatic example of how structural changes lead to divergent risk accumulation.
First, regarding school transfer experience (Y3Trans), both the PDP and CHF curves indicate a clear and persistent association with panel attrition risk. The PDP showed that students with transfer experience had a substantially higher predicted risk of attrition than those without transfer experience over the entire observation period (Figure 1). The CHF results corroborated this pattern, revealing that the cumulative risk in the transfer group accumulated more rapidly, with the largest divergence occurring between Time Points 3 and 6 (Figure 2).
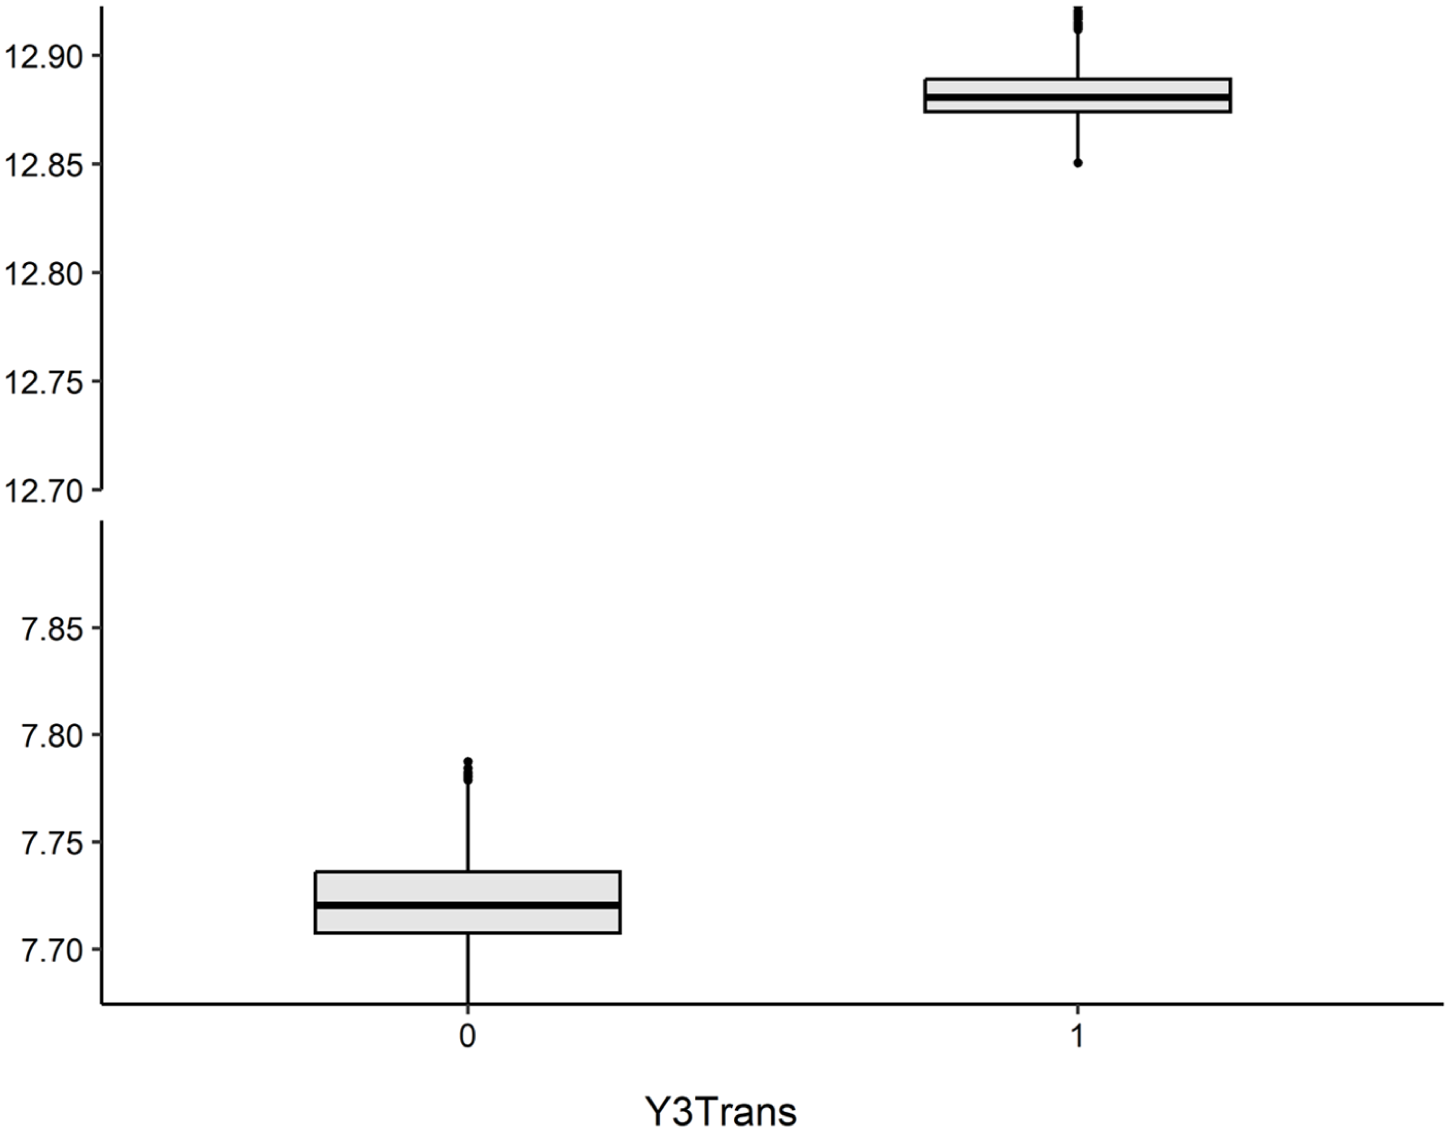
Partial Dependence Plot: Student Transfer Status.
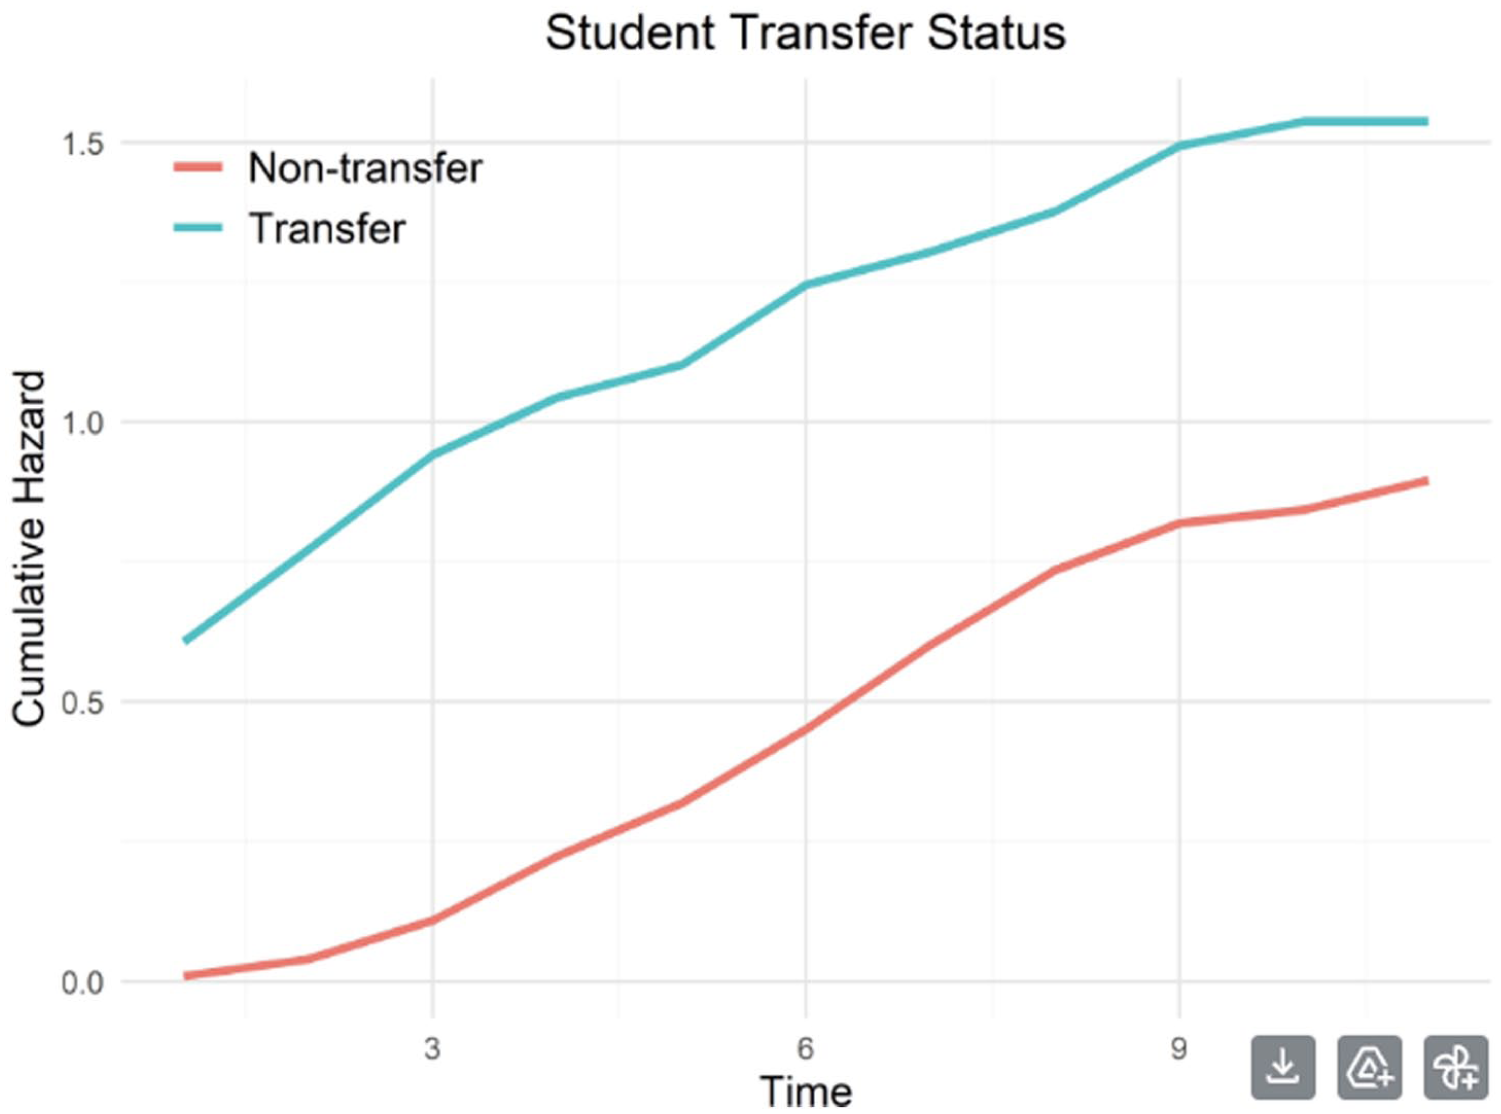
Cumulative Hazard Function: Student Transfer Status.
Second, all three core academic achievement measures—Korean, mathematics, and English scores—consistently exhibited a nonlinear threshold pattern. The PDP curves indicated that attrition risk rose gradually in the lower score ranges up to the low 200s, after which it increased steeply until approximately 280 to 320 points. Beyond this threshold, the slope flattened sharply, suggesting that further score improvements had minimal association with attrition risk. The “saturation point” of risk appeared around 280 to 300 points for Korean scores (Figure 3), at a comparable range for mathematics scores (Figure 4), and slightly higher at 300 to 320 points for English scores (Figure 5). This convergent pattern across all three achievement domains reinforces the interpretation of a threshold effect, whereby attrition risk is concentrated among low achievers rather than distributed linearly across the achievement spectrum.
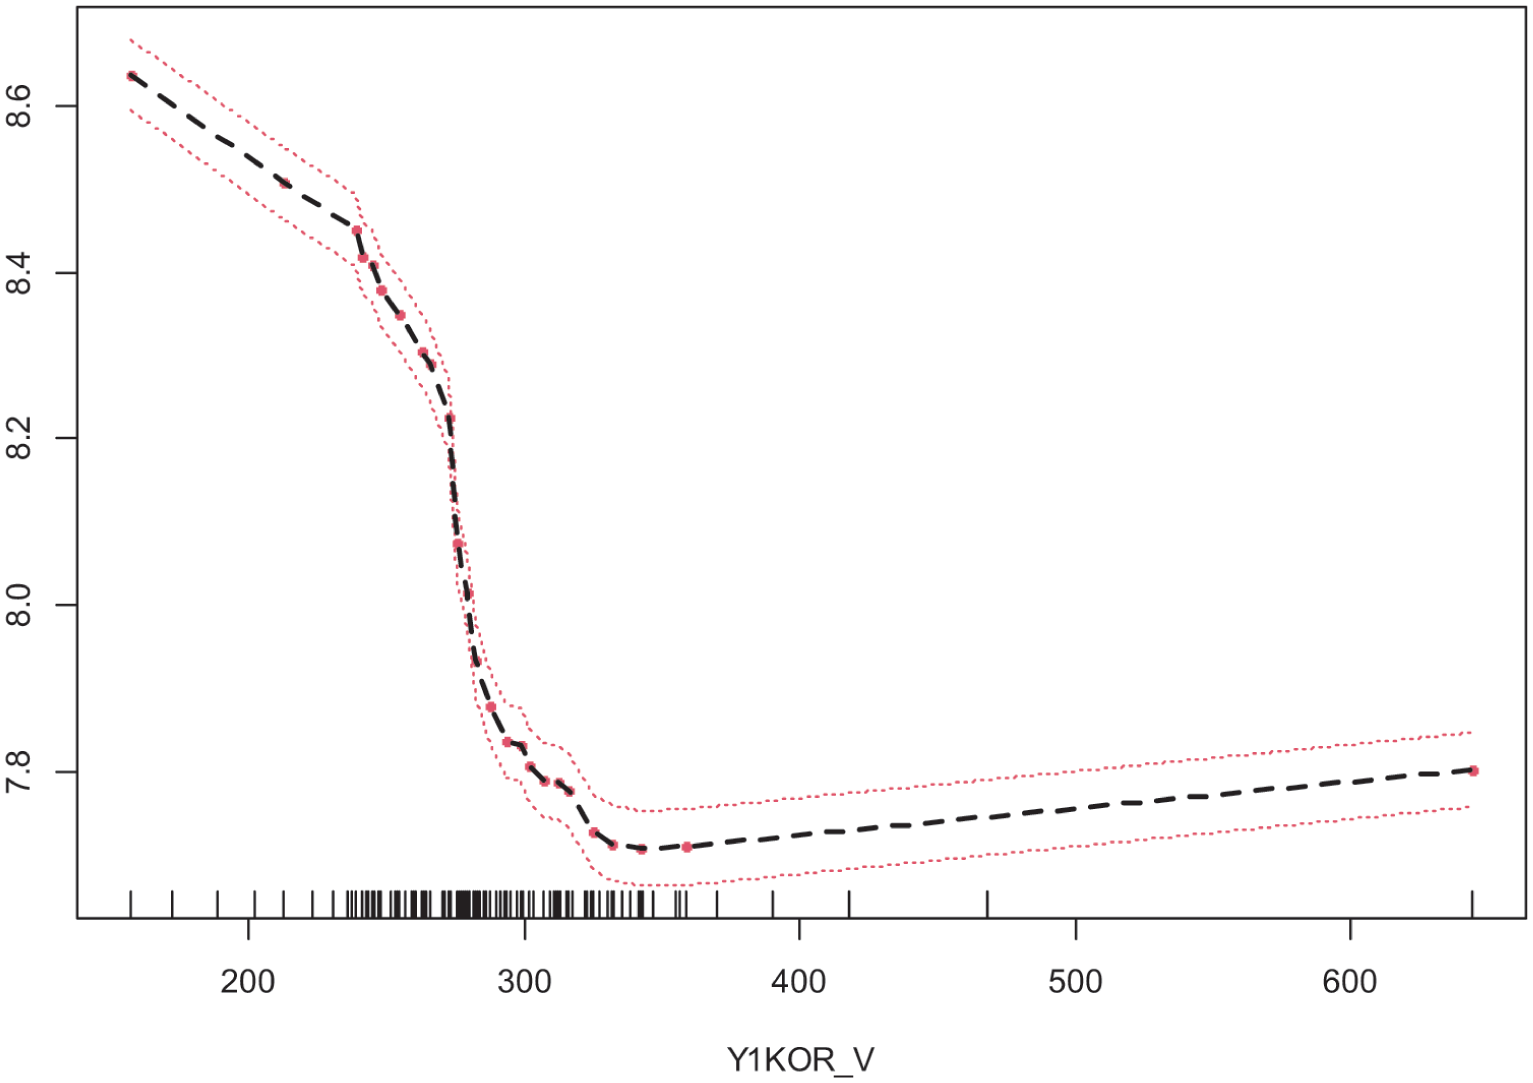
Partial Dependence Plot: Grade 7 Korean Achievement Score.
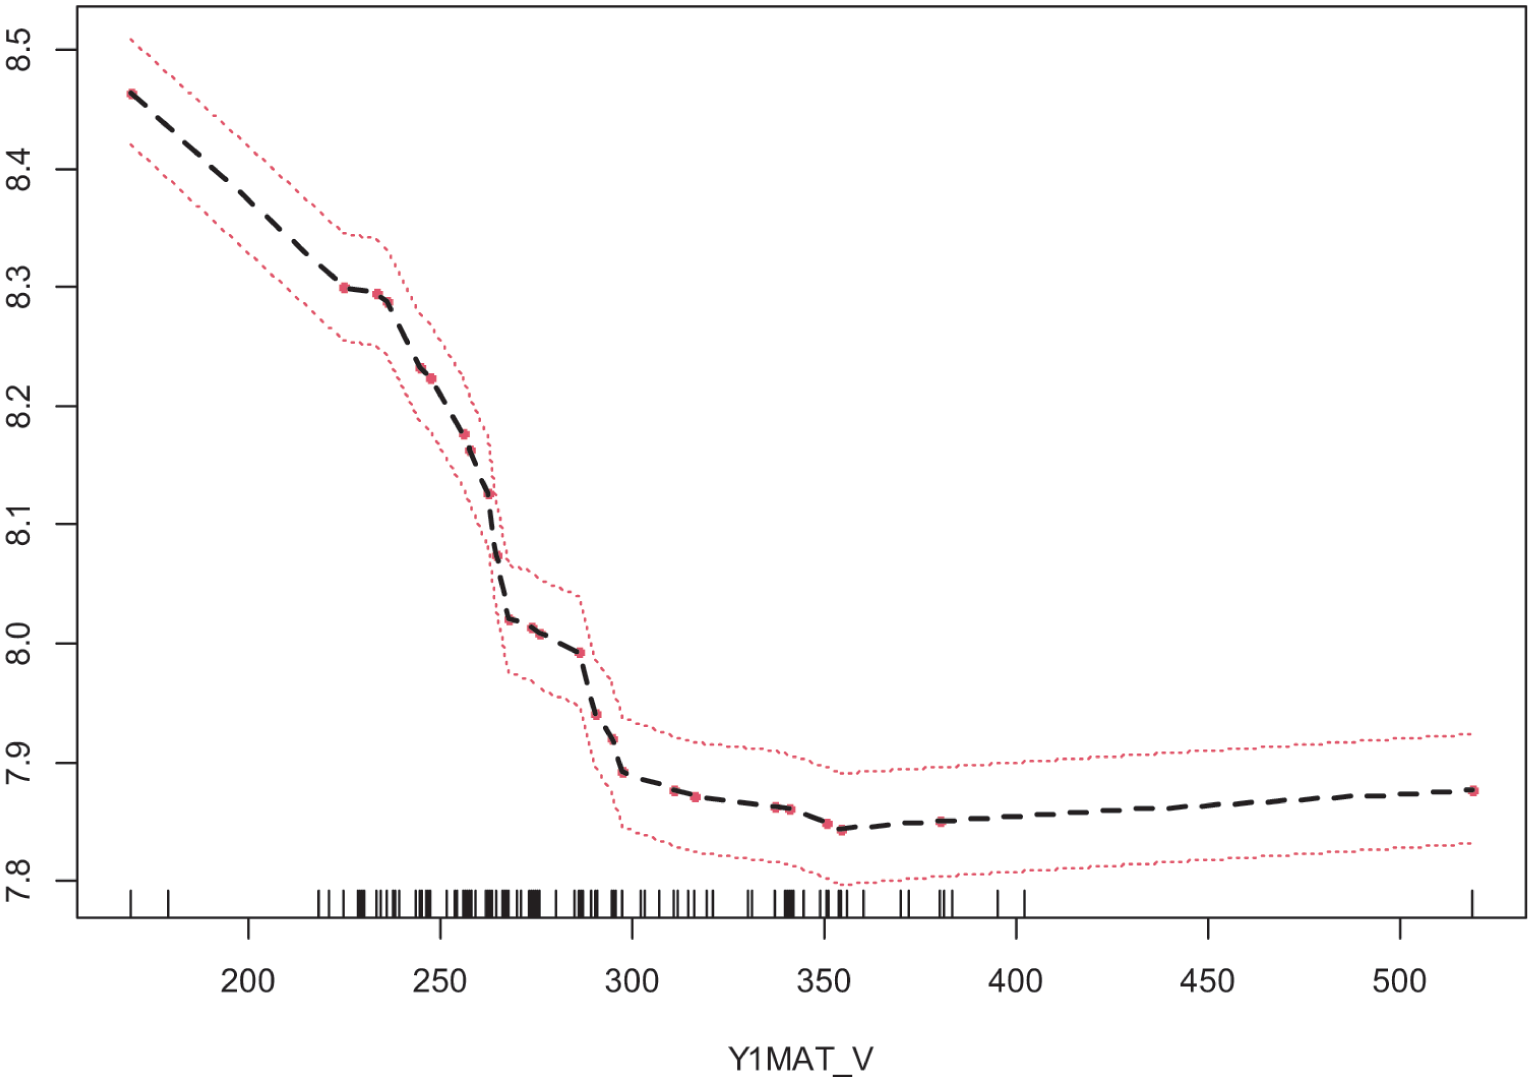
Partial Dependence Plot: Grade 7 Mathematics Achievement Score.
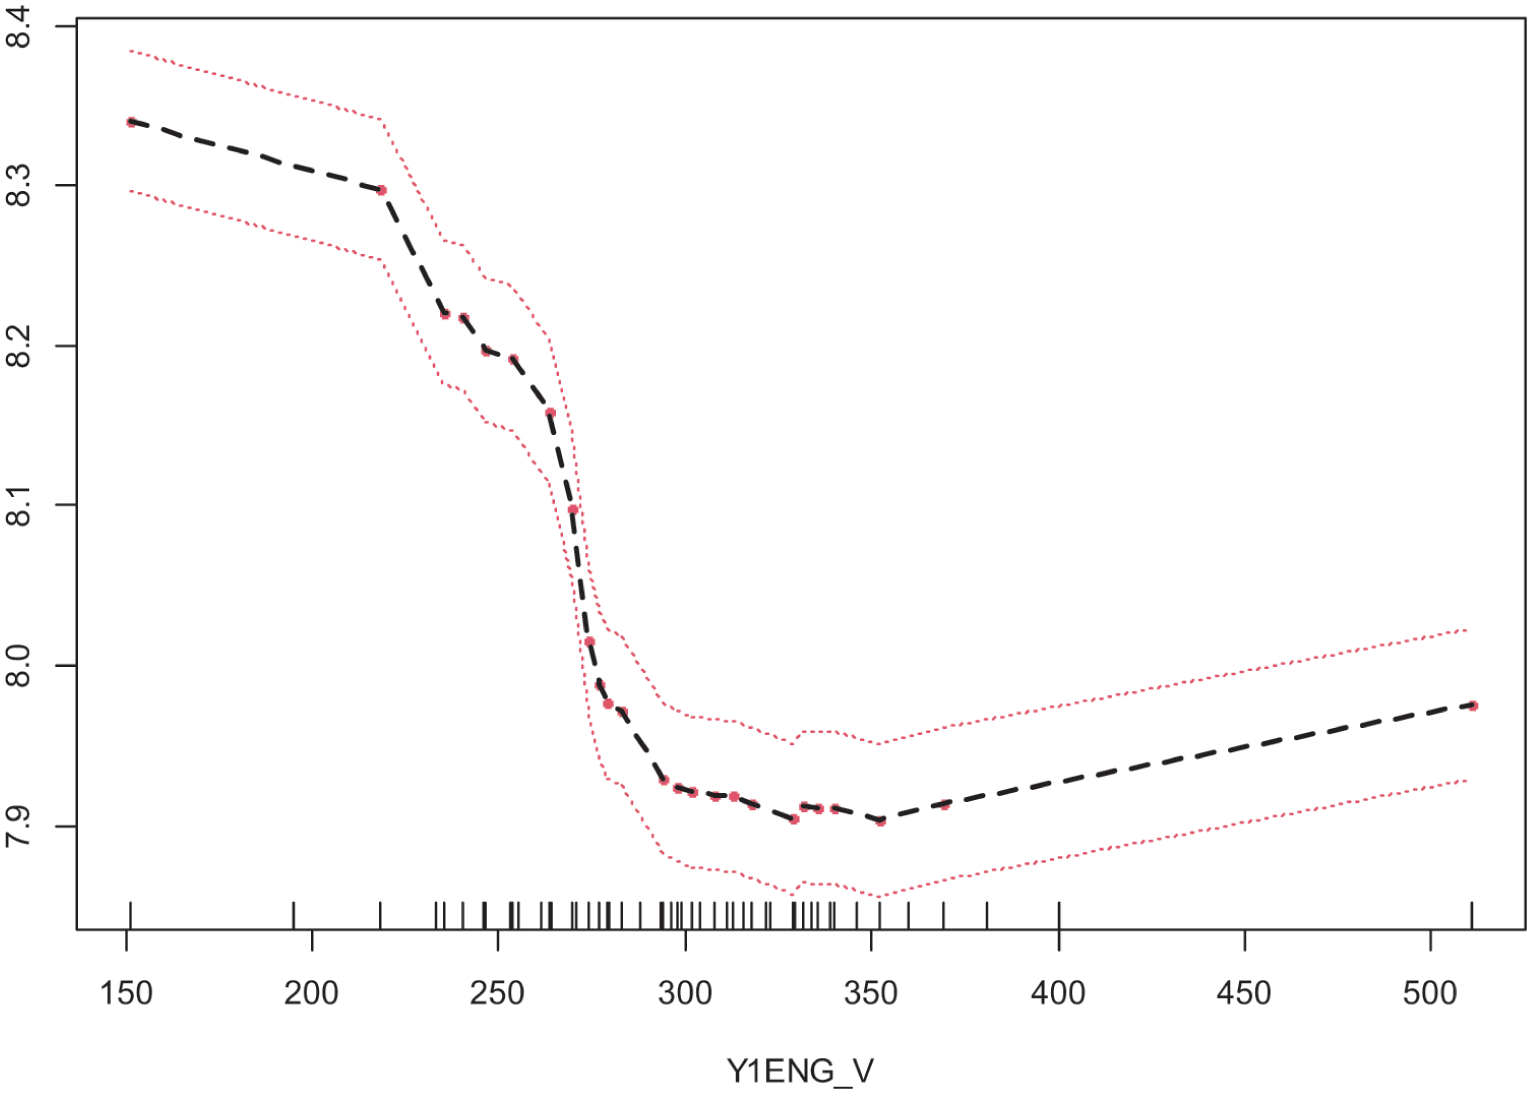
Partial Dependence Plot: Grade 7 English Achievement Score.
Third, teacher-rated homework completion (Y1E13) demonstrated a quasi-monotonic inverse relationship with attrition risk; as completion frequency increased, risk declined (Figure 6). However, the “no assigned homework” option (Category 6) displayed a risk level comparable to those with low completion rates. As noted, the sparse data in Categories 6 and 7 (indicated by the lack of rug marks) warrant caution, as these spikes may reflect sample size artifacts rather than substantive group differences.
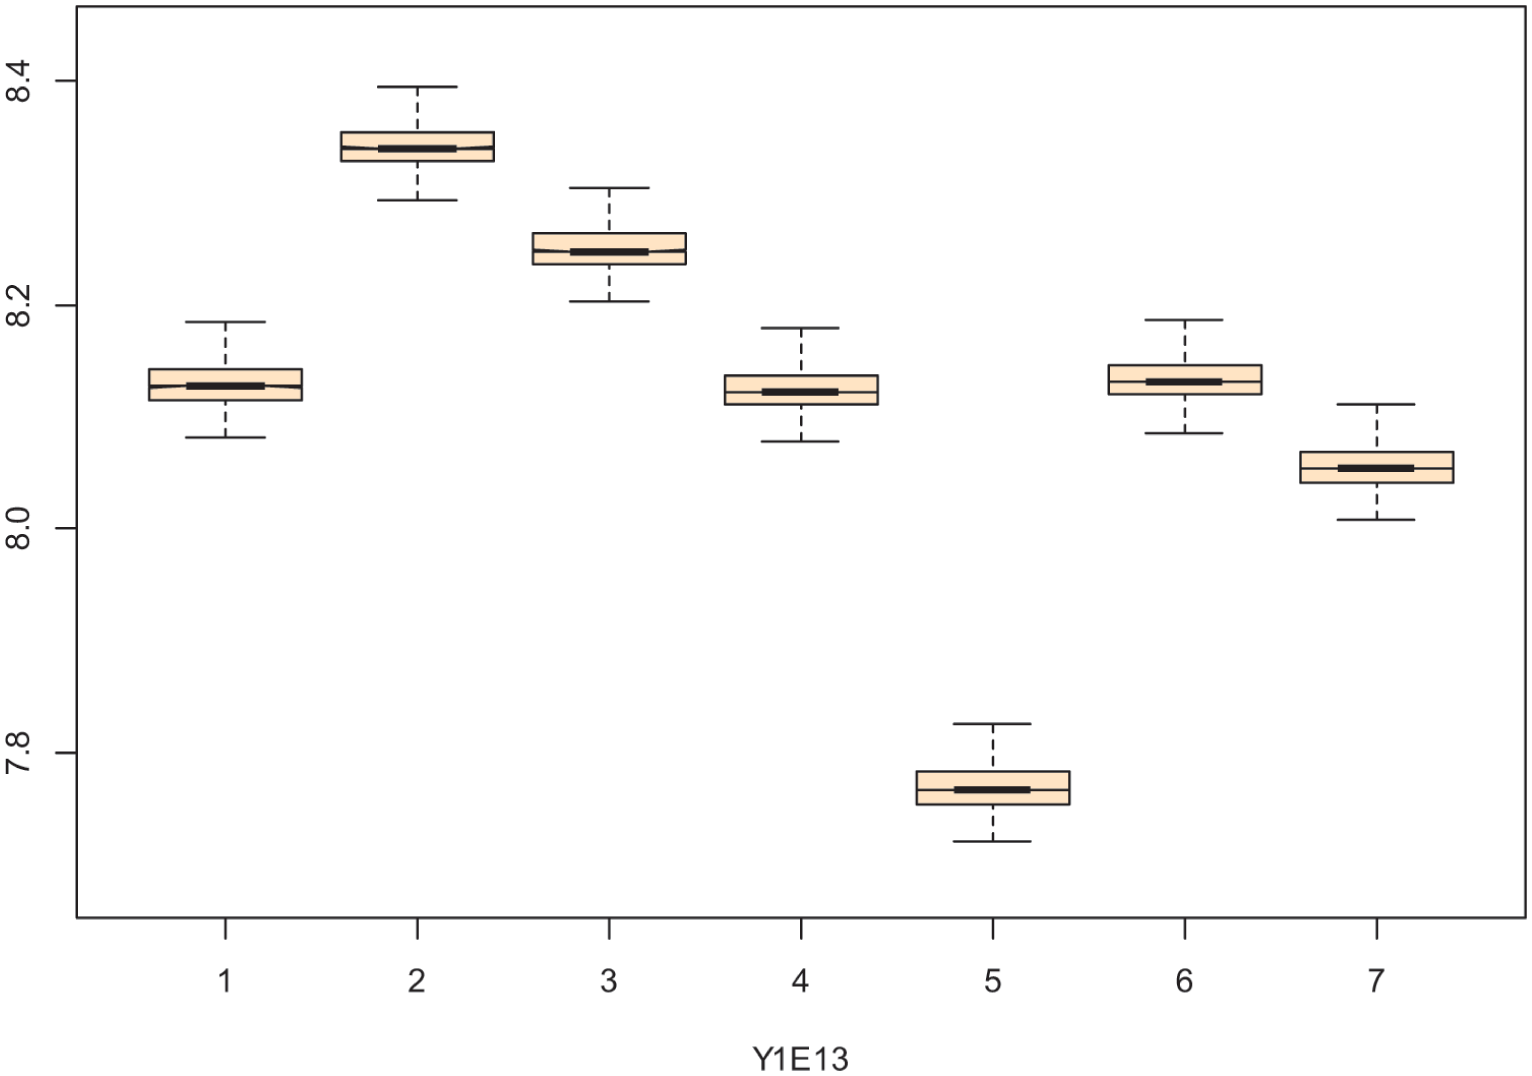
Partial Dependence Plot: Teacher-Rated Homework Completion.
Fourth, regarding the intended high school type (Y1S31), the differences among categories were pronounced. Students planning to attend general high school (Category 1) consistently showed the lowest attrition risk, whereas those planning to study abroad (Category 6), a group prone to structural removal from the sampling frame, demonstrated markedly elevated risk throughout (Figure 7).
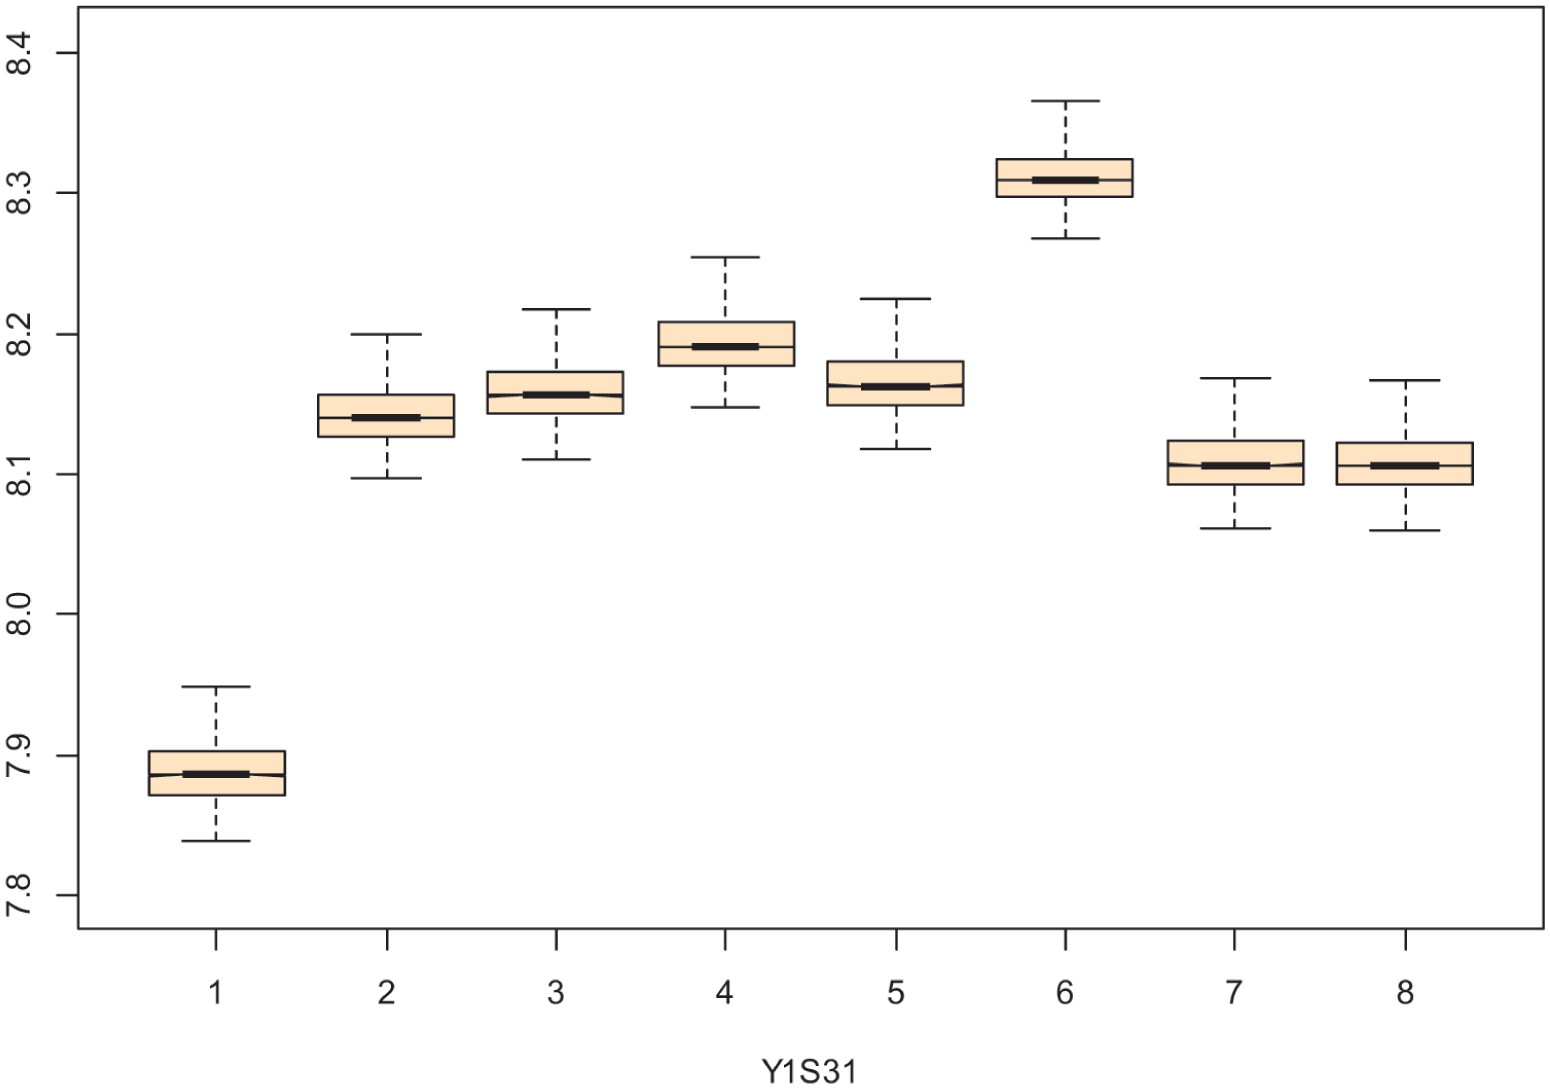
Partial Dependence Plot: Intended High School Type.
Fifth, the remaining behavioral engagement and socioeconomic variables revealed further distinct patterns. For teacher-reported absences (Y1E14), the PDP indicated a clear positive association across Categories 1 to 4, whereas Categories 5 and 6 showed a sharp decline (Figure 8); however, the widening variability bands in these regions suggest this reversal is likely attributable to data sparsity rather than a genuine reduction in risk. Household monthly income (log_income) exhibited a U-shaped pattern: attrition risk was elevated among low-income families (below approximately 1.5 million KRW per month), declined to a minimum in the middle-income range (approximately 2.5–4.0 million KRW per month), and then rose markedly among high-income families (Figure 9). Tardiness (Y1E15) showed a monotonic positive association with attrition risk, increasing consistently from “never” to “always” (Figure 10). In contrast, unexcused absences (Y1S9_2) exhibited a particularly robust pattern: risk was already elevated even at low frequencies and increased steadily thereafter (Figure 11), with variability bands remaining relatively consistent in width across levels, reinforcing the stability of this behavioral risk factor.
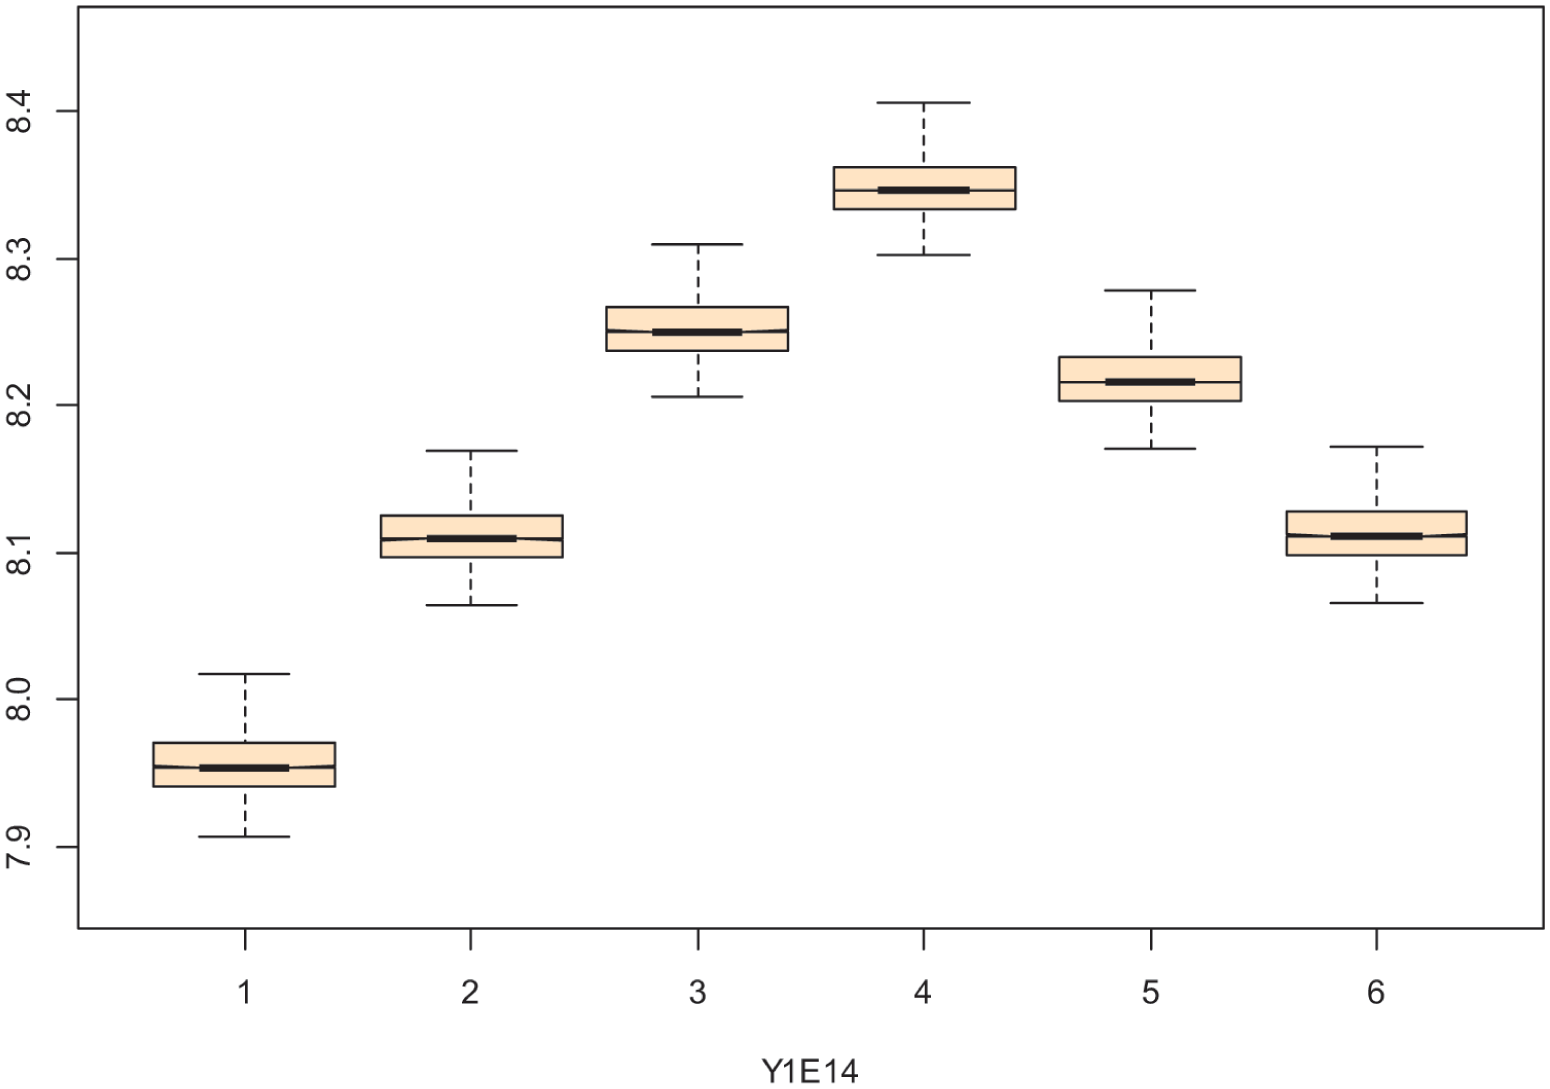
Partial Dependence Plot: Teacher-Reported Absences.
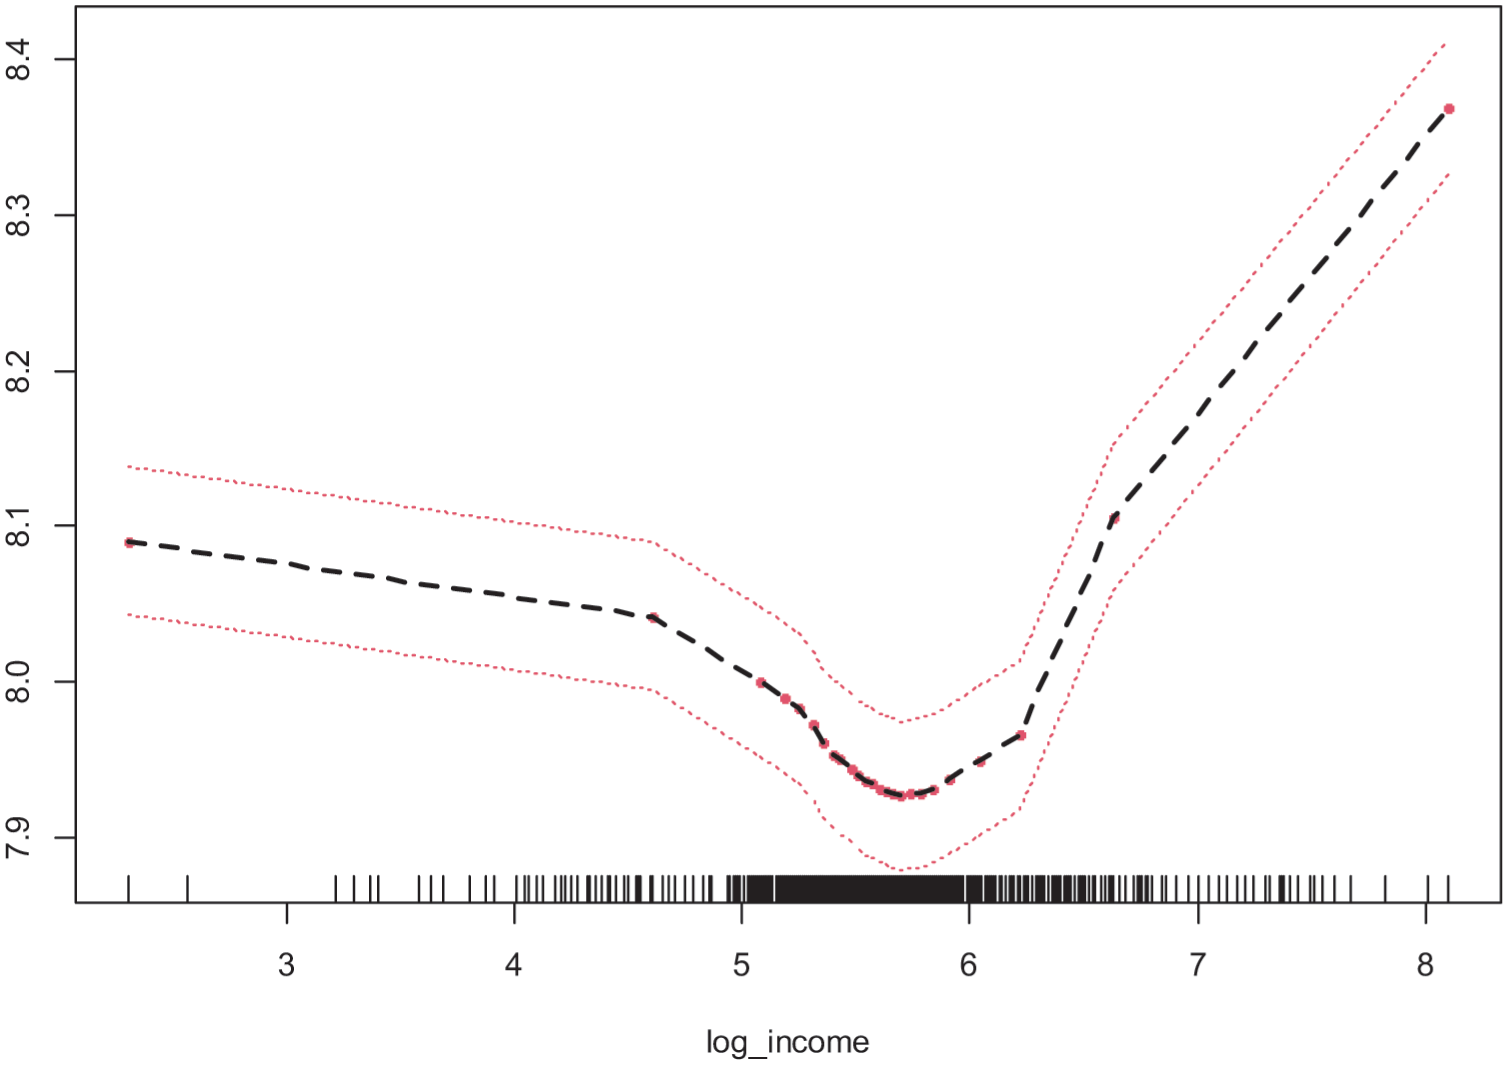
Partial Dependence Plot: Household Monthly Income (Log-Transformed).
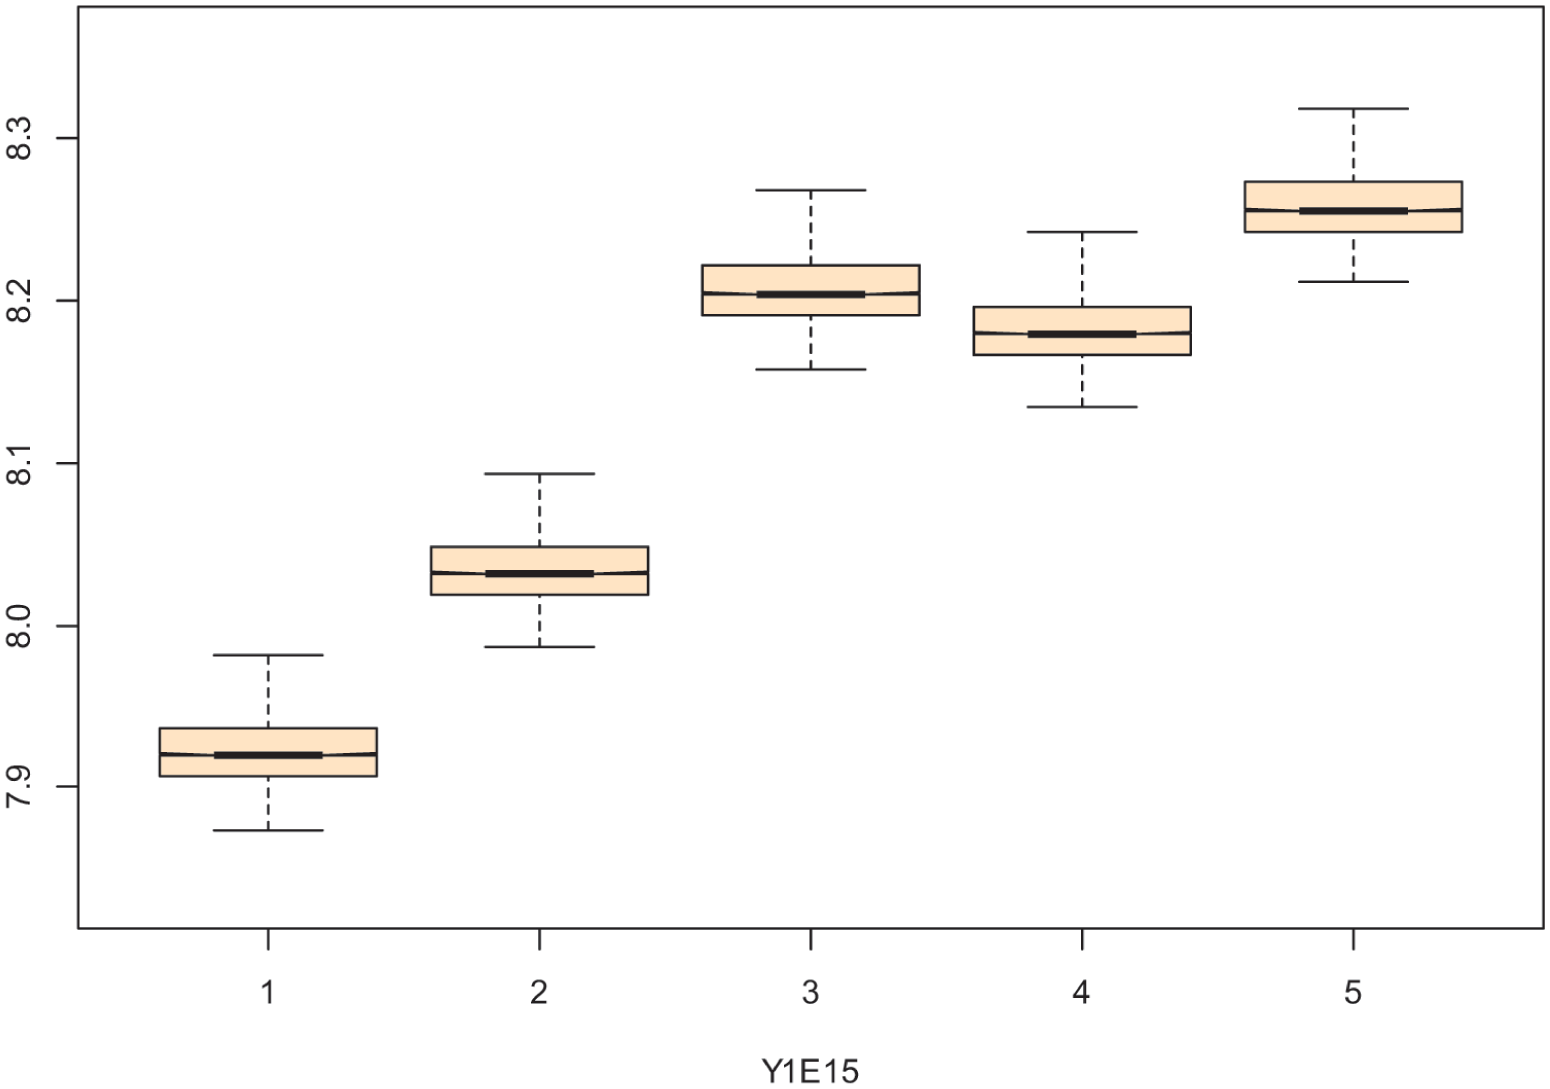
Partial Dependence Plot: Tardiness.
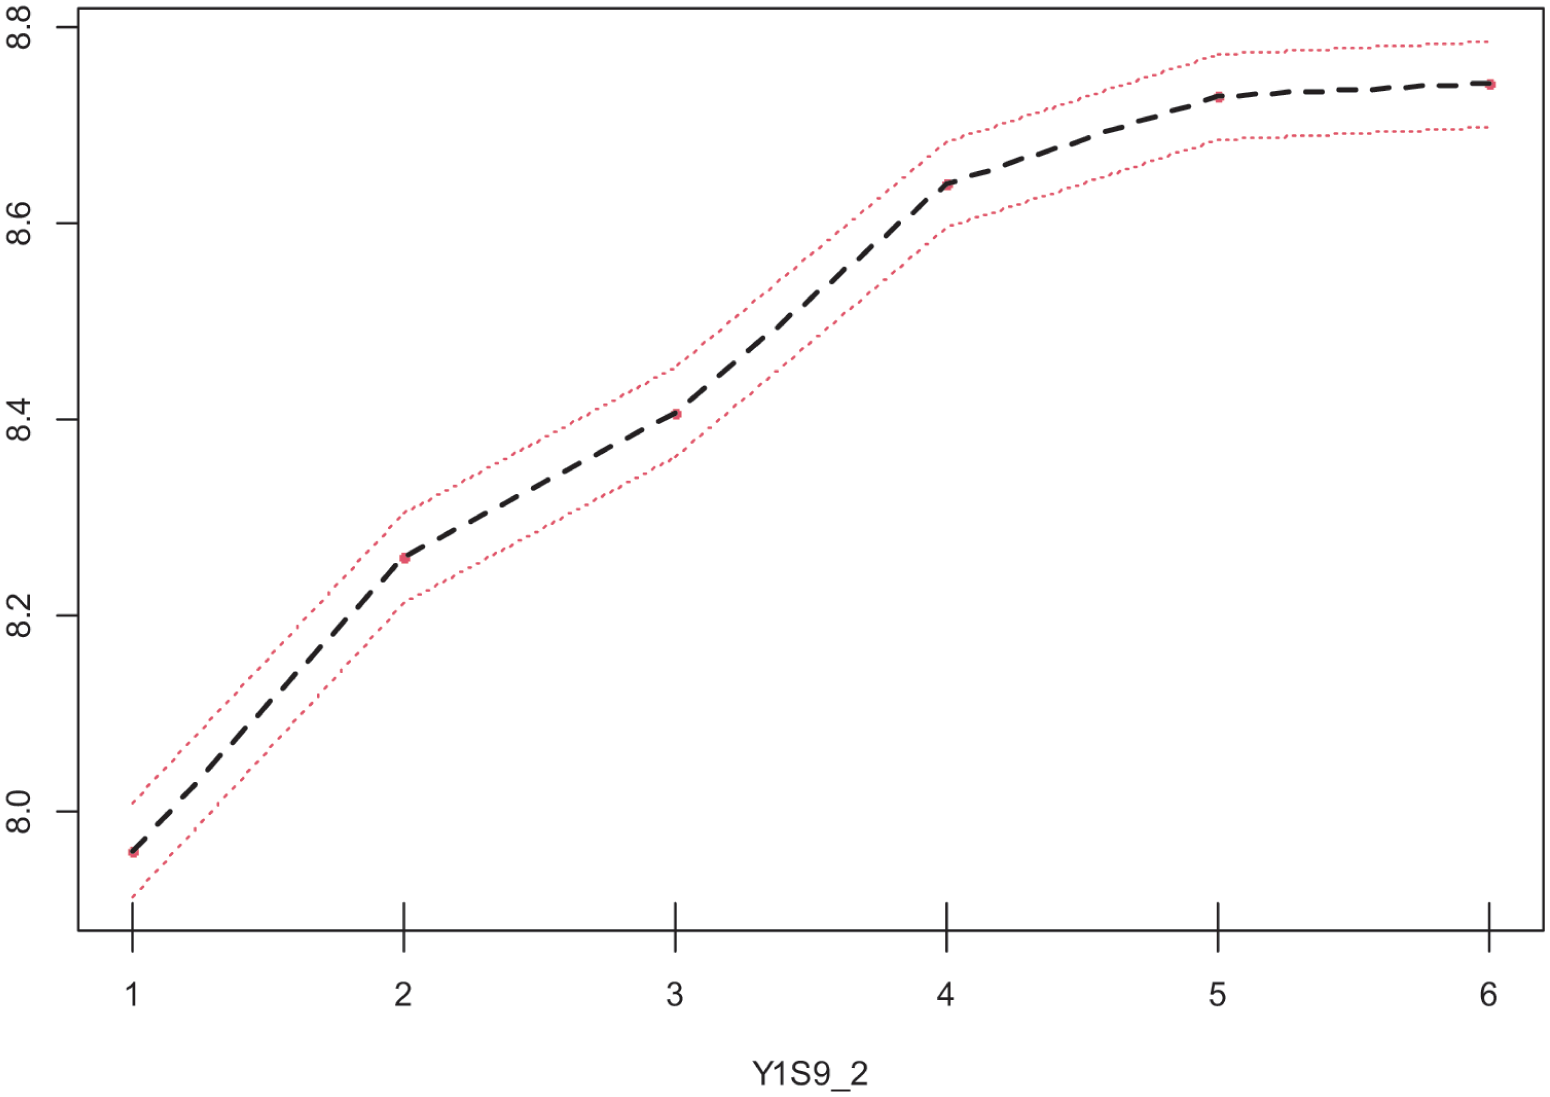
Partial Dependence Plot: Learning-Related Noncompliance (Unexcused Absence).
Finally, mother’s highest level of education (Y1P10_2) revealed a distinct U-shaped nonlinear pattern. Risk generally decreased as educational attainment increased from elementary school to high school graduation but then rebounded significantly at the level of a 4-year university degree or higher (Figure 12). This nonmonotonic trajectory highlights the dual nature of attrition risk at both ends of the socioeconomic spectrum, mirroring the U-shaped pattern observed for household income. In-class attention (Y1E16) showed the inverse pattern of tardiness: risk decreased steadily as attentiveness increased from “never” (Category 1) to “always” (Category 5), with a modest rebound at Category 6 (“don’t know”; Figure 13). Together with homework completion, absence, and tardiness variables, these behavioral indicators collectively suggest that a broad cluster of early disengagement behaviors serves as early warning signals of panel attrition.
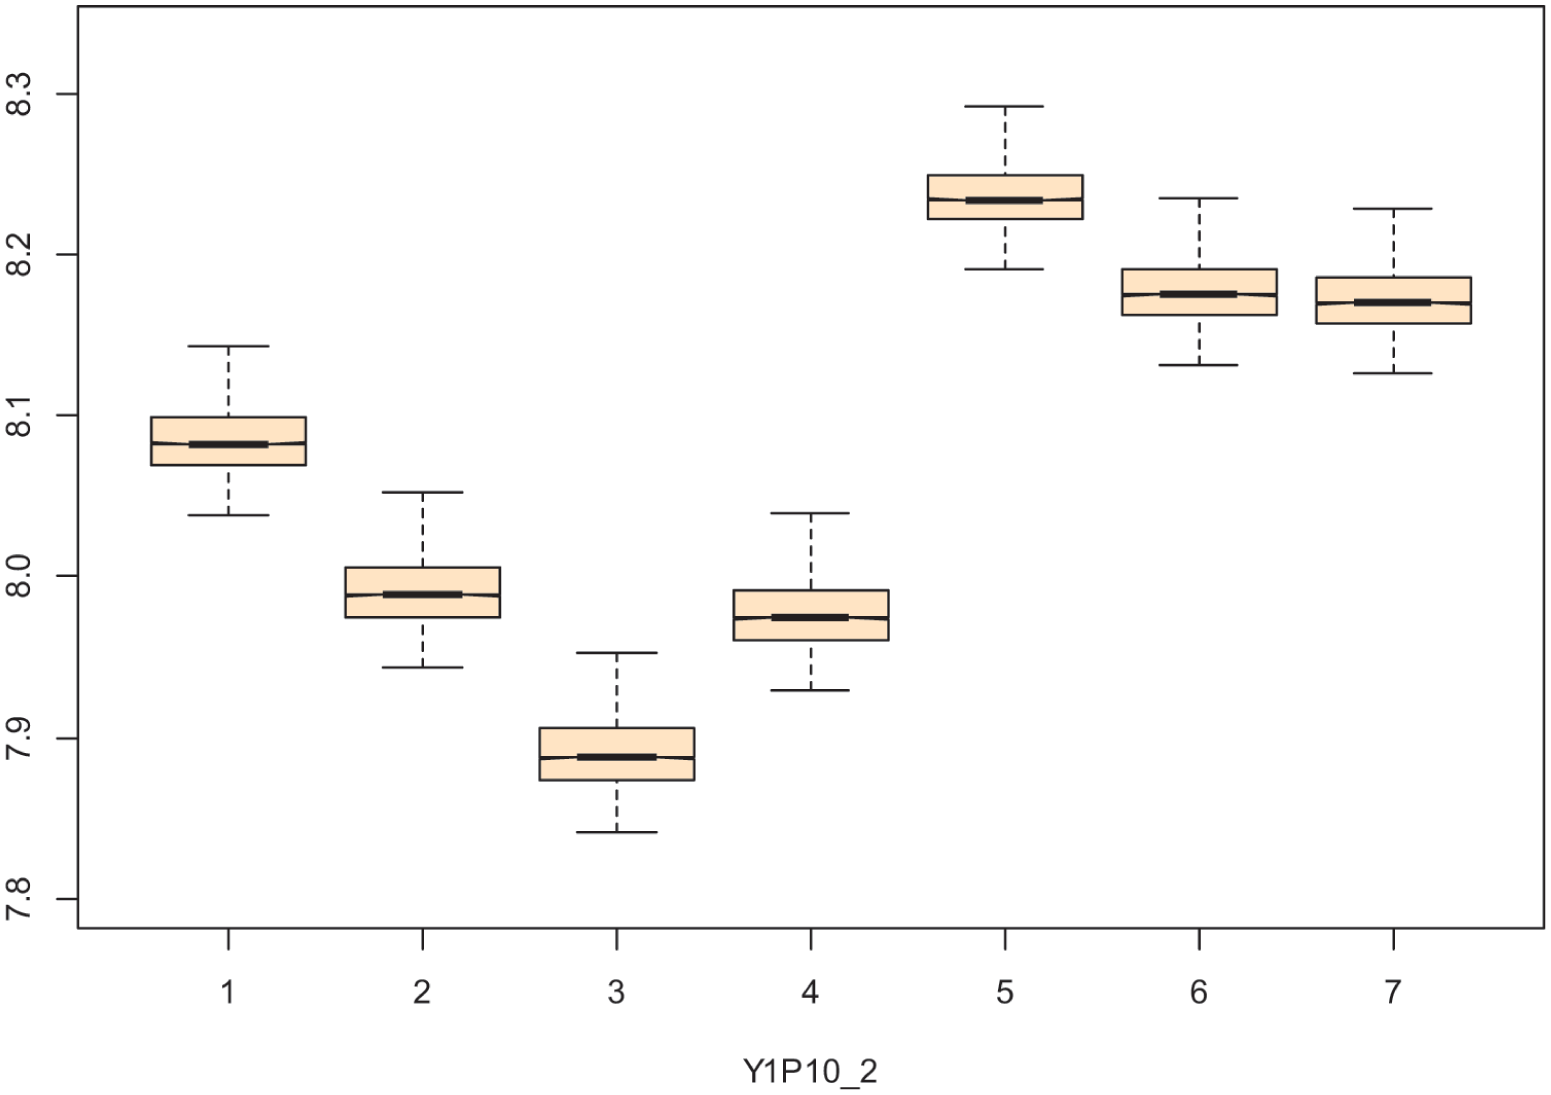
Partial Dependence Plot: Mother’s Highest Education Level.
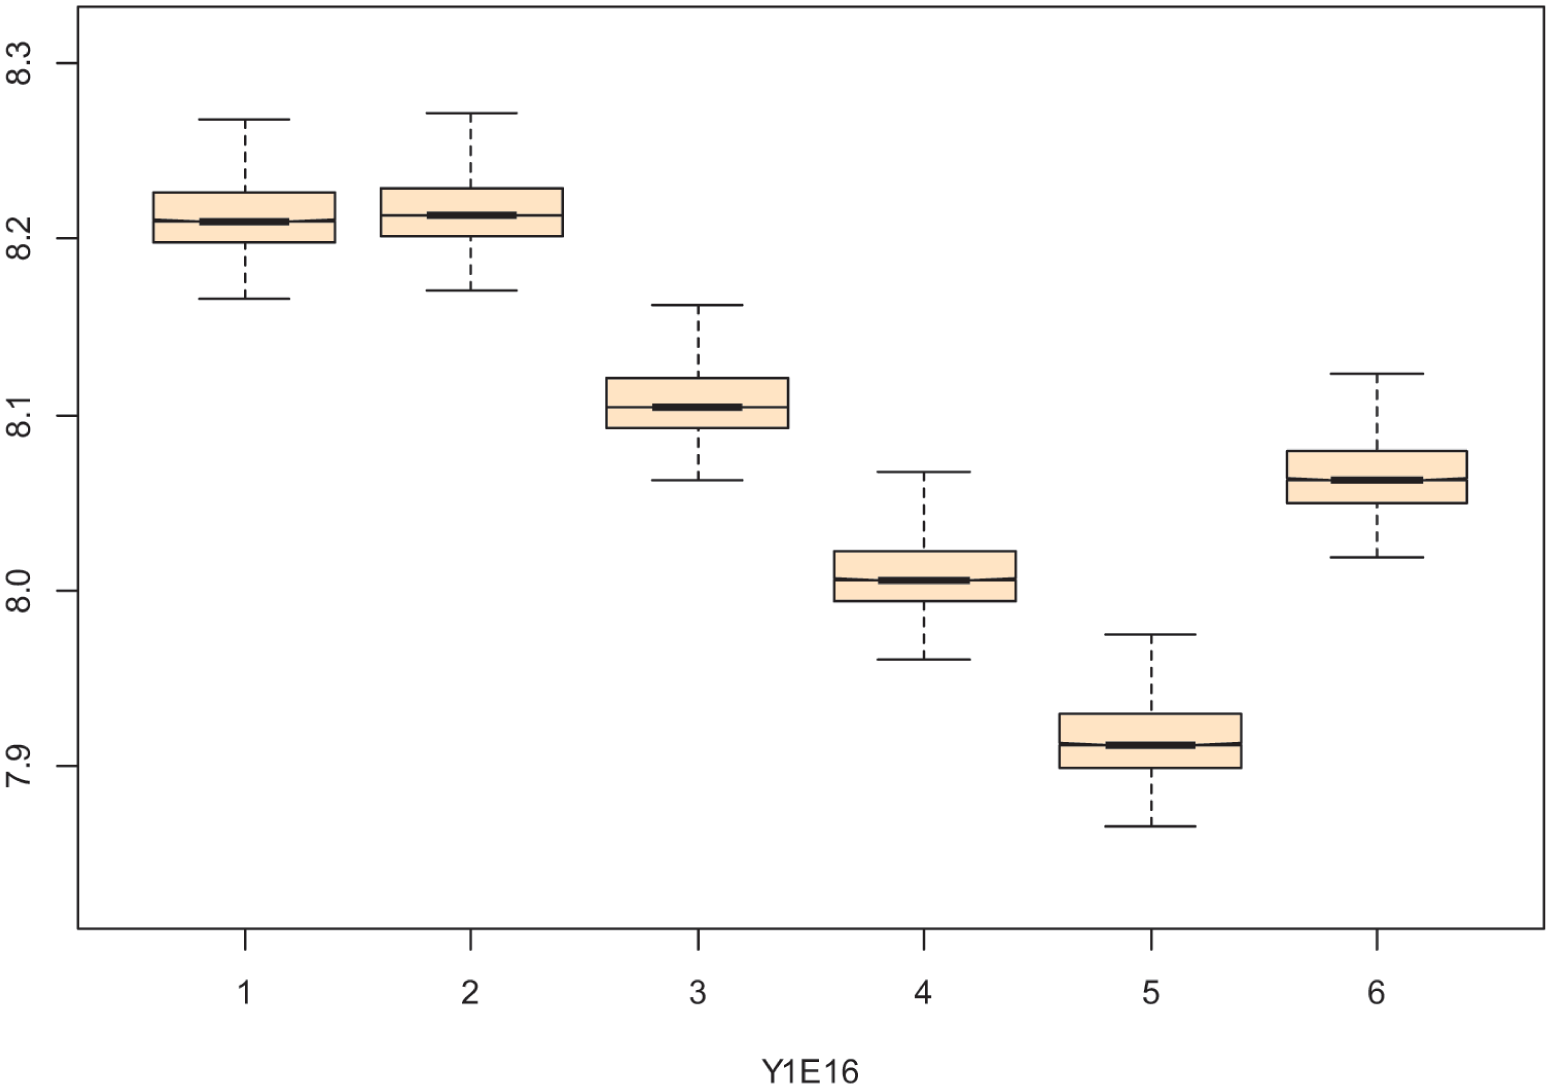
Partial Dependence Plot: In-Class Attention.
Discussion
This study applied RSF to a nationally representative longitudinal dataset to examine panel attrition as a window into adolescent behavioral development. Our findings challenge the traditional view of attrition as a linear function of disadvantage. Instead, we reveal a complex, nonlinear landscape in which structural instability, academic disengagement, and high socioeconomic pressure are associated with distinct developmental profiles among those who leave longitudinal studies before the study is complete.
Structural Transitions as Developmental Vulnerability
Consistent with our first research question (RQ1), school transfer experience emerged as the strongest predictor of attrition. This finding emphasizes the fact that school transitions, which are a normative yet critical aspect of adolescent development, represent periods of heightened vulnerability in longitudinal research. Unlike adults, whose participation is often tied to household stability, adolescents are embedded within school systems that serve both as developmental contexts and institutional anchors for panel tracking. When this anchor is severed via transfer, the risk of losing contact increases substantially. This aligns with Hill and Willis (2001), who identified residential and school mobility as strongly associated with attrition. Similarly, Rickles et al. (2018) found that student mobility rates in US educational panels varied substantially by grade level, with school transitions representing a critical vulnerability. Our findings extend this work by demonstrating that school transfer remains the dominant predictor, even when competing against a comprehensive set of individual and family characteristics. This suggests that attrition during adolescence is closely intertwined with the structural transitions that define this developmental period.
Divergent Developmental Pathways to Attrition
A key contribution of this study is the identification of different dropout mechanisms across the developmental spectrum, as visualized through the nonlinear capabilities of RSF. First, among low-achieving students, attrition appeared to be accompanied by academic disengagement. The threshold pattern observed consistently across all three achievement domains—Korean, mathematics, and English scores—suggests that this risk is not subject-specific but reflects a general academic profile in which low overall performance is associated with elevated attrition risk. High rates of unexcused absences and homework incompletion—identified here as behavioral paradata-proxies—further signal a broader withdrawal from institutional norms. For these students, dropping out may relate to perceiving the survey as another academic burden or source of evaluation anxiety. This pattern is consistent with findings from youth cohorts that focused on behavioral outcomes. Eisner et al. (2019) analyzed the z-proso study, finding that behavioral noncompliance and school disengagement were significant predictors of panel attrition, suggesting that withdrawal from institutional norms generalizes across different types of longitudinal studies.
Notably, maternal education exhibited a distinct U-shaped pattern: attrition risk decreased as education level rose to high school education but then increased among mothers with 4-year university degrees or higher. This elevated attrition risk among high-SES families (and correspondingly, high-achieving students) supports the parental gatekeeping and opportunity cost hypotheses proposed in earlier studies of household panels (Fitzgerald et al., 1998; Hill & Willis, 2001). Our findings provide empirical evidence for these mechanisms in an educational context, where the pressure of high-stakes testing may amplify the perceived opportunity cost of survey participation. In educational systems characterized by rigorous academic tracking and high-stakes testing, such as in the context of this study, time is a scarce resource. Parents with high SES may view survey participation as a distraction from academic pursuits, leading to active refusal to allow their child to participate (gatekeeping). In addition, this group is prone to high social mobility, such as studying abroad or moving to elite school districts, which complicates tracking. These nonlinear risk profiles demonstrate that attrition is not solely a problem for the disadvantaged; it also accompanies intense educational competition and mobility.
Developmental Profiles and Tailored Strategies
In response to our third research question (RQ3), we synthesized the key predictors and nonlinear patterns to identify three distinct “attrition typologies.” These profiles reflect the divergent developmental realities that researchers must navigate to maintain representative samples. First, “movers (structural risk),” defined by school transfer experience, represent youth navigating normative but disruptive structural transitions. Their attrition is largely a failure of tracking mechanisms—specifically the loss of the “institutional anchor”—rather than a behavioral refusal to participate. Second, those “disengaged (behavioral risk),” characterized by low academic achievement, frequent unexcused absences, and homework incompletion, illustrate attrition as an extension of broader withdrawal from institutional norms. For the members of this group, the survey was perceived as an additional academic demand that they wanted to avoid. Third, the “high-stakes (socioeconomic risk)” group, comprising students from highly educated families (high maternal education), reflects the “U-shaped” risk profile. Here, attrition is driven by intense academic prioritization and parental gatekeeping, according to which the “opportunity cost” of survey participation is deemed too high in a competitive educational environment.
Identifying these typologies is critical because they invalidate a “one-size-fits-all” retention strategy. The “movers” require improved tracking infrastructure (e.g., incentives for pre-transfer contact updates), the “disengaged” need burden-reduction strategies (e.g., simplified survey modes, rapport building independent of school authority), and the “high-stakes” require persuasive communication focused on the societal value of the research to justify the time investment to parents. Recognizing these profiles allows for the transition from generic attrition management to developmentally tailored retention strategies.
Methodological Implications for Developmental Research
Our methodological approach offers insights that are broadly relevant to developmental research. A recent study by Jankowsky and Schroeders (2022) concluded that, while machine learning models yield slightly higher predictive performance than logistic regression, the gains in accuracy are often modest.
However, the primary contribution of our study lies not in predictive accuracy, but in revealing the heterogeneity of developmental trajectories. Our comparative analysis against a standard DTHM confirms that a log-linear approach would likely have summarized the relationship between academic achievement and attrition as a simple monotonic association. In contrast, RSF allowed us to detect a threshold effect for academic achievement, whereby risk plateaued beyond a certain score and a U-shaped pattern emerged for maternal education, revealing that high-SES families also show elevated attrition risk. This capacity to uncover nonlinear patterns has broader implications for developmental research; when studying any behavioral outcome that varies nonlinearly across the developmental spectrum, machine learning approaches may reveal subgroup differences that traditional methods obscure.
Practical Implications for Data Analysis
Beyond identifying key risk factors, the RSF framework offers a direct mechanism for correcting attrition bias in subsequent longitudinal analyses. Unlike traditional methods that assign static weights based on limited demographic variables, RSF generates individualized predicted survival probabilities that reflect complex, nonlinear interactions among high-dimensional predictors.
To yield unbiased parameter estimates in downstream analyses (e.g., latent growth curve modeling or panel regression), researchers can utilize these probabilities to construct inverse probability weights (IPW; Seaman & White, 2013). Specifically, the weight for each retained participant can be calculated as the inverse of their predicted survival probability using the formula:
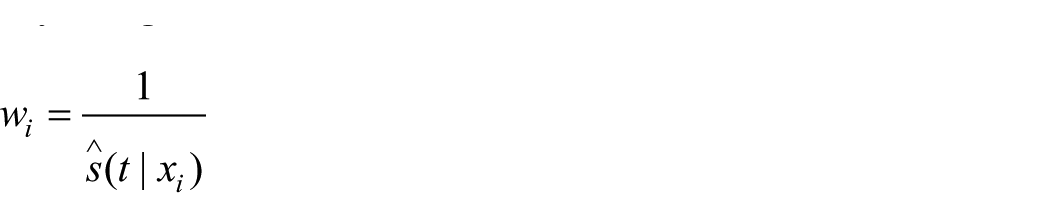
where represents the estimated survival probability at time
Limitations
Despite these significant findings and contributions, this study had several limitations. First, although we utilized a rich set of baseline predictors, we could not account for time-varying factors that occurred after the initial wave. Changes in family structure (e.g., parental divorce), residential relocation, or shifts in academic motivation during high school may have influenced attrition risk in ways not captured by our baseline measures. Incorporating time-varying covariates or employing joint modeling approaches could address this limitation in future research.
Second, although we identified nonlinear patterns (a threshold effect for achievement and a U-shaped pattern for maternal education) suggesting differential dropout mechanisms, the specific psychological motivations underlying these patterns remain inferential. For instance, whether high-SES attrition reflects active parental gatekeeping, increased geographic mobility to pursue educational opportunities, or respondent burden from competing academic demands cannot be disentangled from the current data. Qualitative follow-up studies with nonrespondents and their families would provide valuable insight into these mechanisms.
Third, the generalizability of the findings should be considered. The core mechanisms identified, namely structural disconnection through school transfer, behavioral disengagement, and institutional vulnerability at transition, align with findings from Western youth cohorts (Eisner et al., 2019; Hill & Willis, 2001; Malschinger et al., 2023) and are likely universal. However, the magnitude of certain effects, particularly the U-shaped risk associated with maternal education, may be amplified in high-stakes education contexts and attenuated in systems with lower competitive pressure. Future cross-national comparisons would help disentangle universal mechanisms from culturally moderated effects.
Conclusion
Panel attrition in adolescent longitudinal studies is not a random nuisance, but rather a patterned phenomenon that reflects the structural changes and socioeconomic contexts that shape adolescent development. By employing RSF, this study revealed the nonlinear dynamics of attrition risk—specifically, distinct profiles of both academically disengaged and high-SES students—those traditional methods fail to capture. These findings suggest that understanding who leaves longitudinal studies and when offers substantive insights into the heterogeneity of developmental trajectories during adolescence. Ultimately, attrition patterns are not merely a methodological challenge to be corrected, but rather a meaningful signal of how diverse adolescent lives unfold across critical transitions.
Footnotes
Acknowledgements
Part of this article was presented at the 2024 Fall Conference of the Korean Educational Evaluation Society.
Ethical considerations
Not applicable. This study utilized secondary data from the Korean Education Longitudinal Study 2005 (KELS 2005), which was approved by the Korean Educational Development Institute Ethics Committee (approval no. No. 2020-03-03N).
Consent to participate
Not applicable. This study utilized secondary data; informed consent was obtained by the primary data collector (Korean Educational Development Institute) at the time of data collection.
Consent for publication
Not applicable.
Funding
The authors disclosed receipt of the following financial support for the research, authorship, and/or publication of this article: This research was supported by Sookmyung Women’s University Research Grants [1-2303-2002].
Declaration of conflicting interests
The authors declared no potential conflicts of interest with respect to the research, authorship, and/or publication of this article.
Data availability statement
Restrictions apply to the availability of these data, which were used under license for this study. Data may be available with the permission of the Korean Educational Development Institute.