






Abstract
The diversity of measures used to assess early childhood development complicates comparison across studies, populations, and programs. The Global Scales for Early Development (GSED) address this challenge by providing interoperable long and short forms (GSED-LF and GSED-SF) linked through a shared measurement model to a common developmental metric, the D-score. This article presents an updated GSED core model based on Rasch analysis of data from seven sites (n = 9,287 children aged 0–41 months). The final model includes 281 items selected through item- and person-fit evaluation and shows improved measurement precision compared with earlier keys. Descriptive age-conditional reference curves derived from combined GSED-LF and GSED-SF data provide a methodological benchmark for typical development. We further demonstrate how external measures, including the Bayley Scales of Infant and Toddler Development, Third Edition (BSID-III), can be mapped onto the D-score scale by anchoring new items to the core model. D-scores and Development-for-Age Z-scores (DAZ) derived from GSED-LF, GSED-SF, and BSID-III show strong agreement, supporting the validity of the extension. The resulting GSED2510 key, implemented in the open-source dscore R package, enables standardized, measure-independent assessment of early child development.
Keywords
Introduction
Background
Population monitoring and program evaluation of child development require measures and metrics that are interpretable for policymakers. The wide variety of child development measures, each with its own scale and scoring system, undermines interpretability and contributes to fragmentation in research, practice, and policy. A practical response is to identify comparable items across measures that yield consistent results. This approach underpins the Global Scales for Early Development (GSED) (Cavallera et al., 2023), which produces a unified metric, the D-score, to represent the underlying construct of development. This article presents such an approach in the context of early child development assessment.
D-score Conceptual Framework
The D-score unifies disparate child development measures into a single, comparable metric intended to capture a core dimension of early child development across contexts. It is based on a unidimensional Rasch model, which links dichotomous item responses to the difference between a child’s latent ability and item difficulty, placing both on a common interval scale (Wright & Masters, 1982). As a result, differences in D-scores are interpretable across ages, abilities, and measures, allowing the D-score to function as a standardized unit of child development (Jacobusse et al., 2006).
The generic properties of the Rasch model support harmonization of data from different measures and comparisons across populations, provided that items fit the model adequately. Because many developmental items may be domain- or context-specific, careful item selection and model evaluation are essential to ensure that the D-score reflects a core developmental dimension that generalizes across settings.
GSED Project
The GSED project (Cavallera et al., 2023), led by the World Health Organization (WHO), comprises three successive phases. See Table 1 for their main statistics.
Overview of Successive GSED Phases, Reporting the Number of Children, Measures and Countries Involved, Name of the Key Produced and the Number of Items in the Key.

The GSED project began with a construction study that harmonized existing datasets from multiple measures and sites to establish an initial unified D-score model integrating direct-observation and caregiver-reported measures (key GSED1912; van Buuren et al., 2025).
Validation Phase 1 used newly collected data to develop and validate the GSED Short Form and Long Form instruments (WHO, 2023), producing key GSED2406 based exclusively on these measures (van Buuren et al., 2025).
Validation Phase 2 completed core model development by incorporating data collected under a common protocol from all seven planned sites, yielding key GSED2510 based on 9,287 children. This article reports the results of Phase 2.
Objectives
Earlier D-score keys did not fully support population monitoring and program evaluation. The first Dutch key (van Buuren, 2014) was based on a single measure in one population, and the Global Child Development Group (GCDG) key (Weber et al., 2019), while covering multiple measures and countries, was limited to direct-observation measures. The first GSED key (GSED1912) extended this framework by incorporating caregiver-reported measures, but further refinement was needed to support a unified and comparable global model.
Unlike GSED1912, which relied on previously collected datasets, Phases 1 and 2 were prospectively designed and implemented under a common protocol to ensure data comparability across countries. This coordinated design provides a more reliable empirical basis for global comparison of early child development (Khanam et al., 2026).
This report applies stricter item-filtering procedures, including truncation and differential item functioning (DIF) testing. The first objective is to assess whether these refinements, implemented in key GSED2510, lead to improved measurement quality compared with earlier keys, as indicated, for example, by reductions in the standard error of measurement.
The second objective is to demonstrate how the updated core model can be applied in practice. We present a systematic procedure for extending the model to additional measures, illustrated using the Bayley Scales of Infant and Toddler Development, Third Edition (BSID-III; Bayley, 2006), and evaluate the quality of this extension to provide a template for future integrations.
Methods
Materials
The data were collected as part of the GSED Validation Study, which had the following specific objectives (Cavallera et al., 2023):
To fit a Rasch model to the item data collected from the GSED measures in seven sites and compute D‑scores and Development-for-Age Z-scores (DAZ) values for children 0 to 41 months.
To assess measurement invariance by examining DIF and differential test functioning across sites.
To evaluate the psychometric properties of the GSED-SF (139 caregiver‑reported items) and the GSED-LF (155 directly observed items).
The conceptual foundation for the GSED measures was developed by integrating expert judgment with insights gleaned from model GSED1912 (McCray et al., 2023). A feasibility study conducted in three countries evaluated the acceptability, translation, training, and app usability of the GSED measure (Merchant et al., 2025). The GSED-SF and GSED-LF were later published, with comprehensive documentation, as the GSED v1.0 Package (WHO, 2023). For details on the collected data in Phases 1 and 2, we refer to Khanam et al. (2026).
Item Definitions
Items form the fundamental building blocks of the D‑score framework. Each item in the GSED measures represents a specific developmental behavior that can be observed and scored as either passed or not passed. These items reflect different developmental domains, including motor, language, cognitive, social-emotional, and adaptive behaviors. Supplemental Table S1 provides an overview of the items included in the GSED-LF and GSED-SF measures, listing the item code, measure identifier, developmental domain, mode of administration, item number, and descriptive label.
Supplemental Table S1 also lists the difficulty estimate per item for key GSED2510, the focus of this article. The items are sorted by the published GSED form sequence.
Data Processing
We processed the raw item response data separately by site and by measure. Custom R functions were developed to standardize formats and definitions, remove duplicate records, exclude invalid item responses (i.e., values other than 0 or 1), and harmonize variable naming. We included all items that had at least 10 observations in both response categories (pass and fail).
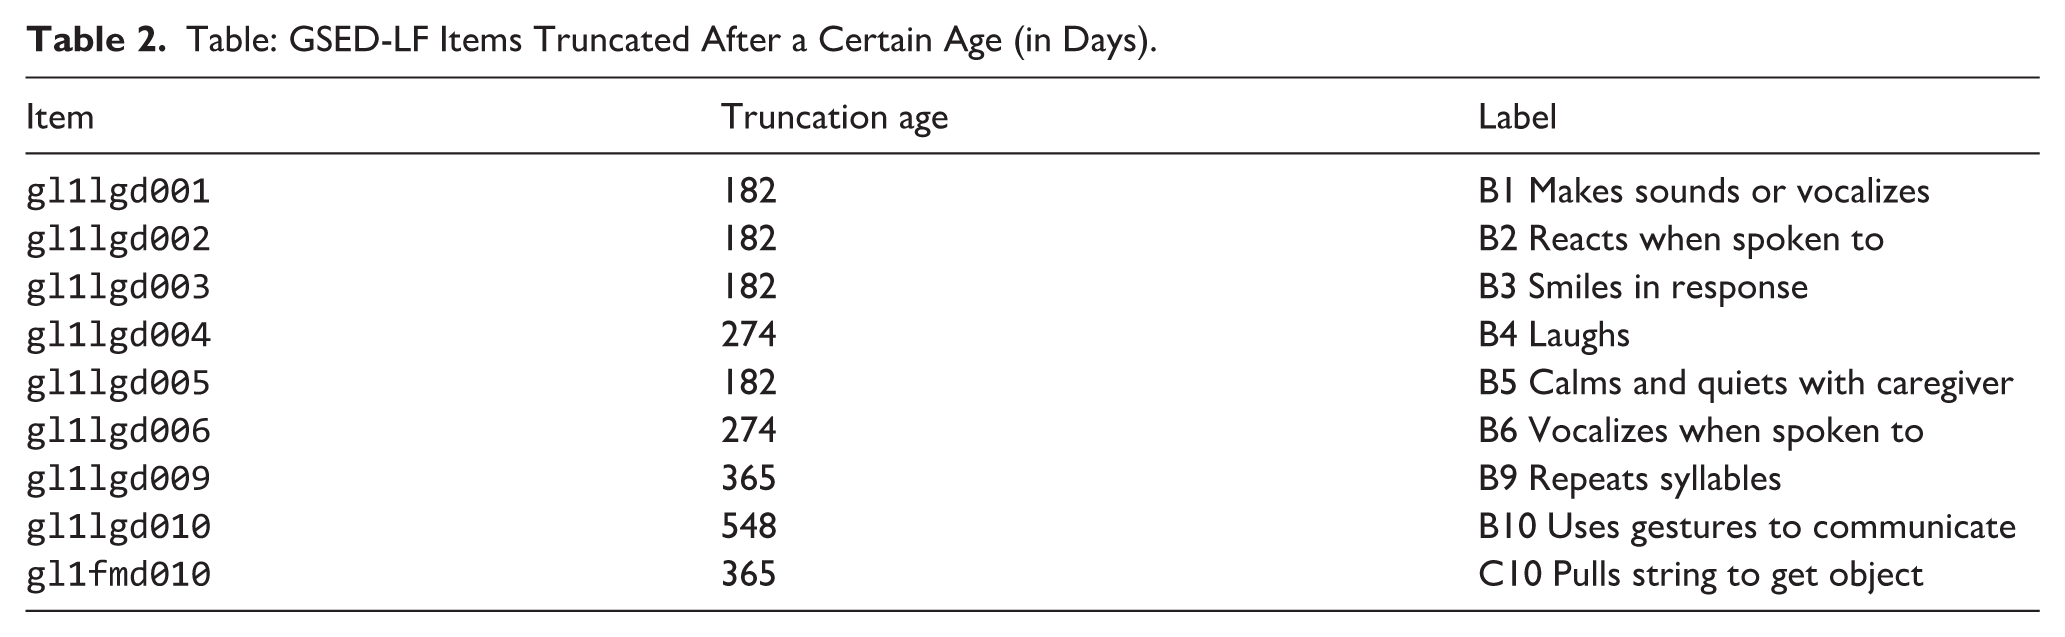
Item gs1moc028 (“Does your child hold his or her hands in fists?”) was excluded because its passing probability lacked a consistent age-related pattern. In addition, some GSED-LF items were truncated after a certain age based on two criteria: (1) the probability of passing the item decreased beyond a specific age, and (2) the item likely ceased to be developmentally relevant after that point. For example, Item gl1lgd003 (“Smiles in response?”) showed a consistent increase in pass probability up to 182 days of age, followed by an erratic decline likely because of emerging stranger anxiety. Including responses beyond the truncation age would have reduced model quality. Table 2 lists the truncated items along with their respective truncation ages.
Table: GSED-LF Items Truncated After a Certain Age (in Days).
Statistical Model
We matched pairs of LF and SF records that occurred within 4 days of each other. The age for each pair was defined by the mean of the two visit dates. Some children were assessed at two or three different ages, allowing them to contribute multiple LF–SF pairs. Our analysis assumes that a child’s ability is the same across both administrations within a pair. This assumption is plausible because the interval between LF and SF assessments was short, typically the same day or the following day. Moreover, randomizing the order of LF and SF administration prevented systematic bias from test sequencing. Estimation of item difficulties was performed using the pairwise conditional method (van der Linden & Eggen, 1986).
We estimated each child’s ability using the newly derived item difficulties, yielding Rasch model scores on the logit scale. This scale has an arbitrary mean (fixed at zero) and a length determined by the ability range in the calibration sample. To place these estimates on the D-score scale, we applied a linear transformation that ensures maximal comparability with earlier scales. Unlike the previous method, which anchored the scale to two specific items (van Buuren et al., 2025), the new procedure uses all items to estimate the intercept and slope of the transformation from logit-based abilities to D-scores.
Purification
The main part of the analysis involved removing items and persons that showed poor fit to the Rasch model, as well as items displaying DIF across sites or validation phases. The purification process was iterative, alternating between re‑estimating the key and eliminating misfitting elements.
Item and person fit were evaluated using infit and outfit statistics (Wright & Masters, 1982). Consistent with van Buuren et al. (2025), items with infit >1.2 were flagged for review; following item review, the model was re-estimated and poorly fitting persons were excluded using a cut-off that balanced model quality and data retention. DIF by site and validation phase was assessed using one-versus-rest logistic regression using the Jodoin–Gierl criteria (Jodoin & Gierl, 2001). These criteria are based on the change in Nagelkerke’s R2 between two nested logistic models, defined as ΔR2 = R2full − R2reduced, and quantify the incremental contribution of the group indicator and its interaction with the latent trait. According to Jodoin and Gierl (2001), it is considered negligible, moderate, and large. Item characteristic curves were visually inspected across groups, and items were retained when observed differences were judged to be substantively small despite statistical DIF flags.
We evaluated the quality of the final model by examining the distributions of person‑fit and item‑fit statistics, comparing D‑scores computed separately for the SF and LF measures, and assessing the scale length in logits relative to the previous model (with a longer scale indicating better precision).
Descriptive References
We constructed descriptive age-conditional reference curves for D-scores by combining data from all seven GSED sites, calculated separately for the LF and SF measures. Age-dependent distributions were modeled using generalized additive models for location, scale, and shape (GAMLSS) (Rigby & Stasinopoulos, 2006), with age (shifted by +100) as the explanatory variable. We compared Normal and Box–Cox t-distributions (BCT). For the selected BCT model, the degrees of freedom for cubic splines for age were set to 8, 4, 4, and 0, for μ, σ, ν, and τ, respectively. Model adequacy was assessed using worm plots (van Buuren & Fredriks, 2001), balancing goodness of fit and smoothness, and the final models were used to derive smooth centile curves for D-scores.
Results
Description of the Dataset
Table 3 shows the summary of visits and responses by GSED site. A total of 9,287 children participated across the seven sites, contributing 11,794 LF visits and 11,900 SF visits. The number of children per site ranged from 591 in the Netherlands to 1,672 in Pakistan. The total number of item-level pass/fail responses was 471,577 for the LF measure and 454,335 for the SF measure.
Summary of Sample size, Visits, and Responses by GSED Site.
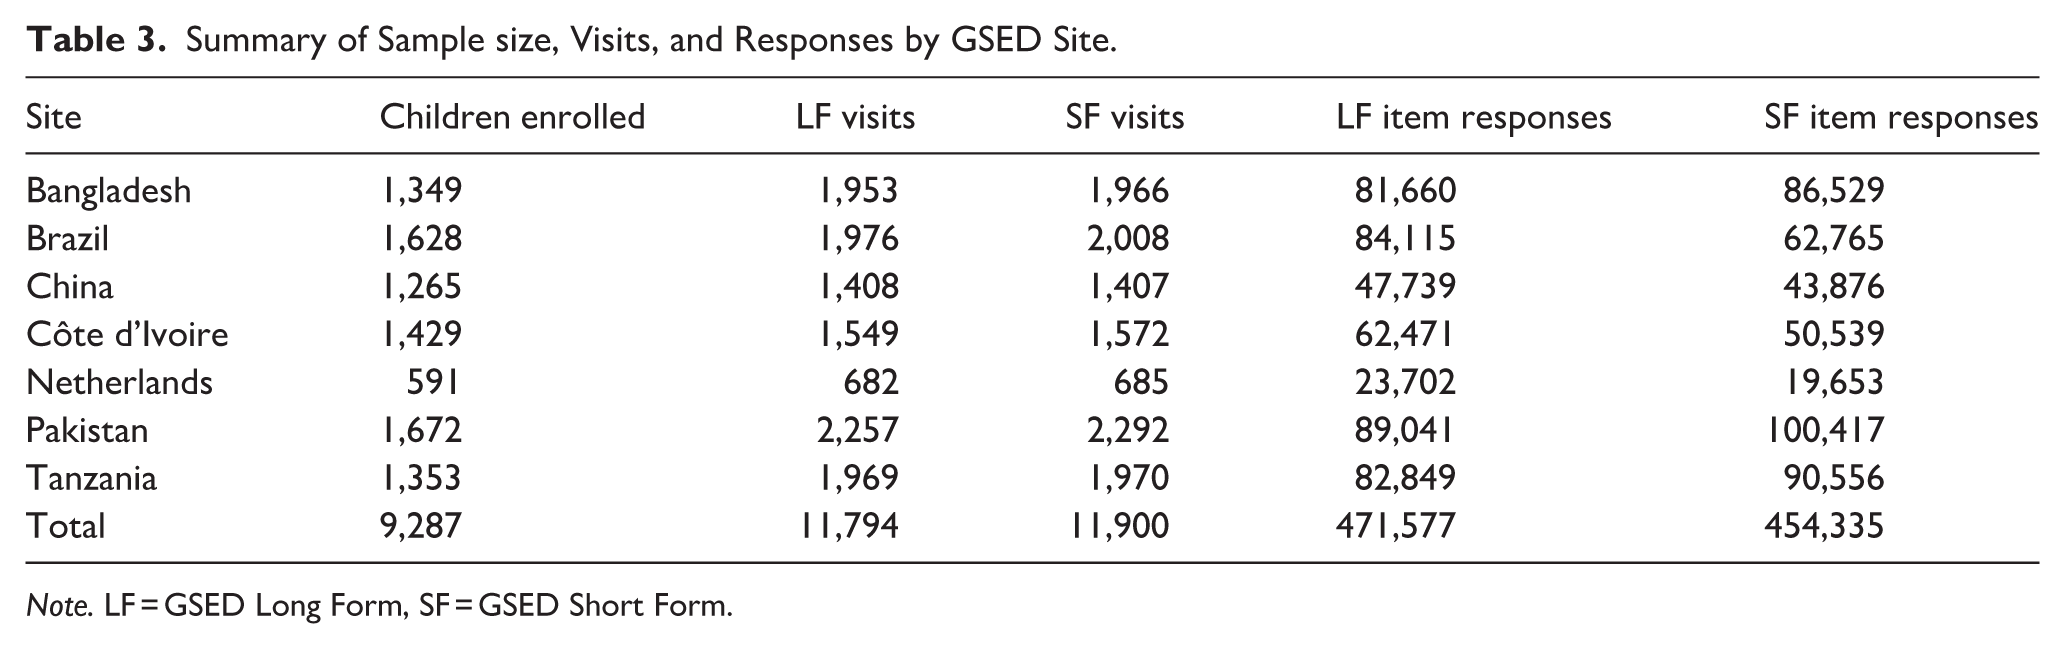
Note. LF = GSED Long Form, SF = GSED Short Form.
Purification
In the initial model including all SF and LF items, 18 items showed infit values above 1.20 and were selected for detailed review. Based on combined statistical and substantive evaluation, eight items were removed from the core model, while the remaining 10 were retained. Supplemental Table S2 summarizes the reviewed items, their fit statistics, and the resulting removal decisions.
Person-fit thresholds of 3.0, 2.5, 2.0, and 1.5 were evaluated to balance model fit and data retention. An infit cut-point of 2.0 provided the best trade-off, resulting in the exclusion of 2.5% of visits and 5.0% of responses. Supplemental Table S3 summarizes the proportions of removed visits and responses across thresholds.
Of the 285 items, 15 were flagged for potential DIF and subjected to detailed review. Four items exhibiting large DIF were removed from the core model, while the remaining items were retained. Supplemental Tables S4 and S5 summarize DIF patterns by group and the evaluation outcomes for the reviewed items.
In summary, to improve model fit and comparability, we removed eight items with poor Rasch fit, excluded 2.5% of visits and 5.0% of responses with person fit >2.0, and removed four items exhibiting substantial DIF. After purification, the core model retained 281 items. These items and the filtered data were used to estimate key GSED2510.
It is important to note that these items were excluded from the GSED core model, but this does not mean they are recommended for removal from the GSED measures.
Model Quality
Figure 1 shows the distributions of item and person infit and outfit statistics for the final core model (GSED2510). Most item- and person-fit values fall within the 0.5–1.5 range, with a small number of remaining extreme person-fit outliers.
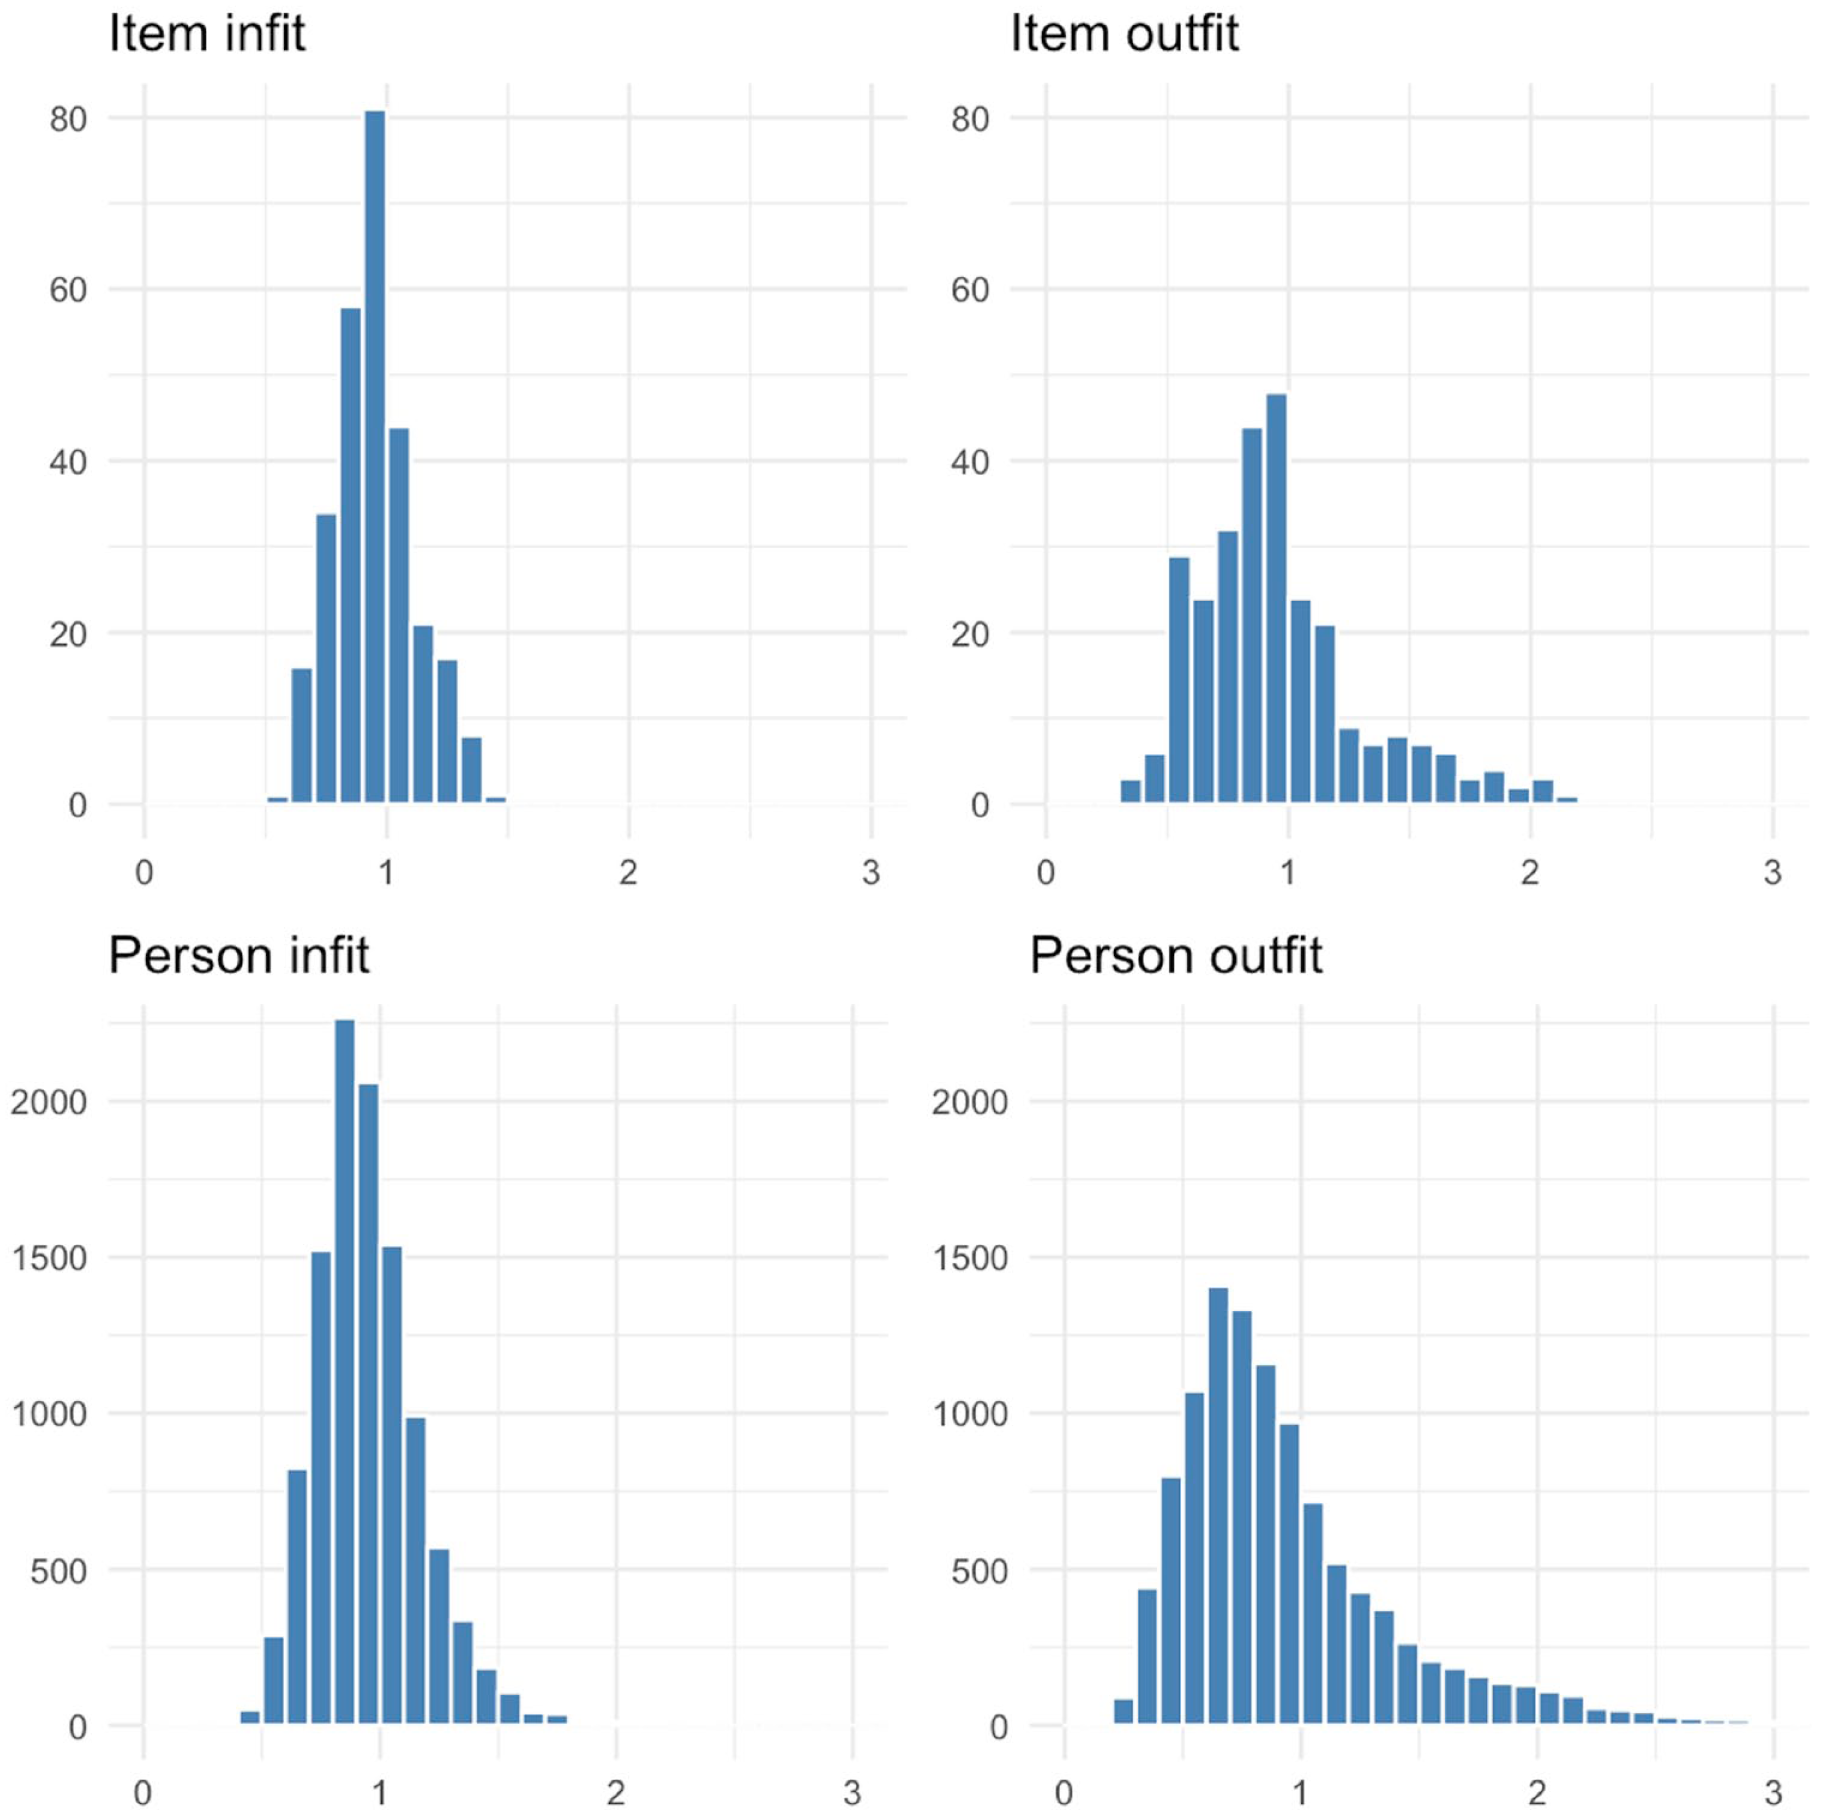
Histograms of item- and person-fit statistics for the GSED core model (GSED2510).
Scale length increased under key GSED2510, indicating improved measurement precision. For the D-score range 0–80, the corresponding logit span increased from approximately 19.7 logits under GSED2406 to 22.2 logits under GSED2510, reflecting a longer latent scale for the same observed score range.
Improved precision of the new core model is reflected in reduced average standard errors of measurement (SEM). For the GSED-LF, average SEM decreased from 1.67 under key GSED2406 to 1.58 under key GSED2510, and for the GSED-SF from 1.72 to 1.60 using the same data.
Descriptive References
Figure 2 shows D-scores by age for the combined seven GSED sites. D-scores derived from the LF and SF measures show strong agreement (r = 0.98), with an age-corrected correlation of 0.44.
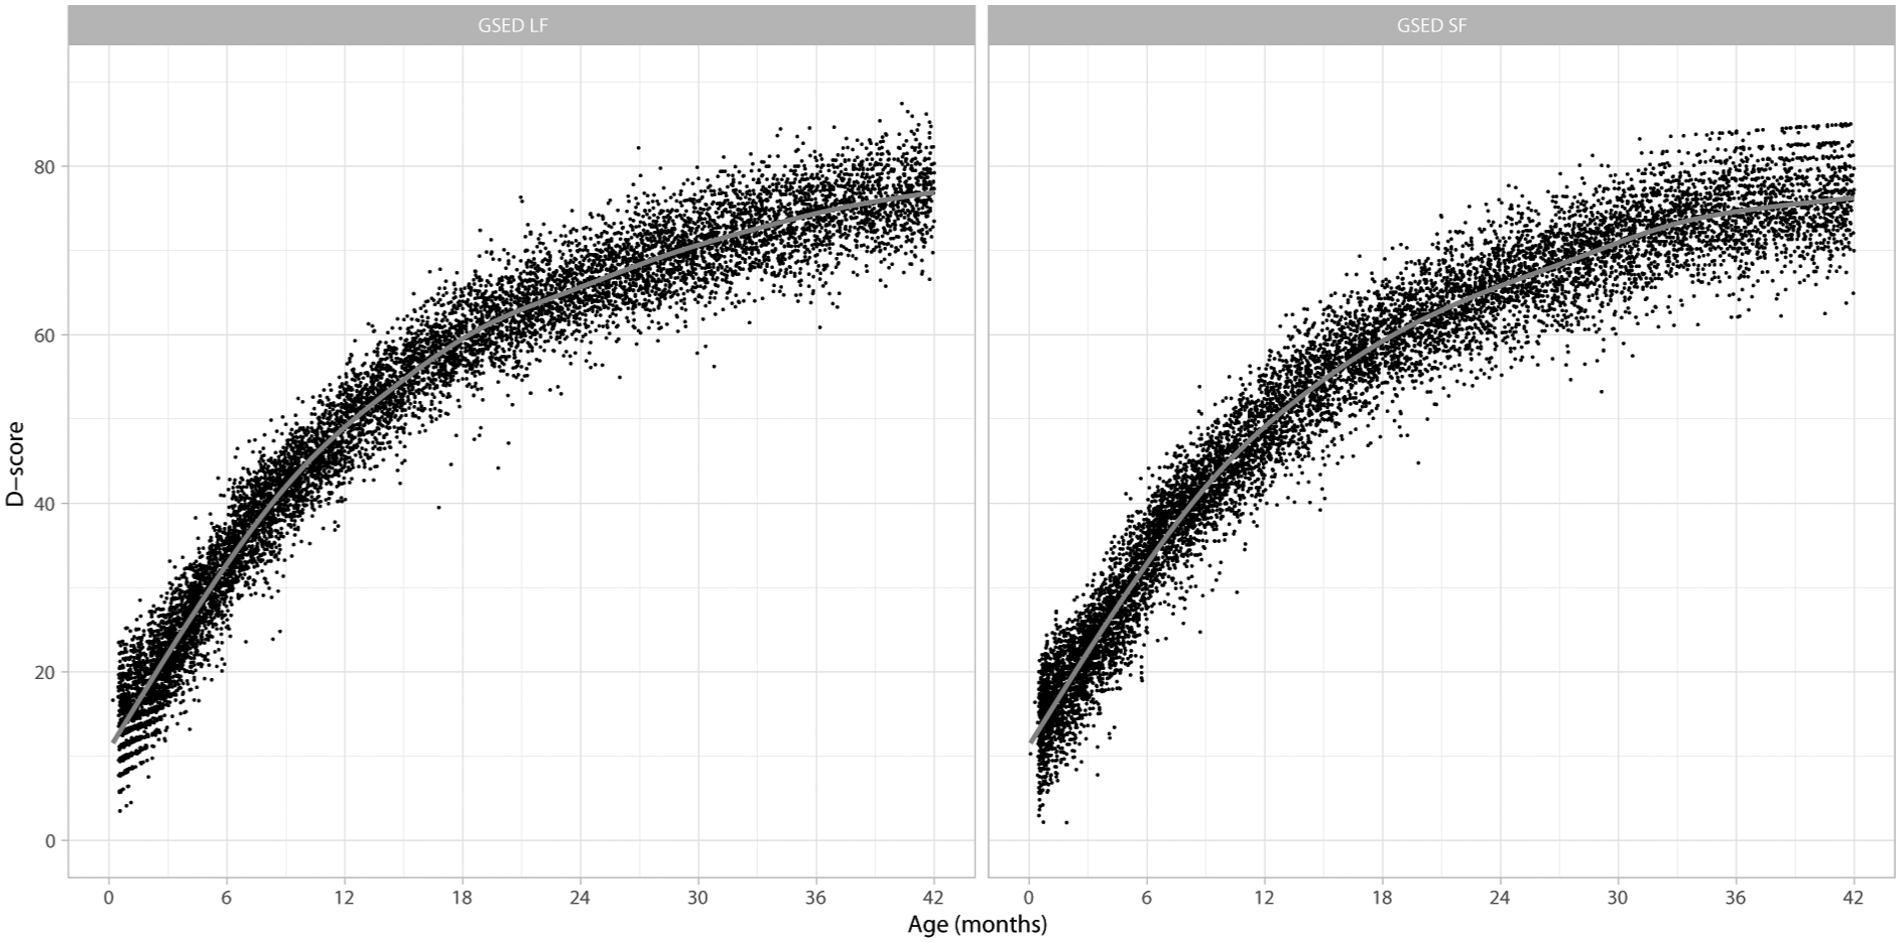
D-score by age for seven GSED sites combined.
Figure 3 presents age-conditional D-score centile curves from −3 to +3 SD. This descriptive reference is used throughout the article to compute DAZ.
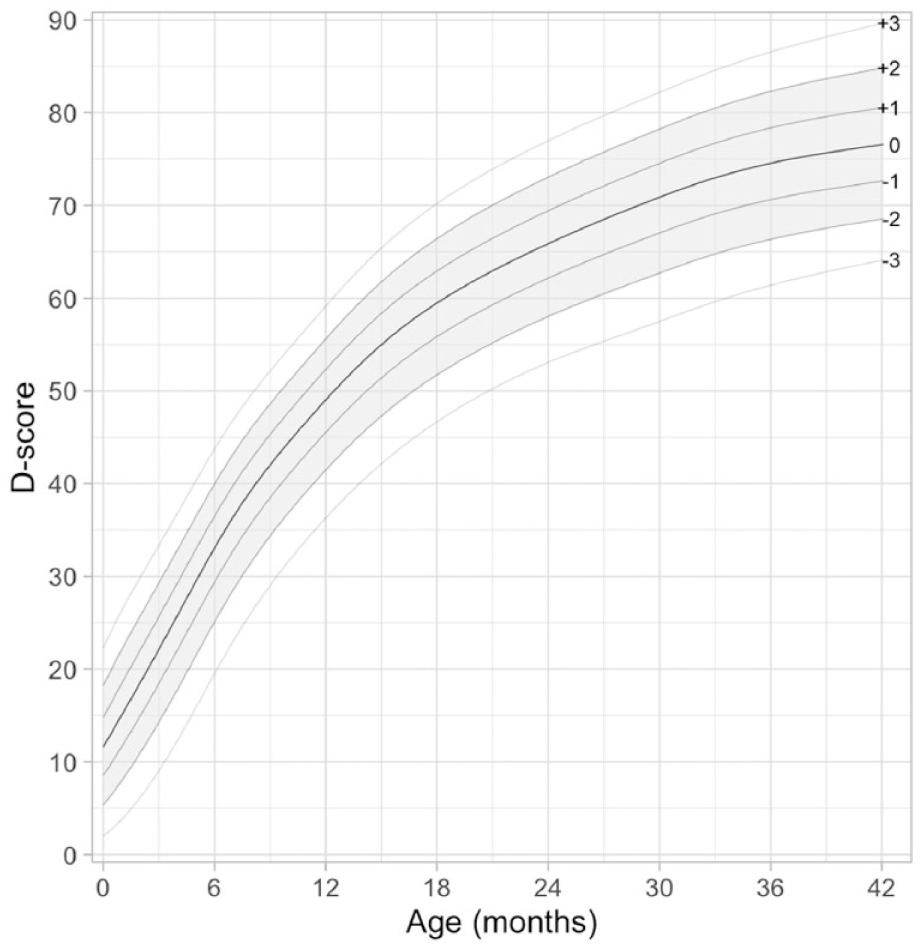
Descriptive age-conditional reference for the D-score based on seven GSED sites.
Application
Extending the GSED Core Model to BSID-III
Here, we illustrate how the GSED core model can be extended to an external measure, using the BSID-III, as an example.
The extension used BSID-III measurements collected alongside GSED-LF and/or GSED-SF in six of the seven GSED sites, supplemented with BSID-III data from five external sites previously used in model construction (Weber et al., 2019). Supplemental Table S6 summarizes visits with BSID-III data by country and site. In total, 5,850 visits included BSID-III assessments, the majority originating from non-GSED sites. Although the subset of BSID-III data collected within GSED was smaller, it enabled horizontal linking of the BSID-III to the GSED core model.
To anchor the extension, item difficulties for all GSED-LF and GSED-SF items were fixed to their GSED2510 values, whereas difficulties for BSID-III items were estimated using the Rasch model. After excluding poorly fitting BSID-III items, the resulting parameters were retained as a BSID-III extension of the core model. A relaxed infit cut-off of 1.5 was used for BSID-III items; alternative item-linking approaches based on shared items have been described elsewhere (Eekhout et al., 2024).
Consistency across measures was assessed by comparing D-scores and DAZ values derived from the GSED-LF, GSED-SF, and BSID-III.
BSID-III Extension Results
Figure 4 shows strong agreement among D-scores derived from the GSED-LF, GSED-SF, and BSID-III, indicating consistent measurement of developmental ability across measures. Bland–Altman analyses showed minimal systematic bias. Age-adjusted DAZ values exhibited more moderate correlations (r = 0.40–0.55), as expected. Overall, these results indicate that the BSID-III extension aligns well with the GSED core model.
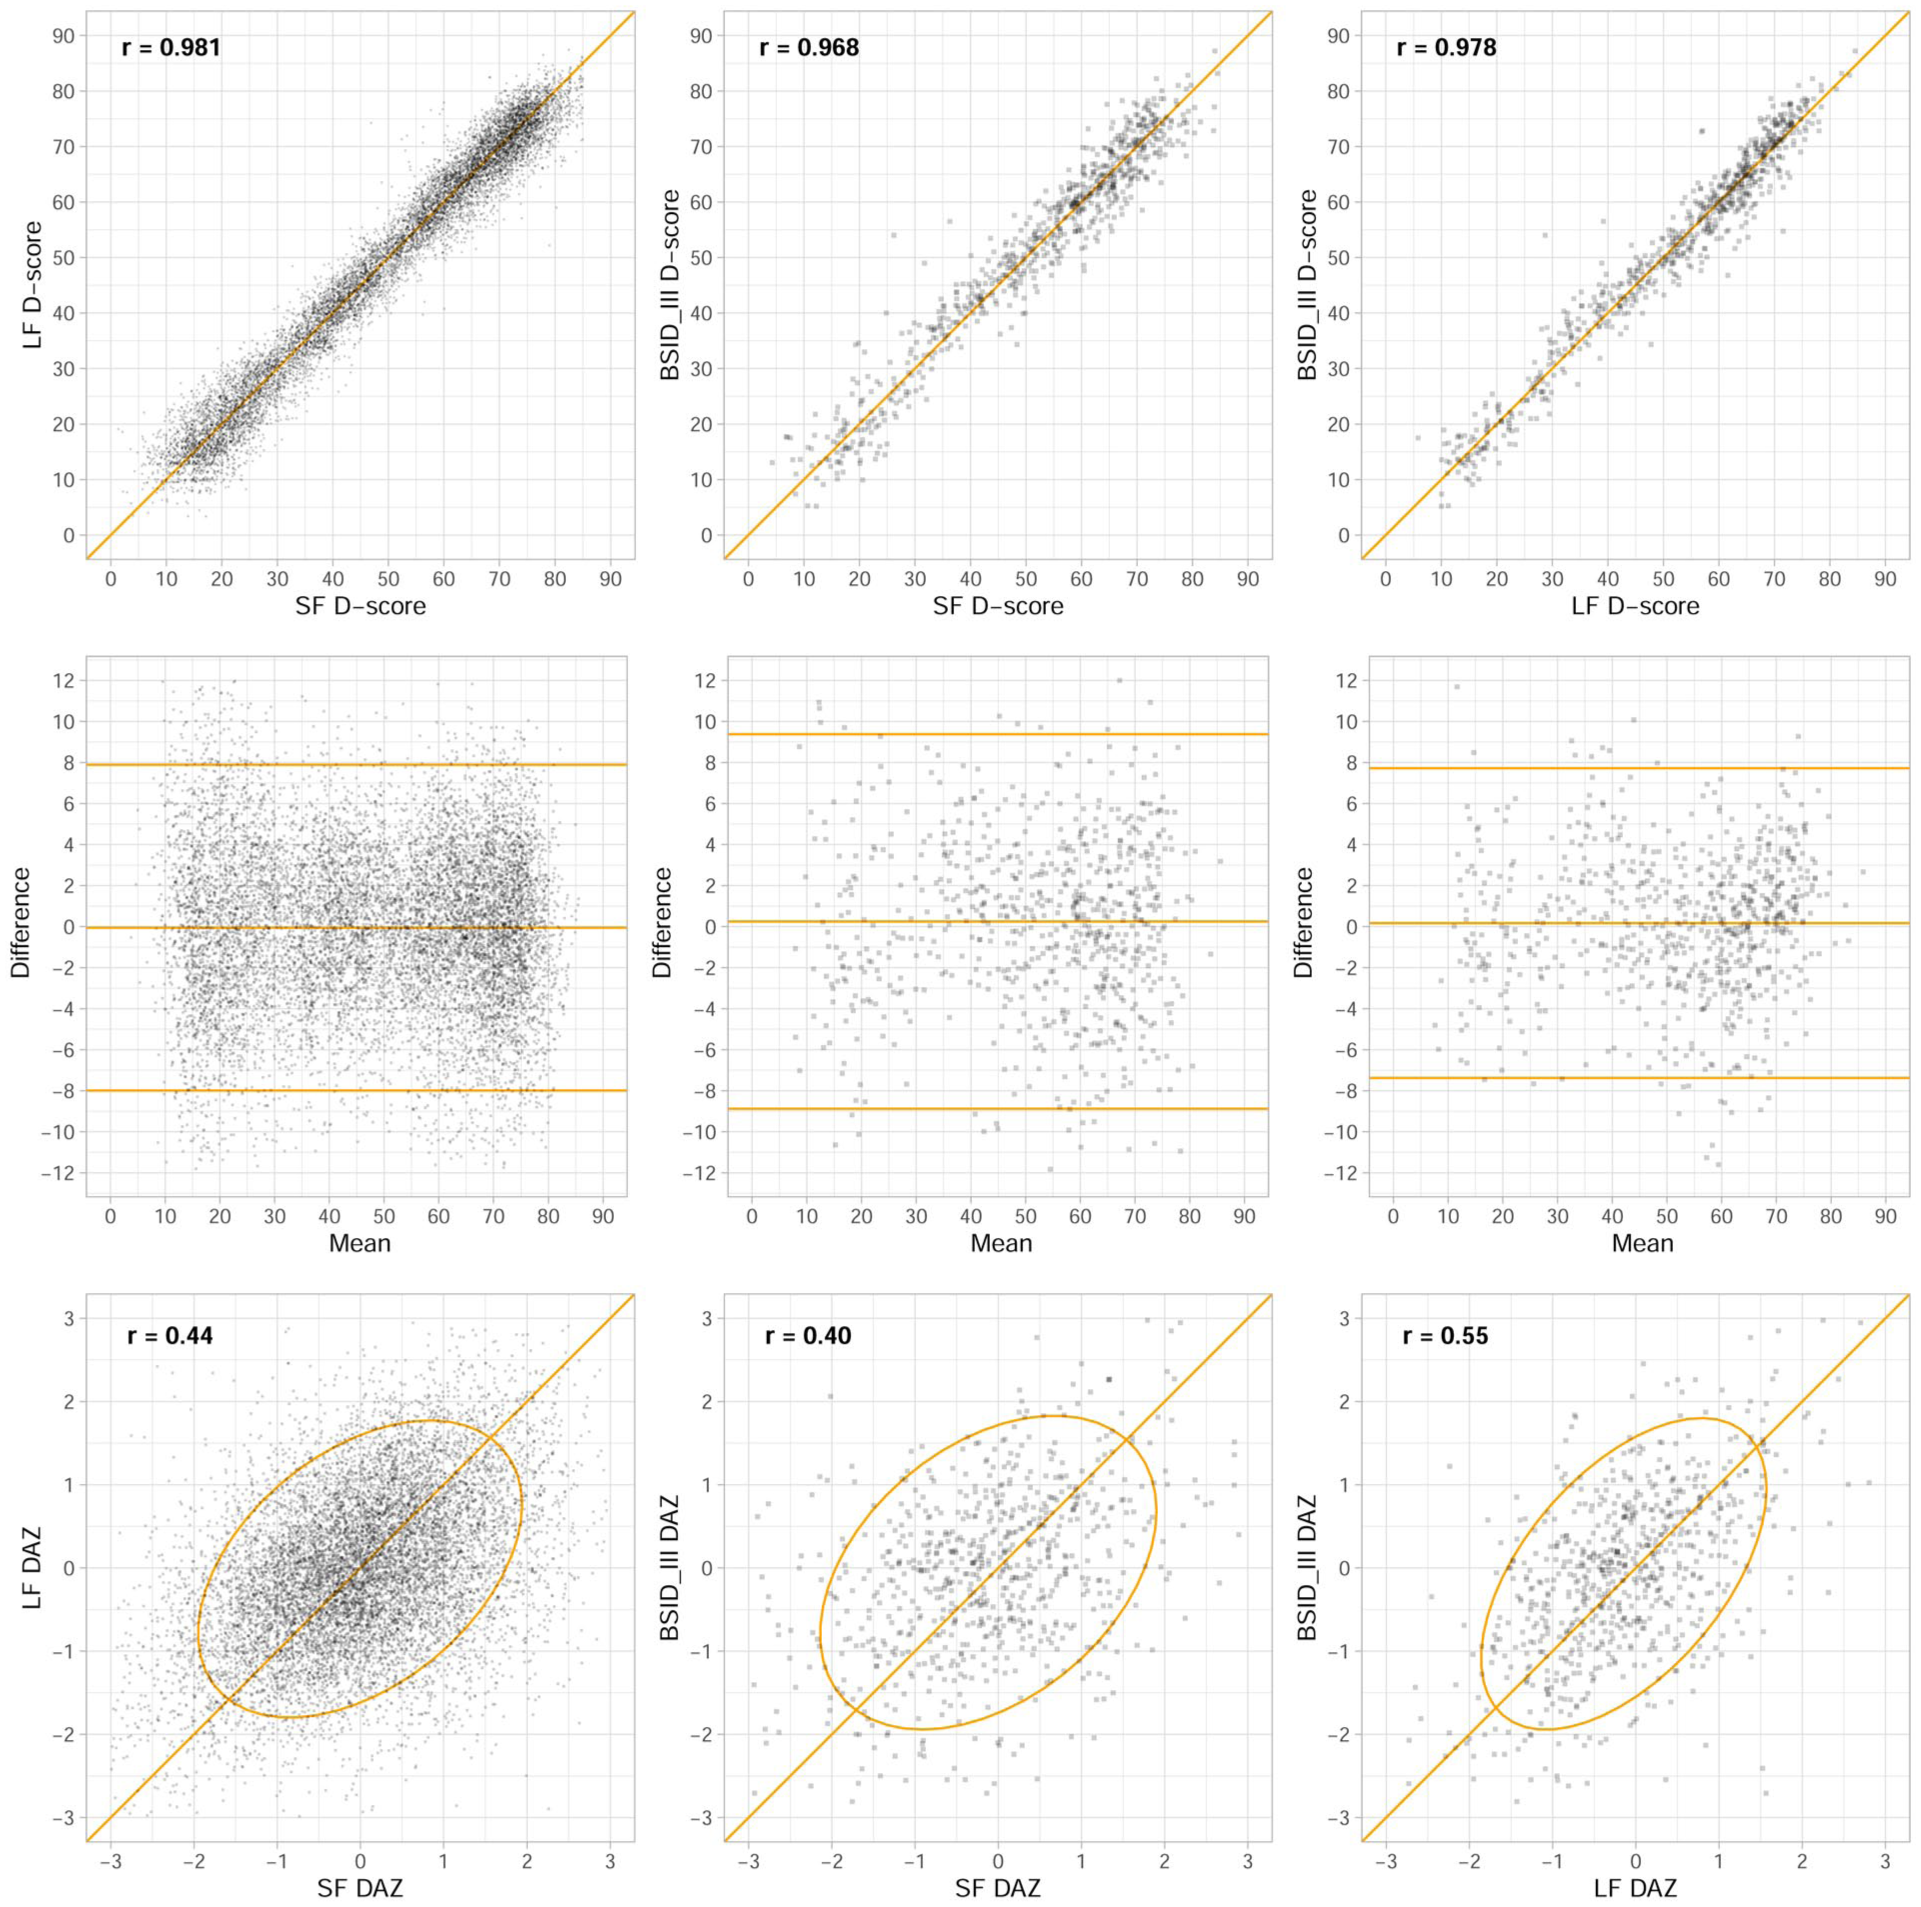
Agreement of D-scores and DAZ values between GSED-LF, GSED-SF, and BSID-III.
Figure 5 summarizes DAZ distributions derived from the BSID-III extension across age groups and sites. GSED sites cluster around a median DAZ of zero, whereas non-GSED sites show greater variability and higher DAZ values in some cases.
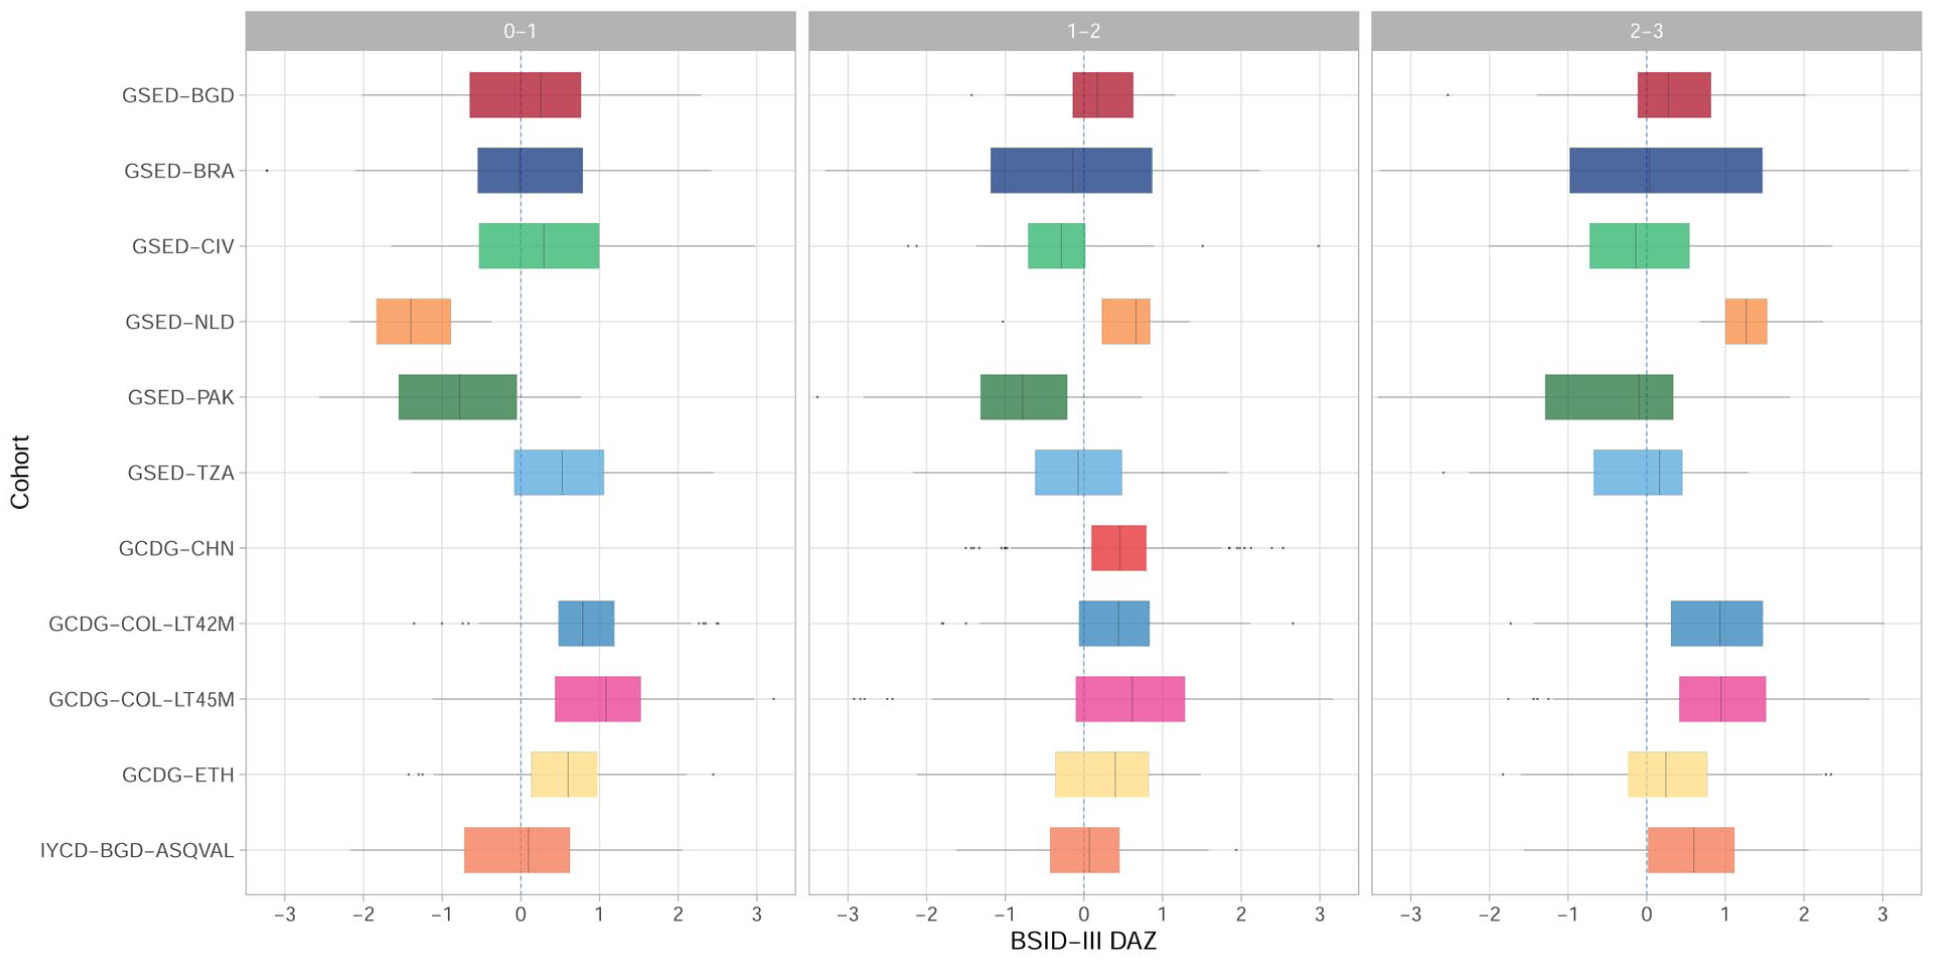
DAZ BSID-III boxplots by three age groups (0–11, 12–23, and 24–35 months) by site collecting BSID-III data.
These results illustrate that the BSID-III extension supports comparable developmental assessment across diverse populations.
Discussion
The proliferation of measures for early child development has led to fragmentation in research, policy, and practice. The GSED core model addresses this challenge by providing a common measurement scale, the D-score, onto which data from multiple measures can be mapped. This article presents an updated version of the core model (GSED2510), developed using data from seven planned sites across diverse settings. The updated model shows good fit to the Rasch model, improved measurement precision, and consistent D-scores across the GSED-LF, GSED-SF, and BSID-III, demonstrating its capacity to harmonize developmental assessments and support cross-site comparisons.
The GSED project has produced three successive D-score keys, reflecting increasing methodological rigor. The most recent key, GSED2510, represents an incremental refinement based on stricter purification and a larger dataset, and we recommend its use as the standard for calculating D-scores.
For clinical or screening purposes, normative references are preferred, but global normative references for key GSED2510 are not yet available. Until such references are established, users should report the reference used when calculating DAZ values.
Development is defined here as abilities that are universally absent at birth and emerge over time. Decomposing measures into individual items enables flexible cross-measure estimation of D-scores, supporting applications such as population monitoring, tailored short forms, adaptive testing, and cross-site comparison of intervention effects.
The D-score is intended for population- and group-level analyses. While it can be computed for individuals, its current formulation may have limited specificity and precision for individual-level decision-making, such as clinical screening or tracking developmental trajectories. Further methodological development would be required for such uses.
The GSED core model is calibrated on data from children aged 0–41 months using the GSED-LF and GSED-SF measures; although the BSID-III extension demonstrates adaptability, further validation is needed for other measures and age ranges.
The model assumes unidimensionality, a common item slope, and dichotomous item responses—assumptions supported for the GSED measures but requiring continued evaluation when extending to new measures, age ranges, or polytomous measures. More flexible modeling approaches may be needed to address domain-specific behavior, differences in developmental speed, and non-dichotomous scoring.
Conclusion
The GSED core model (GSED2510) provides a unified framework for measuring early child development in children under 3 years across diverse measures and settings. Using data from seven sites, the updated model improves measurement precision, extends the latent scale, and yields consistent D-scores across the GSED-LF, GSED-SF, and BSID-III. The extension to BSID-III demonstrates the model’s adaptability and its potential to harmonize assessments across measures, addressing fragmentation in early childhood development research, policy, and practice.
Supplemental Material
sj-docx-1-jbd-10.1177_01650254261451140 – Supplemental material for GSED Core Model: A Unified D-score Scale for Early Child Development From Seven Sites
Supplemental material, sj-docx-1-jbd-10.1177_01650254261451140 for GSED Core Model: A Unified D-score Scale for Early Child Development From Seven Sites by Stef van Buuren, Iris Eekhout, Gareth McCray, Jonathan Seiden, Dana C. McCoy, Melissa Gladstone, Vanessa Cavallera, Tarun Dua and Maureen M. Black in International Journal of Behavioral Development
Footnotes
ORCID iDs

Ethical Considerations
The GSED study received ethical approval from the WHO (protocol GSED validation 004583, approved on 20.04.2020), as well as site-specific IRB approvals. As the work involved de-identified and pre-existing data, no further IRB approval was required for this analysis.
Author Contributions
All authors contributed substantively to this work. SvB and IE conceptualized the paper; SvB drafted the manuscript; SvB, IE, GM, and JS contributed to the statistical analyses; GM collected domain-related data; MG, DMc, MB, VC, and TD provided subject-matter expertise and suggested alternative models. All authors read and approved the final manuscript submission. The GSED Team group author is the consortium of which the present study forms a part.
Funding
The authors disclosed receipt of the following financial support for the research, authorship, and/or publication of this article: This work was supported (in alphabetical order) by the Bernard van Leer Foundation and the Bill & Melinda Gates Foundation. The funders provided financial support. The World Health Organization led the manuscript’s design, implementation, and writing.
Declaration of Conflicting Interests
The authors declared no potential conflicts of interest with respect to the research, authorship, and/or publication of this article.
Data Availability Statement
The study used a mix of existing data and new data. The Bill & Melinda Gates Foundation facilitated data sharing. The original study owners made anonymous data available to BMGF under a mutual Memorandum of Understanding (MOU). The GCDG-CHN, GCDG-COL-LT42M, and GCDG-COL-LT45M data are available in the childevdata R package (van Buuren et al., 2021). For the GCDG-ETH data, contact the original study owners for GCDG (Weber et al., 2019). For the IYCD-BGD-ASQVAL data, contact the original study owners for IYCD (Lancaster et al., 2018). For the GSED data, contact Neerja Chowdhary (WHO).
Disclaimers
The author is a member of the World Health Organization. The author alone is responsible for the views expressed in this publication, and they do not necessarily represent the decisions, policies or views of the World Health Organization. (Applies to Cavallera V, Dua T, Kaur R, Pérez Maillard M and Norton R.)
The views presented here do not represent the Inter-American Development Bank, its board of directors, or the countries it represents. (Applies to Rubio Codina M.)
Registration Details
Registration details Open Science Framework on November 19, 2021 (DOI 10.17605/OSF.IO/KX5T7); identifier: osf-registrations-kx5t7-v1.
Supplemental Material
Supplemental material for this article is available online.
References
Supplementary Material
Please find the following supplemental material available below.
For Open Access articles published under a Creative Commons License, all supplemental material carries the same license as the article it is associated with.
For non-Open Access articles published, all supplemental material carries a non-exclusive license, and permission requests for re-use of supplemental material or any part of supplemental material shall be sent directly to the copyright owner as specified in the copyright notice associated with the article.
