
Abstract
Objective:
Altmetrics are claimed to measure the scientific, societal, educational, technological and economic impacts of science. They have some of these dimensions in common with university ranking and evaluating systems. Their results are, therefore, expected to be partially convergent with the systems’. Given the importance of the scientific and non-scientific impacts of science, this study investigated the correlations of universities’ altmetrics with their total and dimensional scores in Nature Index, Leiden, Times Higher Education (THE) and Quacquarelli Symonds (QS).
Methodology:
Following a correlational design, it explored an available sample of the universities commonly ranked in the systems in 2017. The data were collected from online documents using checklists and analysed by the Spearman correlation. As Altmetric Attention Score (ASS) is efficient in that it integrates several indicators into a single one, it was used as the proxy of the universities’ social performance.
Findings:
The universities showed significant positive correlations between their ASSs and their performance scores on the total and dimensional levels, except for industry income in THE, with an insignificant correlation, and proportion of collaborative publication less than 100 km. in Leiden, with an inverse correlation. The correlations ranged from weak to marginally strong.
Conclusion:
The positive relationships between the universities’ performance and ASSs signified that there existed some similarities in what they measured. However, they were of weak-to-marginally strong powers, implying that the metrics differed in what they measured. The findings contribute to the existing knowledge by providing some evidence of convergence between university-level altmetrics and university performances in various dimensions.
Keywords
1. Introduction
Globalisation of higher education has given rise to the idea of world-class universities, leading to widespread needs and demands of the governments, employers, alumni and students for knowledge about the universities’ performance and quality [1,2]. In response, several university ranking systems have been developed at national, regional and global levels. Endeavouring to reflect an inclusive picture of the universities’ performances, some ranking systems follow complicated methodologies encompassing multiple performance dimensions and indicators with different weights. Education, industry income, collaboration, impact and research are among the well-known performance dimensions used in Shanghai World Universities (Academic Ranking of World Universities (ARWU)), Quacquarelli Symonds (QS) and Times Higher Education (THE) World University ranking. The two latter are even more complicated, because they also conduct surveys to measure attitudes and opinions of academicians, scientists or employers about the universities’ reputation and prestige.
Despite all their advantages, complicated methodologies applied in ranking systems may bring about negative results. For example, surveys are believed to cause subjectivity and, hence, biased results [3]. Being dependent on the universities’ contributions and self-declarations in some aspects, the ranking systems are less efficient and reliable [4]. However, as university roles, functions and missions have inextricable and interwoven relationships, an indicator may reflect far beyond the boundaries of the role or the mission which it is specifically devised to measure. For example, the academic staff and the graduate students engaged in both education and research represent educational development as well as research potentials of a university. The same can be true for research status and university–industry ties. Consequently, some evaluation and ranking systems, such as Nature Index and Leiden Ranking of Centre for Science and Technology Studies (CWTS), adhere to rather simple and hence more efficient methodologies.
However, previous studies supported that the results of these two kinds of ranking systems were correlated to some extent, actually not strong enough to measure identical things and mirror identical facts [5–8]. Moreover, the indicators used in evaluating the university performances may be subject to the deficiencies, and hence the criticisms. For instance, citation-based indicators, which have been increasingly used in measuring and evaluating scientific contributions [9], get high weights in the university rankings [4]. Although they can offer a vision on the importance and the credits of the contributions, they suffer from such drawbacks as failing to measure different layers and types of research impacts [10], being limited to the formal impacts, and missing the informal impacts on non-author classes of society [11], requiring a long period to reach an acceptable peak [12] and being limited regarding the number of both cited and citing documents [13]. These deficiencies urge for surrogate or supplementary metrics.
Altmetrics or alternative metrics, derived from actions and reactions of social web users, are recently devised to map web-based scholarly communication and interaction [14]. The altmetric data are shortly accumulated and quickly formed [15,16]. They are also able to measure different types of impacts of scholarly contributions [17], far beyond the limits of citation databases, on different layers of society who are not necessarily authors [18,19]. The altmetrics’ capacities have been found promising in improving the results of traditionally citation-based evaluations [15]. However, Sud and Thelwall [12] warned against any early and hurriedly use of altmetrics before examining and validating the claims.
University ranking systems can provide a test bed for further verification of the altmetrics abilities. The metrics are claimed to measure different types of impacts, including scientific, societal, educational, economic and technological [17,20–22], which seem almost similar to the performance dimensions measured by university ranking systems. It is, therefore, probably that altmetric analysis yields results similar to those of the performance analysis conducted by the ranking systems. Correlational studies of altmetrics and university ranking systems may clarify their degrees of convergence or divergence. To this aim, this study analysed the correlation between the results of the social performance of the universities as measured by Altmetric Attention Score (AAS) and their performances in the dimensions gauged by Nature Index, QS, THE and Leiden ranking systems. AAS represents a weighted approximation of article performance in a wide range of social media, including News, Blogs, Policy documents, Patents, Wikipedia, Twitter, Peer review services, Weibo, Google+, F1000, Syllabi, LinkedIn, Facebook, Reddit, Pinterest, Q&A and YouTube. 1 Although AAS still needs to be validated and adjusted in terms of its algorithm and weighting scheme, and to include appropriate social media sources [23], it is sound and consistent [24] and advantageous in the sense that it covers altmetrics from a wide range of social media, and integrates them into a single efficient indicator.
The rationale of choosing the ranking systems lies in the fact that they are highly renowned and have similarities and differences in their methodologies. Focusing on just research outputs and ignoring other performance dimensions, Nature Index and Leiden ranking system can be grouped as simple systems. However, they have differences. While the former covers a very limited collection of journals meticulously selected based on the evaluations by top scientists, with no appeal to citation-based metrics, 2 the latter relies on the analyses of citations and publications covered in Scopus [25]. On the contrary, THE and QS ranking systems are rather complicated systems that go beyond the research productivity and impacts and measure other performance dimensions such as international outlook, industry income and employers’ opinions.
2. Literature review
2.1. University ranking as a challenging issue
Evaluation of universities is believed to be potentially advantageous for academia, society and the world, because it can increase accountability and responsibility of universities, orient their managerial strategies and behaviour, and improve their competitiveness and human capital. These may expedite globalisation and internalisation of higher education, result in university involvement in national and international debates, increase the collaboration between the academia and the community and ultimately improve general welfare [26,27].
However, the world academic ranking systems are doubted to actually realise the perceived advantages given the existing deficiencies and pitfalls [26] especially in their methodologies [28–30]. First, the indicators used in the ranking systems for measuring the academic performances are found insufficient or unsuitable for promoting policy decisions, consumer choice or research improvement [31–33]. The systems are essentially criticised for neglecting actual scientific innovation and contribution by their common and heavy reliance on citations and publications [34] that may not necessarily signify genuine scientific contributions [35,36].
The methodologies are affected by technical fallacies [37], variable co-linearity and data redundancy [6,33,37–40]. They also lack normalisation measures, standards and data transparency, reliability and availability [26,34,39,41–43]. All these, along with the limitations brought about by their reliance on surveys and specific databases [26,41] are believed to obscure their authenticity, distort their results and undermine their validity, reliability and replicability [37,39,42].
The ranking systems are also believed to be biased in favour of developed countries, leading universities [26,29,39,44–46] and certain fields and languages [26,41,47,48]. The impartiality of the results is supposed to be specially endangered in those ranking systems relying on surveys. Being subject to validity, reliability and measurability shortages [34], the surveys not only raise bias for certain countries [6] but also fail to truly reflect academic quality [31,42,49–52].
Moreover, despite reasonable similarities between the world ranking systems [6], there are intersystem inconsistencies in their information resources and ranking methodologies (e.g. in terms of indicators, weights and emphases) [6,33,39]. Consequently, a comprehensive evaluation of academic performance would be achieved by multiple ranking systems [33], using multiple performance dimensions [51].
Last but not least, deficiency of the academic ranking systems is that they do not measure the social and economic impacts of universities [52–54], the THE Impact Ranking being an exception (It concentrates on measuring the involvement of universities in sustainable development goals relating to poverty, inequality, climate change, environmental degradation, peace and justice.). The ranking systems are, therefore, believed to be in serious needs of a quality improvement in measuring the actual quality and impacts of academic activities in relation to society, economy, health and human capital formation [34,55–57].
Consequently, in the status quo, the ranking systems not only are fallible in representing the actual impacts and quality of science, but also the pressure imposed by the bragging culture gives rise to a false and non-constructive competition, making the universities using the ranking results as a reference for policy-making and strategic planning [27,58]. To achieve the goal, they would invest their time, money and efforts in improving their positions rather than in actual development in their crucial missions such as learning, teaching or community involvement [26].
2.2. Altmetrics
Social web has opened up a new research area to evaluate different features of scholarly articles’ impacts. Since the advent of altmetrics, numerous studies have been carried out to test the correlation between the traditional citation-based metrics and the social metrics created by users’ actions and reactions in social media. The results of the studies are inconsistent regarding the significance of the correlations between these two kinds of metrics: one is closer to the scientific pole and the other is closer to the social pole of the recognition continuum. Thelwall and Kousha [59] rejected any correlations between the traditional bibliometric measures and Academia.edu metrics. However, Sotudeh et al. [60], Li, Thelwall & Giustini [61], and Mohammadi and Thelwall [62] observed significant correlations of citations with Mendeley Readership and CiteULike bookmarks. The studies confirming the significance acknowledged the altmetrics’ potentials in creating added values to research evaluations [63], effectively measuring research impacts [61], transferring knowledge between disciplines, providing quick evidence of research influence [62], and measuring and evaluating different aspects of scientific performances [64,65]. However, the points are not strong enough to prescribe the measures as a substitution, but a supplement, to citation analysis [66].
The results of previous studies are also inconsistent in terms of the correlation powers. For instance, Piwowar and Hemminger [63] and Barakat et al. [67] reported a moderate correlation between altmetrics and citations, while Torres-Salinas et al. [68] reported them weak to moderate. Mohammadi and Thelwall [62] confirmed the correlation to be moderate. Ortega [64] revealed that there existed weak correlations between the altmetrics derived from ResearchGate, Academia and Mendeley, on one hand, and the bibliometric indicators extracted from Google Scholar and Microsoft Academic Search, on the other hand. The weakness of the correlations was also confirmed in Costas et al. [66], Nuredini and Peters [69] and Barbic et al.’s studies [70]. However, Thelwall and Wilson [65] indicated that Mendeley Readership and citations were strongly correlated in the medicine-related areas.
As observed, the studies rather focused on the correlations between the indicators. The investigation of Thelwall and Kousha [71] is the sole in examining and confirming the significance of the correlations between ResearchGate metrics (including RG Score, total publications, impact points, views and downloads) and the results of the university ranking systems. They concluded that altmetrics derived from scientific social networks seemed to partially reflect the traditional academic capital.
2.2.1. ASS
As a convenient, real-time, automatically calculated indicator, that dynamically reflects the public attentions to scholarly papers from a plethora of social platforms [72,73], AAS has been increasingly used in research communication channels [74]. It has been found to be significantly correlated to citations at article and journal levels, with the latter being more powerful (r = 0.30 vs r = 0.61, respectively) [69]. Huang et al. [23] found AAS to be correlated with the citations in medicine, but not those in biology. Dixon and Baker [75] and Barakat et al. [76] did not find it to be significantly correlated with citations.
The measure is believed to be advantageous in terms of the measures taken to control for probable manipulation and bias. The rationale underlies the exclusion of Mendeley and CiteULike reference managers from the metric, as the identities of the mentioning users cannot be fully determined [77]. However, the policy turned out to be a target for criticism, given the importance and academic nature of the media [74].
AAS calculation method has been also questioned in terms of transparency, reliability, validity, interdependence of components, and data consistency and completeness [74]. Furthermore, the composition of different metrics into a single score is considered oversimplification of multidimensional notions of quality and impact, with curvilinearly related components [77]. This may pave the path to misuse in future. The measure also suffers from the lack of normalisation or standardisation of data and number rounding method [74].
2.3. Concluding remarks
The results of the previous literature are not consistent regarding the correlations between citations and altmetrics. While some investigations rejected the significance of the correlations, some others reported significant weak-to-strong associations. The differences may have roots in the studies’ differences in terms of the altmetrics, the social media, the subject areas and the time spans chosen. The only study concentrating on the correlation between altmetrics and the results of the university ranking systems limited itself to a single social media (ResearchGate), while different social media and networks have different functions, and their users may react to scholarly articles in different ways. As a result, to examine the relationship between the universities’ social and academic performances, this study concentrated on AAS, which is the resultant of many types of altmetrics, and university performance scores as measured in well-known university ranking systems with simple or complicated methodologies. AAS limitations being acknowledged, they do not limit us to use the indicator as an exploratory tool to identify social attentions to scholarly papers [78].
3. Research methodology
Using a correlational design with altmetric and content analyses methods, this study investigated the correlations between the university social performances, as measured by the annual mean values of their articles’ AAS (hereinafter briefly referred to as mean AAS) and the academic performance scores as reflected in Nature Index, QS, THE and Leiden ranking systems. Given the systems’ differences in their top-ranked universities, an accessible sample of 423 universities, commonly evaluated and ranked by the ranking systems in 2017, was selected using the intersection of the top-ranked universities’ lists.
The university performance scores were extracted from the websites of the above-mentioned ranking systems. Relying on the analysis of the publications of the previous year, Nature Index differs from THE, QS and Leiden which concentrate on the past 4-to-5-year publications. To offset the differences and approximate the publication time windows, the annual mean of each university’ score in each of the Nature Index indicators in 2012–2017 was calculated.
QS and THE report the ranks of bottom-ranked universities in intervals without clearly announcing their total scores. Consequently, we had to calculate their total scores using the methodologies declared in the systems. In order to validate the scores obtained in this way, we concentrated on those universities which their total scores were precisely reported and verified the correlation of the calculated scores with those publicised by the systems. The result signifies a strong positive correlation for THE (r = 1.000) and QS (r = 0.987).
Altmetric values including AAS and its components, as well as Dimensions Citations and Mendeley Readership were obtained via the free access courtesy of Altmetric.com in October and November 2018. To do so, we first searched the name of the universities and their variations in Web of Science (WoS) databases using the OG field. The searches were limited to the research articles, reviews, research notes, letters and conference papers in 2012–2017 applied in the ranking systems for the evaluation year of 2017. The total number of the articles was 10,296,267. Their bibliographic information, including DOI of the articles, was downloaded and searched in Altmetric.com. 11.22% of the papers with no DOI were not accessible and were, therefore, excluded from the sample. Of those papers with DOI, 60.13% were found in Altmetric.com. The mean AAS values were calculated for the papers affiliated to each university.
3.1. Data analysis
Given the non-normality of the data proved by Kolmogorov–Smirnov test, the data were analysed by the Spearman correlation analysis. The strengths of the correlations were interpreted based on their coefficients (r). Accordingly, the correlation is strong if r>0.7, moderate if 0.5 ≤ r ≤ 0.7 and weak if r<0.5 [79].
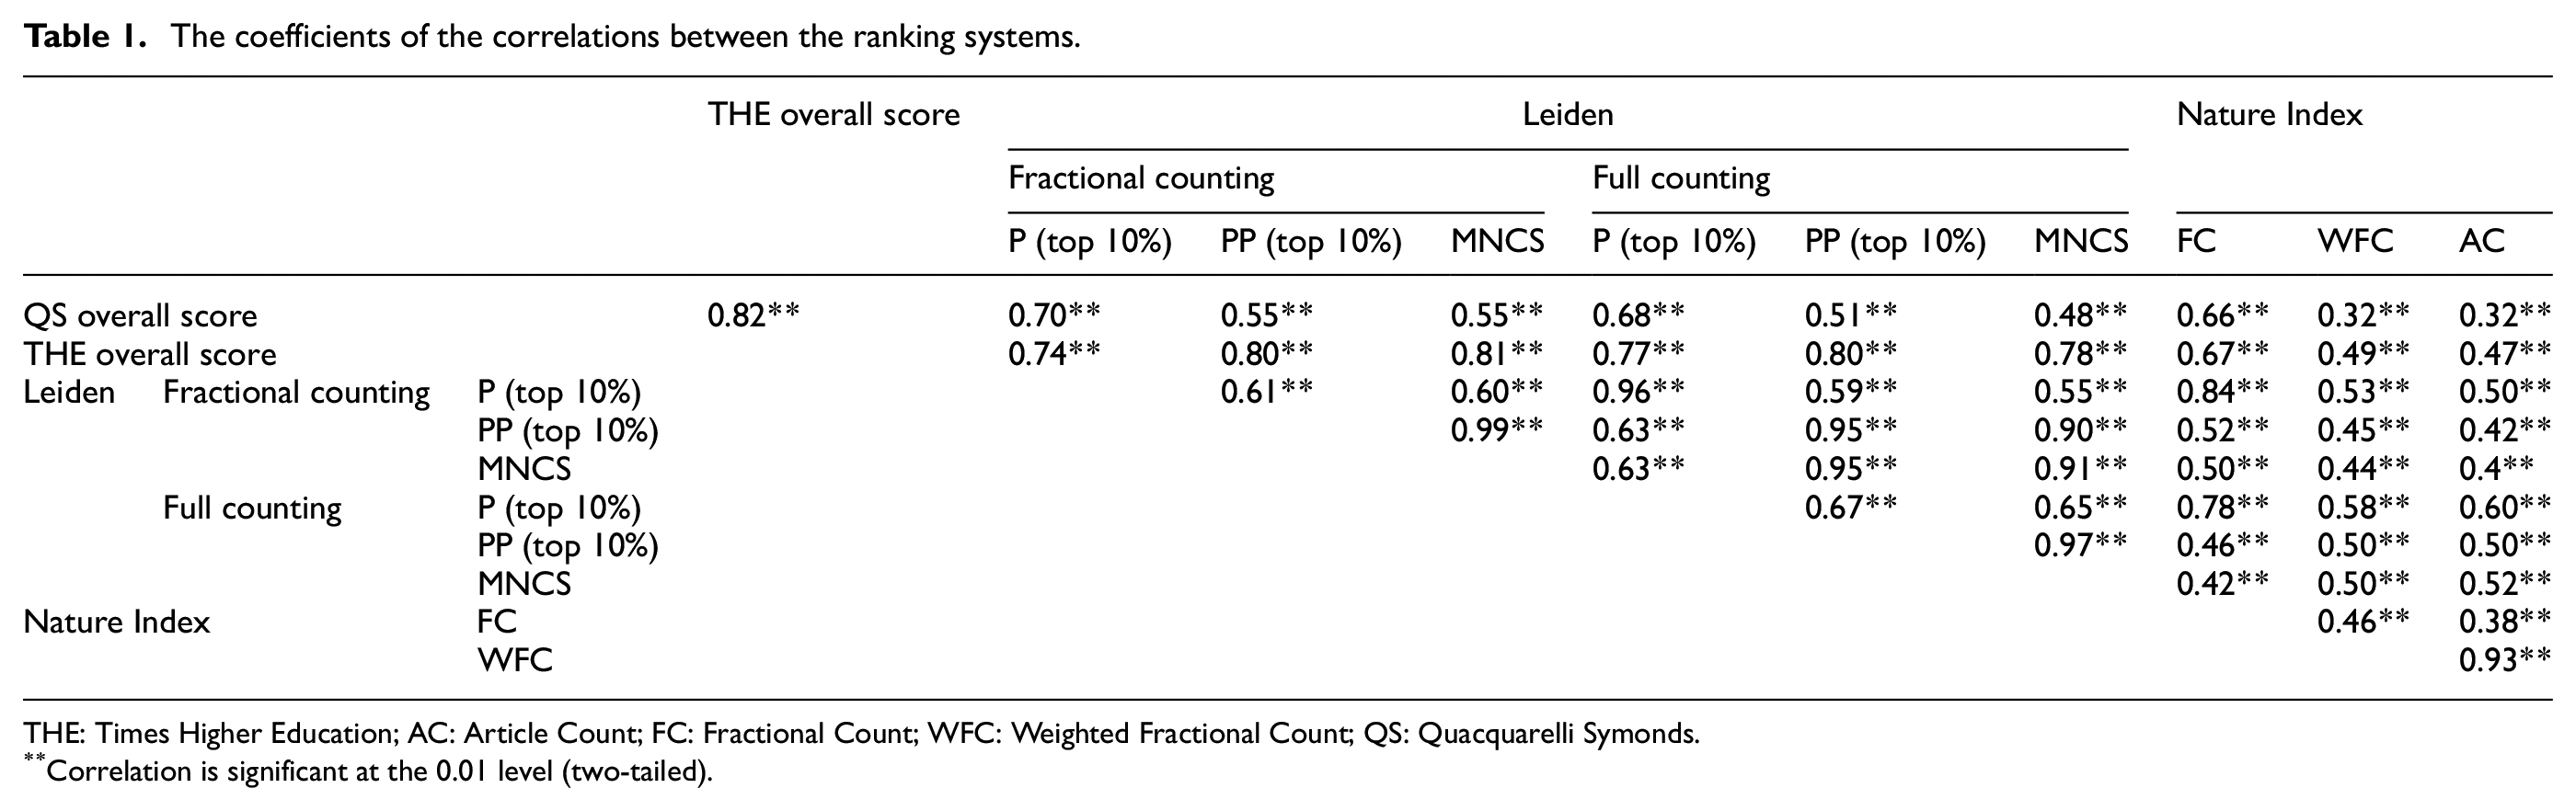
Previous studies confirmed the significance of the correlations between university ranking systems. However, it is necessary to update the information and also provide insights into the Nature Index that was not previously studied. Table 1 represents the coefficients of the correlations between the ranking systems. In order to be concise regarding Leiden system, which lacks an overall calculation of the performance dimensions, just four of its indicators are displayed. As seen in the table, the results of the ranking systems were significantly correlated within and between the ranking systems, although with different powers, from weak to strong.
The coefficients of the correlations between the ranking systems.
THE: Times Higher Education; AC: Article Count; FC: Fractional Count; WFC: Weighted Fractional Count; QS: Quacquarelli Symonds.
Correlation is significant at the 0.01 level (two-tailed).
The most powerful correlations between the ranking systems were observed between the THE and QS (r = 0.82), Leiden’s PP (top 10%) (r = 0.80) and MNCS (r = 0.81). The weakest correlations were observed between the QS and the Nature Index’s Weighted Fractional Count (WFC; r = 0.32) and Article Count (AC; r = 0.32). Although no full correlations were observed between the systems, some almost full correlations were observed between the indicators within the ranking systems. For example, within the Leiden system, there exist high correlations between the full and fractional counts of P (top 10%) (r = 0.96), and between MNCS and the full and fractional counts of PP (top 10%) (r = 0.97 and r = 0.99, respectively). Also, within the Nature Index, AC and WFC indicated a high correlation (r = 0.93).
4. Findings
4.1. The correlation of the universities’ altmetric mean values with their performance scores in the ranking systems
As mentioned previously, AAS has the advantage of being efficient in representing the attentions received by scholarly papers in several social media. However, it does not include some important metrics like Mendeley Readership or citations. Moreover, the rationale underlying its weighting method is not clear. Consequently, it is first necessary to have an insight about how the universities’ performance scores in the ranking systems correlate with individual altmetrics at the university level.
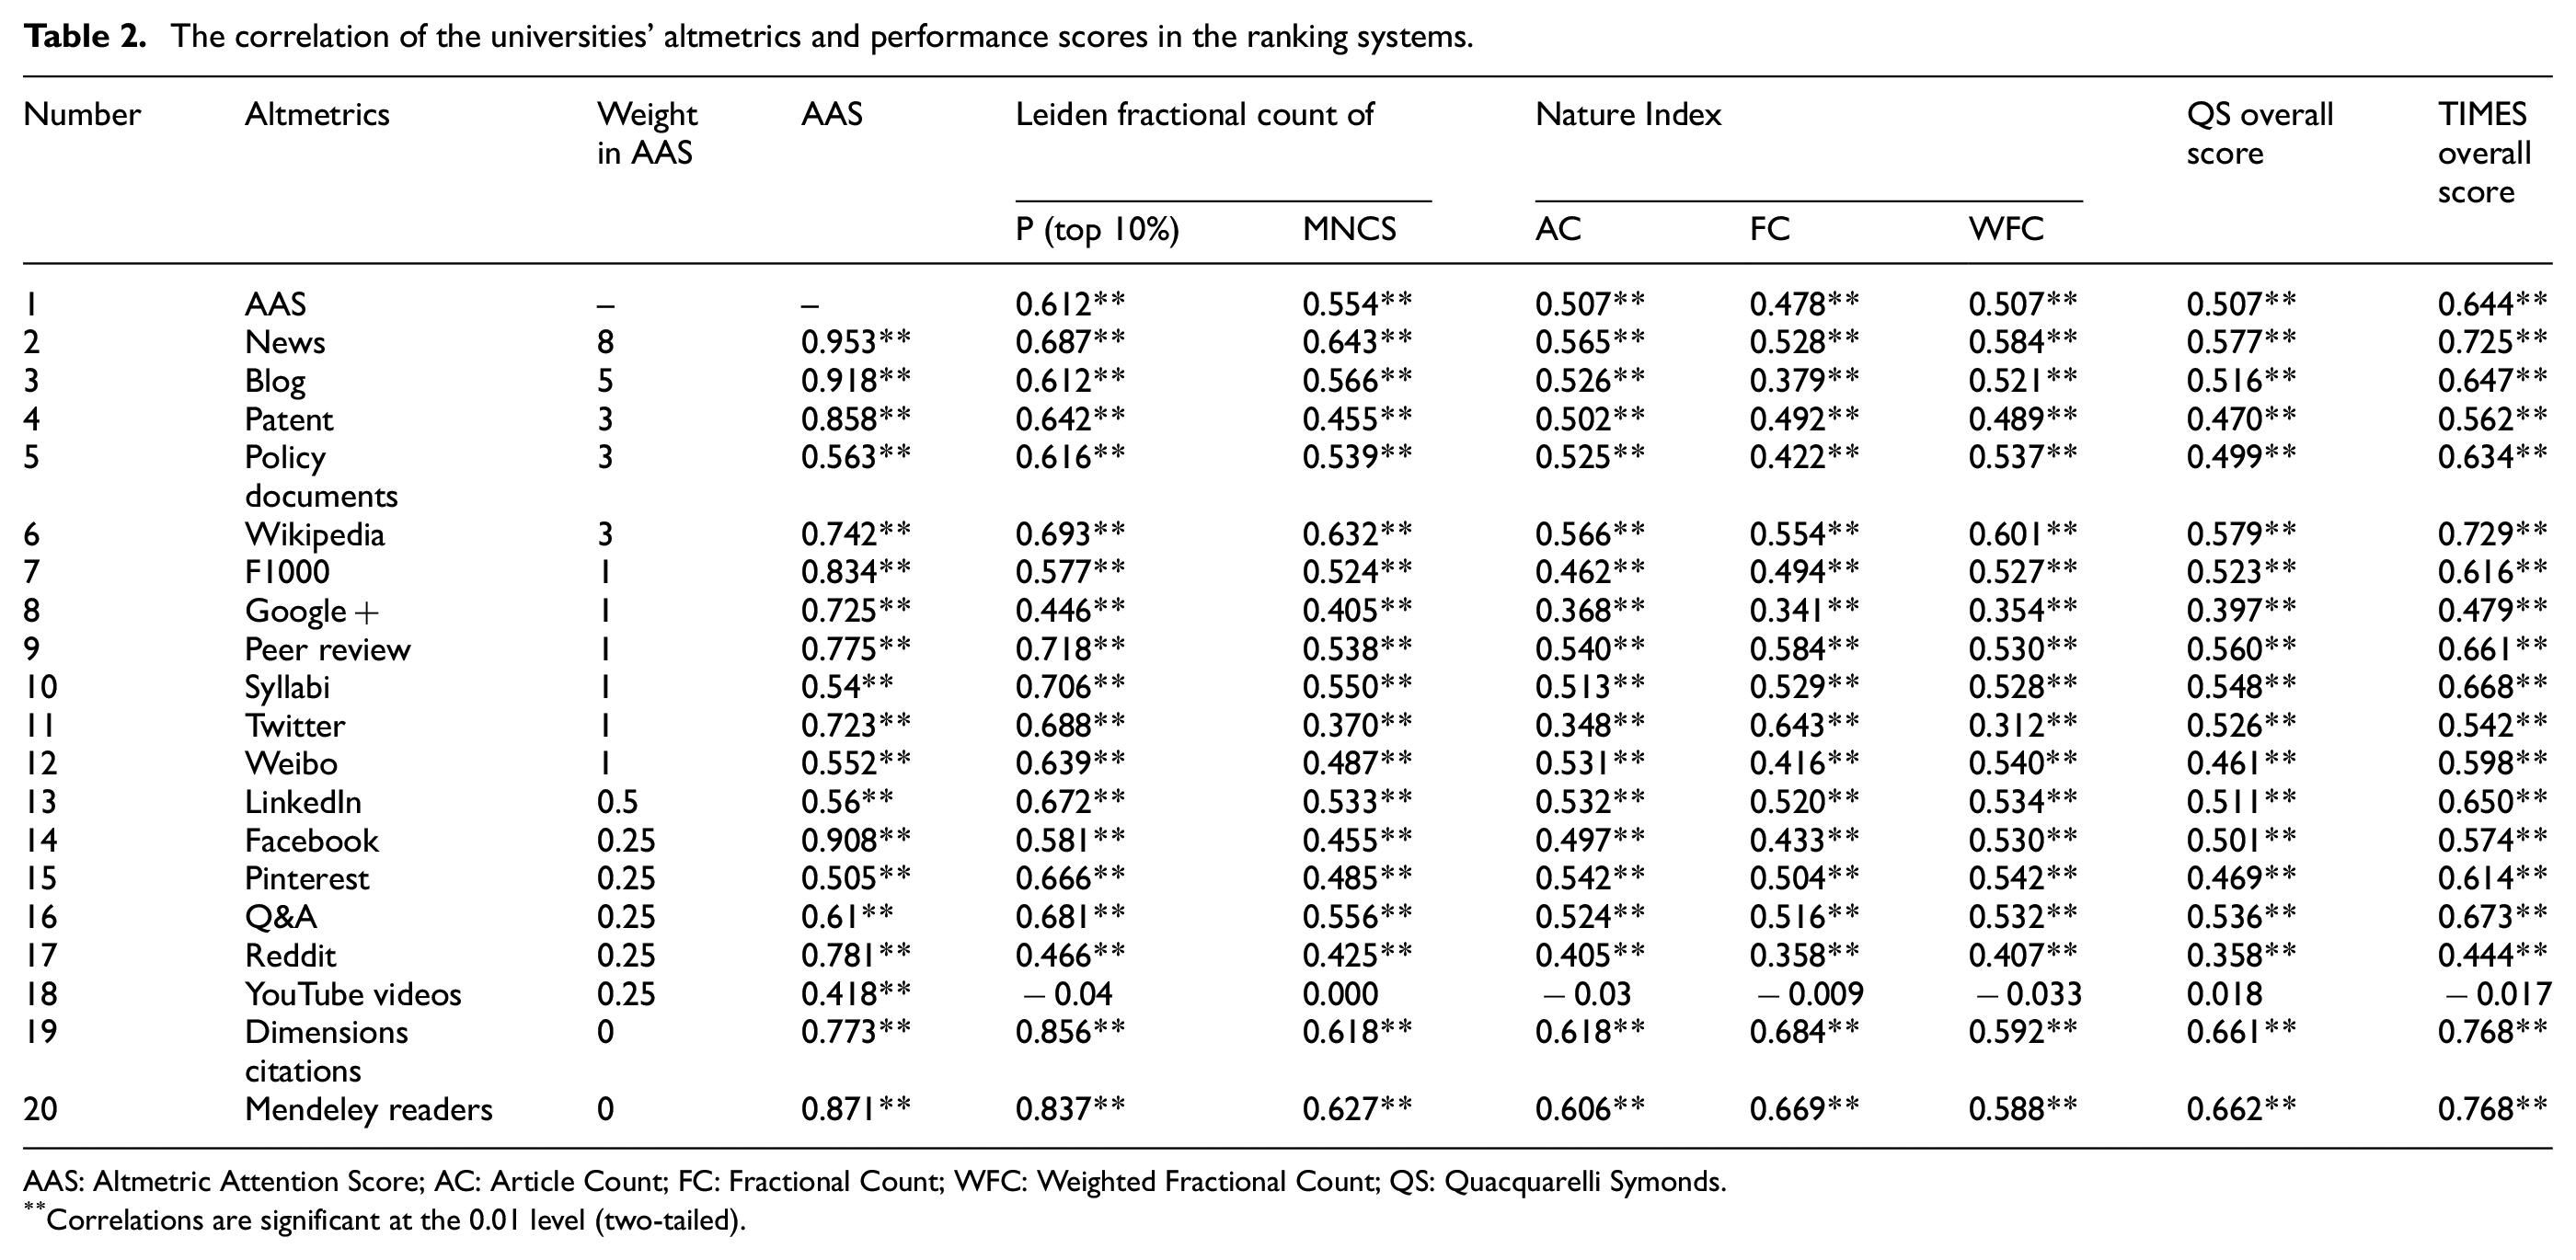
Ordered by the altmetrics’ weights in AAS, Table 2 summarises the results of the correlations. As seen, all of the altmetrics were significantly correlated to the performance scores in the university ranking systems, except for YouTube videos. The significant correlations ranged from weak (r = 0.312 for WFC in the Nature Index vs Twitter counts) to strong (r = 0.856 for the Dimensions citations vs P (top 10%) in Leiden). These included AAS along with those altmetrics included in its calculation (rows 2–18) and those excluded from it (rows 19 and 20).
The correlation of the universities’ altmetrics and performance scores in the ranking systems.
AAS: Altmetric Attention Score; AC: Article Count; FC: Fractional Count; WFC: Weighted Fractional Count; QS: Quacquarelli Symonds.
Correlations are significant at the 0.01 level (two-tailed).
Moreover, the analyses of the correlations of mean AAS with the individual altmetrics showed that it was significantly correlated to all of them, either included in or excluded from its calculation. The correlations were strong for the average citation counts in Dimensions (r = 0.773, significance = 0.000) and the average Mendeley Readership (r = 0.871, significance = 0.000). Accordingly, although it does not seem reasonable to exclude these two dimensions from a metric claiming to consider the ‘online activity surrounding a particular research output’ [74], it is statistically sound because they end up to reflect almost similar pictures, at least at the university aggregation level. On this basis, it seems reasonable to concentrate on AAS as a representative of the universities’ social performances.
4.2. The correlation of the universities’ mean AAS with THE scores
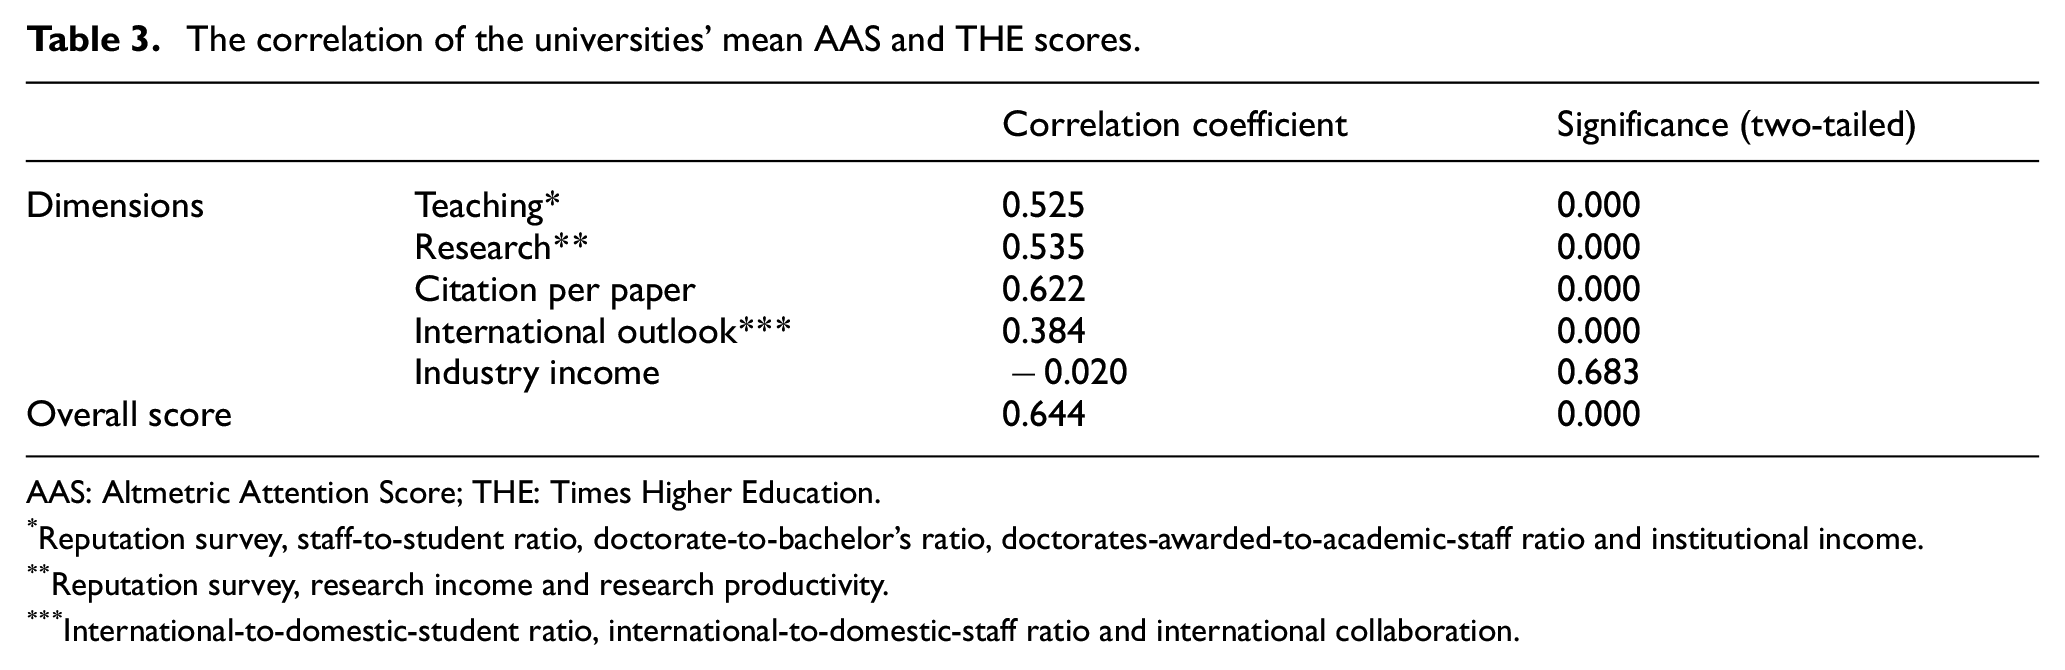
Table 3 represents the correlation of the universities’ AAS mean with their performance scores in THE. As seen, AAS mean values show significant positive correlation with the total score in THE (r = 0.644) with 99% of confidence interval. The correlation power can be estimated to be moderate. Moreover, the correlations are significant and positive concerning all dimensions, except for the industry income, which shows a negative, although insignificant, correlation. The size effects can be estimated to be moderate for teaching (r = 0.525), research (r = 0.535) and citation per paper (r = 0.622). However, the correlation power is weak for international outlook (r = 0.384).
The correlation of the universities’ mean AAS and THE scores.
AAS: Altmetric Attention Score; THE: Times Higher Education.
Reputation survey, staff-to-student ratio, doctorate-to-bachelor’s ratio, doctorates-awarded-to-academic-staff ratio and institutional income.
Reputation survey, research income and research productivity.
International-to-domestic-student ratio, international-to-domestic-staff ratio and international collaboration.
4.3. The correlation of the universities’ mean AAS with QS scores
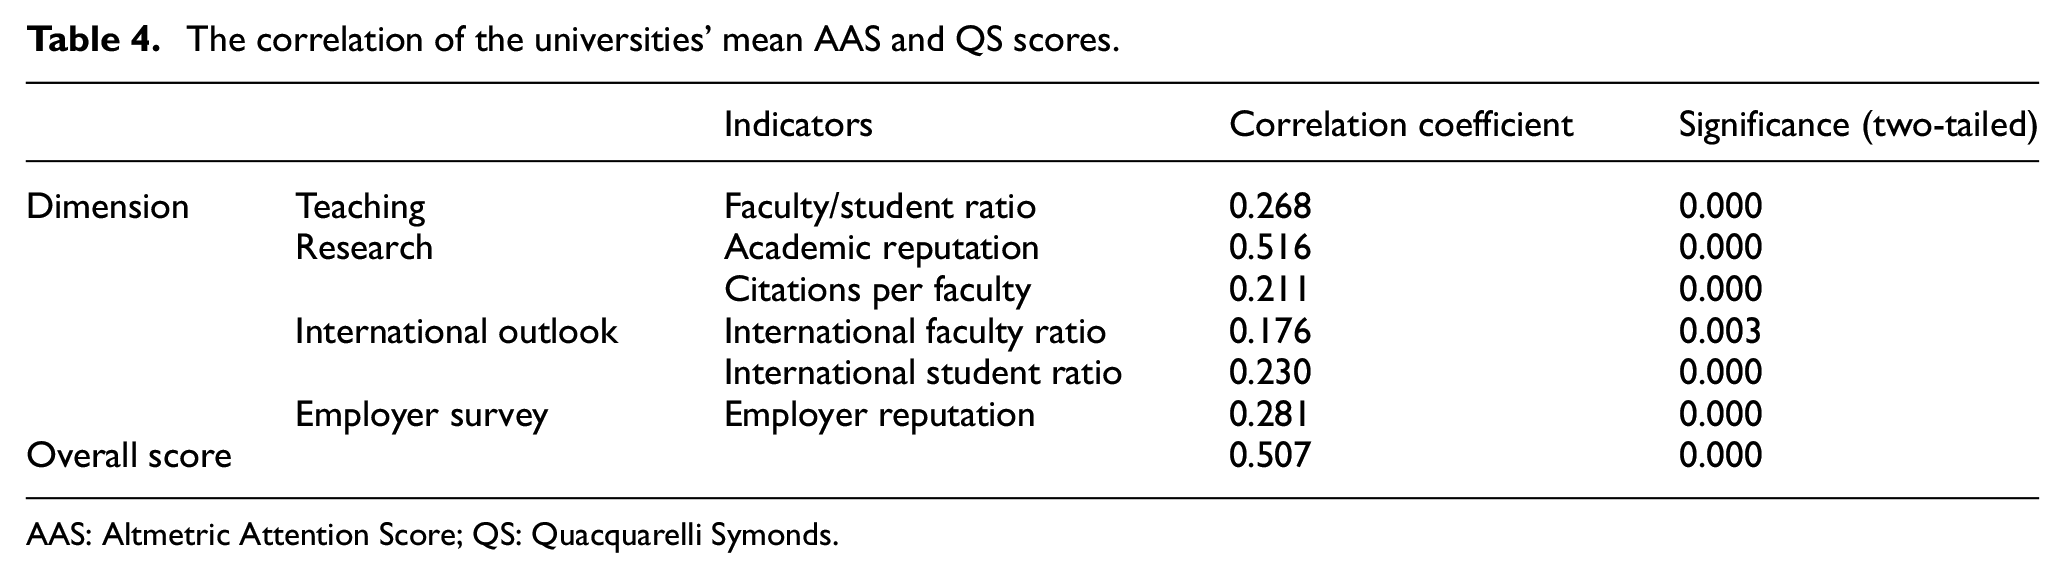
According to Table 4, the overall scores of the universities evaluated by QS show significant positive, rather moderate correlation with their mean AAS (r = 0.507). Among the indicators, academic reputation in the research dimension is the sole one indicating a moderate correlation (r = 0.516). Other indicators are revealed to be weakly correlated with mean AAS; these include faculty/student ratio (r = 0.268), citations per faculty (r = 0.211), international faculty ratio (r = 0.176), international student ratio (r = 0.230) and employer reputation (r = 0.281).
The correlation of the universities’ mean AAS and QS scores.
AAS: Altmetric Attention Score; QS: Quacquarelli Symonds.
4.4. The correlation of the universities’ mean AAS with Nature Index scores
Among Nature Index’s indicators, which are all significantly correlated with mean AAS, AC and WFC show marginally moderate correlation (r = 0.507), but FC is found to have weak association with the altmetric indicator (r = 0.478) (see Table 5).
The correlation of the universities’ mean AAS and Nature Index scores.
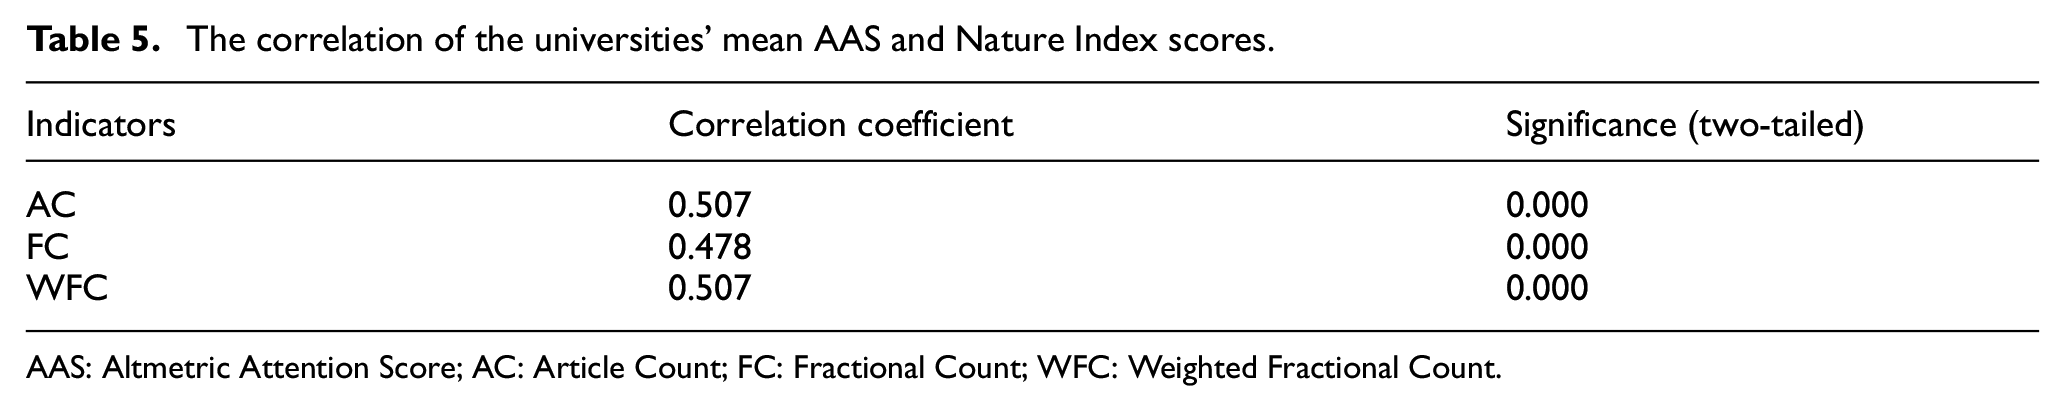
AAS: Altmetric Attention Score; AC: Article Count; FC: Fractional Count; WFC: Weighted Fractional Count.
4.5. Correlation of the universities’ mean AAS with Leiden scores
The results of the correlation analyses for Leiden indicators are summarised in Table 6. It should be mentioned that in the ranking system, the criteria were calculated at two levels including size-dependent and size-independent. While the former takes absolute values into account, the latter is proportional to the size of a university’s productivity and, hence, fairer to compare larger and smaller universities. Moreover, the indicators within the scientific impact dimensions were calculated at two levels including full and fractional counting, with the latter normalising the counts for the papers co-authored by more than one university.
The correlation of the universities’ mean AAS and Leiden scores.
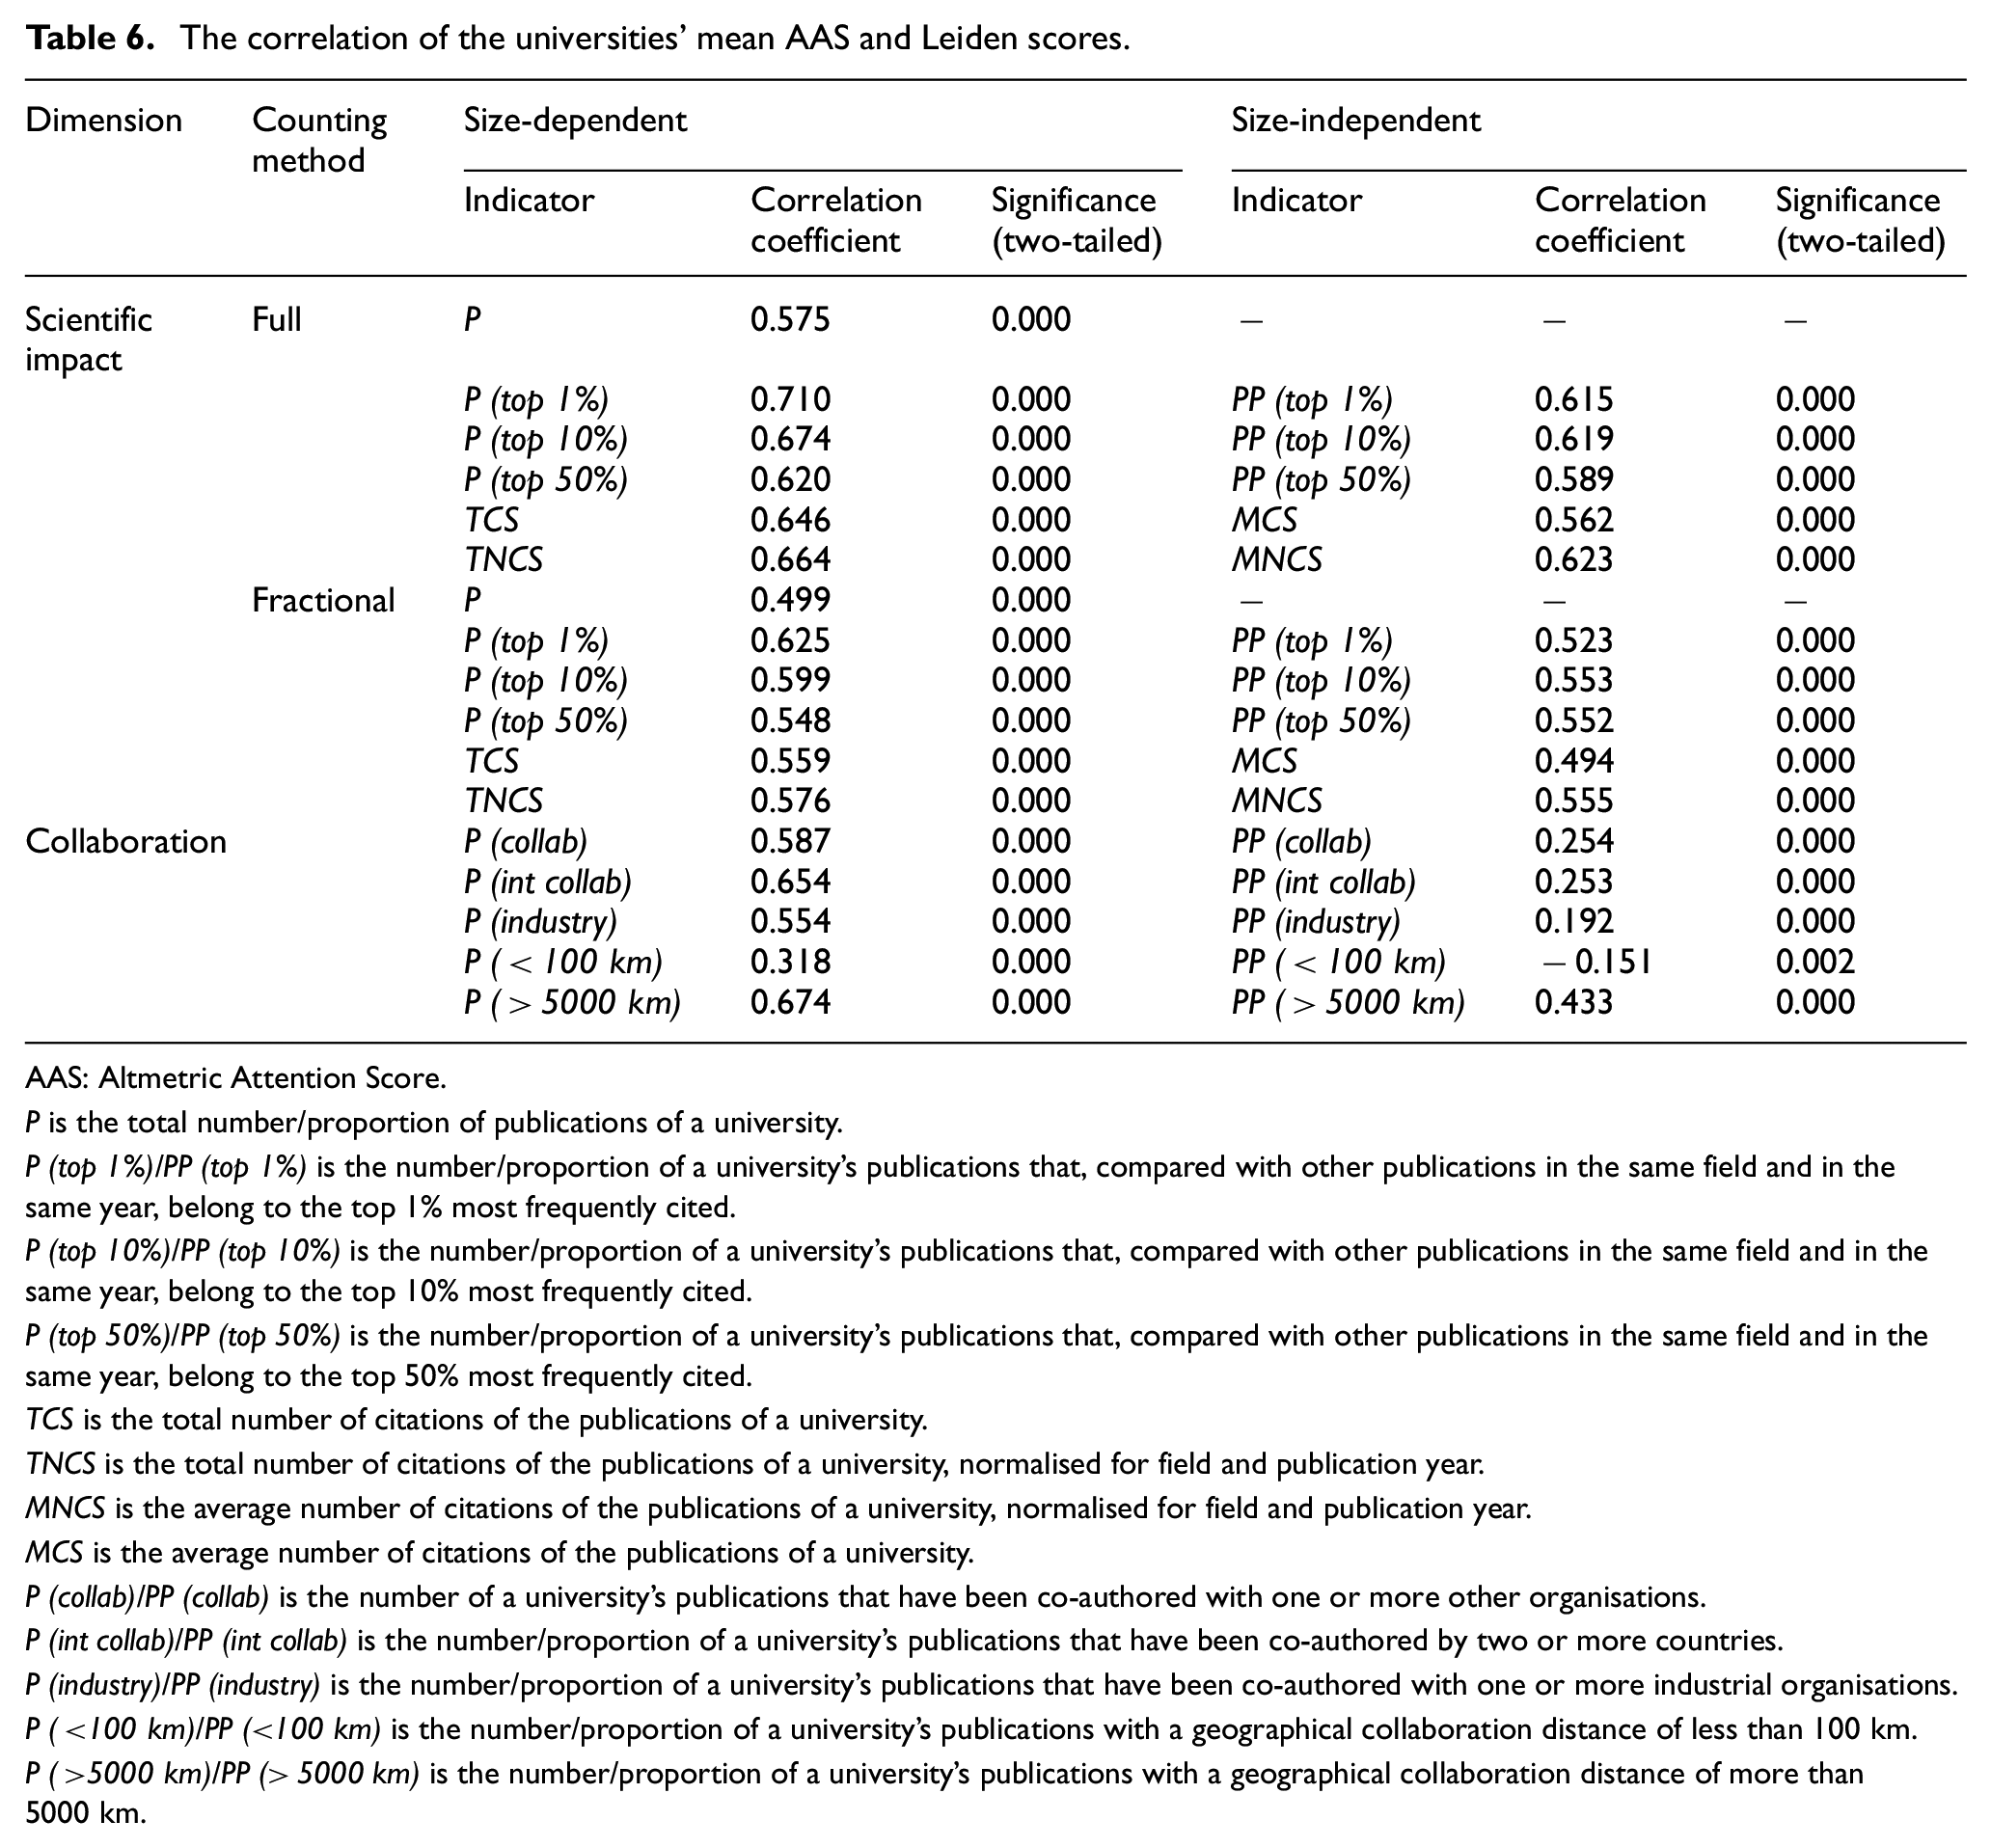
AAS: Altmetric Attention Score.
P is the total number/proportion of publications of a university.
P (top 1%)/PP (top 1%) is the number/proportion of a university’s publications that, compared with other publications in the same field and in the same year, belong to the top 1% most frequently cited.
P (top 10%)/PP (top 10%) is the number/proportion of a university’s publications that, compared with other publications in the same field and in the same year, belong to the top 10% most frequently cited.
P (top 50%)/PP (top 50%) is the number/proportion of a university’s publications that, compared with other publications in the same field and in the same year, belong to the top 50% most frequently cited.
TCS is the total number of citations of the publications of a university.
TNCS is the total number of citations of the publications of a university, normalised for field and publication year.
MNCS is the average number of citations of the publications of a university, normalised for field and publication year.
MCS is the average number of citations of the publications of a university.
P (collab)/PP (collab) is the number of a university’s publications that have been co-authored with one or more other organisations.
P (int collab)/PP (int collab) is the number/proportion of a university’s publications that have been co-authored by two or more countries.
P (industry)/PP (industry) is the number/proportion of a university’s publications that have been co-authored with one or more industrial organisations.
P (<100 km)/PP (<100 km) is the number/proportion of a university’s publications with a geographical collaboration distance of less than 100 km.
P (>5000 km)/PP (>5000 km) is the number/proportion of a university’s publications with a geographical collaboration distance of more than 5000 km.
The results presented in Table 6 indicate the significance of the correlations of mean AAS with all of the indicators used in Leiden methodology. Within the scientific impact dimension, the powers of the correlations range from weak to marginally strong, with the coefficients ranging from 0.575 for P to 0.710 for P (top 1%) on the full counting level, and 0.499 for P to 0.548 for P (top 50%) on the fractional counting level. When the indicators are normalised by the university size, they become slightly weaker, but still significant. The indicators within the collaboration dimension are of weak to moderate powers, before and after being normalised based on the university size. P < 100 km (r = 0.318) shows a change in its direction after being normalised by the university size, so that the size-independent PP < 100 km (r =−0.151) would negatively correlate with the altmetric score.
5. Discussion and conclusion
University ranking systems follow two main simple and complicated approaches in designing their methodologies for assessing the university performances. While the approaches differ in their efficiencies, they match, to some extent, in terms of their results, which signify their relative divergence regarding the effectiveness [5–8]. In an attempt to find solutions to improve the results, this study investigated the potentials of altmetrics in mirroring the results of the ranking systems. Altmetrics are claimed to provide a new research evaluation paradigm [80], which is able to measure a spectrum of research impacts from scientific to social, educational, economic and technological [17,20–22], and thereby to supplement the results of traditional citation analysis [66]. Among various altmetric measures, AAS has the additional advantage of representing multiple altmetrics derived from different kinds of social media and measuring the social performances via a single and, thus efficient, score.
The results of the correlation analyses showed that AAS mean values were correlated with the university performance scores, in almost all the indicators applied by the ranking systems either simple or complicated. The positive correlations provided further evidence of the altmetrics capacities in reflecting different aspects of academic achievements, especially educational, research and scientific impacts [17]. The studied ranking systems assigned high weights to research and research-related indicators. Therefore, the finding reconfirmed the previous literature in terms of the association of citations and citation-based indicators with altmetric scores [23,62,65,67,69,70]. The significant correlations of AAS with the reputation scores in THE and QS can be attributed to its ability to measure the social impacts of the universities achieved by their scholarly outputs [76]. The significant correlation between AAS and international collaboration is in line with Didegah et al. [81] and Haustein et al.’s studies [82] which confirmed the impact of multi-authorship, particularly at the international level, on altmetrics.
However, the correlations ranged from weak to marginally strong, with their upper limit not exceeding 0.71. This signifies that AAS would not completely mirror all the academic dimensions. The divergence may have roots in some inconsistent features. On one hand, AAS has deficiencies in terms of ignoring traditional citations, Mendeley Readership and CiteULike [74]. Moreover, altmetrics lack standard methodologies for collecting data and calculating the scores [21,83] from various altmetric forms and sources [84]. Altmetric services are also limited in their coverage [66]. An example of the limitations encountered in this study is that Altmetric.com just supports those articles with digital identifiers (i.e. DOI, PMID, SSRN, etc.). 3 According to Robinson-García et al. [85], just 19% of the publications indexed in WoS in 2011–2013 were mentioned in social media and were then covered in Altemtric.com. Although the percentage of the covered articles is shown to be comparatively highly improved in this study, the 11.22% of the papers not accessible in Altmetric.com could have some adverse impact on the results. Moreover, older publications were less probably to receive social mentions [19,86]. On the other hand, the universities’ differences in their subject coverage may lead to differences in their social mentions. For example, social science and humanities are more probably to receive altmetric, in comparison with engineering, technology, medicine and natural sciences [81], while university ranking systems, especially QS and Nature Index, are more inclined to life sciences and natural sciences. 4 Nature Index is also criticised for being strictly limited in its collection [87], while altmetrics cover a wide range of paper collections. Moreover, the calculation methods can affect the results. For example, the citation per faculty in QS and the size-independent indicators in Leiden showed rather weaker correlations with AAS. This may be due to the fact that we did not normalise AAS values in this study, while the indicators were normalised in terms of the university size.
Among the criteria, industry income in THE showed no significant correlation with AAS, implying that powerful university–industry ties do not necessarily lead to higher social impacts and vice versa. The reasons might be sought in the universities’ differences in their strategic plans, missions and subject coverage, which differentiate them in their degrees of orientations towards pure science, applied science and social science. In addition, collaboration with closer nations was negatively related to the social metric after being normalised in terms of university size, while collaboration with farther nations showed positive associations with AAS. As contributions with more distant nations may deal with problems of a more global nature, they are expectedly more probably to gather worldwide attention. Further studies are required to clarify the actual reasons.
Generally speaking, the results of this study confirmed positive correlations between AAS and the performance features of the universities implying altmetrics’ abilities to supplement the university bibliometric and performance data. However, one should be cautious in directly interpreting and generalising the results because the correlations were not highly strong. Moreover, unlike the traditional measures that endured validity and quality filters, altmetrics are created in a non-standard milieu without the quality control, central control or authority [88]. They are also young and need more elaborations and investigations to clarify their affinities with research quality and impact [12].
The choice of AAS as a proxy of social achievement led to some limitations. Although it resulted from a wide range of social platforms, it did not include some important measures such as Mendeley Readership and CiteULike bookmarks [74]. Moreover, the philosophy underlying its weighting method was not clarified. Consequently, replicating the study with a wider range of altmetrics is needed. Moreover, according to this study’s findings, there existed a significant correlation between AAS and the reputation scores. This is not in line with Didegah et al.’s study [81]. Although they did not completely deny the impact of institutional reputation on Facebook, Twitter and Mendeley users, they considered it negligible. The differences may have rooted in the studies’ differences in research samples, statistics and altmetrics tools and resources; thus, further studies are required to clarify the results.
Footnotes
Declaration of conflicting interests
The author(s) declared no potential conflicts of interest with respect to the research, authorship and/or publication of this article.
Funding
The author(s) received no financial support for the research, authorship and/or publication of this article.