
Abstract
Local governments play a very important role in providing and disseminating public data; with the assistance of the national government, they also strive to promote effective policies for accessing this data. However, local governments face challenges in independently promoting public data policies owing to budget, manpower and technical constraints. This study analyses public data provided by local governments in South Korea from the perspective of management and use, apart from suggesting considerations for the public data policies of local governments. Public data provided by local governments were also collected, and both the data management method and use of such data were evaluated. Data management measures the currentness in complying with the update policy for each dataset, and the data utilisation measures the relationship between view and download as usefulness. A clustering analysis was conducted to analyse the common characteristics of individual local governments. According to the research results, most local governments do not systematically manage their datasets, and the use of the data provided is extremely low. It is therefore necessary to establish an effective data policy that considers the characteristics of local governments.
1. Introduction
The disclosure of public data continues to attract the attention of governments across the globe as an effort to enhance transparency [1,2], and is an important national resource for adding economic value [3–5]. The increasing importance of the data economy has resulted in a corresponding rise in the importance of public data in creating an ecosystem for data-related industries. Governments have recently established national data strategies to prepare for future industries, including artificial intelligence and autonomous vehicles [6,7].
The Korean government has continuously provided public data since 2013 [5]. According to the ‘Act Promoting the Provisioning and Use of Public Data’ [8], the scope of such data is broadly defined as all data or information created by public institutions and public-sector information leading to communication and cooperation among all citizens [9]. The initial goal of the government was data security. However, as data are now recognised as a key resource for realising a data-driven economy, the South Korean government is strengthening its support to maximise the usage of public data in various industries. The government has proposed spending approximately US$62 billion over the next 5 years on the Korean Digital New Deal, which aims to establish foundations for a digital economy [10]. In particular, the Digital New Deal will address data usability by creating a ‘data dam’ used to collect data from both public and private sources and then standardise the data such that it can be properly analysed [11]. A proposal to utilise US$459.2 million to establish 15 new big data platforms has been also created by the South Korean government. 1 In addition to facial expression, voice and cursive datasets related to artificial intelligence, the Digital New Deal will also unveil datasets essential to our daily lives, including maps, weather and traffic information as public data [12].
As entities in a public data policy, public institutions play a key role in the provisioning and management of data. The term ‘public institution’ refers to ‘any state agency, local government or public institution’, as defined in subparagraph 10 of Article 3 of the Framework Act on National Informatization [13]. Local governments can provide data to solve social problems based on regional characteristics and changing circumstances. In fact, local governments in South Korea provide approximately 49% of the public data through a public data portal [5,14]. However, complaints from users regarding public data are on the rise because only fragmented or heavily redacted data have been released, rather than the raw data [15].
Many studies have been conducted to improve the data policy of local governments or to assess public data at both the local and national levels [16–18]. Such studies can be divided into two main categories. First, studies related to the public data of local governments tend to focus on the format and functional aspects of the data portals [4,19,20]. This approach is effective in comprehensively reviewing the data policies of local governments from the perspective of such portals. Second, the data policies of local governments tend to focus more on the scale of provisioning than on policies for the management and utilisation of the data provided [5]. As a result, we must investigate the key characteristics of data disclosure for local governments, specifically, the criteria for selecting public data to be released in public and for maintaining datasets that have already been released.
This study investigated the data management and use of public data provided by local governments in Korea. Local governments release groups of datasets with data policies that aim to maintain the datasets for their users. Metadata (e.g. the date and time of an update or registration, as well as the availability) help quantify data management, whereas data usefulness can be quantified using the ratio of unique data views to the number of downloads. The results show that approximately 20% of the provided datasets are not updated at the specified time, and most of the datasets are not actively being used. In addition, the diversity or abundance of data provided by local governments do not significantly affect the use of data. Data policies of the local governments must focus on effectively providing datasets that are most important to their users. Based on these results, we propose considerations for improving public data policies for local governments.
The remainder of this article is organised as follows: Section 2 introduces previous research related to public data. Section 3 summarises the current status of public data in South Korea. Section 4 introduces the research methods used to measure the data management and policies. Section 5 summarises the results of the data analysis. Finally, Section 6 summarises the research results and discusses future research directions.
2. Related work
Governments across the globe have recognised the importance of open data and are actively promoting related policies. To realise the value of public data, governments need a harmonious combination of various perspectives on policy management, technology and business. Various studies have been conducted on open data, including frameworks for data management and evaluation, data quality and the functionality of data portals. Bertot and Choi [21] analysed the management, storage and accessibility of both big data and public data to promote interactions among e-government, citizens and businesses in the context of US policy. In addition, Anneke and Marijin proposed a framework that includes the evaluation indicators of the policy environment and context, policy content (input), performance indicators (output) and the creation of public value (impact) for analysing public data policies in the Netherlands. As their research results indicate, the most effective method for data policy implementation involves collaboration between organisations, prioritising public values and the use of open data in daily occupations [22]. In addition, Zuiderwijk et al. [23] suggested guidelines for a meta-analysis based on a comparison with existing open data evaluation frameworks.
Governments provide public data through data portals, collaborate with citizens and share their visions for policy improvements. A government data portal is a space for data providers and data consumers that aims to provide both high-quality and demand-based data and efficiently increase the value of public data. Various studies have been conducted to improve this approach, such as the analysis of country-specific data portals [24] and the utilisation of open government data [25]. Nikiforova and McBride [26] proposed a framework for conducting a usability analysis of open government data portals and identified the strengths and weaknesses across 41 data portals. In addition, Mutambik et al. [27] analysed the data portals of G7 countries from a usability perspective (e.g. the specifications, feedback and requests for open datasets).
Multiple studies have defined various indicators (e.g. availability, usability, completeness, timeliness and consistency) for evaluating different datasets [28]. Lourenço [29] proposed seven requirements (quality, completeness, access and visibility, usability and comprehensibility, timeliness, value and usefulness, and granularity) to promote public accountability by analysing the existing literature on open governments. Vetrò et al. [30] also proposed nine metrics (including traceability, currentness, expiration, completeness, compliance, understandability and accuracy) for evaluating the data quality of open government data.
Local governments play an important role as entities that both provide and utilise public data simultaneously [31–34]. Local governments differ from central governments in terms of budget, manpower, and the types and numbers of data provided and consumed. Chatfield and Reddick analysed a longitudinal cross-sector study of 20 local government data portals in Australia using four indicators: number of datasets, machine-readable data format, policy adoption (e.g. goals, budgets and transparency) and data portal services. They argued that local governments should actively adopt public data policies and provide public data on their own, rather than outsource these activities [3]. However, research on public data policies and technologies centred on local governments has been insufficient [35], and few studies have pointed out the technical and policy limitations of the development and active operation of data portals at the local government level [36–38]. In addition, an efficient budget and proper resource allocation are essential for local governments to efficiently operate their data portals [4]. Young and Yan [39] investigated the experience of using public data through focused group interviews for civic hackers and identified the problems faced by users of open data, including outdated datasets, a lack of metadata, obsolete data formats and low data availability.
Although the Korean government is actively promoting public data policies, research on the data management and policies of local governments has not been systematic, and the roles of the central government have not been properly distinguished [40,41]. In general, local municipalities do not have sufficient funds or organisations to execute public data [5,42]. Kim [5] analysed the status of openness, data management and utilisation evaluated at the local government level in South Korea. According to this study, although South Korea has enacted laws on public data and announced data management policies, the guidelines and software-level support extended to local governments to implement such policies have been insufficient.
This study examines the characteristics of management and the use of data provided by local governments and suggests considerations for such governments to effectively promote data policies.
3. Public data in Korea
By utilising existing public data and providing its own data to the public, the South Korean government has focused its efforts on revolutionising government capacities and establishing a sound ecosystem for data-related industries [33]. The government enacted the ‘Act Promoting the Provisioning and Use of Public Data’ [8] in 2013 and has been implementing a variety of policies ever since. This act aims to prescribe guidelines for promoting the provisioning and use of data created and managed by public institutions, including local governments and central administrative and public agencies.
Since 2013, the government has been operating a public data portal, 2 which provides access to public data. The portal also provides various data formats, such as files, open APIs (Application Programming Interfaces) and visualisations, allowing users to easily and conveniently access and utilise public data. As of July 2021, there were approximately 40,886 datasets on the portal, including 48 high-demand, national core datasets from the general public and businesses. Consequently, the number of public data published has increased fivefold, and access to open data through the portal has increased by 600% since 2013. Such commitment to the disclosure of public data has been recognised globally. South Korea ranked first in the Open, Useful and Re-usable data (OURdata) index developed by the Organisation for Economic Co-operation and Development (OECD) [43] in 2015, 2017 and 2019, ranked in the top-five in the Open Data Barometer (ODB) in 2017, and ranked fourth in the world in the ODB in 2018 [44].
However, the issue of data utilisation persists regardless of the number of public data available. Because the public data portal contains data from various public institutions, it is important to systematically manage its content and allow individual institutions to upload and continuously manage the data, thereby realising data utilisation. However, the current quantitative analysis of data management and portal utilisation is insufficient.
All local governments release sets of public data through a public data portal. However, the data policies of individual local governments are extremely different. Therefore, analysing the current state of the data disclosed by local governments would be useful for the effective management and operation of public data. Management of the datasets provided by local governments according to data policies and their utilisation by users remains a challenge.
4. Research methods
This study analyses the characteristics of local governments in terms of data management and utilisation and proposes ways to improve the data policies of such governments. Local governments in South Korea are divided into two categories: upper and lower levels. Because lower-level local governments are included in the public data of upper-level governments, datasets were collected and analysed by limiting such datasets to those of upper-level governments. South Korea comprises 17 local governments: one special city (Seoul), six metropolitan cities (Busan, Daegu, Daejeon, Gwangju, Incheon and Ulsan), one special self-governing city (Sejong), nine provinces (Chungbuk, Chungnam, Gangwon, Gyeonggi, Gyeongbuk, Gyeongnam, Jeonbuk and Jeonnam) and one special self-governing province (Jeju). Hereafter, the local governments are referred to by their names.
All datasets including the metadata were collected in July 2021 using a Python crawler developed under the condition in which the provider is an individual local government in the public data portal. By conducting a basic statistical analysis for each local government, the data collected were analysed from the perspective of data management and utilisation. Finally, the data provisioning characteristics of the local governments were analysed through a clustering analysis, and data policy improvements were suggested.
The management of individual datasets is calculated by applying the ‘currentness’ (delay in publication) and ‘expiration’ (delay after expiration) indicators introduced by Vetrò et al. [30]; in addition, the usefulness indicator, modified from Lourenço [29], measures the number of views and downloads (i.e. statistics) per dataset as an evaluation indicator of the UK data portal. Note that the currentness indicator is measured based on the on-time updates of the datasets provided by each government to investigate whether the datasets are effectively managed, whereas the usefulness evaluates the average ratios of the number of downloads to the number of views for each local government. A clustering technique was then applied to analyse the commonalities of local governments according to the datasets provided. This analysis investigated the relationship between the number of downloads and the number of views of the public data from each local government.
To measure the currentness, we used the average on-time update of the datasets by each local government, which is calculated as follows

where
Public data management guidelines specify that all datasets on a portal should be managed by data providers [45]. For example, public institutions provide management policies when releasing datasets on their portals. This is often described in the metadata for each dataset. Several metadata elements are associated with data currentness, which focuses on data management:
Registration date: Date when the dataset is uploaded on the portal.
Next registration date: Date when a new dataset is added on the portal.
Update types: Type of update cycle represented by cyclic units of time (e.g. weekly, monthly or quarterly).
The update types have several categories, and each category is converted into the corresponding numerical value in days for calculation (i.e. annual, 365; half-year, 182.5; quarterly, 91.25; monthly, 30.42; weekly, 7; and daily, 1). However, any records in which this metadata attribute was blank or entered as ‘sometimes’ were excluded from this analysis.
Here,

where
A common group is derived using

where
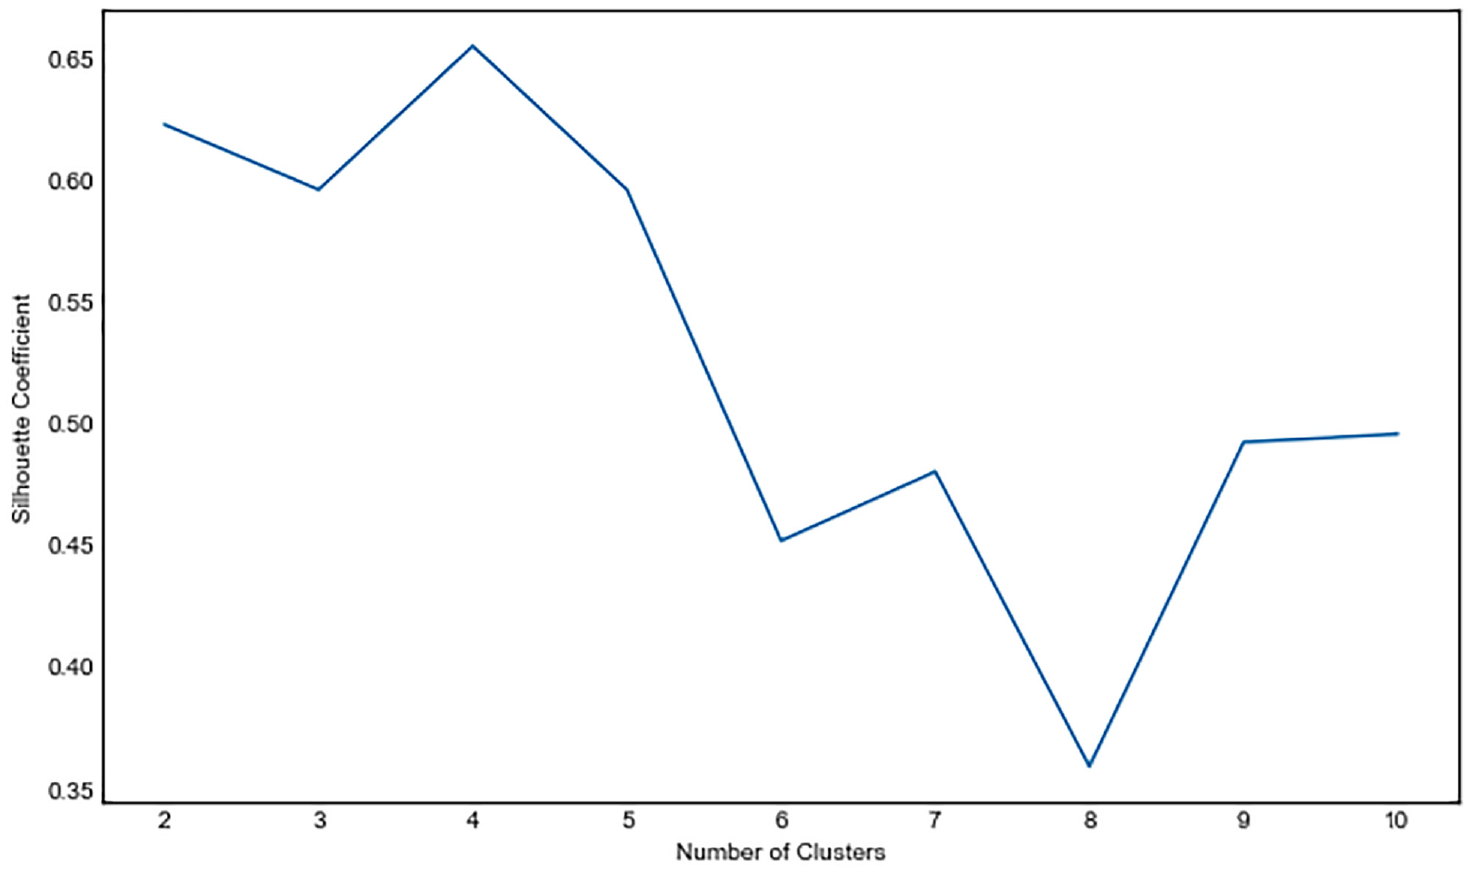
Although K-means clustering is a relatively efficient method [48,49], no global theoretical method exists for determining the optimal number of clusters. To find the optimal value of

where
5. Results
5.1. Data status
We collected a set of datasets provided by the portal and separately extracted the CSV and XLS formats for analysis. There were a total of 28,914 collected datasets. Local governments provided approximately 13,897 of these datasets, accounting for approximately 48% of the datasets in the portal. The number of datasets varied according to the individual local governments.
As shown in Figure 1, Seoul provides the largest number of datasets at 2629, whereas Busan and Gyeonggi provide 1652 and 1444 datasets, respectively. Except for these three governments, no other local governments provide more than 1000 datasets. Sejong provides the smallest number at 66 datasets.
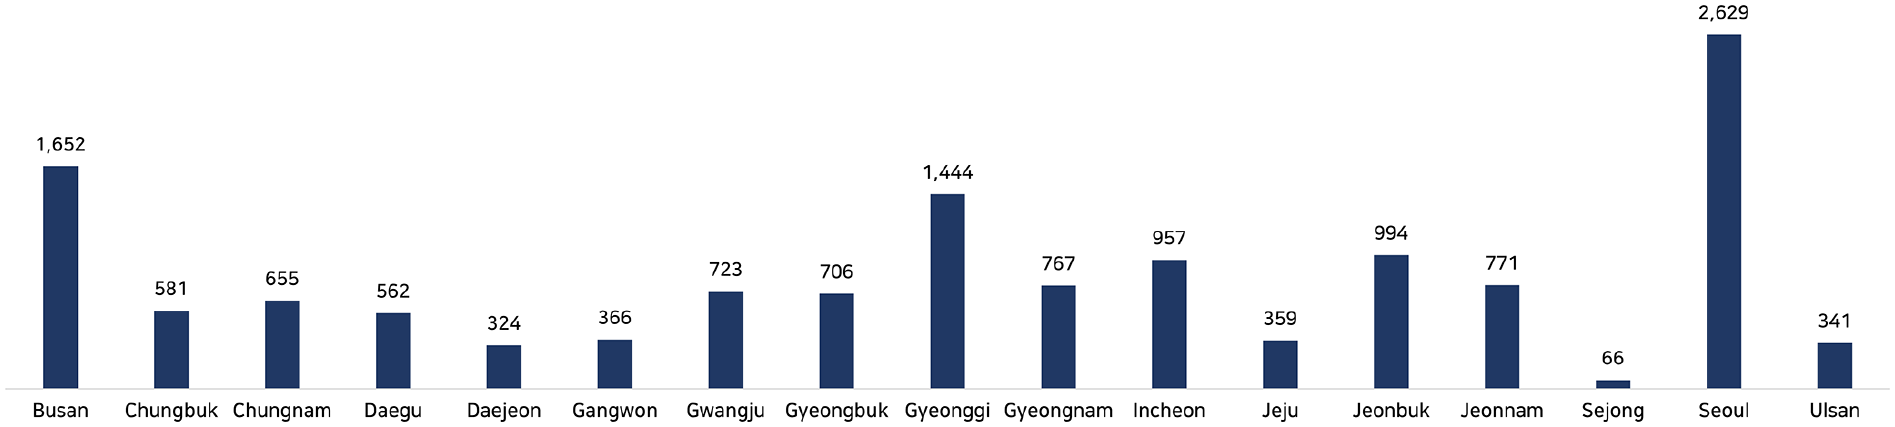
Datasets provided by each local government.
As shown in Figure 2, Seoul has the highest number of views (988,370) and downloads (203,295) of its datasets. Busan (446,826), Jeonbuk (331,151) and Gyeonggi (305,527) have a relatively high number of views, whereas Sejong (19,242) has the lowest number. Although not exactly matching their ranking for the number of views, Gyeonggi (128,617), Jeonbuk (93,762) and Busan (91,891) have higher download rankings. However, the numbers of downloads of the local government datasets are considerably lower than those of their number of views. The number of downloads in Gyeonggi is approximately half that of Seoul despite having the second-highest rate of views, whereas Sejong (5236) has the least number of downloads, with approximately 2% of the number of downloads in Seoul. In summary, the numbers of views and downloads of each local government are distributed differently.
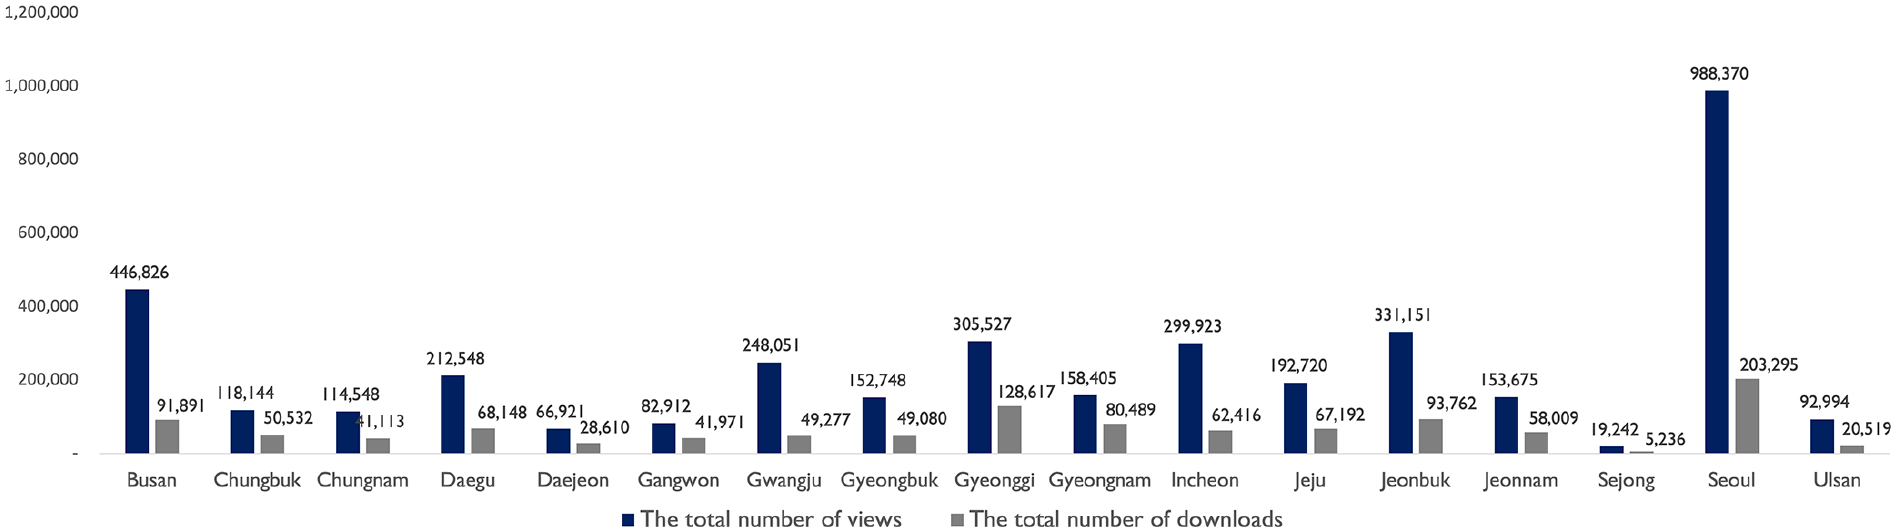
Summary of downloads and views of datasets provided by each local government.
5.2. Datasets by subject
The datasets were divided into 16 subjects in the public data portal: public administration (PA), industrial employment (IE), cultural tourism (CT), environmental weather (EW), agriculture and fisheries (AF), social welfare (SW), food health (FH), transportation and logistics (TL), land management (LM), healthcare (HC), disaster safety (DS), education (ED), financial affairs and finance (FF), unification diplomacy and security (UDS), science and technology (ST) and law (LA).
Figure 3 shows the datasets provided by each municipality according to the frequency of each subject. A significant number of datasets contained PA (2734, 19.67%), IE (1623, 11.68%), and CT (1522, 10.95%). In addition, PA includes information closely related to the lives of citizens, such as public facilities, administrative districts, public services and public charges. Moreover, IE includes employment-related data, such as local industries, employment population and employment facilities, whereas CT includes data related to tourism and cultural properties. Datasets on these subjects were available for all municipalities considered in this study. By contrast, the datasets for UDS and LA numbered 27 and 3, respectively, across all municipalities. Here, UDS includes data on the status of international organisations, organisations of veterans, military facilities and civil defence facilities, whereas LA includes data related to parliamentary and legal systems. Datasets on these topics were provided by the central government rather than municipalities.
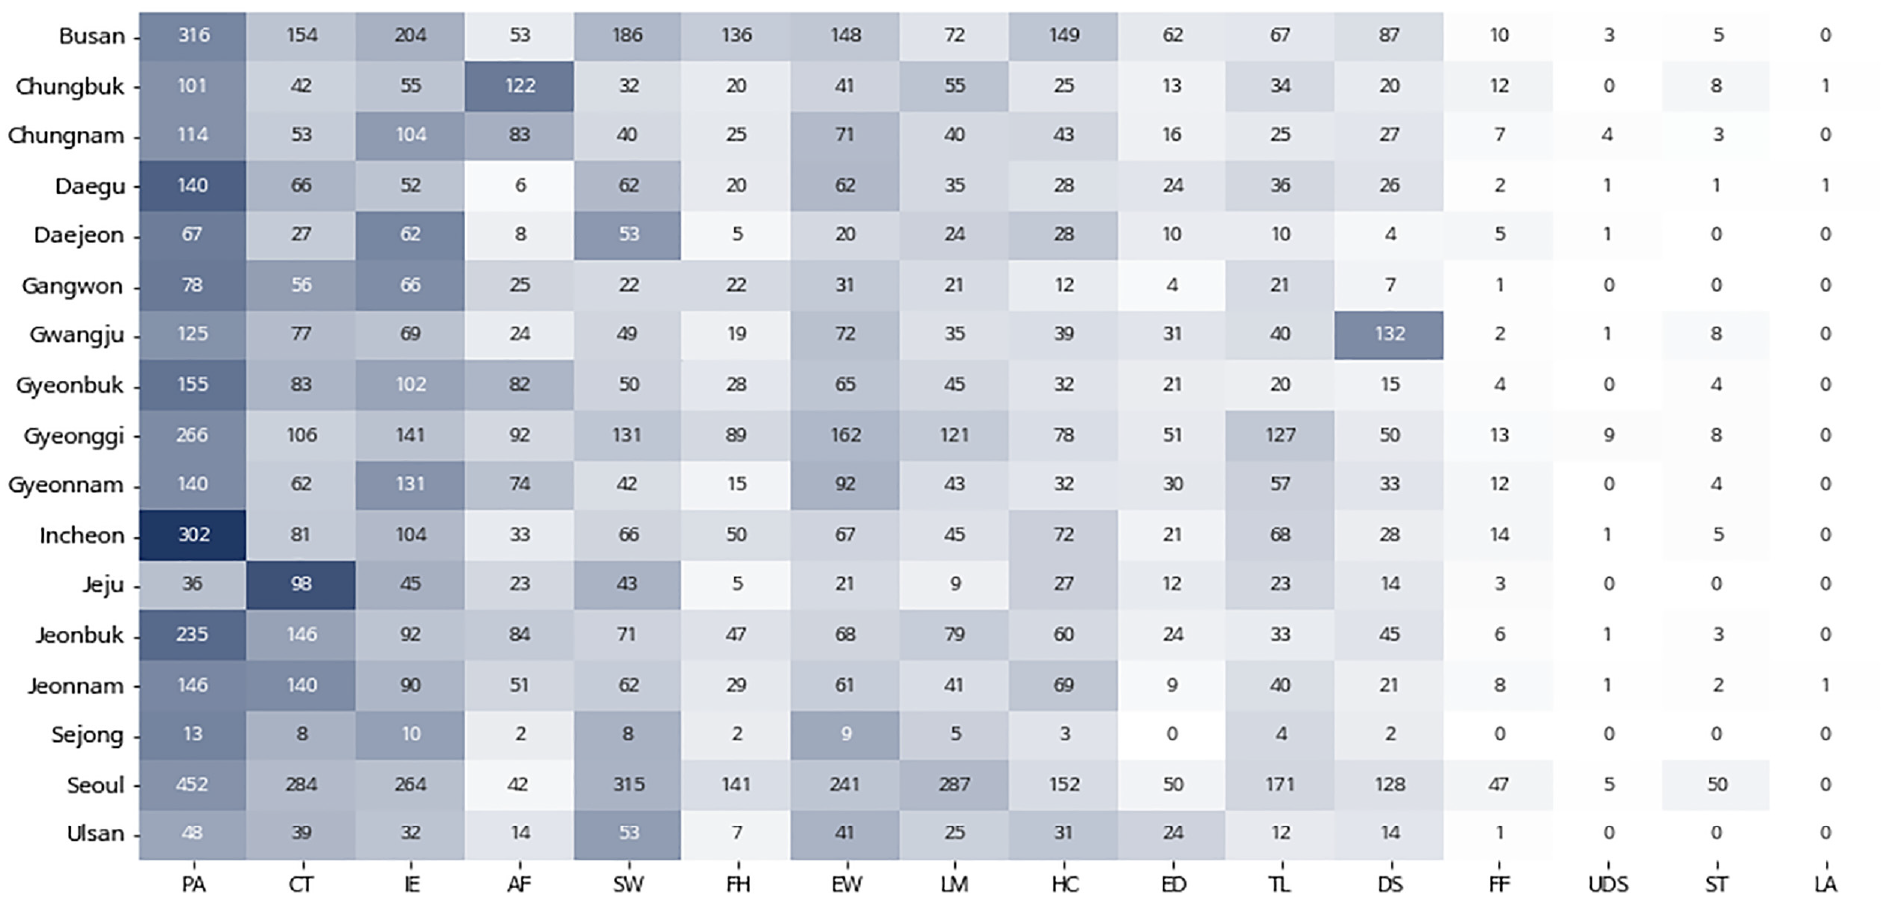
Visualisation of heatmaps by topic in datasets opened by local governments. In the heatmap, the larger the number of datasets a subject has, the darker the colour. This analysis was conducted according to the data provided by individual municipalities.
Municipalities provide datasets with regional characteristics. Seoul provides datasets for most subjects; however, the ST dataset is rarely provided by other local governments, but includes detailed Internet and SNS usage rates, and city-related information at the district level. Gwangju has a relatively large number of data on DS, whereas Chungbuk has a total of 122 datasets on AF, including livestock, agriculture, pesticide management, fisheries and poultry farms. Jeju provides a relatively large number of datasets on CT.
5.3. On-time update
Each dataset explicitly describes its update policy by using several metadata attributes. If the dataset is updated according to the described date, it indicates that the local government properly manages the dataset and complies with the update policy.
As shown in Figure 4, the mean
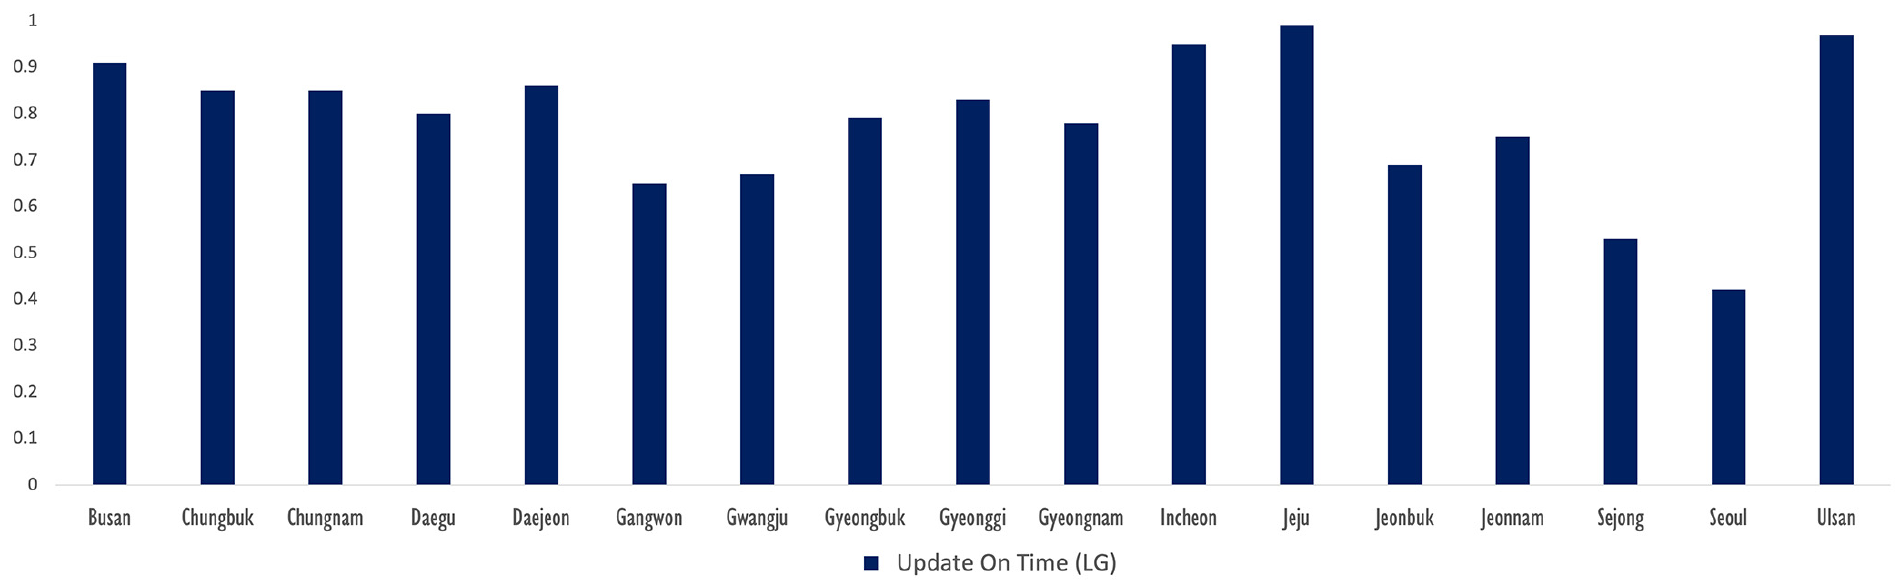
Average ratios of on-time updates.
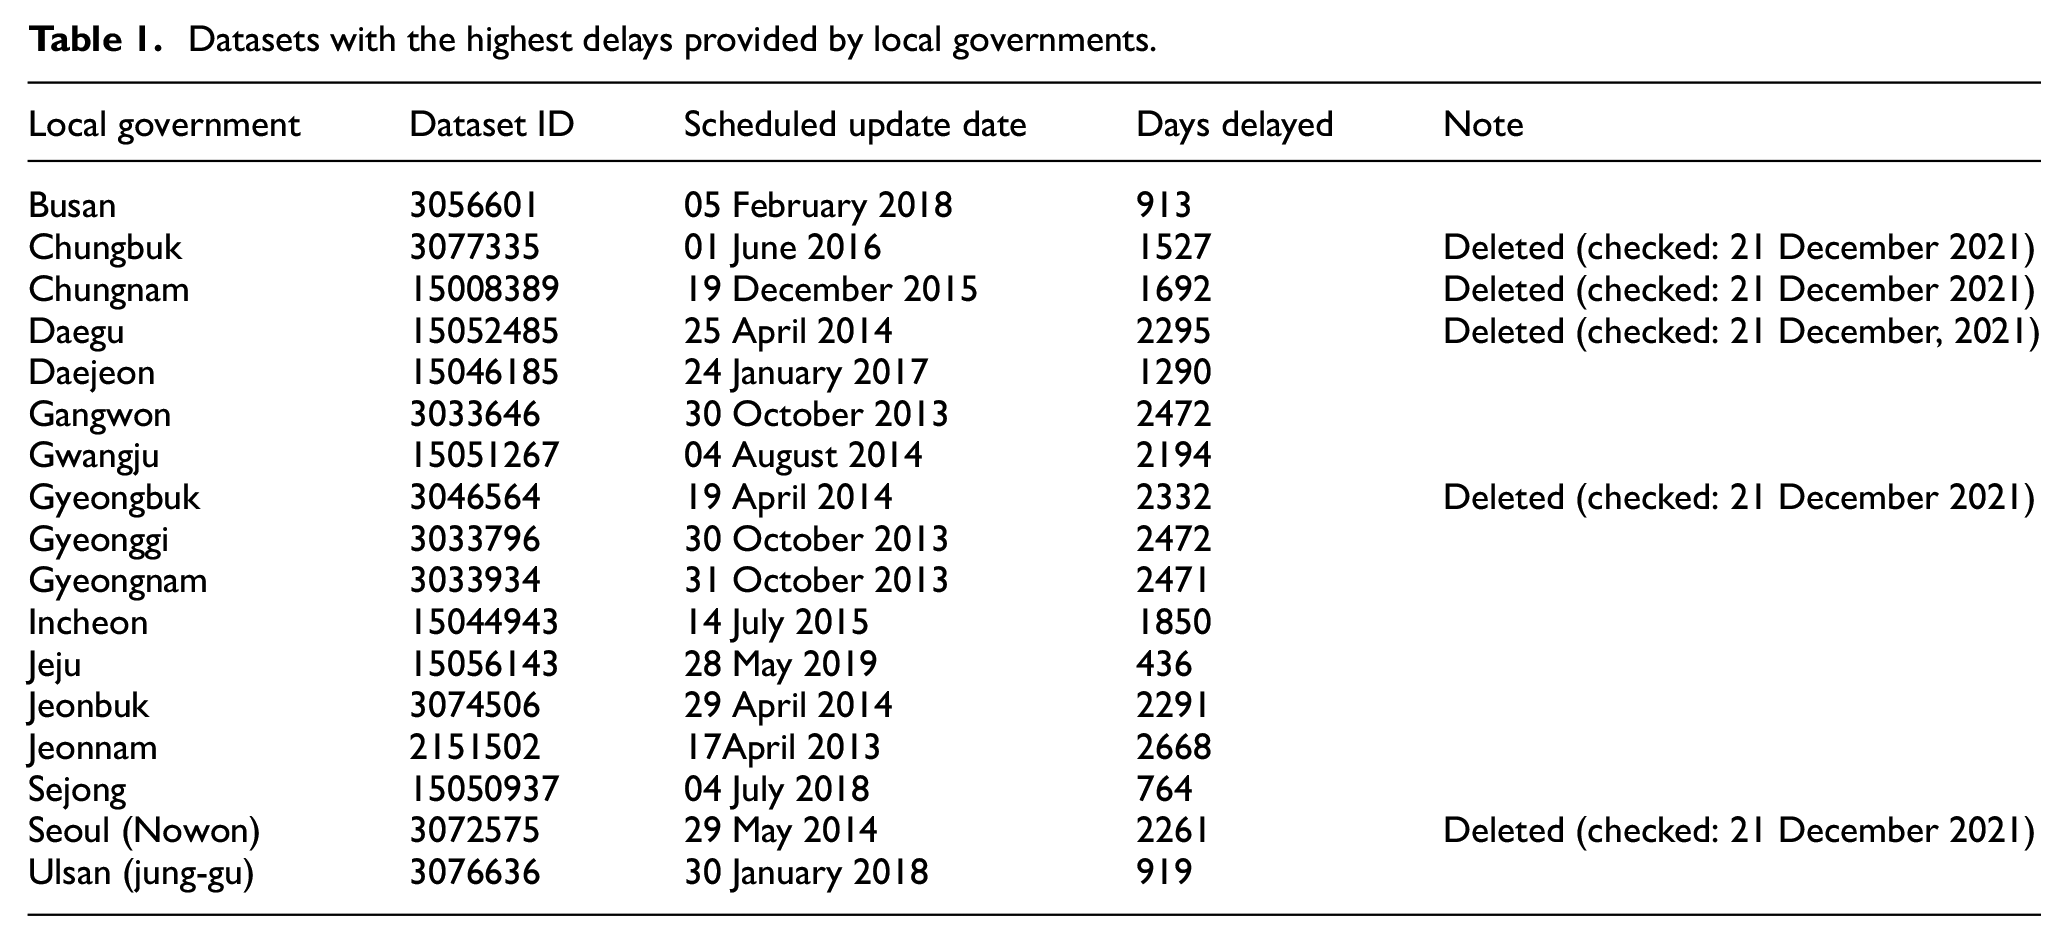
As shown in Table 1, datasets with delayed updates were found. For example, in Gangwon, Gwangju, Gyeonggi, Jeonbuk and Jeonnam, there are datasets that were delayed by approximately 2000 days, and such datasets can be interpreted as not being managed in any capacity. Local governments that violated their update policies also had relatively long average delays in registering new datasets. Ulsan had the shortest average delay of 182.8 days. Most local governments had update delays of more than 300 days, and in Seoul, the average update delay was six times longer than that of Ulsan (182.8 days), which had the lowest average update delay.
Datasets with the highest delays provided by local governments.
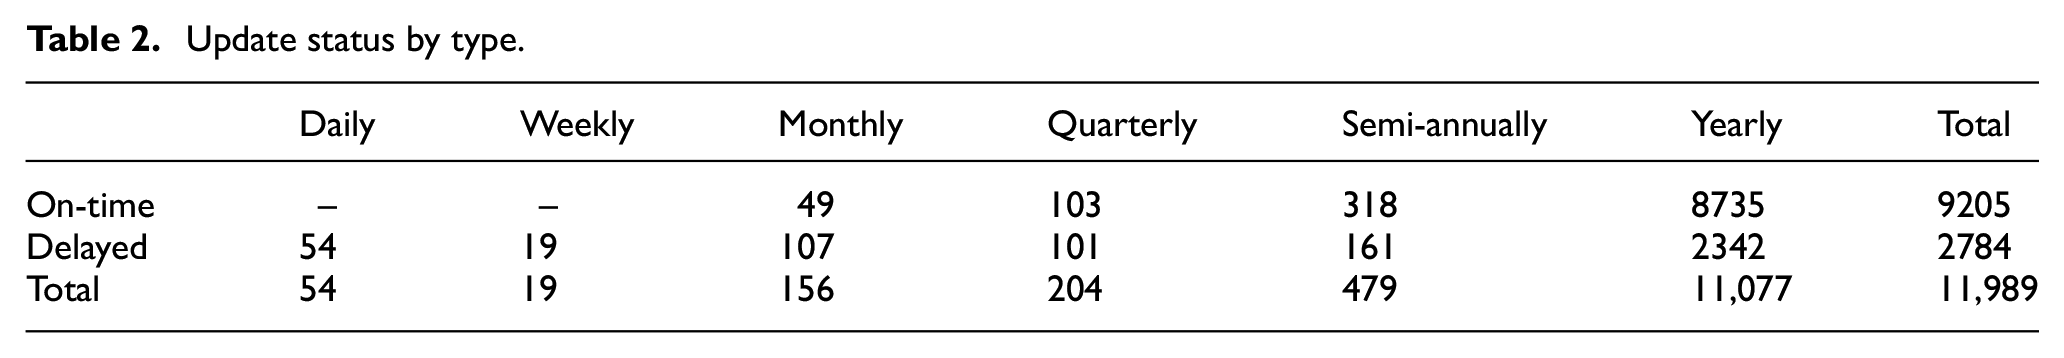
As shown in Table 2, the updates of the datasets varied with the update cycle. For all datasets, the annual type of update was the highest at 92%, and the daily and weekly formats were low. Our study found a difference in the rate at which the updates were conducted as scheduled, depending on the update type. None of the datasets in the weekly or daily formats followed the update policy. Only 31% of the datasets in the monthly format were appropriately updated. By contrast, the rates of quarterly, semi-annual and annual updates were 50%, 66% and 78%, respectively. These results indicate that most of the local governments maintain their data primarily on a semi-annual or annual basis.
Update status by type.
5.4. Number of downloads per view
The mean DPV
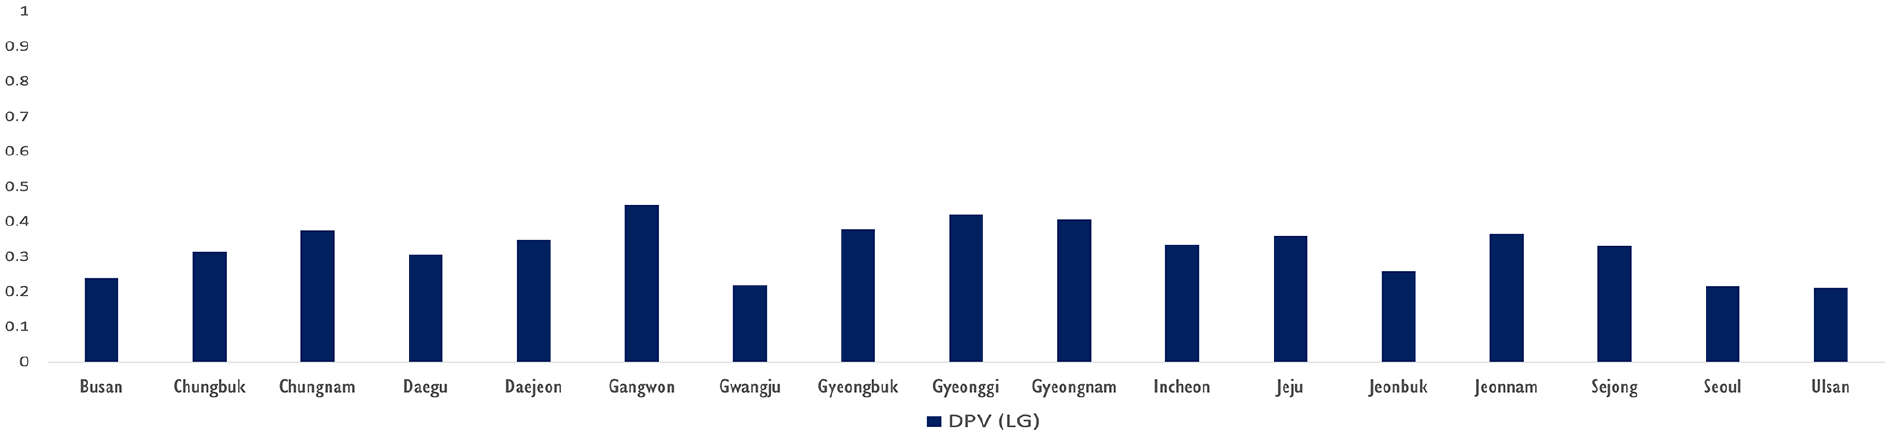
DPV for individual municipalities.
The datasets provided by local governments do not appear to directly affect the use of data by the users, as indicated by the DPV index. For example, Seoul and Busan provided relatively large datasets, whereas Daejeon and Sejong provided very few datasets. However, based on their average DPV, Seoul and Busan ranked 13th and 15th, respectively, whereas Daejeon and Sejong ranked higher. Furthermore, Jeju and Ulsan provided a few datasets and had low DPV indices. Gyeonggi ranked second and third in terms of their average DPV and data scale, respectively; in addition, Gangwon provided few datasets but had a high DPV ranking.
5.5. Clustering analysis
Herein,
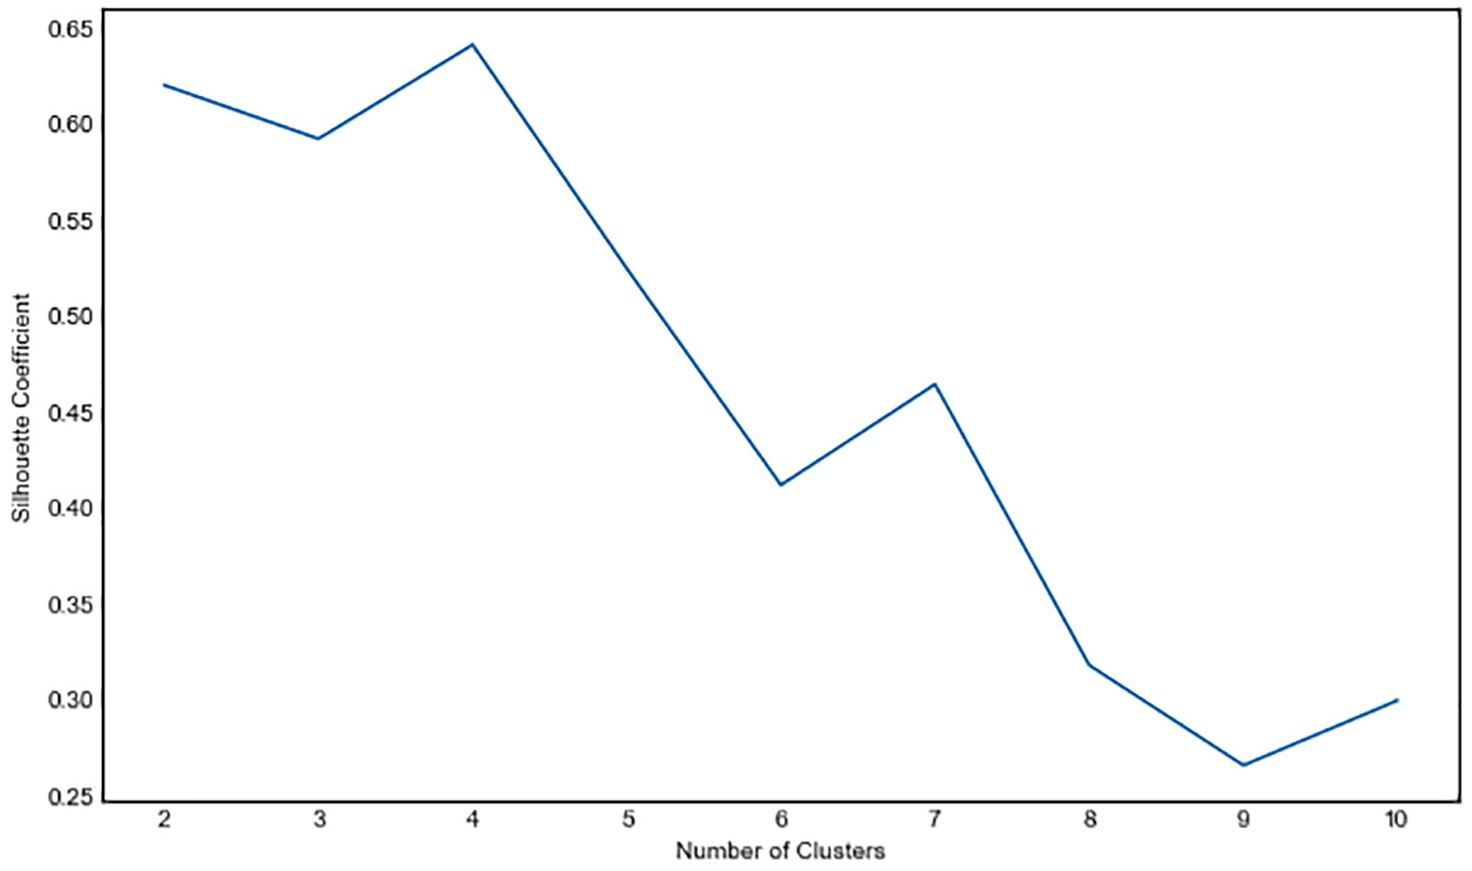
Optimal
Optimal
Figure 8 shows the clustering results of the numbers of downloads and updates of datasets provided by the local government.
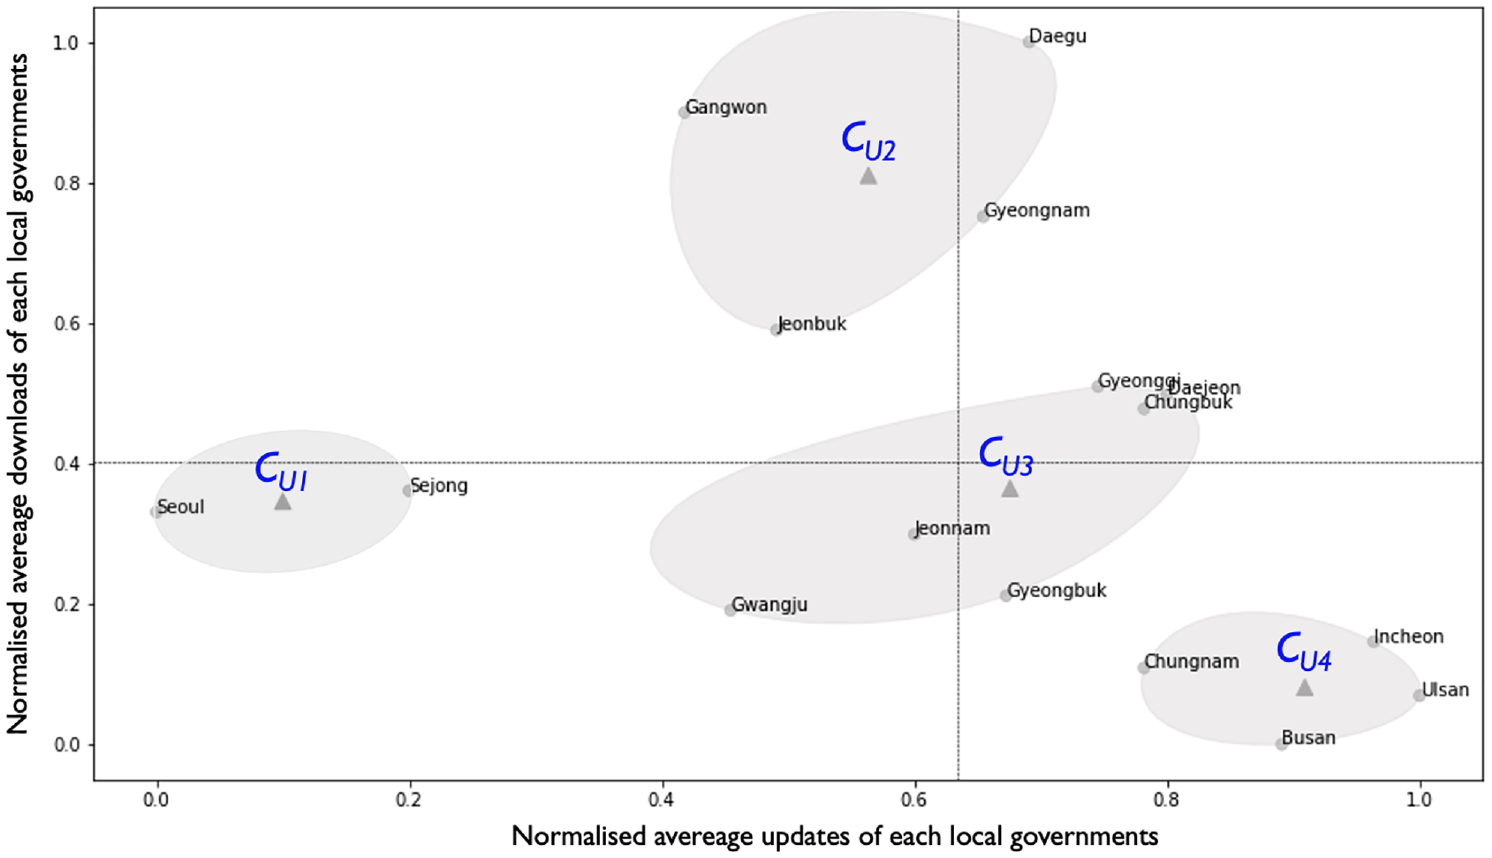
Clustering results of numbers of updates and downloads of each local government.
Sejong and Seoul were categorised as
Data that comply with the data policies are more likely to be applied by users;
View–download clustering analyses the use of datasets by dividing them into exploration and acquisition. This analysis can help determine whether the data provided by municipalities are useful to users. Figure 9 shows the clustering results based on the numbers of views and downloads of the datasets:
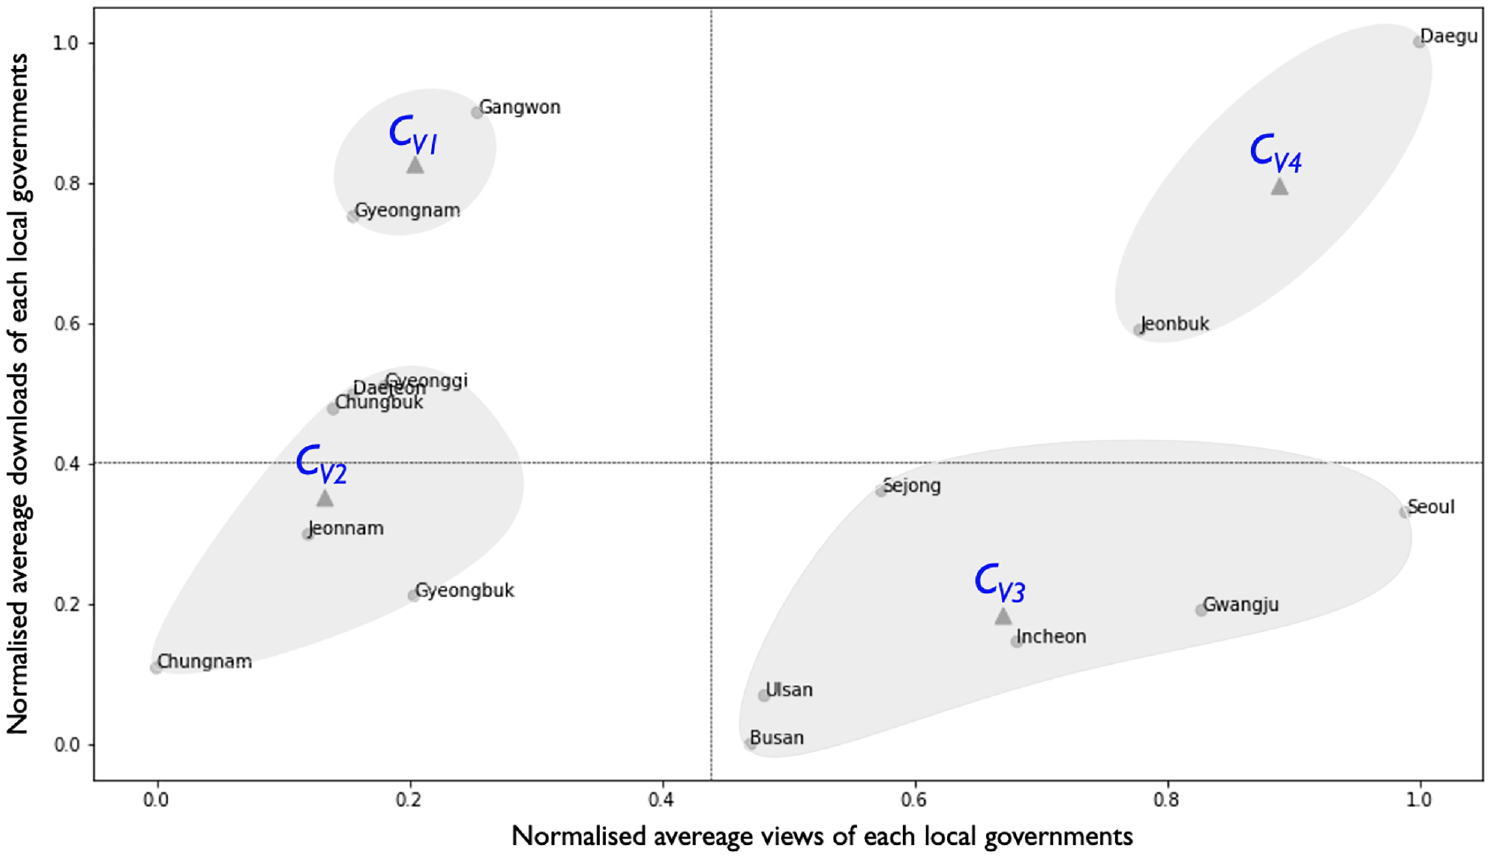
Clustering results of numbers of views and downloads of each local government.
Gangwon and Gyeongnam are categorised as
The results of the data analysis are summarised as follows. Although data management is extremely important to local governments, it does not directly affect the data use. Gyeonggi, Daejeon, Chungbuk, Jeonnam and Gyeongbuk are categorised as
6. Discussion
According to the analysis results, both the currentness and usefulness of the data released by local governments are relatively low. Most local governments do not satisfy the prescribed policies for data provisioning and management (
Quantity-driven policy. the government has conducted annual performance evaluations of central government agencies, local governments and public institutions [12]. The evaluation items consist of 18 indicators in 5 areas: management system, openness, utilisation, quality and others [52]. The openness area includes efforts to open and discover new data, as well as the registration and processing rates of the requested data. This index tends to focus on measuring the quantity of the datasets provided. The utilisation area includes an evaluation index for enhancing data utilisation, business start-up support through data utilisation and error reporting with a timely processing rate. In principle, it is important for local governments to provide diverse and plentiful quantities of data in accord with the data policies [3,26]. Although this approach may seem advantageous in the current evaluation system, most evaluation indicators do not evaluate the actual data usage and lack practicality in facilitating data usefulness. Data requests from actual users are a critical element in determining data policies at the municipal level because the costs associated with a data release can be continuously increased [17]. In this sense, governments should focus on providing data that users can employ to solve problems. Furthermore, the objectives and detailed indicators of the annual performance evaluation must be complemented to provide useful data.
Sufficient high-quality metadata. In Figure 9,
Differentiated policies. According to public data management guidelines [45], local governments can operate their own data portals, and all datasets must be equally provided to the public data portal. However, this rule has rarely been followed. For example, Seoul has its own open data platform
5
and more datasets than those released to public data portals. The number of datasets released to the public data portal does not match that of the open data plaza, and only some of the 7692 datasets are provided. This problem is also common in other municipalities. However, because the individual circumstances of local governments are different, in-depth data policies must be designed for each local government [4,20]. Although Seoul and Sejong, categorised as
7. Conclusion
Local governments play a critical role in providing public data and successfully disseminating data policies. This study quantitatively analysed the currentness and usefulness of local government data provided by a public data portal in Korea. Data currentness was used to evaluate the update policy described in the individual datasets, and data usefulness was measured as a DPV index for the relationship between numbers of views and downloads.
According to the research results, 20% of all datasets were not updated as scheduled, and more than half were not managed by local governments. By contrast, the majority of the datasets provided were not actively used. Although it is important for local governments to release public data, policies that provide and manage data based on quantity do not significantly impact the data usage. According to the study results,
In general, local governments have various environmental factors that promote public data policies. Through a clustering analysis, we found that local governments have common characteristics in terms of data provisioning and utilisation. Previous studies have already revealed that local governments have difficulties in continuously implementing data-related policies owing to personnel and budgetary constraints. We also found that most local governments do not effectively manage their datasets. It is therefore necessary to design and implement public data policies that consider the characteristics of the local governments. In particular, it is essential for the central government to prepare and support consistent guidelines such as legal and administrative systems. The evaluation system used by the South Korean government is a driving force that can strongly promote public data policies; however, the transition from a quantitative evaluation to demand-oriented data provisioning should be reviewed. The provisioning of diverse data does not convince users to use such data. Data usefulness can be realised when useful and high-quality data are made available for users.
This study measured the currentness and usefulness of datasets provided by local governments in South Korea. However, this method is limited in terms of data collection and analysis. First, the datasets collected in this study were limited to public data portals. This study also did not consider data portals that are directly operated by local governments. Second, DPV defines the relationship between the numbers of views and downloads and does not evaluate the actual data use. Thus, although it is possible to measure the extent to which the user has searched for and accessed datasets on the portal, it is difficult to determine whether the downloaded datasets are used offline. Nevertheless, because the downloading of a dataset by a user is a prerequisite for data usage, it can be interpreted as an index indirectly measuring the usefulness of the data.
Future research should consider the data management and usability of a local government portal. In addition, it will be necessary to examine the data management guidelines between the data portals operated by local governments and public data portals as well as the system by which they are connected. Because the standards for releasing data, metadata items, classification systems, and update policies differ depending on the local government, systematic guidelines are also needed. Users face challenges owing to inconsistent search terms and different portal designs and functions. Such an environment has been reported to be a factor hindering the systematic management and utilisation of public data. Therefore, there is a need for studies comprehensively diagnosing issues with public data portals and the portals of local governments, as well as evaluating data management systems.
Footnotes
Declaration of conflicting interests
The author(s) declared no potential conflicts of interest with respect to the research, authorship and/or publication of this article.
Funding
The author(s) received no financial support for the research, authorship and/or publication of this article.