
Abstract
In just few years, TikTok has become a major player in the social media environment, especially with regard to teenagers. One of the key factors of this success is the idea of challenges, that is, video competitions/emulations on a certain topic, which a user can launch and other ones can join. Most of the challenges are fun and harmless. However, there are also users who launch challenges that are dangerous, or at least suitable only for an adult audience (and TikTok is the most popular social network for teenagers). This article focuses primarily on this kind of challenge. In particular, it investigates an aspect not yet studied in the literature, which is the different characteristics and evolutionary dynamics of the communities of users participating in non-dangerous and dangerous challenges. Its final goal is the identification of evolutionary patterns that distinguish the communities of users participating in the two types of challenges. The knowledge of these patterns could be a first step in implementing an approach to the early detection of dangerous challenges in TikTok.
Keywords
1. Introduction
A few years after its appearance, TikTok 1 (also known as Douyin in China) has attracted the interest of hundreds of millions users, especially, but not only, among teenagers. The strength of TikTok is videos, generally short, through which users can launch challenges. A challenge consists in a series of videos emulating the original one launching it. TikTok supplies several tools specifically designed for video editing – manage HD resolution, full screen display and provide its users with the possibility of adding a music clip to a posted video. The varied and qualified set of functionalities for video management and, above all, the possibility of launching challenges or participating in them represent the main strengths of this social platform.
A challenge is identified by a hashtag; it begins when a user posts a video with that hashtag and invites other ones to replicate that video in their own way. Most of the challenges are fun and not dangerous, but some of them are dangerous or, in any case, suitable for an adult audience only, while TikTok is the most popular social network among teenagers. To give an idea of the dangerousness of some challenges, we mention the Benadryl challenge, which encouraged users to ingest large amounts of diphenhydramine to get high and record their responses, and the Blackout challenge, which encouraged users to choke themselves until the point of losing consciousness, while uploading the results on TikTok.
TikTok has increased security controls and removed challenges judged dangerous. However, every day the authors of dangerous challenges find new tricks to bypass TikTok’s controls. Taking into account the number of users of this social medium and the number of challenges launched daily on it, it is easy to understand how the definition of automatic tools able to distinguish a non-dangerous challenge from a dangerous one is a very important issue to address.
Another interesting research issue regarding this social medium concerns the study of the communities participating in a challenge and their evolution over time. In particular, some questions that can be investigated are the following: Are there differences in the evolution and dynamics of the communities related to non-dangerous and dangerous challenges? What can be said about these communities regarding the connection level of users, the configuration of friendships and all those issues typical of Social Network Analysis?
This article is intended as an attempt to address these challenging issues. In particular, we study the characteristics of the communities participating in dangerous and non-dangerous challenges, the behaviour of the corresponding users and their dynamics and evolution over time. The final goal is the possible detection of evolutionary patterns allowing the distinction of non-dangerous challenges from dangerous ones.
Regarding this fact, it must be said that TikTok has been intensively studied in the literature from multiple perspectives, especially with regard to influencers [1,2] and their role in marketing [3–6], politics [7–9], health [10–13] and so on. Many other studies have focused on the recommendation algorithm underlying TikTok [14–19], privacy and security issues [20–23] and types of messages and contents that, directly or indirectly, are spread through this social platform [19,24]. There are also some studies about challenges [25,26], the principle of imitation underlying them [27] and the strategies with which the videos launching them are designed [28]. However, to the best of our knowledge, no paper specifically investigated the differences in the evolutionary dynamics of communities in dangerous and non-dangerous challenges, as well as the possibility of exploiting these differences to search for evolutionary patterns capable of distinguishing one kind of challenge from the other. Our contribution goes exactly in that direction.
To perform our analysis, we selected seven non-dangerous challenges and seven dangerous ones. For each of them, we considered the corresponding posted videos and a set of features characterising the associated user communities (e.g. number of connected components, size of the maximum connected component, average clustering coefficient and average path length). Next, we defined a social network–based model to represent the user community associated with each TikTok challenge. Using this model, we investigated the evolutionary dynamics of the communities associated with non-dangerous and dangerous challenges. First, we focused on the characteristics of their videos and the parameters of the social networks associated with their communities. From a first analysis, taking into account the evolution of the community size during the challenge lifespans, we could observe that non-dangerous and dangerous challenges seemed to show different dynamics. Here, a clarification on the term ‘lifespan’ is in order. By ‘lifespan’ of a challenge, we do not mean the time period elapsing from when it is launched to when it finally disappears from TikTok. In fact, there are challenges that never disappear from this social platform, even though they have not received new videos from months or years. Here, the lifespan of a challenge is the time period elapsing from when it is launched to when it is no longer able to elicit at least limited interactions with users.
To capture the differences on the community dynamics in the two kinds of challenge, we divided lifespans into suitable intervals. Then, we grouped these intervals into homogeneous clusters. At this point, for each cluster, we used the values of the Social Network Analysis parameters characterising the communities corresponding to the intervals belonging to it for drawing the cluster’s profile. After this, for each challenge, we identified the sequence of intervals, along with the corresponding clusters, which formed its lifespan. From examining these sequences and the characteristics of the corresponding clusters, we hypothesised that some clusters were substantially equivalent and verified the correctness of this hypothesis by means of a t-test [29].
After verifying this correctness, we could simplify the sequences related to challenges, and this allowed us to identify a main evolutionary pattern characterising non-dangerous challenges, and two main evolutionary patterns, different from the previous one, characterising dangerous challenges. This result provides a new way to distinguish the two types of challenges. After obtaining this result, we tested whether it was accurate and generalisable to the other TikTok challenges. To this end, we considered 300 challenges and were able to verify that our model was very accurate also for this sample, whose size was much larger than the one initially used.
We point out that the classification approach we propose in this article is currently able to support the detection of dangerous challenges only near the end of their lifespan, or at least after a fairly long time period has elapsed since their beginning. However, the early detection of dangerous challenges is not the goal of this paper. In fact, in it, we want to define an approach to the classification of TikTok challenges. Although our paper does not aim at early detection of dangerous challenges in TikTok, it makes its own contribution in the literature related to the classification of video content published in social media, as will be clear in Section 2. Actually, the early detection of dangerous challenges is an extremely difficult problem that cannot be solved in a single paper, but needs a multistage research. In fact, in the early detection of videos, we cannot rely on metadata alone because they might be deliberately falsified by malicious authors [30,31]. Therefore, any approach based on the actual content of challenges or the behaviour of people accessing them is necessarily complex and first requires a series of researches to understand the phenomenon. Only after fully understanding the latter, it is possible to think of approaches that use the knowledge gained to propose a solution. This necessarily requires lengthy multistage researches. Our article is in the first stage of one such research, that is, the stage devoted to better understand the phenomenon. In the future, in order to achieve the latter goal, we may consider reducing the granularity of the time intervals considered. In this way, we can think of identifying very soon some evolutionary patterns allowing an early detection of dangerous challenges.
This article is structured as follows: In Section 2, we present the related literature. In Section 3, we illustrate the initial data set storing data about the 14 challenges we used for our analysis. In Section 4, we define our Social Network Analysis based model to represent the community of users associated with a challenge. In Section 5, we propose a preliminary analysis of dangerous and non-dangerous challenges and their corresponding communities. This represents the starting point for the study of the evolution of user communities associated with the two types of challenges, which is presented in Section 6. In Section 7, we illustrate the reasoning leading us to the discovery of evolutionary patterns for the two types of challenges. Finally, in Section 8, we draw our conclusion and take a look at possible future developments of this research.
2. Related literature
In recent years, TikTok has been the subject of analysis by researchers operating in different fields [32]. For example, it has been studied in the context of Social Network Analysis, marketing, machine learning and deep learning, politics, and so on [7–9,10–12,33,34]. The opportunities and challenges posed by this social medium are clearly described in Choudhary et al. [35].
Compared with other social platforms, TikTok is characterised by a massive diffusion among teenagers [36]. This has led to the emergence of new types of influencers, suited for this social platform [1]. The study of such influencers represents the main objective of De Veirman et al. [2]. Ishihara and Oktavianti [37] propose an analysis on ‘personal branding’. This term refers to the process of creating a brand from a person’s profile. Researchers have also performed analyses to understand whether marketing strategies and influencer actions in TikTok actually lead to increased brand awareness and sales [38].
Another issue related to TikTok, on which researchers have turned their attention, concerns privacy and security [20–22]. Obviously, TikTok has largely attracted the interest of researchers working in the context of Social Network Analysis [24]. Many authors have turned their attention to the recommendation algorithm used by TikTok [14–19]. Some authors have focused on using machine learning and deep learning approaches to understand the dynamics of this social medium [39].
As for TikTok challenges, which represent the main focus of this article, few studies concerning them can be found in the past literature. In particular, Zulli and Zulli [25] investigate the role of these challenges in fostering the imitation principle. In this analysis, they use the concept of memes and introduce the notion of ‘imitation publics’. Klug [27] focuses on strategies that can be adopted to create a video for a challenge; to this end, he analyzes the #distantdance challenge in detail. Chen et al. [28] study the processes through which challenges can influence TikTok users. Finally, Su et al. [26] analyse how TikTok challenges can be used to spread specific messages in this social medium.
The topic considered in this article can be seen as a specialisation for TikTok of a more general topic related to the discovery of communities in social media, their classification and the study of their evolution. These themes are of fundamental importance in Social Network Analysis [40]. In this context, some studies focus on static methods for community detection [41], while others analyse the activities of social network members to investigate their evolution over time [42,43]. To perform this task, it is possible to define the concept of dynamic network, which is a special type of complex network that changes over time [44]. Changes in the network occur when new members join or leave it, when existing relationships disappear, when new relationships appear and so on. These structural changes lead to a continuous evolution of the network, which means that the corresponding structure must be continuously recomputed.
Various approaches for studying the temporal evolution of communities have been proposed in the past literature [42,43,45]. In order to provide a complete overview of them, Dakiche et al. [42] propose a taxonomy consisting of four categories. These include approaches for (1) Independent Community Detection and Matching, (2) Dependent Community Detection, (3) Simultaneous Community Detection on All Snapshots, and (4) Dynamic Community Detection on Temporal Networks.
Independent Community Detection and Matching approaches operate by applying the static community detection methods to the dynamic case. They consider the evolution of the network into consideration in many time steps. During each time step, the network is modelled as a set of communities. The communities of a time step can be matched with those of the previous time step based on a similarity measure. For example, Sun et al. [46] focus on social networks and propose an event detection algorithm to find community evolution patterns between adjacent snapshots. In this way, they are able to evaluate the evolution trend of the whole network. Zhu et al. [47] describe a framework for event reconstruction that aims to analyse the dynamic characteristics of community structure. They define a set of community attributes and reconstruct events based on the examination of these attributes. Tajeuna et al. [48] propose a model and a similarity measure, called mutual transition, to track communities and to analyse significant transition events occurring in them.
Dependent Community Detection approaches leverage snapshots and detect communities for each of them. Given a certain snapshot, these methods consider the communities found in the immediately preceding snapshot or, otherwise, in the most recent ones. For example, He and Chen [49] improve the Louvain algorithm by including the concept of dynamism when forming communities. They use the communities detected at time t− 1 to identify the communities at time t. Guo et al. [50] associate attributes with the topology of a graph and define the topological attraction between nodes and communities. They update the current community structure based on the changes occurred in the previous time step. Gao et al. [51] propose an evolutionary community discover algorithm based on leader nodes (called EvoLeaders). Each community is considered as a set of follower nodes close to a potential leader. An EvoLeader represents the most central node in the corresponding community. By analyzing the EvoLeaders during the evolution of communities, the authors can investigate the community continuity over time.
Simultaneous Community Detection on All Snapshots approaches take in input all the evolution stages of a social network simultaneously. They create a single network by binding together in a single graph all the snapshots of the social network. In this way, they maintain the structures aligned in time by coupling the arcs between the same nodes at different time steps. For example, Tantipathananandh et al. [52] propose a general framework for finding communities in dynamic networks. First, they model such a task as a graph colouring problem. Then, they use a heuristic technique involving greedily matching pairs of node sets between time steps, in descending order of similarity. Tantipathananandh and Berger-Wolf [53] go further and include arbitrary dynamic networks. They solve an optimisation problem using a semi-definite programming relaxation and a rounding heuristic. Jdidia et al. [54] construct a single network from all snapshots by connecting similar nodes appearing in different time steps. They also create links between nodes connected to at least one common neighbour in two consecutive time steps. Finally, they use the classical Walktrap community detection algorithm.
Dynamic Community Detection on Temporal Networks approaches work directly on temporal networks. In this case, the authors do not consider snapshots, but the changes occurring in the network. The idea is to search for communities and study their evolution by analysing the addition and removal of nodes and arcs in the network. For example, Li et al. [55] consider the evolution of the network arc by arc. A node is considered belonging to the community with which it shares the largest number of arcs. Thus, the addition or removal of arcs can result in a node moving from one community to another. To avoid the continuous oscillation of a node from one community to another, if the difference between the number of arcs that a node shares with two communities is below a certain threshold, then the node will remain in the community it previously belonged to. Rossetti et al. [56] propose Tiles, an algorithm that tracks the evolution of communities over time. When a new interaction happens in the network, Tiles uses a label propagation procedure to propagate the changes to the node’s neighbourhood. Held and Kruse [57] propose an algorithm to find communities based on high-connected hubs. It first searches for highly connected nodes, which will represent the hubs. Then, it assigns the non-hub nodes to the nearest hub. This assignment can evolve iteratively over time.
As specified in Section 1, the main objective of this article is to study the differences between non-dangerous and dangerous challenges in TikTok. This study is conducted focusing mainly on the difference in the evolution of the corresponding communities, finding different evolutionary patterns that characterise the two kinds of community. Its ultimate goal is trying to distinguish non-dangerous and dangerous challenges based on the behaviour of the corresponding communities. To the best of our knowledge, no other paper in the literature investigated this issue. To achieve its goals, our approach uses a wide set of notions from Social Network Analysis [58–60], Data Mining [61,62] and Statistics [29]. In particular, it constructs a social network for each challenge and uses several parameters typical of Social Network Analysis to characterise it. Then, it adopts data mining techniques (in particular, clustering) to build a first rough version of the evolutionary patterns capable of characterising the two kinds of community. Finally, it uses the t-test [29] to test some hypotheses that allow a further refinement of the previously detected evolutionary patterns.
As anticipated in Section 1, this article has its own definite collocation in the scientific literature and makes its own contribution to it despite the fact that it deals only with the first stage of a research on early detection of malicious videos.
Similar to our case, several papers in the literature have dealt with the classification of videos using complex techniques, which do not take into account only the metadata that can be faked by the authors. For example, Yousaf and Nawaz [31] propose a method of classifying inappropriate videos on YouTube that does not take metadata into account. Papadamou et al. [30] propose a classifier to identify inappropriate videos for children on YouTube, which could be even recommended by YouTube’s own recommendation algorithm misled by deep fake videos. Another approach that deals with the classification of videos having within them misleading content on COVID-19 is presented in Shang et al. [63]. Another example of classification of child-unsafe videos is proposed in Singh et al. [64]. Finally, the identification of extremist videos in online video sharing sites is investigated in Fu et al. [65]. In the literature, this article fits into this line of research. In this context, it makes a very different contribution from others since it is based on the behaviour of user communities accessing videos.
In this line of research, our approach can be considered:
A response to all those authors who perform classification of videos through the corresponding metadata and who argue the need to expand their approach with non-textual features [65–67]. In fact, our approach considers behavioural features.
A response to the many papers that make classification of videos on more classical social platforms, such as YouTube, and that argue that this area of research opens up to consider more recently appeared platforms, which present video structuring and social interaction dynamics very different from classical ones (as is exactly the case with TikTok) [30,31,66,67].
The motivations for various authors to propose video classification approaches in social media like ours concern:
The possibility of reporting that malicious users posted video with deliberately wrong metadata that enable them to reach segments of users for whom they are not suitable.
The possibility of reporting that deep-faked videos are posted as real and that these reach users with low critical sense and thus capable of believing that those videos are true.
The possibility of reporting that someone is posting extremist videos or, even, videos that incite terrorism and push kids and young people to enrol in terrorist organisations.
The possibility that a deeper understanding of the phenomenon of dangerous videos is a first step towards their early detection.
3. Data set construction
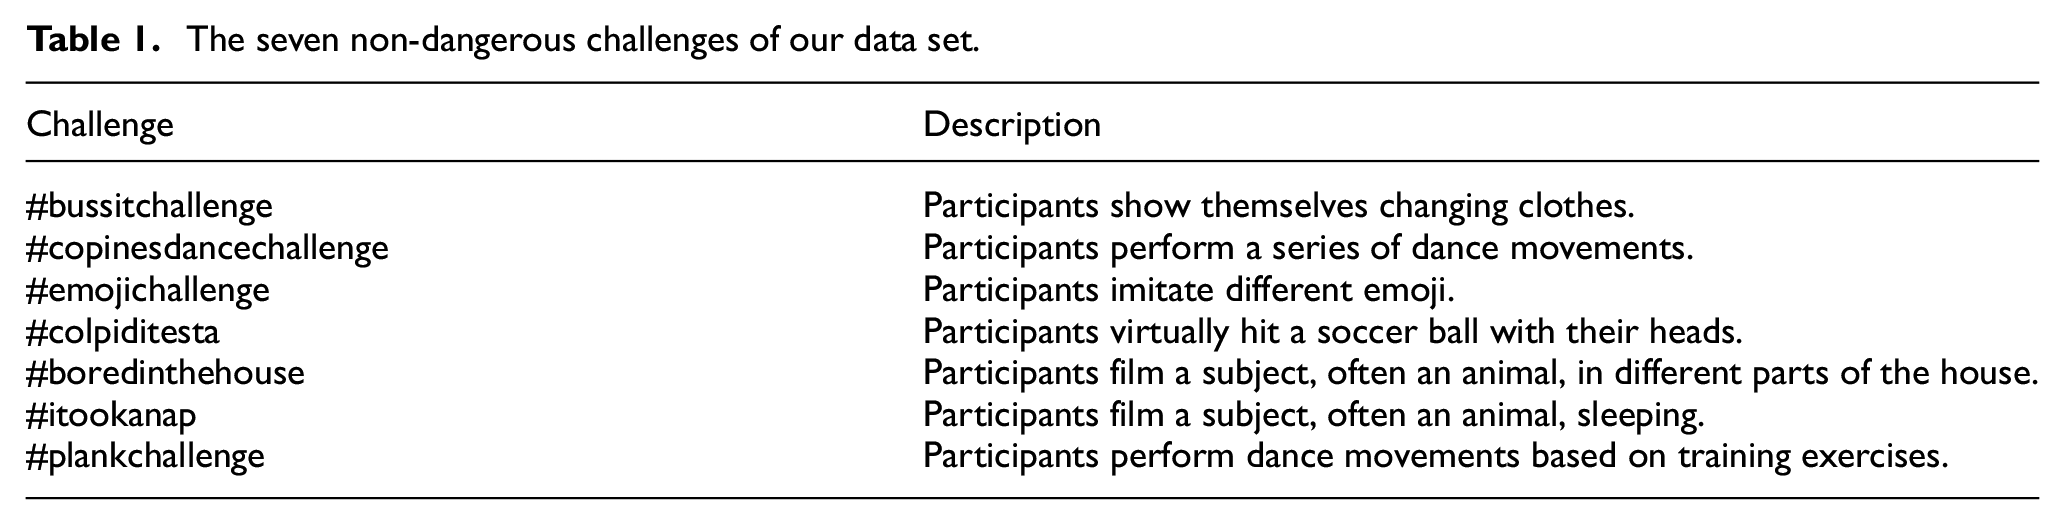
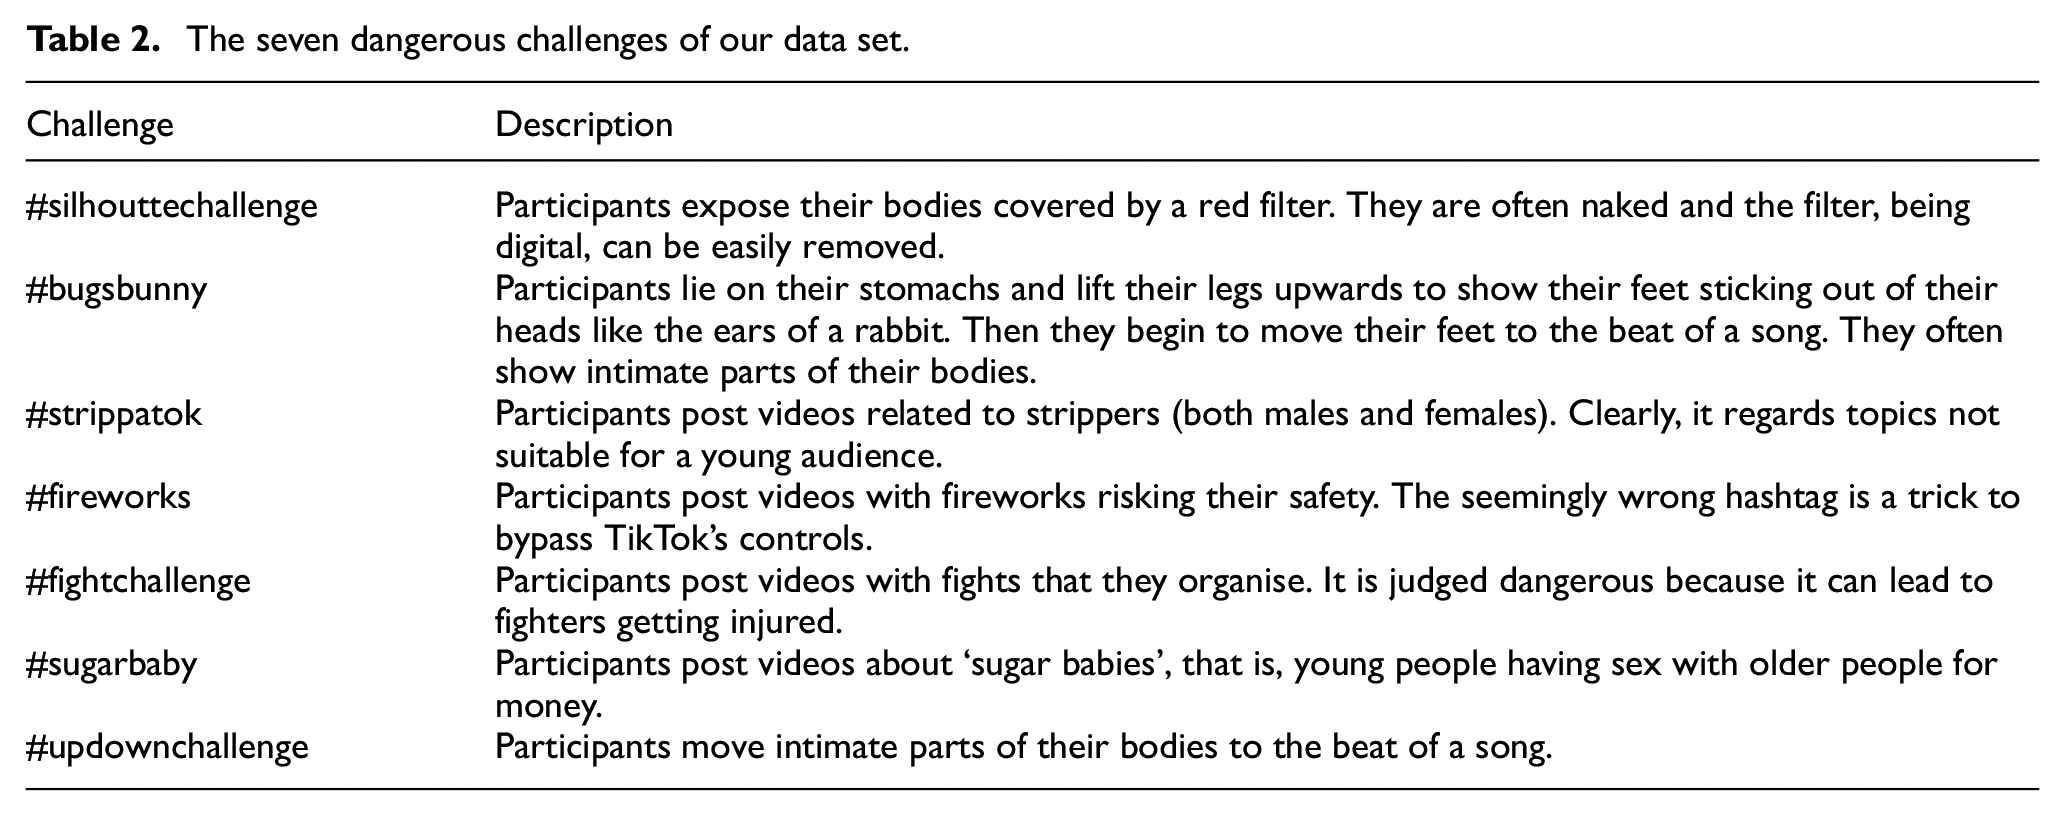
In order to perform our research, we needed a data set recording data and metadata related to non-dangerous and dangerous challenges in TikTok. To the best of our knowledge, there was no data set with such characteristics already available; therefore, we had to build it from scratch. In identifying the challenges to be considered in such a data set, we focused on some of them that were very common in TikTok at the time of data extraction. Specifically, we considered seven non-dangerous challenges and seven dangerous ones. To this end, we assumed as dangerous a challenge that had received several criticisms in the media about the problems it could cause to the people participating in it. As it usually happens in TikTok, we identify each challenge through the hashtag used to post the corresponding videos. In Table 1, we report the seven non-dangerous challenges, while in Table 2, we show the seven dangerous ones. Actually, in the past, much more dangerous challenges than those shown in Table 2 have spread on TikTok. Some of them, such as the Benadryl challenge and the Blackout challenge mentioned in Section 1, even caused the death of participants. These challenges, and other ones equally disrupting, were promptly blocked by TikTok and the access to the corresponding data was impossible.
The seven non-dangerous challenges of our data set.
The seven dangerous challenges of our data set.
At this point, a consideration on the number of challenges we have chosen is necessary. In fact, the classification problem we are considering is a typical ‘rare class problem’ [29]. It arises in the presence of a strong imbalance of the two classes to be predicted with the class of greatest interest being the rare one. In such a scenario, it is better to have a model less accurate but capable of identifying as many instances of the rare class as possible [29]. To achieve this, a balancing of the two classes is done, even though in reality the rare class is much less prevalent. In practice, as mentioned above, it is very difficult to find data on dangerous challenges because they are rare and are removed from TikTok as soon as they are recognised as dangerous. Therefore, in order to have a balanced data set, we had to undersample the non-dangerous challenges. This way of proceeding can lead to a worsening of the overall accuracy of our approach but allows us to obtain very high sensitivity values. In turn, this allows our approach to correctly classify as many dangerous challenges as possible.
Having said that, we note that in any case the number of challenges considered may seem low and, in some ways, it is. This is due in part to the rarity of the dangerous challenges and in part to the typical way of proceeding of the research investigations on TikTok. In fact, these investigations take into account few challenges, each characterised by many videos. For example, Ng et al. [68] analyzes 12 challenges, Alonso-López et al. [69] examines 8 challenges, Bruno [70] considers 8 challenges and a total of 100 videos, Fiallos et al. [71] studies only one challenge characterised by 1495 videos; finally, Medina Serrano et al. [7] and Qiyang and Jung [72] each analyse two challenges. As we will see below, our 14 challenges still led us to examine 6005 videos, which represent a significant number in the TikTok investigation scenario.
Table 3 shows the number of videos we collected for each challenge, along with the date of the first and last one.
Number of videos and date of the first and last video for each challenge.
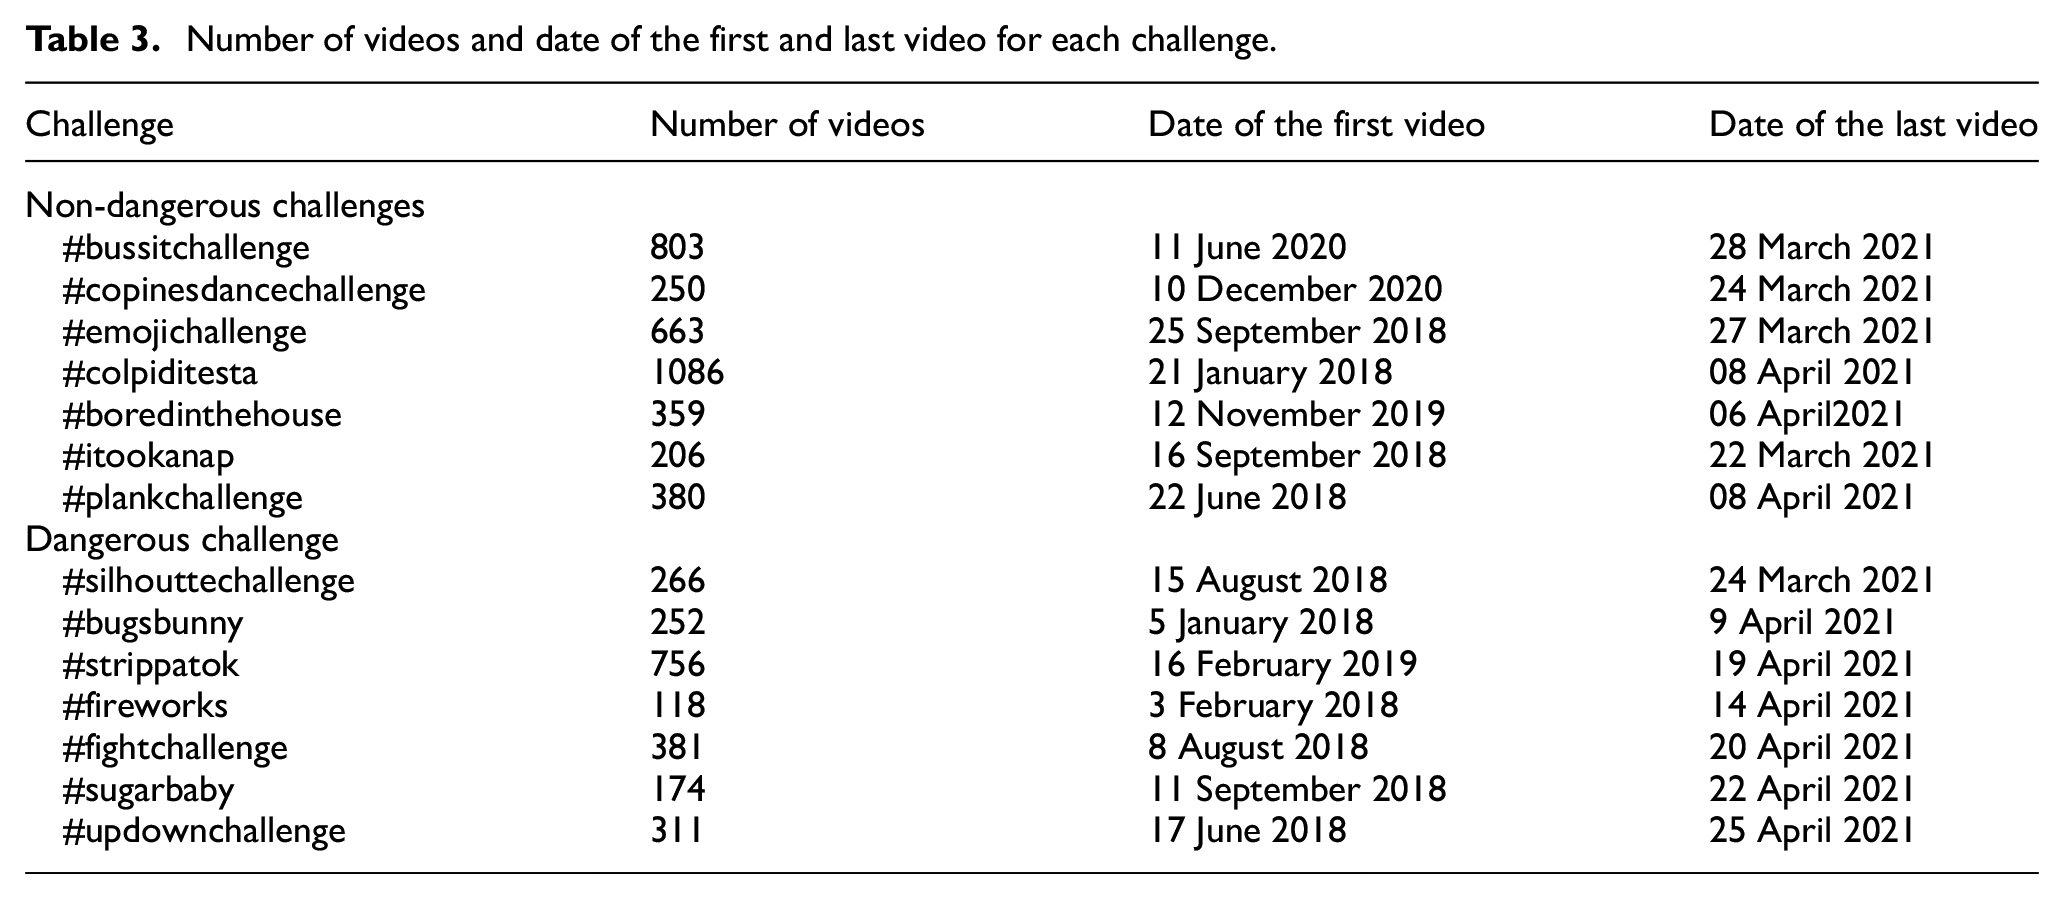
With regard to this table, we point out that, in the period in which we carried out our tests (July 2021–September 2021), the lifespan of all the challenges in our data set can be considered concluded (according to the meaning we gave to the concept of lifespan conclusion in Section 1). In fact, although these challenges continued to be present in TikTok, they were no longer able to stimulate meaningful interactions with users.
After choosing the challenges, we developed a crawler to obtain public data about them and the corresponding videos. Our crawler anonymises information about the authors of the videos. More specifically, for each challenge, it records the identifier of the video originating it and the ones of the other videos referring to it. For each of these videos, our crawler also derives its list of likes. Finally, for each like, it determines (1) the user who posted it, (2) her privacy policy and (3) any possible video that she posted for the same challenge. 2
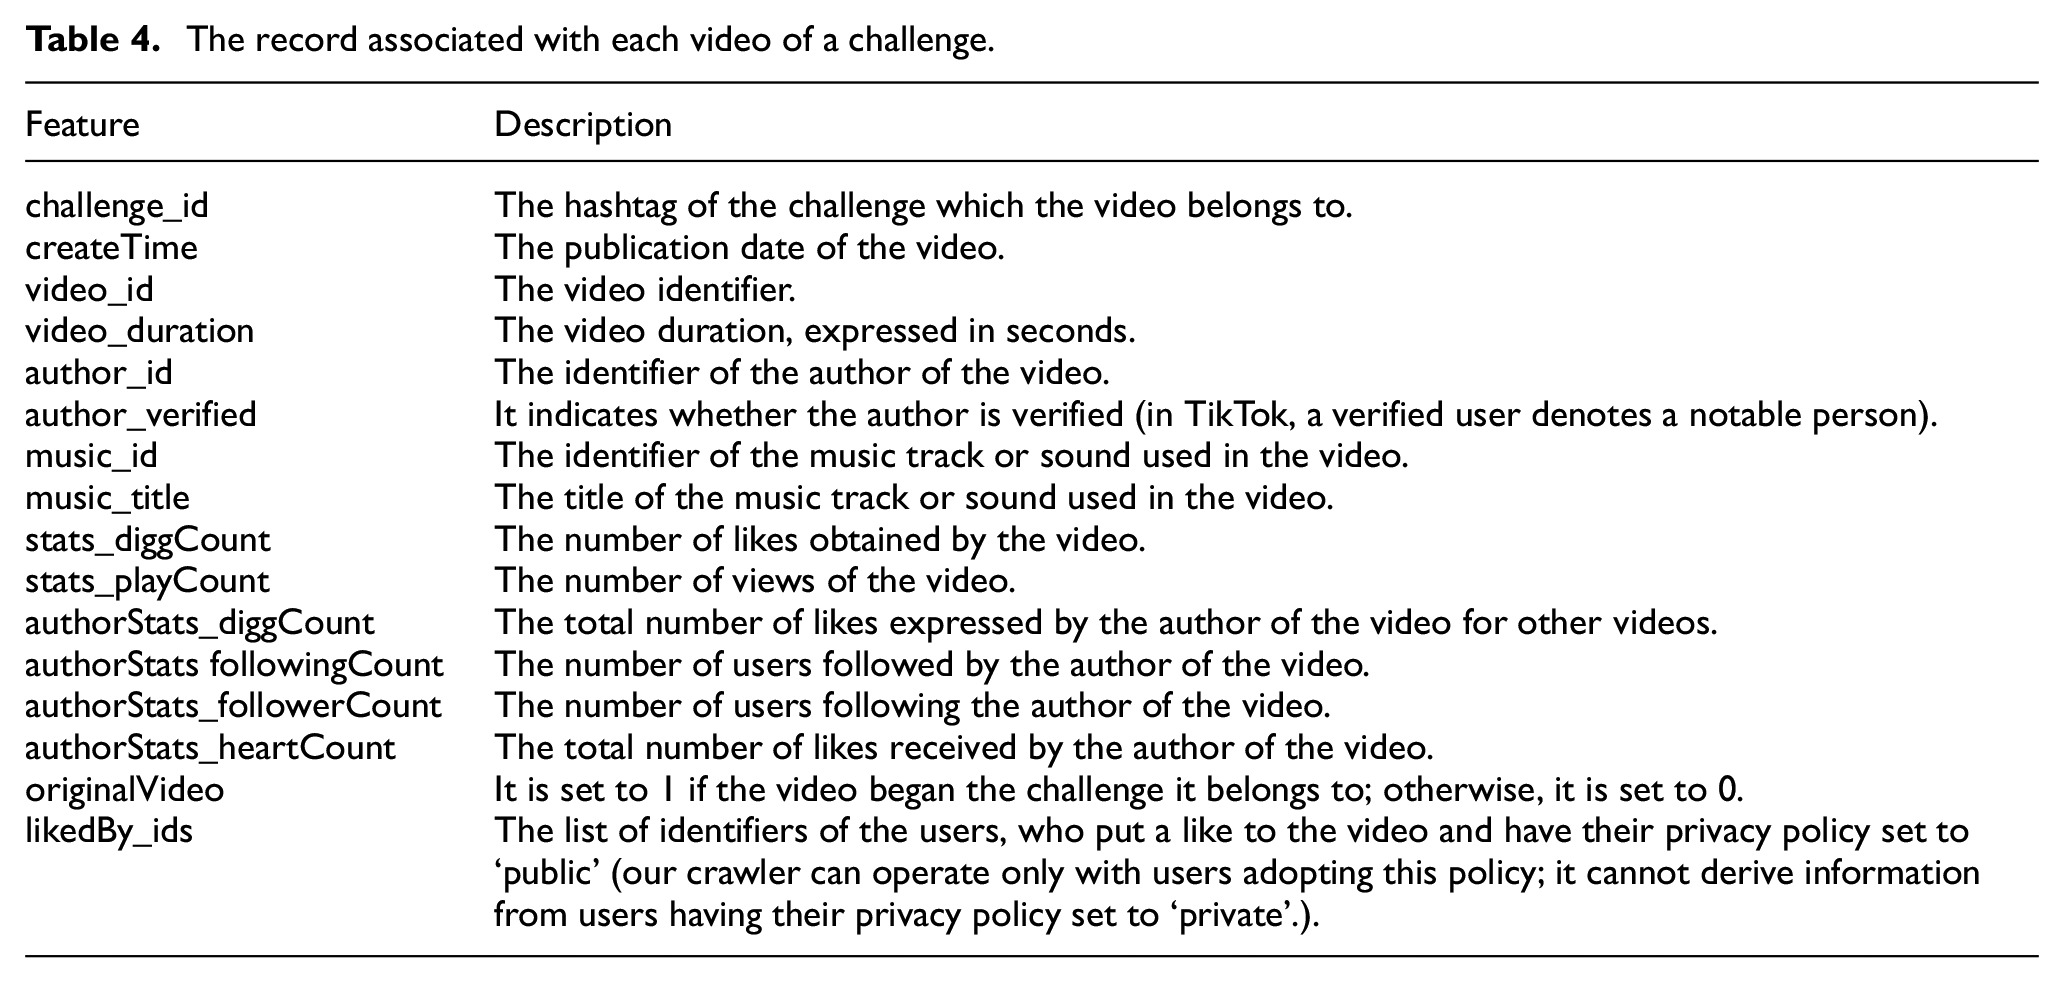
After downloading the data for each video and performing some pre-processing tasks, we obtained a record for it. This record contains the fields shown in Table 4.
The record associated with each video of a challenge.
4. Model definition
After illustrating the data set on which performing our analyses, we want to define a model to represent a challenge. Our model is a social network-based one.
Specifically, let
Ai is the set of arcs of
An example helps us to better understand our model. Suppose to have a challenge Ci and five users, say Alice, Bob, Mary, Peter and Kate. Alice posts a video for Ci at timestamp t1 and another video for Ci at timestamp t2 > t1. Mary likes the video of Alice at timestamp t3 > t2 and a video for Ci at timestamp t4 > t3. Bob posts a video at timestamp t5 > t4. Peter likes the video of Mary at timestamp t6 > t5 and the video of Bob at timestamp t7 > t6. Finally, he posts a video for Ci at timestamp t8 > t7. Kate likes the video of Peter at timestamp t9 > t8 and the video of Bob at timestamp t10 > t9. Finally, Kate posts a video for Ci at timestamp t11 > t10 and Peter posts another video for Ci at timestamp t12 > t11. The corresponding network
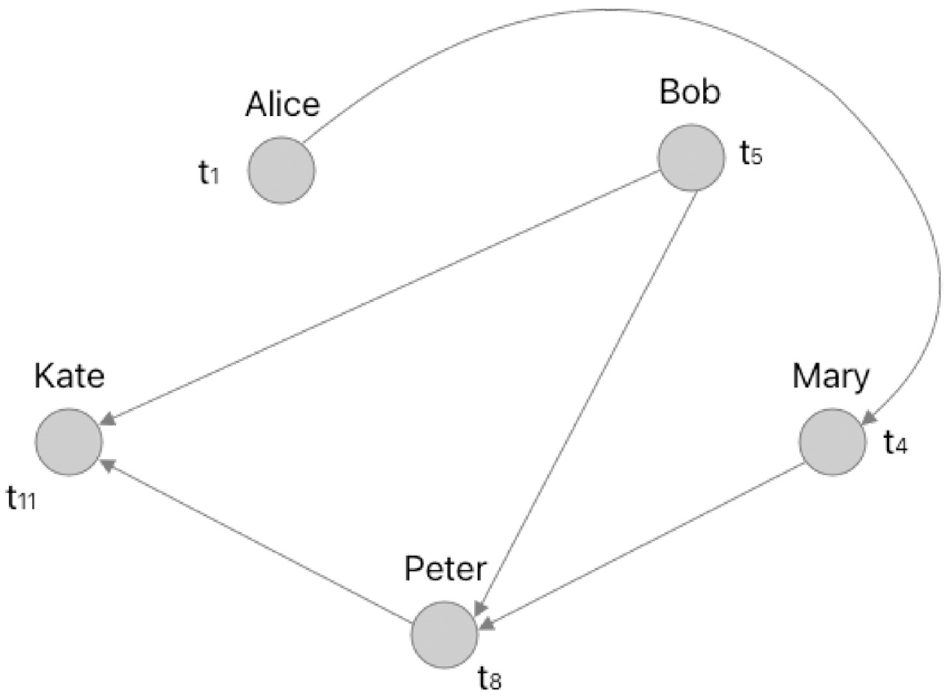
An example of a network corresponding to a challenge.
Note that in
To give an idea of the variety of the obtained social networks (and, therefore, of the corresponding challenges), in Figure 2 (resp., Figure 3), we show a representation of those associated with non-dangerous (resp., dangerous) challenges.
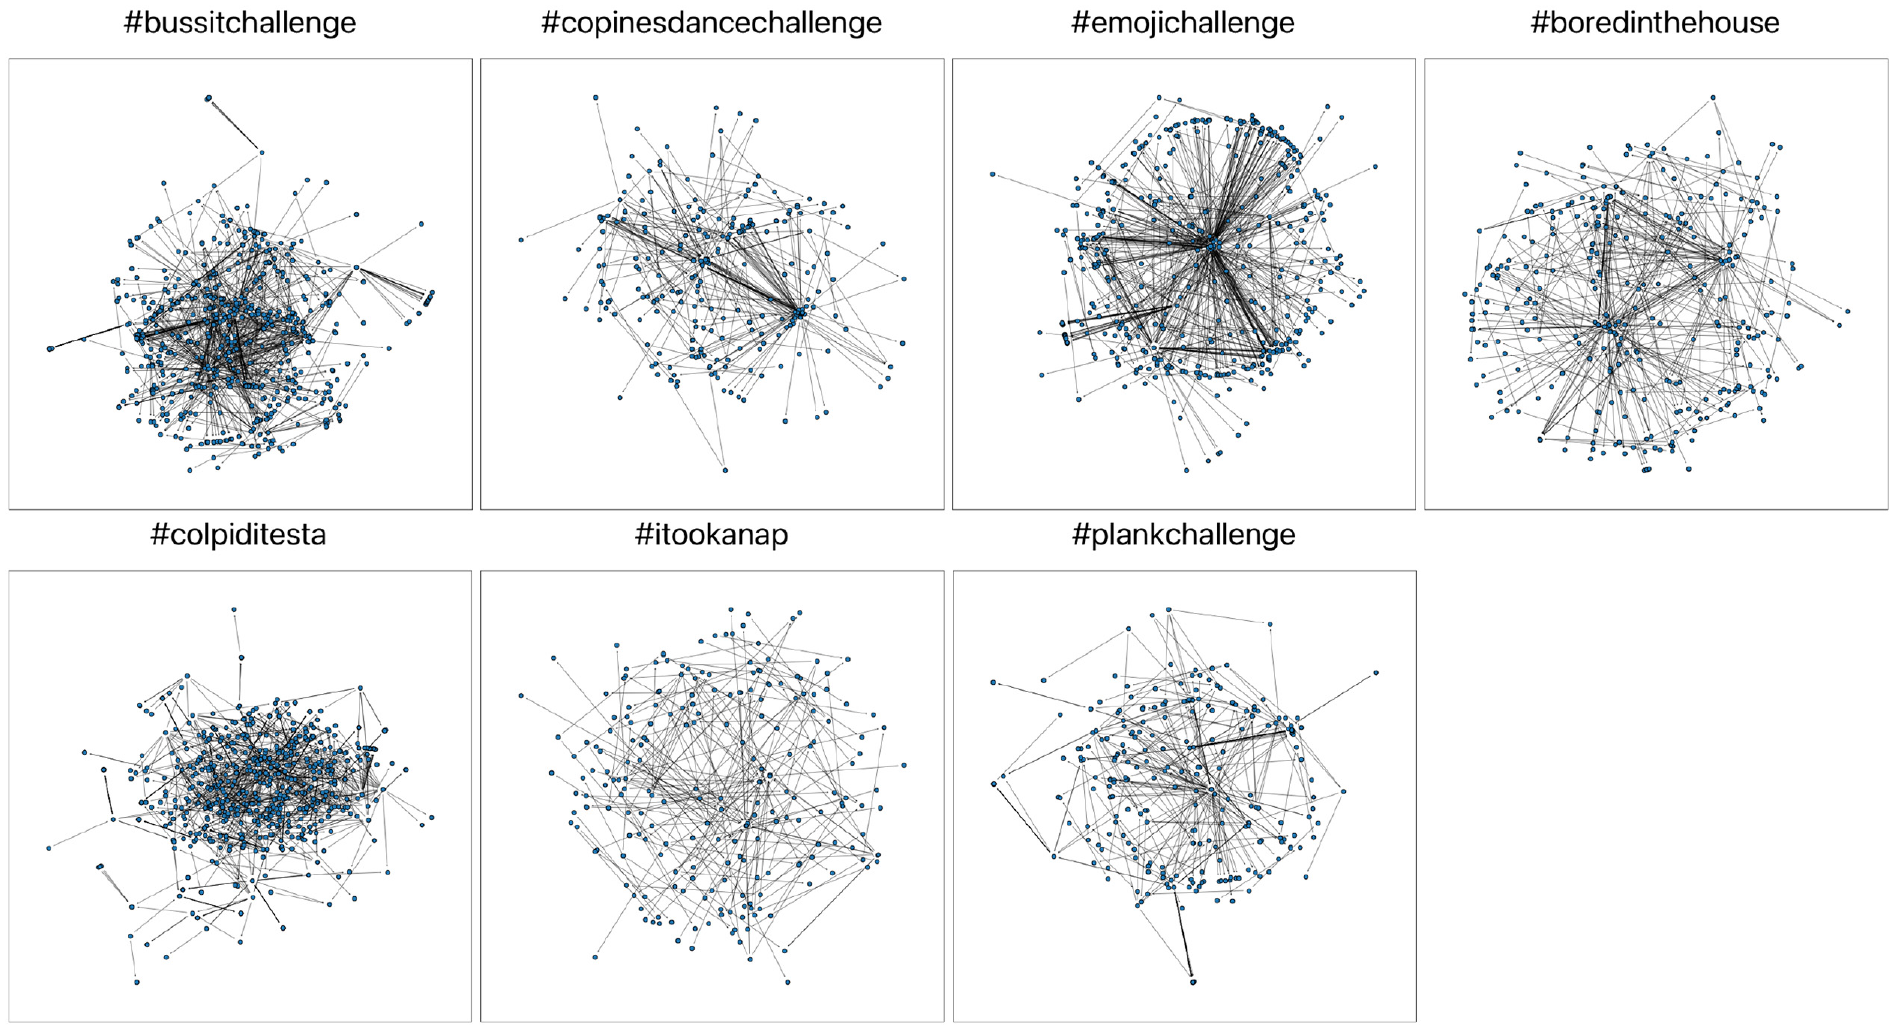
Structure of non-dangerous networks.
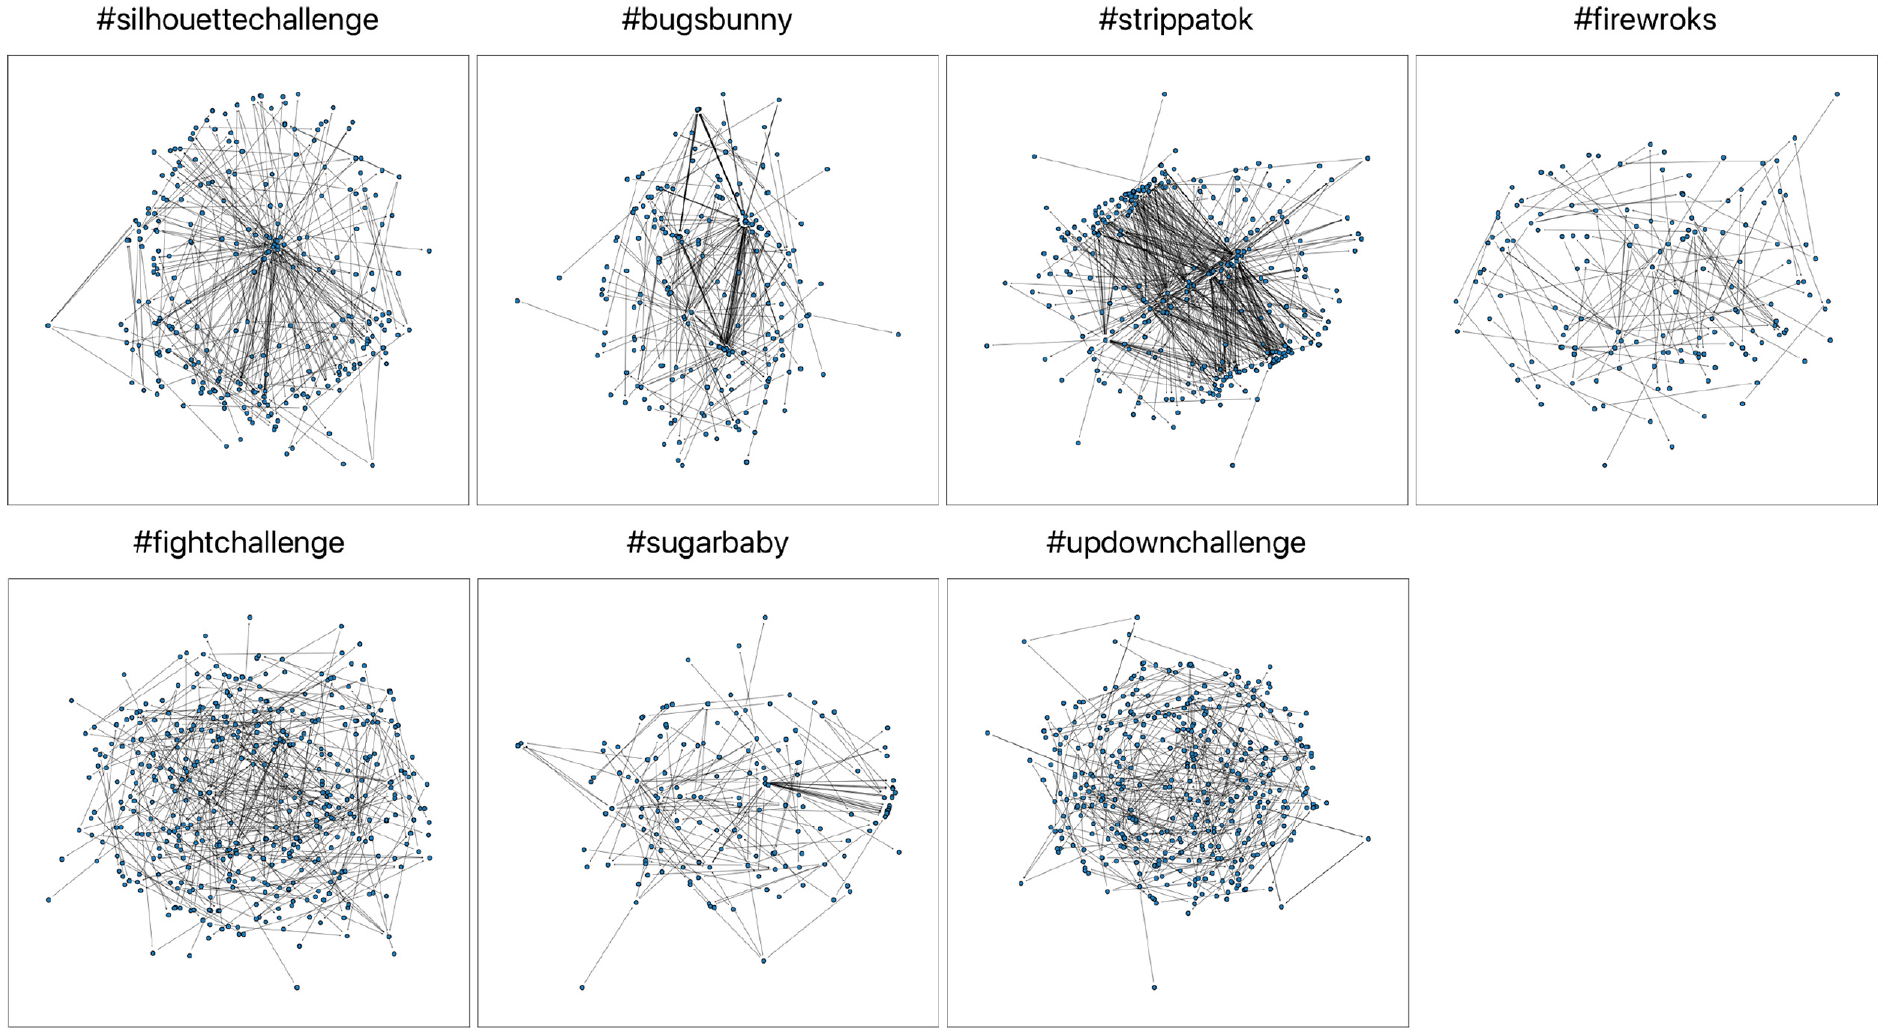
Structure of dangerous networks.
5. A preliminary analysis of challenges
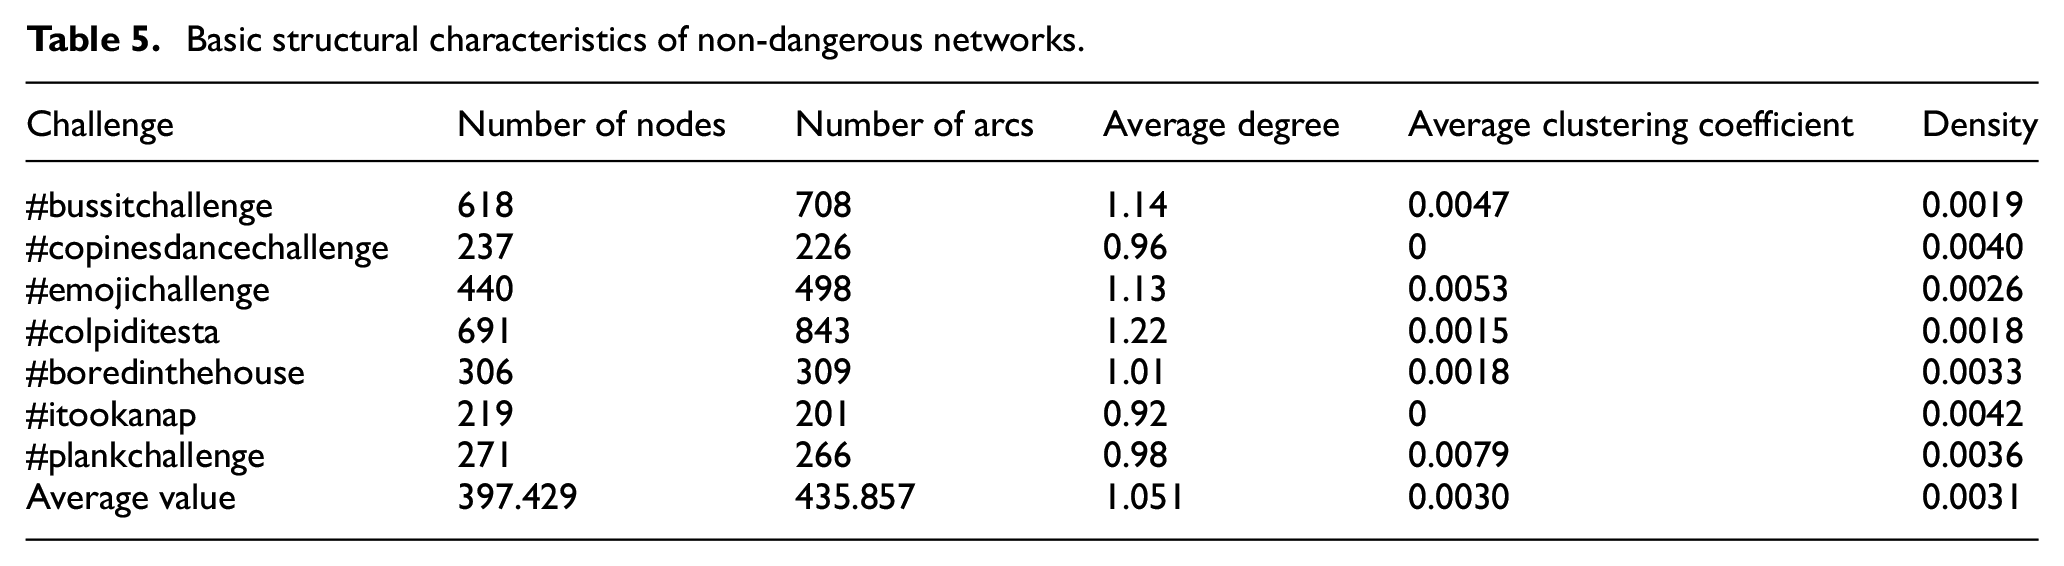
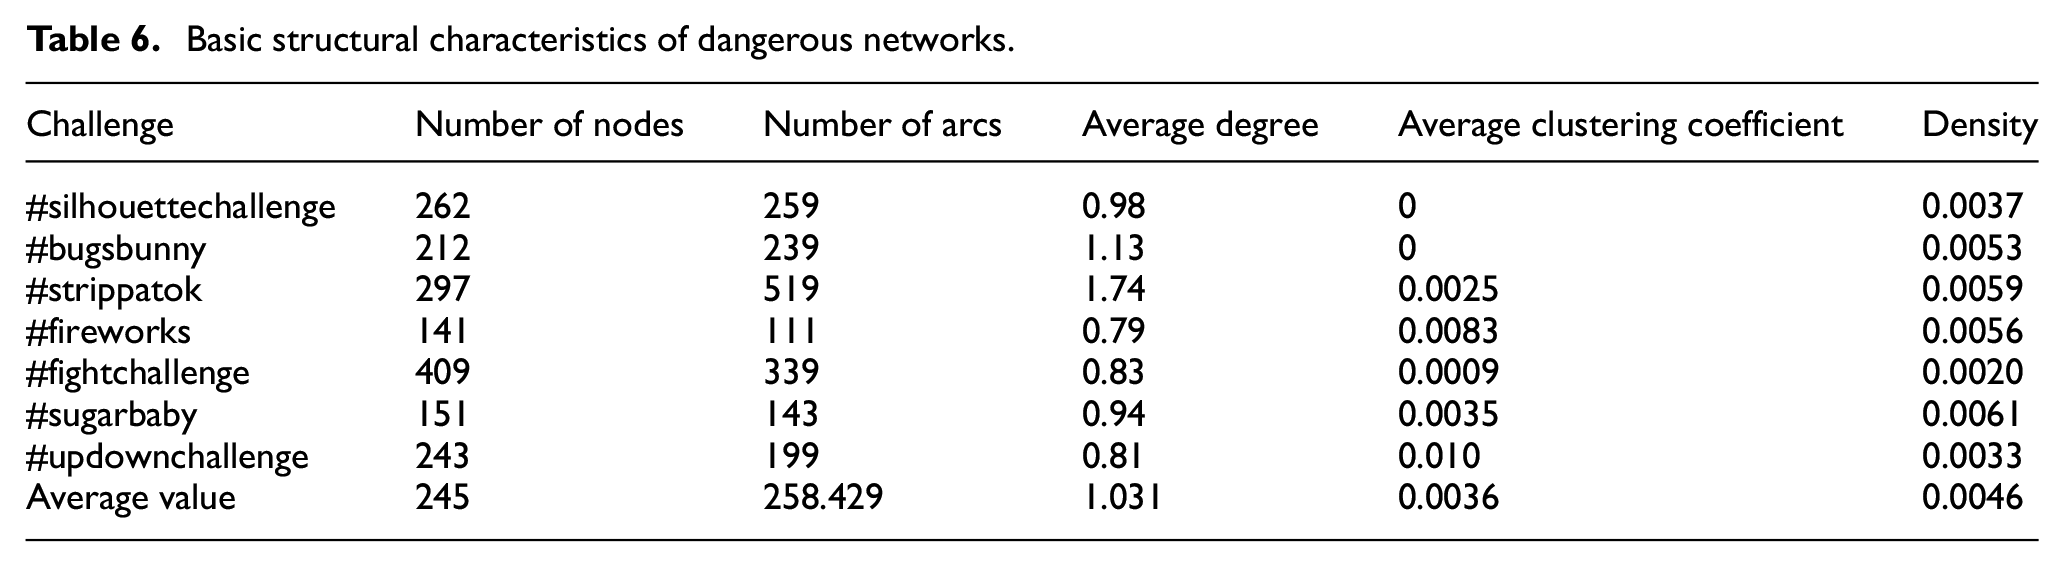
In this section, we begin with a preliminary analysis of the networks associated with the challenges of our data set. It serves a dual purpose, namely, (1) verifying if there are structural differences between the networks associated with the two types of challenges; (2) identifying interesting insights to investigate whether the user communities related to the two types of challenges have different evolutions or not, which is the core of this article. In Tables 5 and 6, we report the values of the basic structural parameters for the two types of networks. The analysis of these tables allows us to draw the following conclusions: (1) the size of the networks representing non-dangerous challenges is generally greater than that of the networks associated with dangerous challenges; (2) the average degree and the average clustering coefficient of the two kinds of network are comparable; and (3) the density of the networks associated with dangerous challenges is higher than the one of the networks associated with non-dangerous challenges.
Basic structural characteristics of non-dangerous networks.
Basic structural characteristics of dangerous networks.
To assess the statistical significance of these results, we performed the appropriate t-tests and computed the corresponding p-values.
For case (1), the null hypotheses were H0: ‘The number of nodes in the non-dangerous networks and that in the dangerous networks are equal’ and H0: ‘The number of arcs in the non-dangerous networks and that in the dangerous networks are equal’. In the first case, we obtained a p-value equal to 0.012, while in the second case, the p-value was equal to 0.014. In both cases, the value is less than 0.05.
Therefore, we can conclude that the two null hypotheses can be rejected.
For case (2), the null hypotheses were H0: ‘The average degree of the non-dangerous networks and that of the dangerous networks are equal’ and H0: ‘The average clustering coefficient of the non-dangerous networks and that of the dangerous networks are equal’. In the first case, we obtained a p-value equal to 0.85, while in the second case, the p-value was equal to 0.91. In both cases, this value is much greater than 0.05, so we can conclude that the two null hypotheses cannot be rejected.
For case (3), the null hypothesis was H0: ‘The density of non-dangerous networks and that of dangerous networks are equal’. In this case, we obtained a p-value of 0.024, which is less than 0.05.
Therefore, we can conclude that the null hypothesis can be rejected.
Finally, we point out that, in the previous tests, when the variances were not statistically different, we used the classical t-test. Instead, in the other cases, we adopted Welch’s t-test [29]. To assess whether the variances were statistically different, we used Bartlett’s [73] t-test.
After examining the characteristics of the networks associated with the two types of challenges, we proceeded to examine their corresponding videos. Their main characteristics are shown in Table 7. From the analysis of this table we can deduce that (1) the two types of challenges have videos with similar duration; (2) non-dangerous challenges have a higher average number of music tracks than dangerous challenges; (3) dangerous challenges have a higher average number of likes, comments, shares and views than non-dangerous challenges. In order to assess the statistical significance of these results, we carried out the suitable t-tests and computed the corresponding values. As in the previous cases, when the variances were not statistically different, we adopted the classical t-test; otherwise, we employed Welch’s t-test. To verify whether the variances were statistically different, we used Bartlett’s t-test.
Differences between the main basic characteristics of videos for non-dangerous and dangerous challenges.
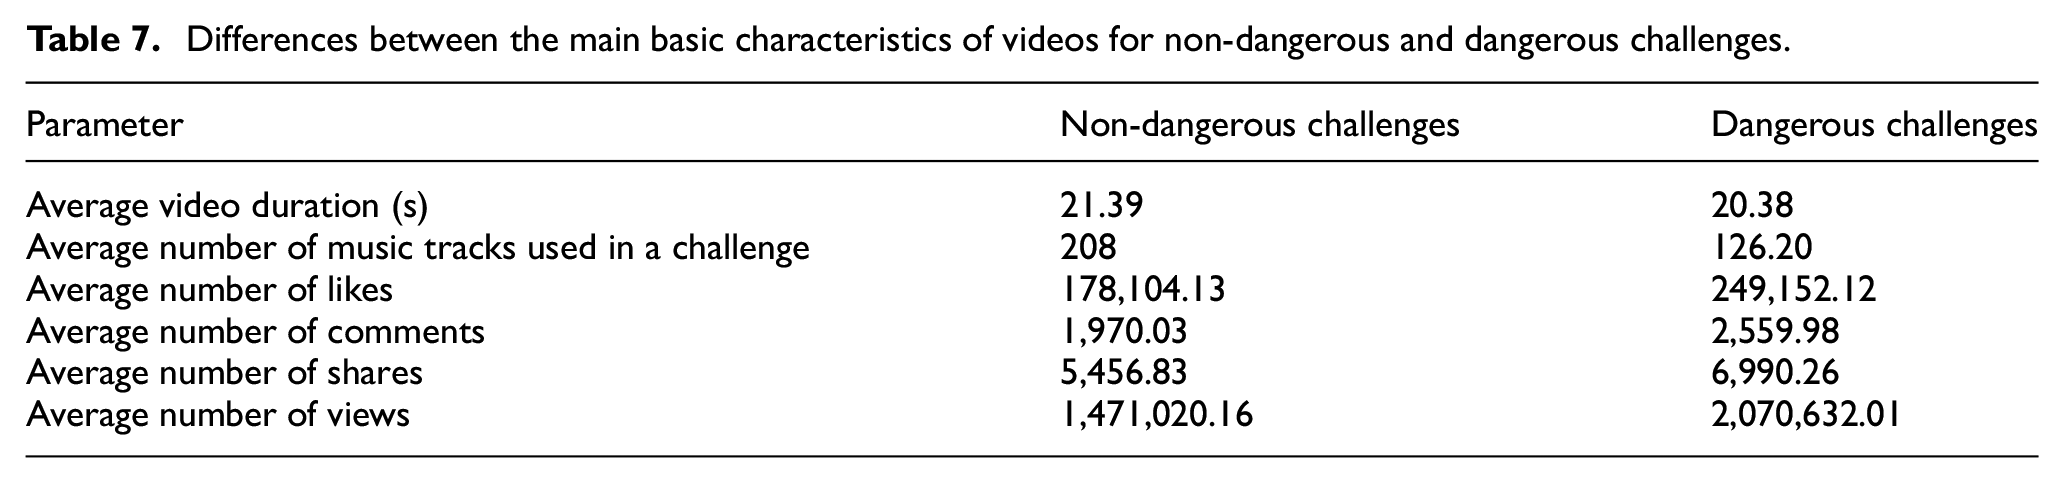
For case (1), the null hypothesis was H0: ‘The average video duration in the non-dangerous challenges and that in the dangerous challenges are equal’. In this case, we obtained a p-value equal to 0.88, which is much greater than 0.05. Therefore, we can conclude that the null hypothesis cannot be rejected.
For cases (2) and (3), the null hypotheses were (1) H0: ‘The average number of music tracks used in the non-dangerous challenges and the average number of music tracks used in the dangerous challenges are equal’, (2) H0: ‘The average number of likes in the non-dangerous challenges and that in the dangerous challenges are equal’, (3) H0: ‘The average number of comments in the non-dangerous challenges and that in the dangerous challenges are equal’, (4) H0: ‘The average number of shares in the non-dangerous challenges and that in the dangerous challenges are equal’, and (5) H0: ‘The average number of views in the non-dangerous challenges and that in the dangerous challenges are equal’. In these five cases we obtained the following p-values: (1) 0.012, (2) 0.014, (3) 0.022, (4) 0.018, and (5) 0.007. All the five p-values are less than 0.05. Therefore, we can conclude that all the five null hypotheses can be rejected.
At this point, we looked at the authors of the videos posted for the two types of challenges and examined their main characteristics. These are shown in Table 8. From the analysis of this table we can deduce that (1) the average number of followers is comparable for the two types of authors; (2) the authors of non-dangerous challenges tend to put more likes, follow many more authors and post many more videos than the ones of dangerous challenges; and (3) the authors of dangerous challenges receive many more likes than the ones of non-dangerous challenges. Once again, we employed the approach already described for Tables 5 and 6 to verify the statistical significance of the results obtained.
Differences between the main basic characteristics of the authors of videos for non-dangerous and dangerous challenges.
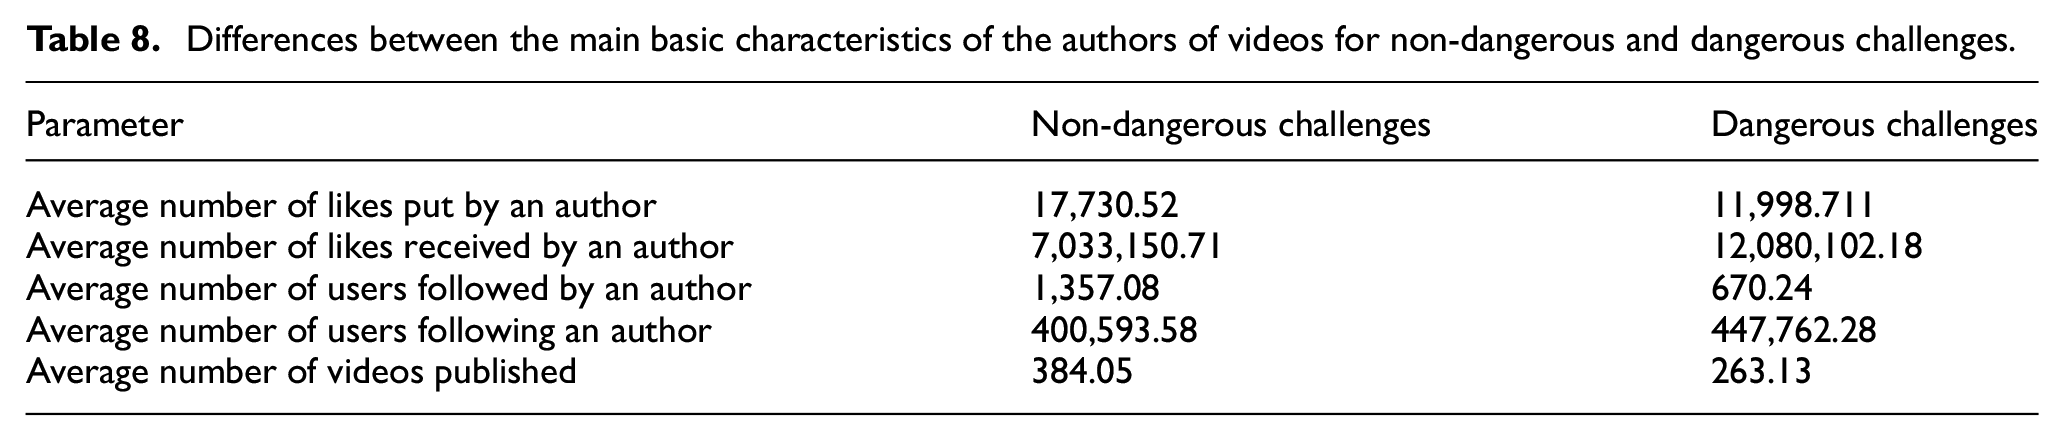
In particular, for case (1), the null hypothesis was H0: ‘The average number of users following authors of non-dangerous challenges and the average number of users following authors of dangerous challenges are equal’. In this case, we obtained a p-value equal to 0.55, which is much greater than 0.05. Therefore, we can conclude that the null hypothesis cannot be rejected.
For cases (2) and (3), the null hypotheses were (1) H0: ‘The average number of likes put by authors of non-dangerous challenges and that put by authors of dangerous challenges are equal’, (2) H0: ‘The average number of likes received by authors of non-dangerous challenges and that received by authors of dangerous challenges are equal’, (3) H0: ‘The average number of users followed by authors of non-dangerous challenges and the average number of users followed by authors of dangerous challenges are equal’, (4) H0: ‘The average number of videos published by authors of non-dangerous challenges and that published by authors of dangerous challenges are equal’. In these four cases, we obtained the following p-values: (1) 6.57 × 10⁻⁴, (2) 8.46 × 10⁻⁶, (3) 0.0042, and (4) 0.014. All the four p-values are less than 0.05. Therefore, we can conclude that all the four null hypotheses can be rejected.
Finally, we considered the evolution of user communities associated with non-dangerous and dangerous challenges over time. In this preliminary analysis, we focused only on the variation in the number of users. The results obtained are shown in Table 9. Examining this table, we can see important differences between non-dangerous and dangerous challenges. First, the average lifespan of dangerous challenges is longer than the one of non-dangerous challenges. Also, the growth of the number of users in non-dangerous challenges is more gradual than the one in dangerous challenges. Indeed, as for non-dangerous challenges, when passing from 5% to 10%, 15% and 20% of the lifespan, the number of users 4 grows from 2.16% to 35.32%, 43.28% and 45.15% of the final number of users. Instead, as for dangerous challenges, when we pass from 5% to 10%, 15% and 20% of the lifespan, the number of users grows from 0.90% to 3.10%, 9.12% and 23.93% of the final number of users. For all these parameters we adopted the approach already described for Tables 5–7 to verify the statistical significance of the results obtained. In these cases, the null hypotheses were: (1) H0: ‘The average lifespan of non-dangerous challenges and that of dangerous challenges are equal’, (2) H0: ‘The average number of network nodes at 5% of lifespan in non-dangerous challenges and that in dangerous challenges are equal’, (3) H0: ‘The average number of network nodes at 25% of lifespan in non-dangerous challenges and that in dangerous challenges are equal’, (4) H0: ‘The average number of network nodes at 50% of lifespan in non-dangerous challenges and that in dangerous challenges are equal’, (5) H0: ‘The average number of network nodes at 75% of lifespan in non-dangerous challenges and that in dangerous challenges are equal’, and (6) H0: ‘The average number of network nodes in non-dangerous challenges and that in dangerous challenges are equal’. In these six cases, we obtained the following p-values: (1) 0.015, (2) 2.23 × 10⁻⁶, (3) 7.54 × 10⁻⁷, (4) 8.65 × 10⁻⁸, (5) 0.011, and (6) 0.028. All the six p-values are less than 0.05. Therefore, we can conclude that all the six null hypotheses can be rejected.
Differences between the growth of user communities associated with non-dangerous and dangerous challenges.
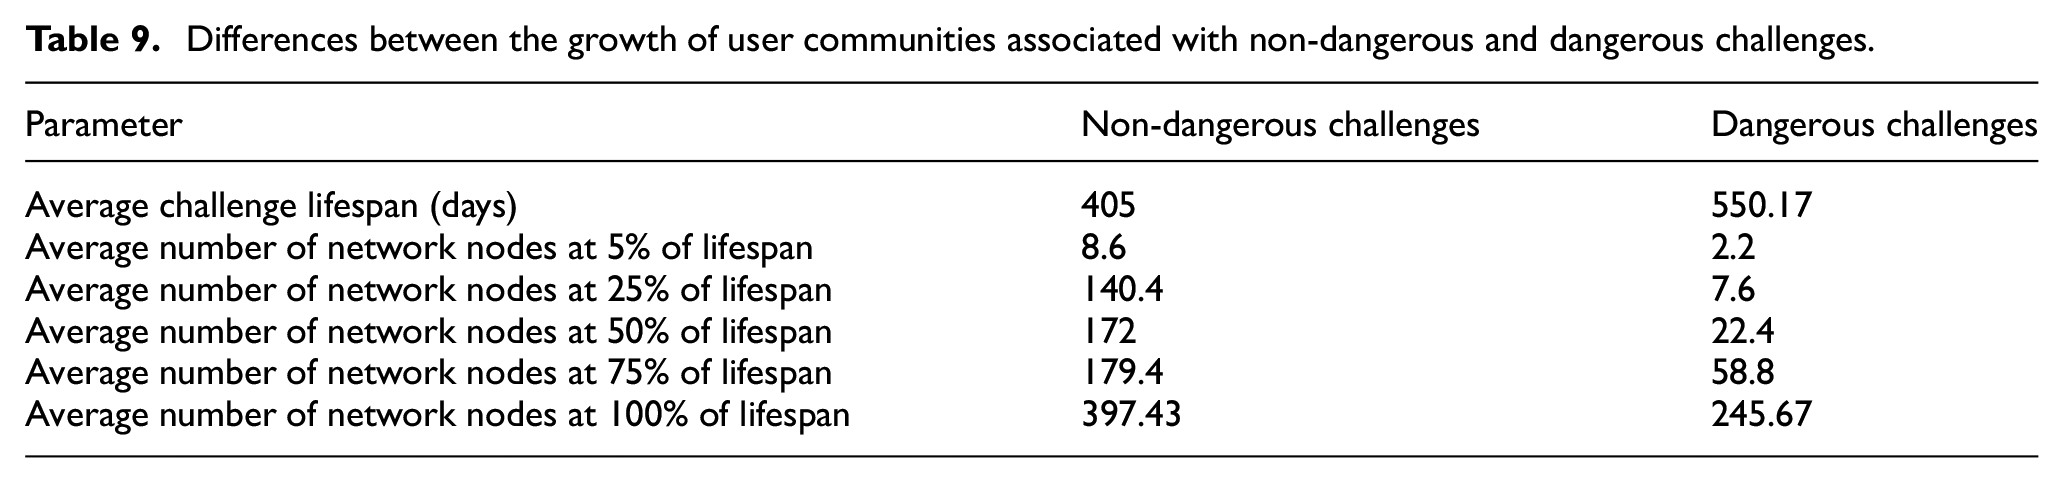
This preliminary analysis seems to suggest that the communities of users associated with the two types of challenges have very different growth dynamics. Finding out whether this conjecture is true and, if so, investigating these differences in detail and finding evolutionary patterns characterising them represent the core of this article.
6. Analysis of the evolution of user communities for non-dangerous and dangerous challenges
In this section, we present the core of this article, which is the identification of possible evolutionary patterns that characterise the communities of users related to TikTok challenges and allow the distinction of non-dangerous challenges from dangerous ones.
The first step of this research consists in analysing the temporal evolution of the 14 challenges in our data set. In particular, we want to determine if the lifespans of the various challenges contain common typical intervals. Examples of such intervals might be (1) the interval in which the challenge is born and a very first community of users begins to develop; (2) the interval in which the challenge is enormously successful and becomes viral; (3) the interval in which the challenge’s popularity begins to decline; and (4) the interval in which the challenge has become obsolete and is abandoned. In addition, we want to test whether these intervals are characterised by very different behaviours from the user communities associated with challenges. Finally, behavioural differences among user communities could occur not only based on the type of intervals but also, and perhaps most importantly, based on the type (i.e. non-dangerous and dangerous) of challenge.
To begin our research, we considered how the size of each community evolved during the lifespan of the corresponding challenge. As seen in Section 4, the community associated with each challenge can be modelled as a social network and there is a biunivocal correspondence between the users of a community and the nodes of the corresponding social network.
We now consider a plot whose x-axis represents the lifespan of a challenge and whose y-axis denotes the number of members of the community associated with it or, equivalently, the number of nodes of the corresponding social network. If we subdivide the lifespan into suitable time slots (also very small), consider the number of social network nodes in correspondence to each time slot, find the corresponding points in the diagram and join them, we obtain a broken line, which denotes the variation of the community size during the challenge lifespan. We chose a very fine granularity and, in fact, we divided the lifespan into 100 time slots. With this choice, the broken line becomes very detailed, providing a very accurate representation of how the community size varies over time. However, for reasons that will become clear later, we needed a continuous function, instead of a broken line. To obtain it, we interpolated the points of the broken line using a univariate spline.
To test whether the difference between the broken lines and the curves obtained from the interpolation is acceptable, we computed the mean absolute error (MAE) by considering 100 additional equidistant points for each time slot (and, thus, 10,000 points for each lifespan). Then, we normalised the MAE value at each point to the value of the broken line at the same point. Table 10 shows the results obtained. The analysis of this table reveals that the average values of the normalised MAE are very low. This allows us to conclude that the interpolation performed by us is acceptable.
Normalised MAE between the continuous function returned by the univariate spline interpolation and the real values for non-dangerous challenges (at left) and dangerous ones (at right).
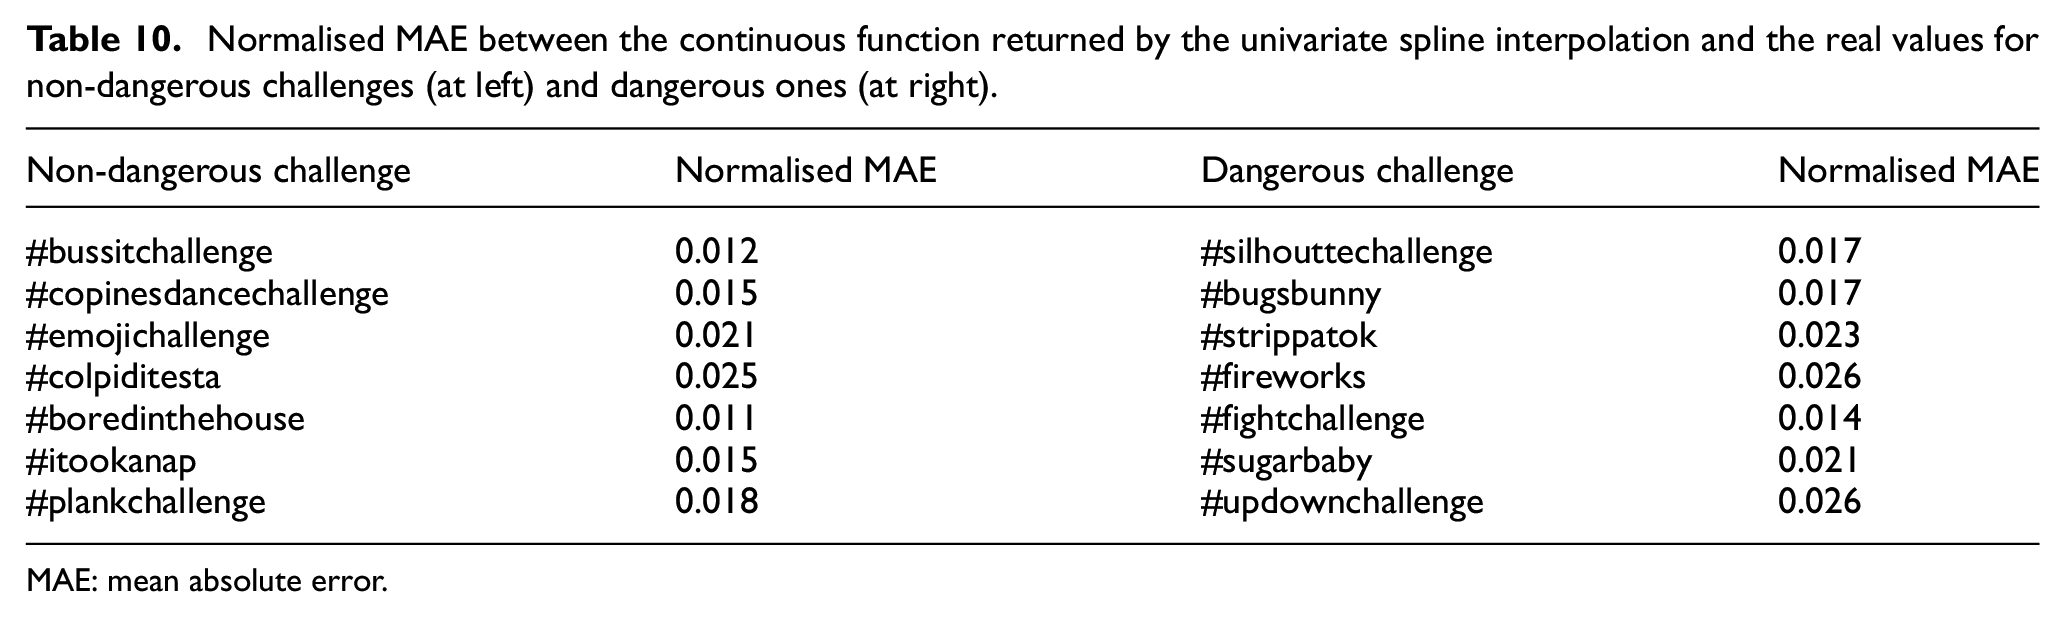
MAE: mean absolute error.
To analyse how the communities associated with challenges evolve over time, we found it useful to identify the points of the lifespan where their characteristics change. Since, up to this point, the most important characteristic that we know is community size, this implies considering the points at which the broken line or the corresponding interpolation curve inverts. This is the reason why we used the interpolation curve with the univariate spline. In fact, in this way, we have a continuous function and the points where it inverts are given by the ones where it reaches a maximum or a minimum.
More formally, let Ci be a challenge, let
Figures 4 and 5 show the trends of the function νi(·) for each non-dangerous and dangerous challenge, respectively. They also show the corresponding intervals. Already from this first visual analysis, we can observe that, in the two kinds of challenge, the corresponding communities show completely different dynamics. Capturing and formalising such dynamics represent the objective of the next sections.
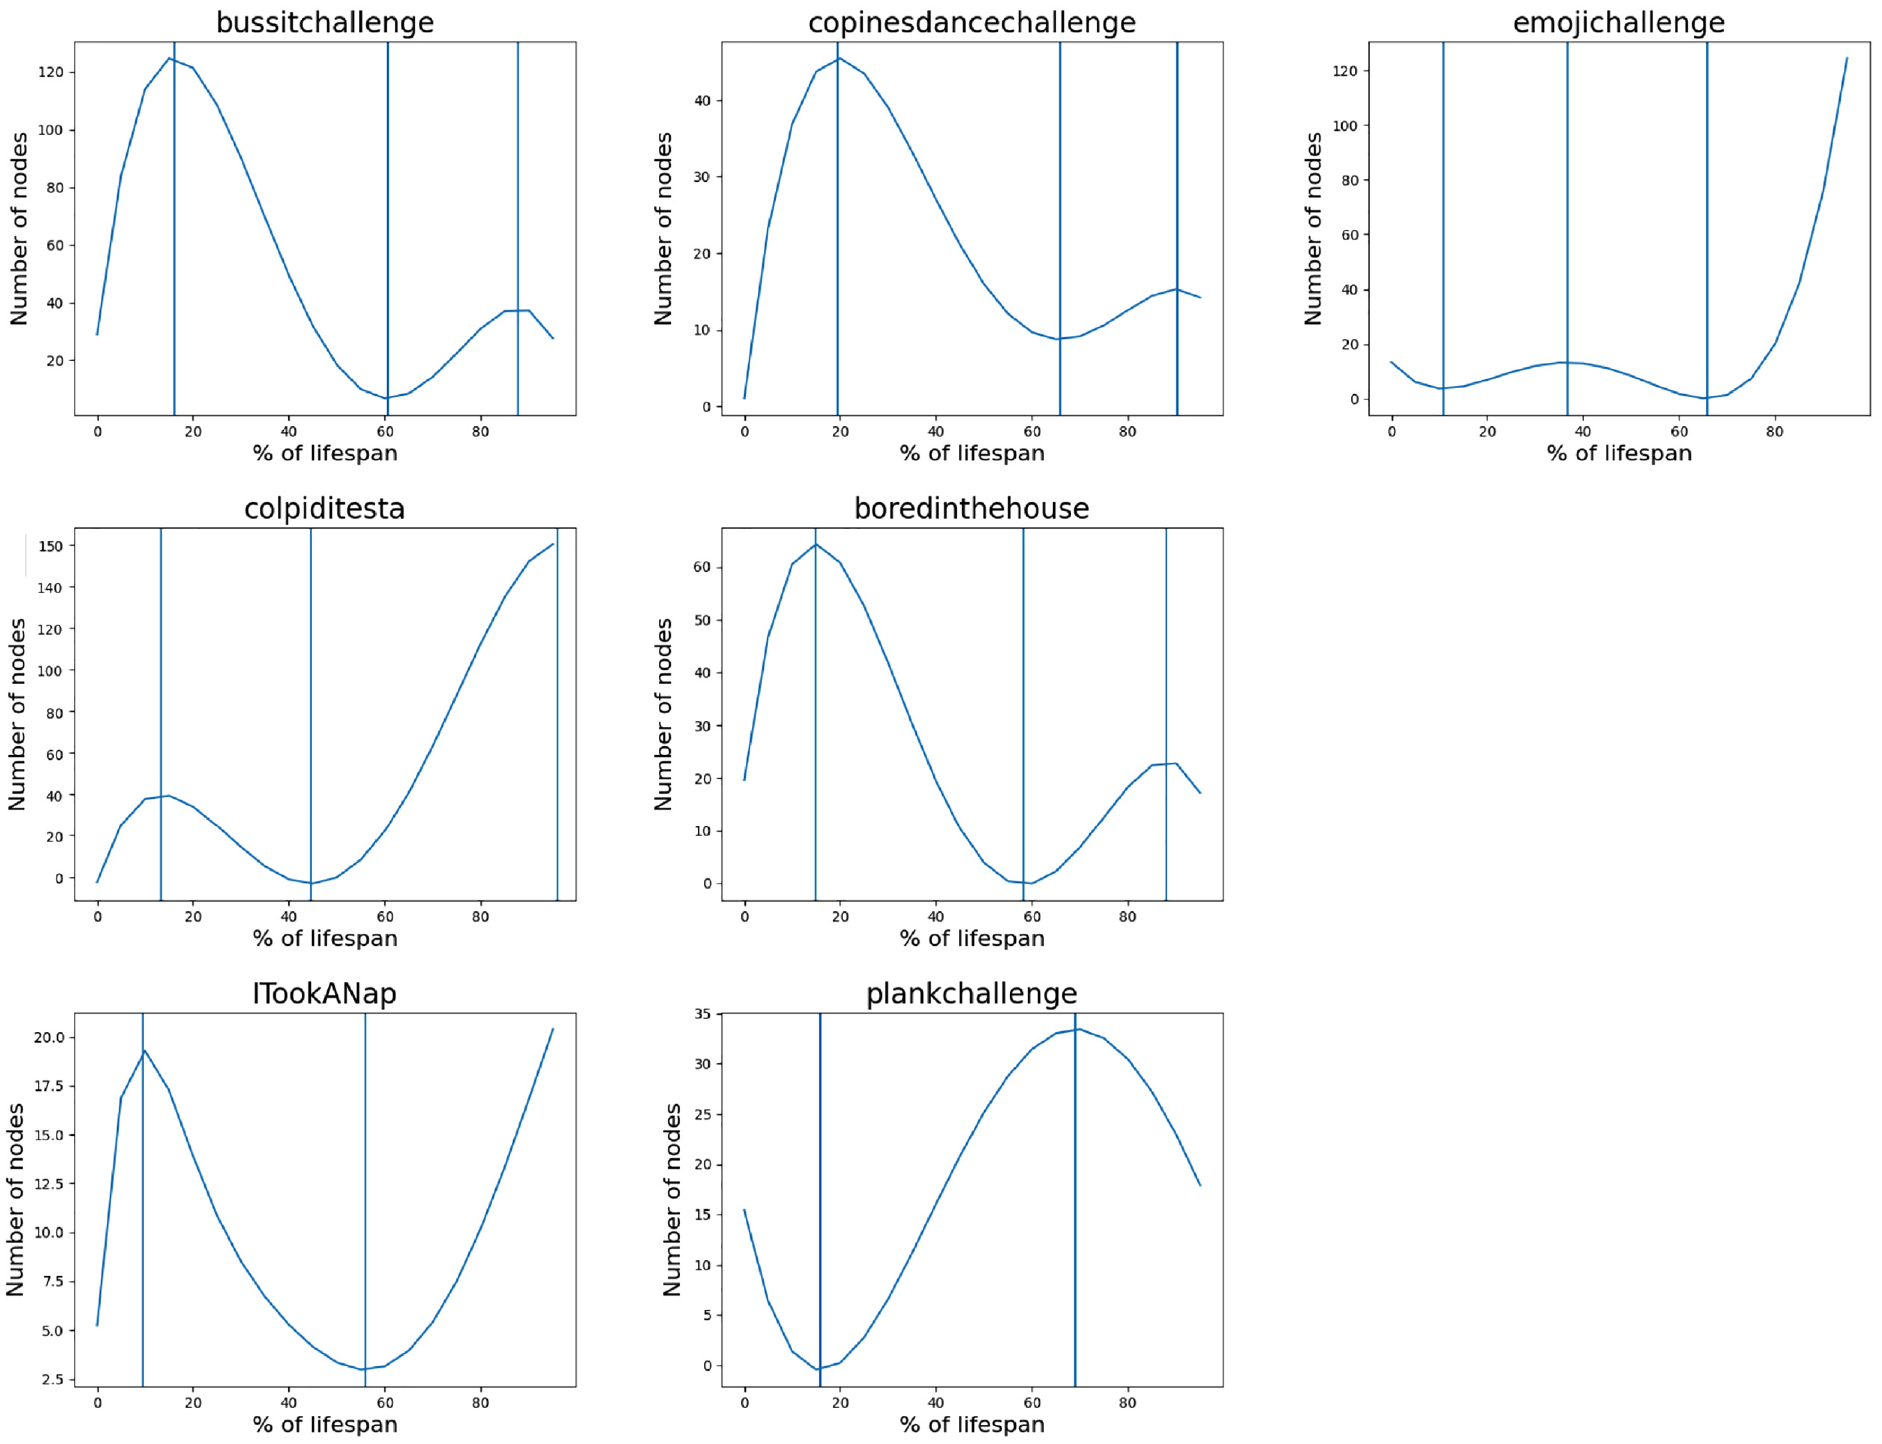
Trends and intervals of νi(·) for non-dangerous challenges.
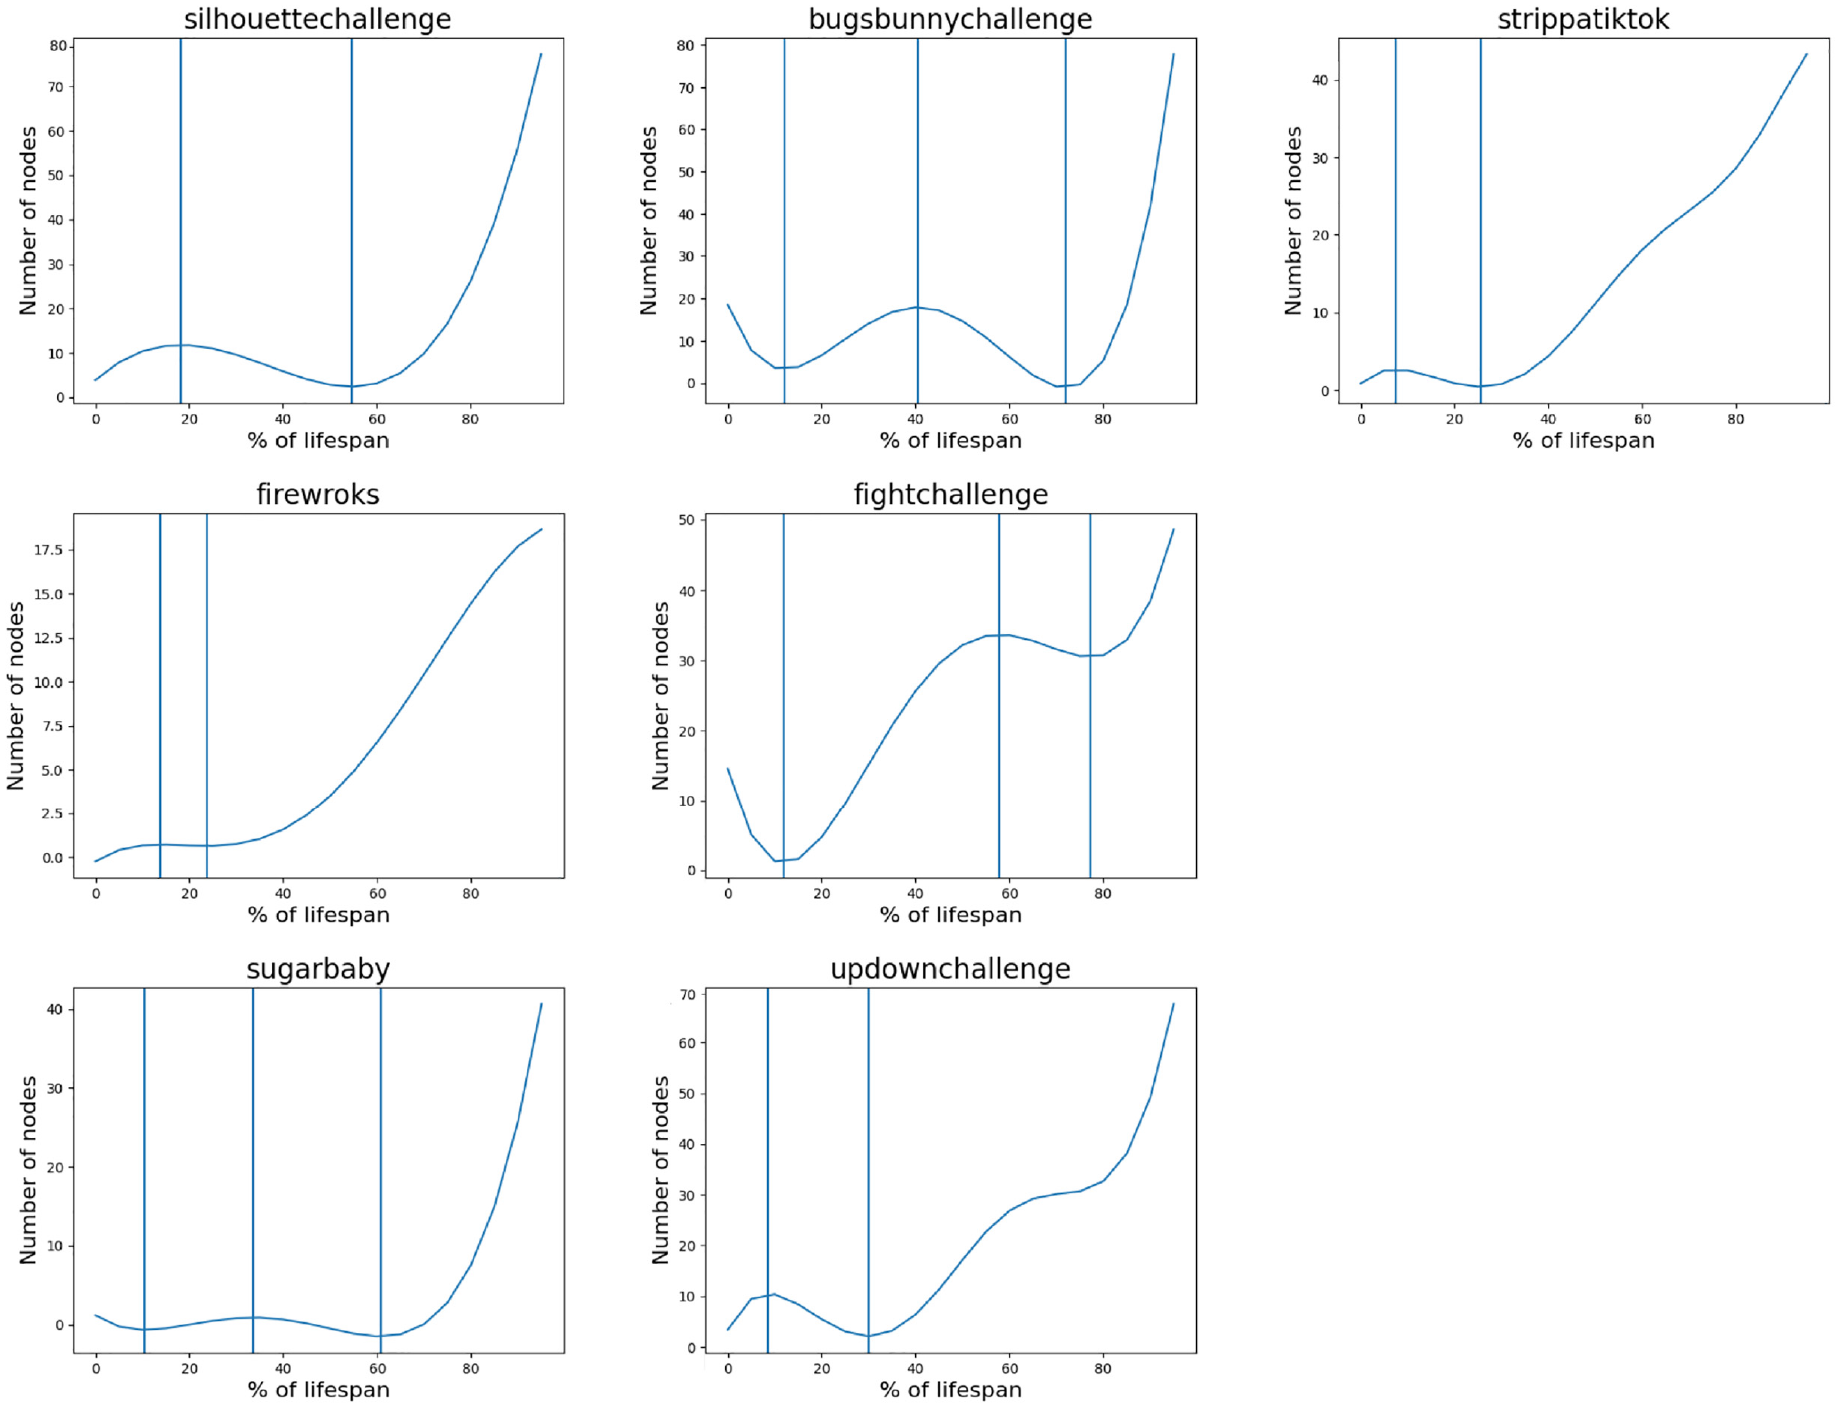
Trends and intervals of νi(·) for dangerous challenges.
6.1. Capturing community evolution during a challenge lifespan
In order to capture the evolution of communities during a challenge lifespan, it is first necessary to identify features capable of representing this evolution in detail and from multiple perspectives. To this end, we are helped by the social network-based model that we introduced in Section 4. Thanks to this model, given a challenge Ci and the social network
As we can see, we have a lot of available features, and managing all of them can be complex. Therefore, we decided to check for possible correlations between them. In fact, if a group of features is correlated, we can keep only one of them and filter out the others. Figure 6 shows the correlation matrix we obtained by applying Pearson’s correlation coefficient [29] to the pairs of features identified above.
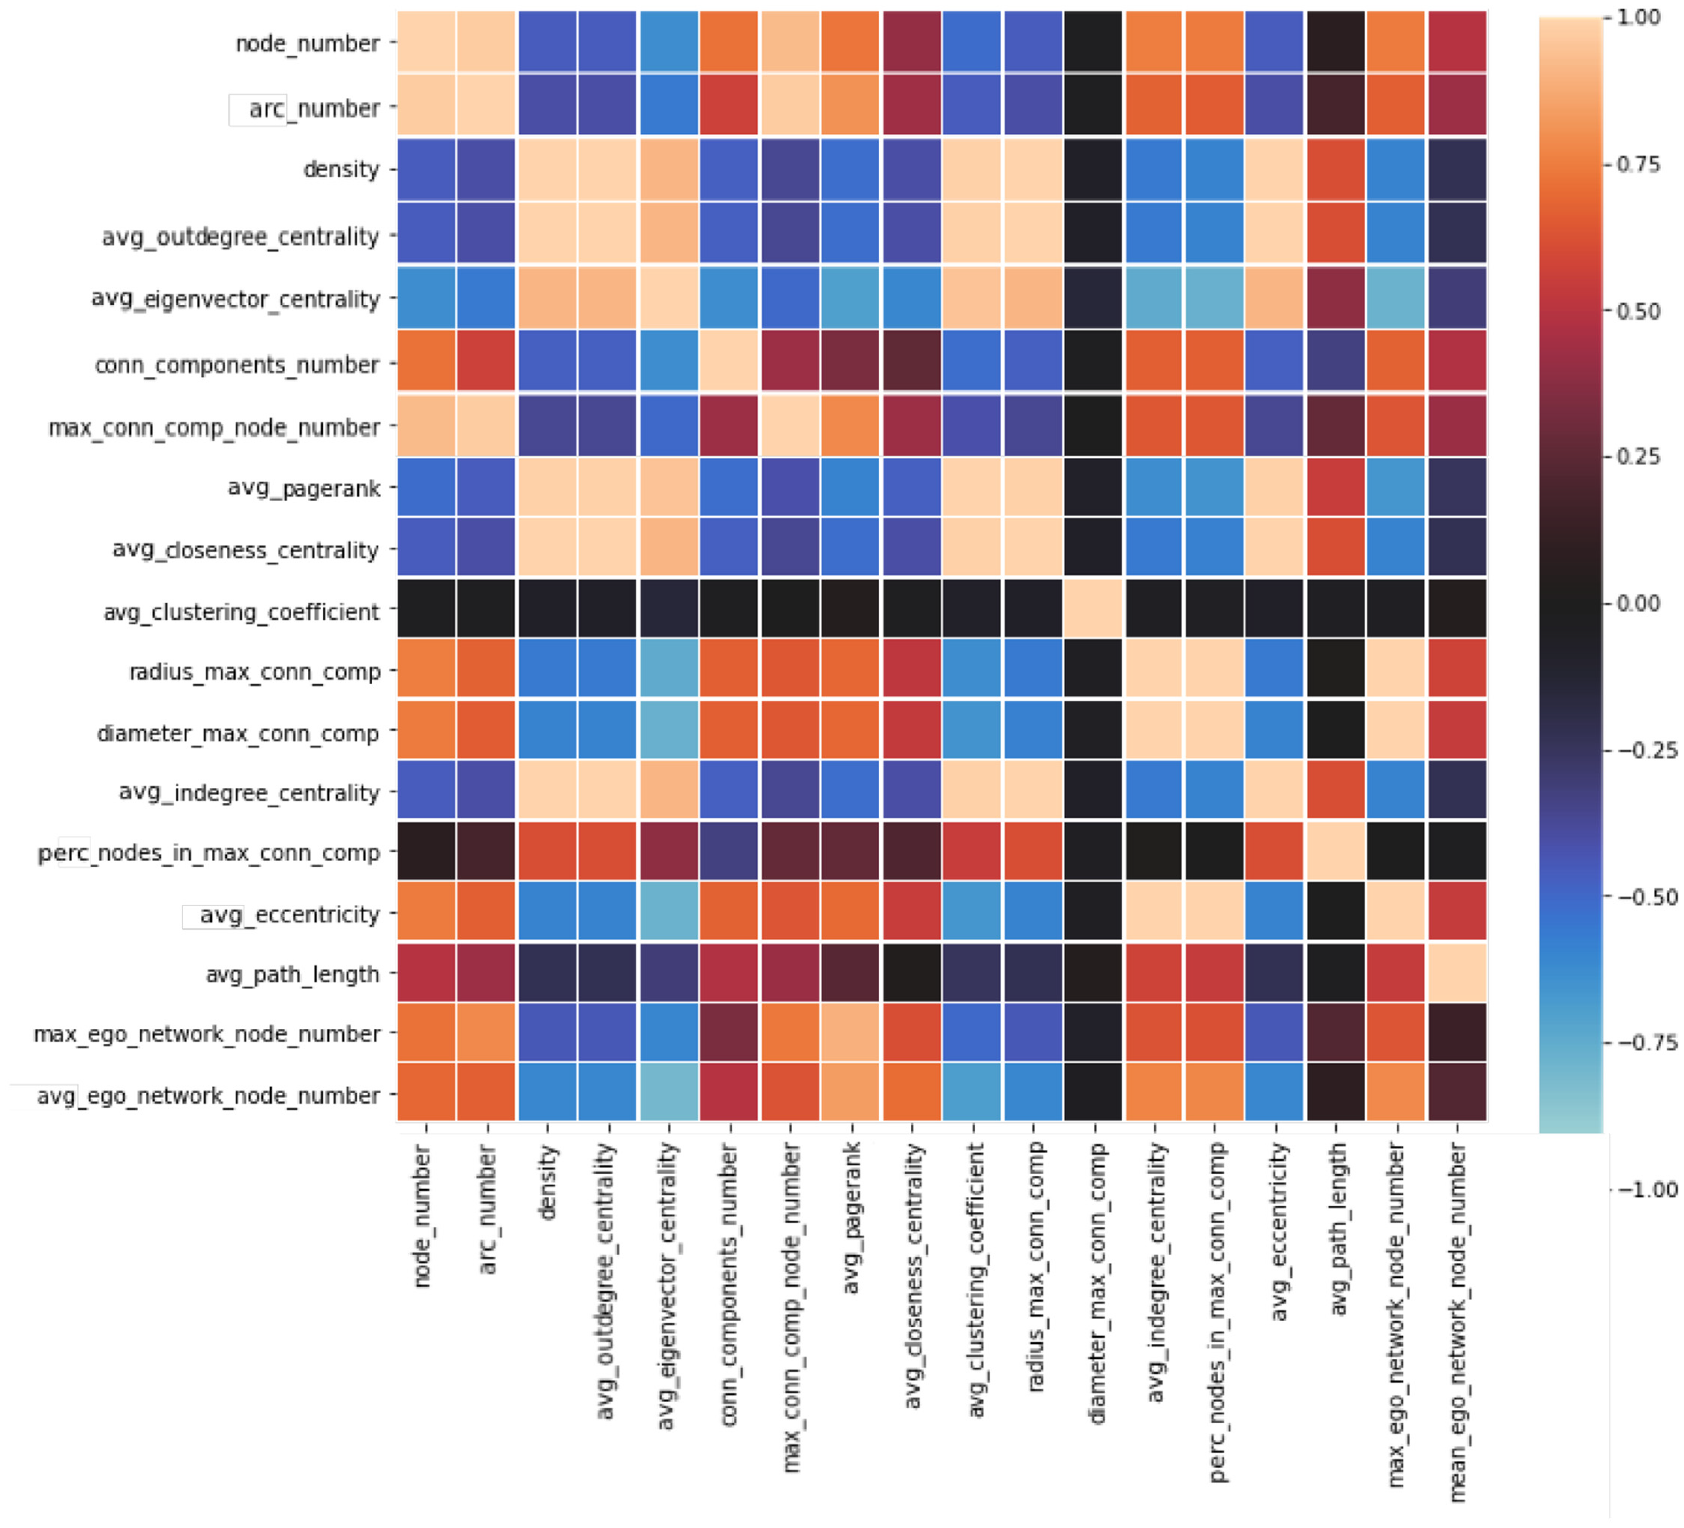
Correlation matrix for the 18 features representing the behaviour of the communities during a challenge.
Considering the various groups of correlated features and choosing one for each group, we identified the following features to keep for the next analyses:
6.2. Detecting the similarities and differences of the evolutionary dynamics of communities
In the previous section, we have identified a list of features that can describe the behaviour of the community of users associated with a challenge during a time interval. In this section, we want to use these features to group the intervals related to the lifespan of the 14 challenges of our data set into clusters that are homogeneous from the perspective of the evolutionary dynamics of the communities involved.
First of all, we considered a new data set formed by a single table whose rows represent the intervals of the 14 challenges under consideration and whose columns are associated to the seven selected features.
The element (h, k) of this table indicates the value assumed by the kth feature in the hth interval.
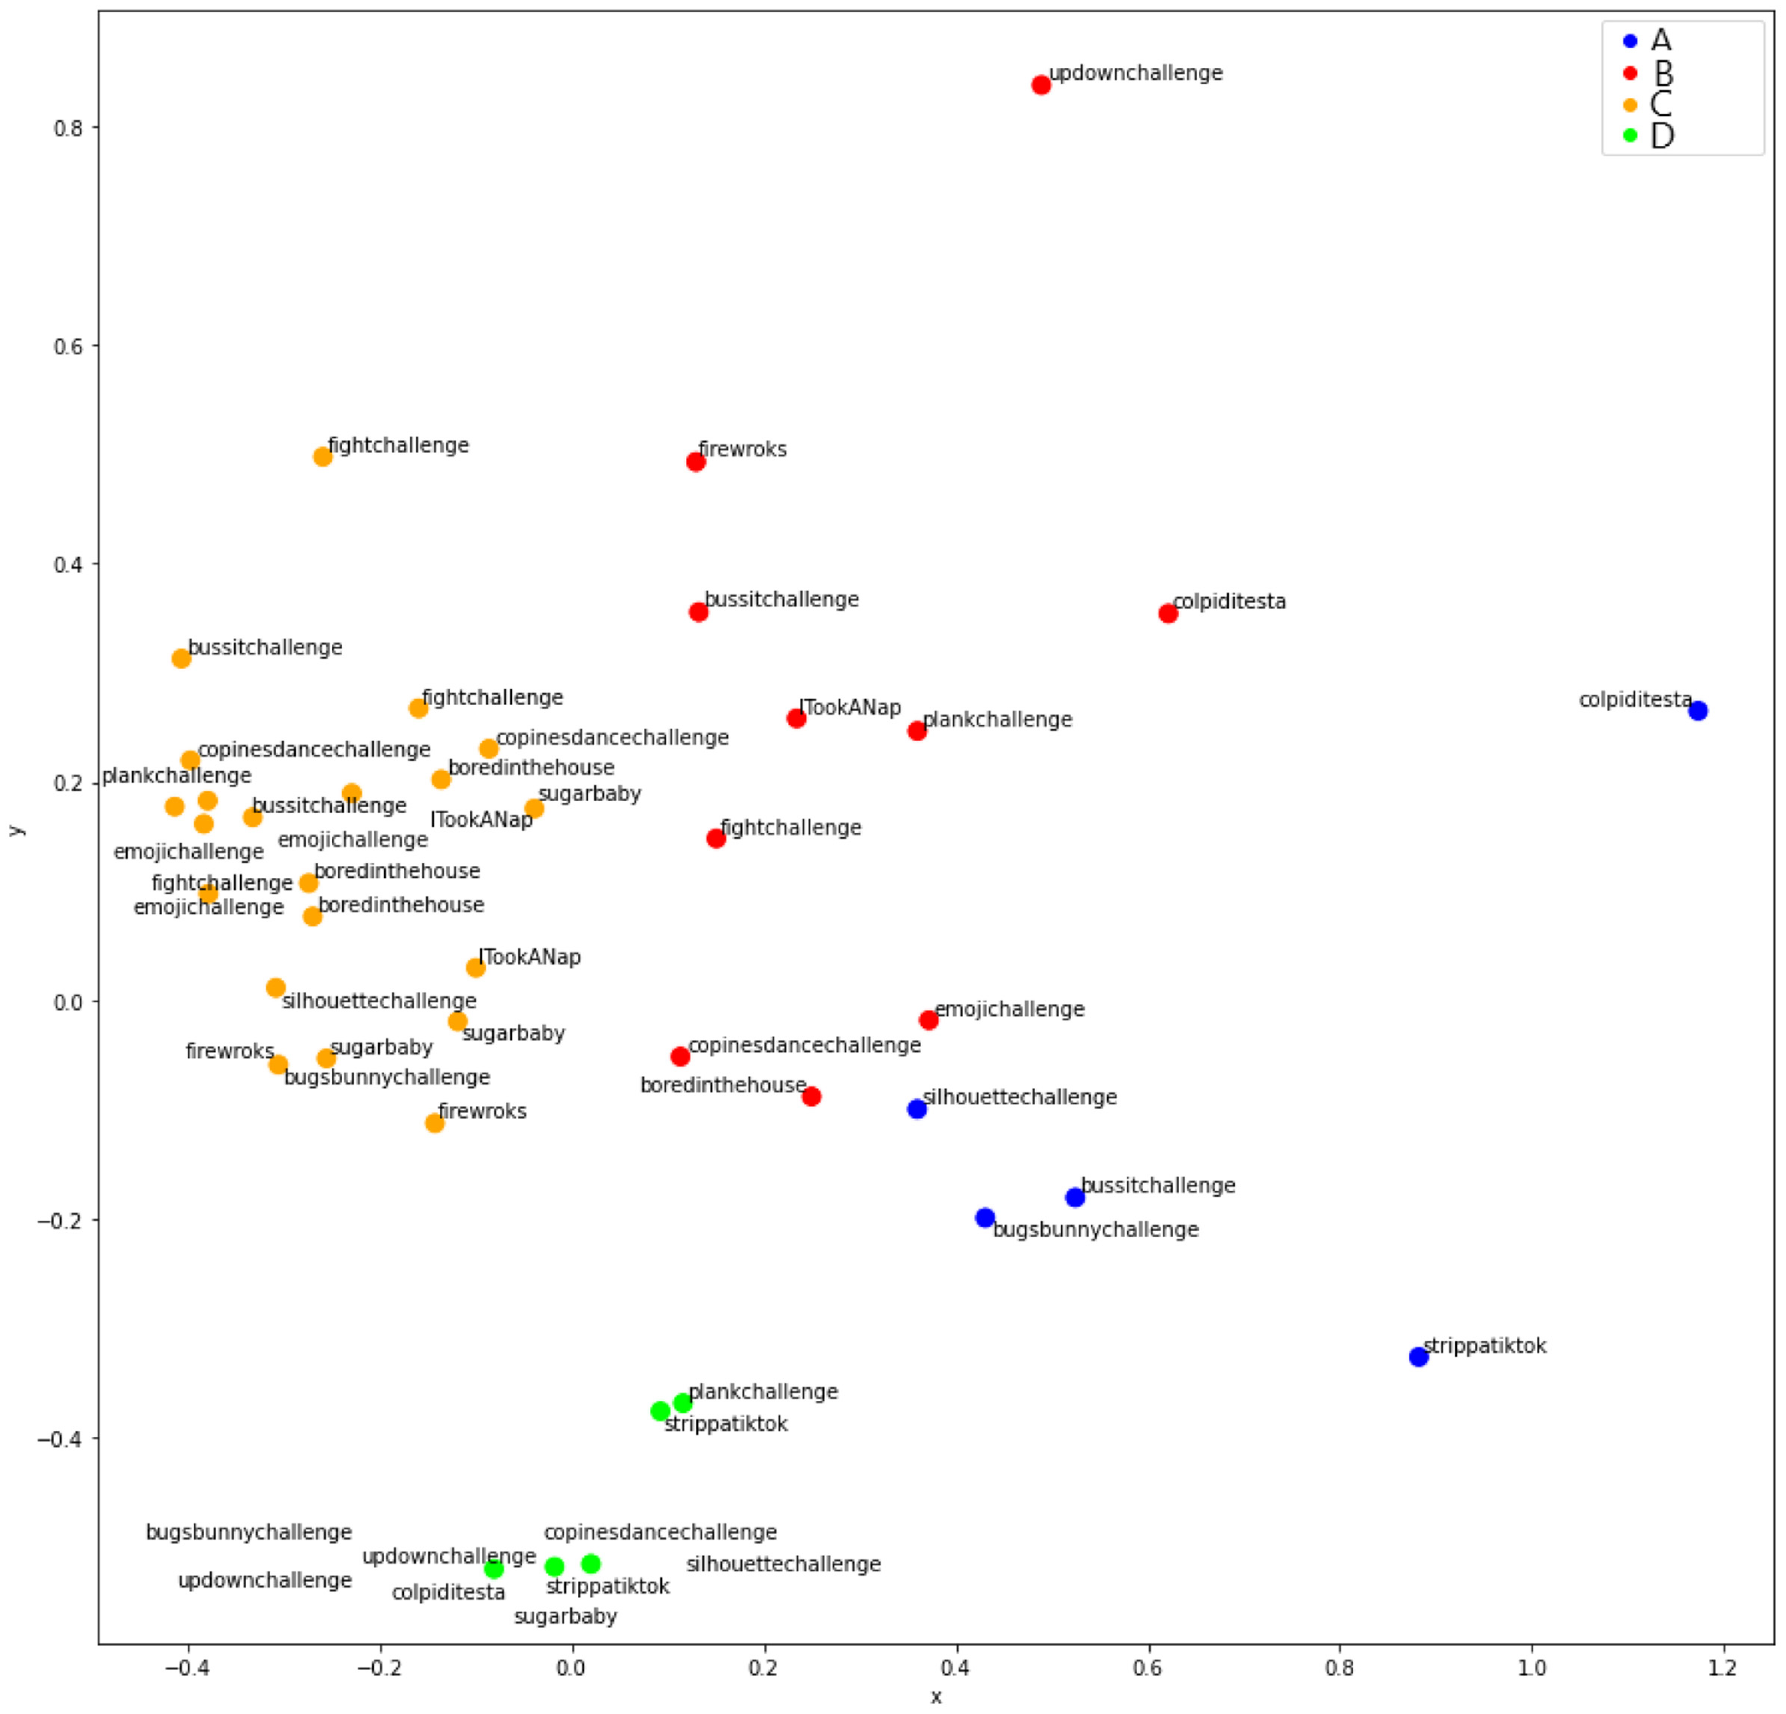
Afterwards, we applied a clustering technique to group the intervals into homogeneous clusters from the user community behaviour perspective. Specifically, we chose the Autoclass [74] clustering algorithm. The reason for this choice lies in the fact that this algorithm, among the various positive properties characterising it, also has that of being able to automatically determine the number of clusters. This property was particularly important in our case because it was not possible to make any a priori conjecture on this number, and the application of the elbow method carried out with k-means returned no results. Applying Autoclass to our data set, we obtained four clusters. In order to visualise them, we applied the principal component analysis (hereafter, PCA) [62] to the data set. In this way, we reduced the number of dimensions from 7 to 2, which allowed us to visualise data into a bidimensional plane whose axes correspond to the two dimensions returned by PCA. This visualisation improved the interpretation of the clusters obtained. We adopted linear PCA for dimensionality reduction. Actually, we also considered other approaches to perform this task, such as t-SNE and several forms of kernel PCA. However, linear PCA is the one that provided the best trade-off between the needs of visualisation, interpretability and determinism of result.
After identifying clusters and representing them in a bidimensional plane, we tried to understand what each of them denoted in terms of the behaviour and the dynamics of the challenge communities during the time intervals belonging to it. At the end of this activity, we drew the following characterisations:
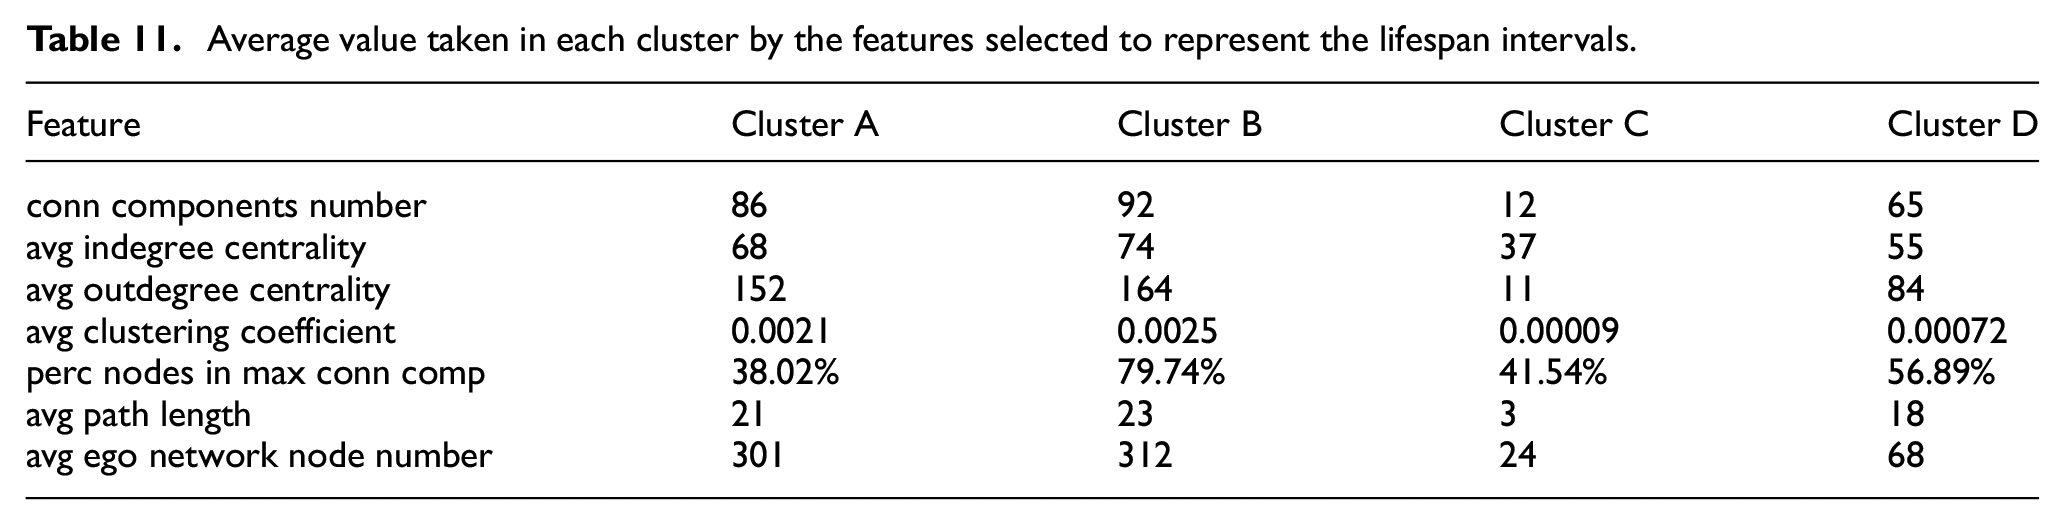
Cluster A: during the intervals belonging to this cluster, networks are characterised by a quite high number of nodes and a high number of connected components. The nodes of each connected component have a high average indegree and average outdegree. This implies that the corresponding communities consist of highly connected users. As a confirmation of the latter property, the average size of the ego networks is large and the average clustering coefficient is high.
Cluster B: during the intervals belonging to this cluster, networks are characterised by a very high number of nodes and a rather high number of connected components (although less than in Cluster A). The maximum connected component includes most of the nodes, while the other ones are all made up of few nodes, albeit their number is still high. The average clustering coefficient and the average size of the ego networks remain very high, even if this is mainly due to the contribution of the nodes of the maximum connected component.
Cluster C: during the intervals belonging to this cluster, networks are characterised by a limited number of nodes and a certain number of connected components. The nodes of each connected component have a small-medium average indegree and average outdegree. The average size of the ego networks is small and the average clustering coefficient is medium-small.
Cluster D: during the intervals belonging to this cluster, networks have a high number of nodes and a high number of connected components. The nodes of each connected component have a medium average indegree and a medium average outdegree. Both the average size of the ego networks and the average clustering coefficient are medium-high
In Figure 8, we show an example of the structure of a user community associated with a challenge for each cluster.
The four clusters of intervals returned by expectation maximisation.
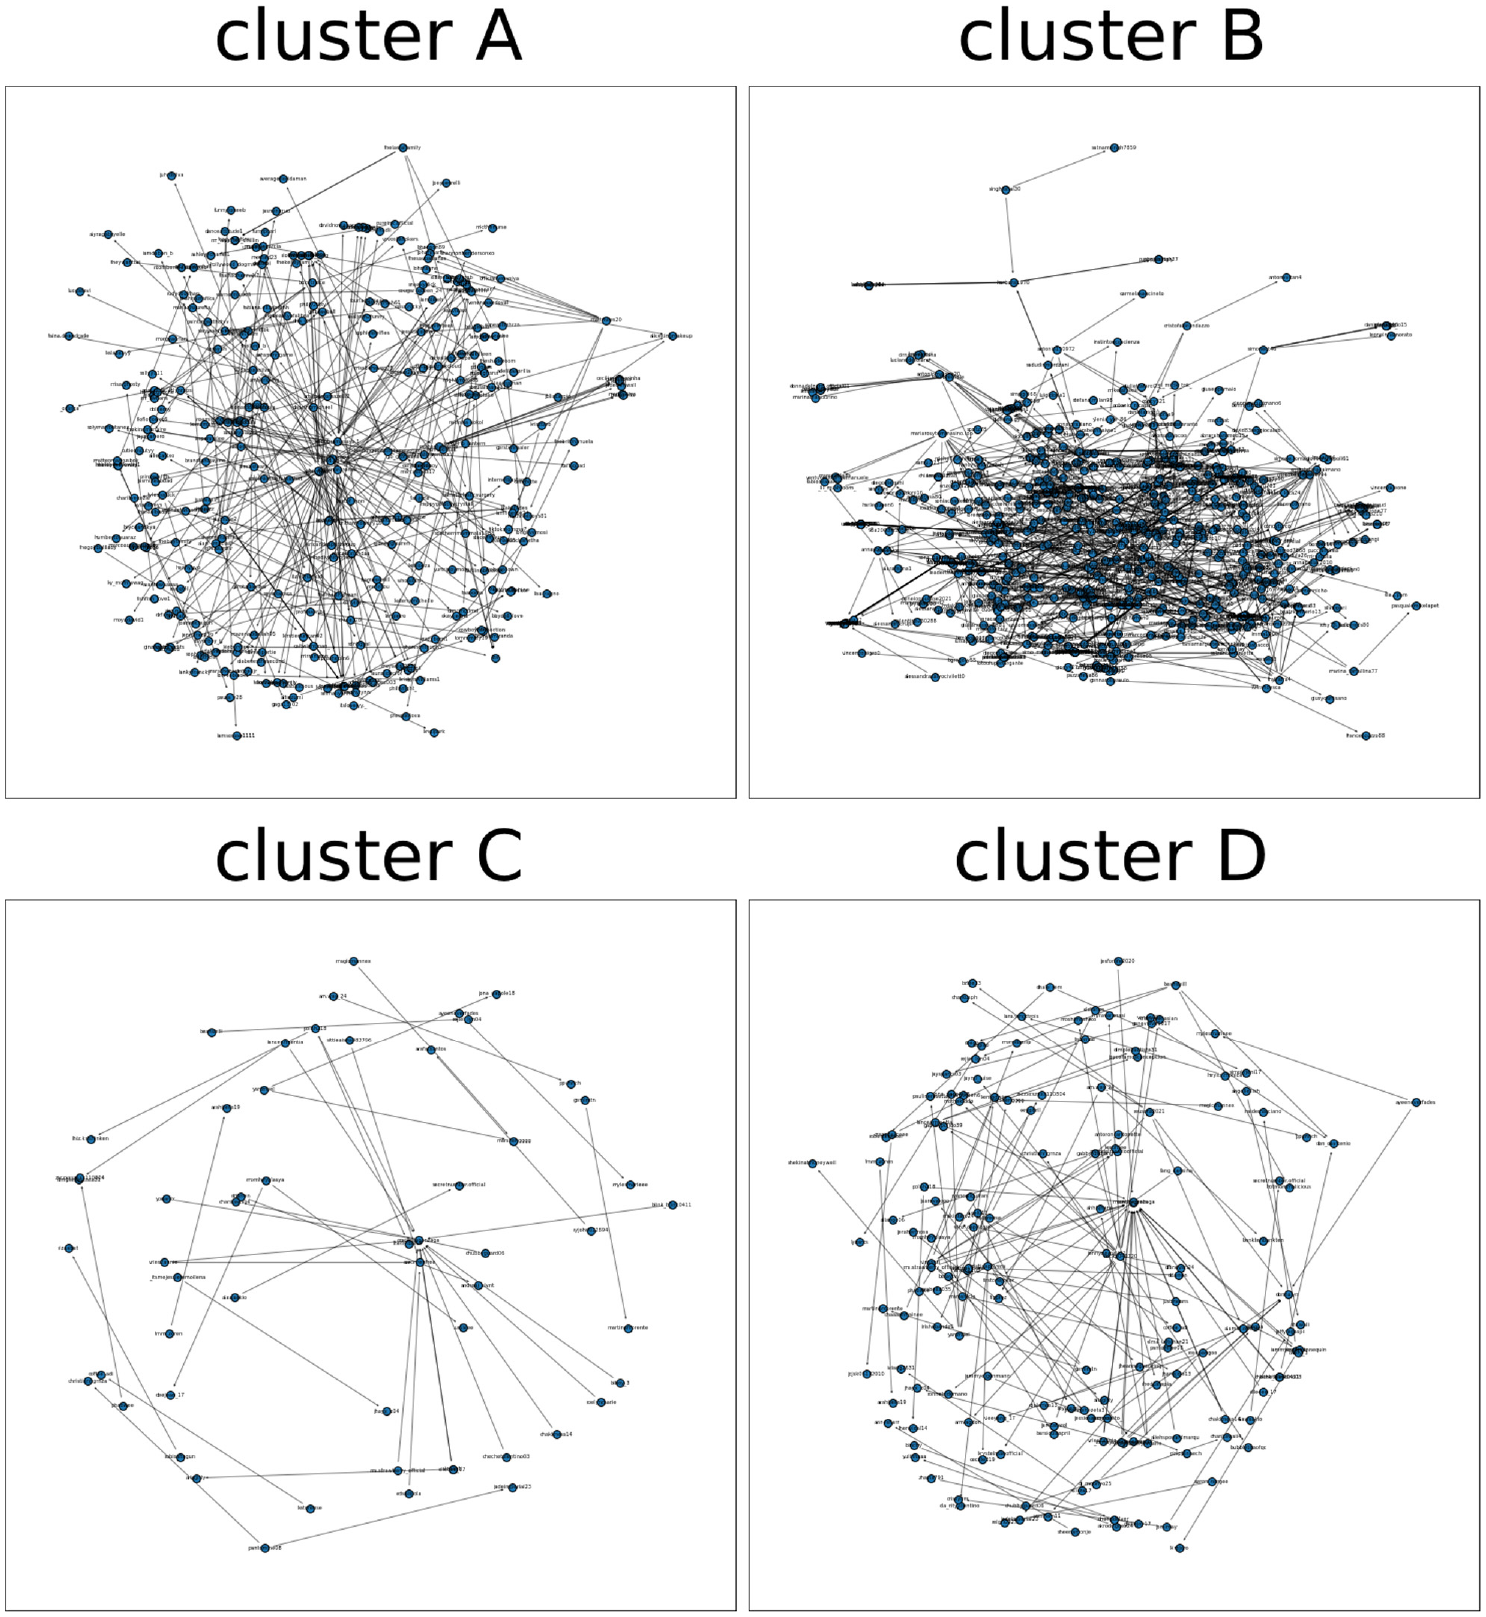
Example of the structure of a user community associated with a challenge for each cluster.
To give a quantitative idea of the characteristics of clusters, in Table 11 we show the average values taken in each cluster by the seven features we selected to represent the lifespan intervals.
Average value taken in each cluster by the features selected to represent the lifespan intervals.
7. Searching for evolutionary patterns in the challenge lifespans
After grouping the intervals into clusters, and after identifying the characteristics of each cluster, we tested whether there were evolutionary patterns characterising the communities of non-dangerous and dangerous challenges while also providing the capability of distinguishing them. To this end, we considered the lifespans of the 14 challenges of the data set and, for each of the corresponding intervals, we recorded the cluster to which it belonged. If two consecutive intervals belonged to the same cluster, we recorded them only once. At the end of this process, we obtained the sequences of intervals shown in Table 12.
Sequences of intervals for non-dangerous and dangerous challenges.
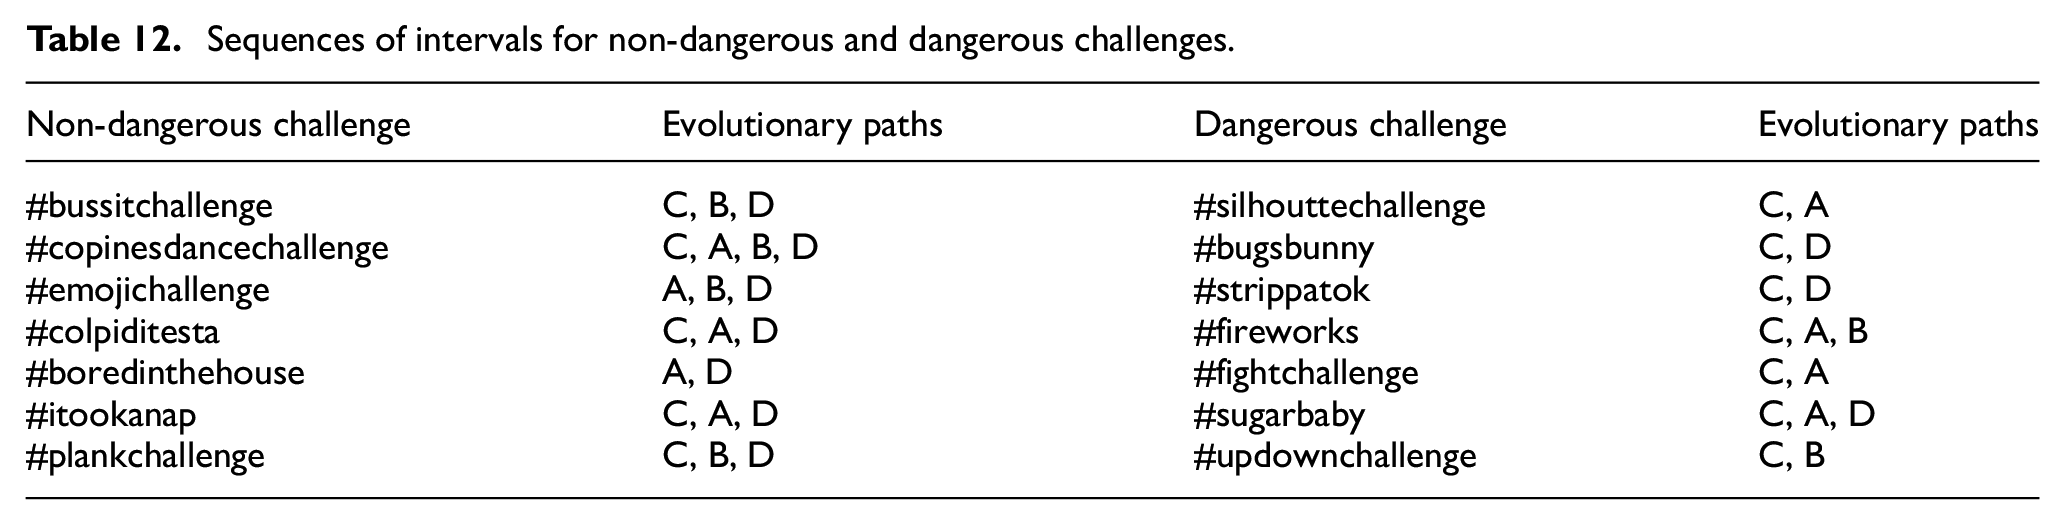
Examining these sequences, we can draw some observations. In particular, the following:
In the non-dangerous challenges, there is no dominant pattern although intervals of type C and D are frequent. Specifically, an interval of type D is present in each non-dangerous challenge.
Dangerous challenges always begin with an interval of type C, whereas they end with intervals of type A, B or D.
Examining the description of clusters in Section 6.2, we can note that the user communities during the intervals belonging to clusters A and B have similar features. Also observing Figure 7, we can see that cluster B can be seen as an extension of cluster A. Therefore, we decided to analyse the data corresponding to the intervals of these clusters in more detail. We have previously seen the following:
The intervals of cluster A are characterised by networks with a high number of connected components. The average indegree and outdegree of the network nodes are high. As a result, during these intervals, there are many connections between users. This is also witnessed by the average clustering coefficient that is very high.
The intervals of type B are characterised by networks with a rather high number of connected components and high average indegree and outdegree of the network nodes. The main difference with the intervals of type A is that, in this case, the maximum connected component contains most of the network nodes. In fact, the other connected components generally consist of pairs of nodes.
Despite the main difference mentioned above, and other small existing ones, we can hypothesise that the two clusters of intervals A and B represent the same reality. In particular, given the high average indegree, average outdegree, average clustering coefficient and the large size of ego networks, we can hypothesise that these intervals represent the peak of the evolution of a challenge.
In order to test our hypothesis, we performed a t-test [29], based on the following null hypothesis H0: ‘The means of the samples for the intervals of clusters A and B are equal’. Prior to performing it, we had to test whether the items in the two samples had comparable variances or not. In fact, this step is necessary to choose whether to perform the classical t-test (used when the two samples have comparable variances) or the Welch’s t-test (used otherwise) [29]. In order to decide on the comparability of the variances of the intervals of the clusters A and B, we performed the Bartlett’s [73] t-test. It allows us to determine whether two samples with different numbers of items have the same variance or not. More formally, we applied the Bartlett’s t-test with the following null hypothesis H0: ‘The variances of the samples for the intervals of clusters A and B are equal’. We computed the corresponding p-value and saw that it was equal to 0.52, which is much higher than the classical threshold of 0.05 generally considered for this parameter. Therefore, the null hypothesis cannot be rejected. As a consequence of this fact, in order to test whether the difference between the intervals of clusters A and B was statistically significant, we had to adopt the classic t-test and not the Welch’s one.
Applying the classic t-test on the null hypothesis H0: ‘The means of the samples for the intervals of clusters A and B are equal’, we obtained a p-value of 0.63. This is much greater than 0.05 and allowed us to conclude that the null hypothesis cannot be rejected. In turn, this implied that the clusters A and B were statistically equivalent and represented two very similar scenarios, despite the previously highlighted differences.
Thanks to this result, it was possible to substitute A for B in all the interval sequences of the challenges under consideration.
Observe that, after determining the equivalence between the intervals of A and B, we have three kinds of interval, namely, (1) intervals of type A, whose characteristics described above suggest that they correspond to the peak of a challenge; (2) intervals of type C, whose characteristics suggest that they are the initial ones in a challenge; (3) intervals of type D, whose characteristics suggest that they are the ones relating to the end of a challenge.
Now, after the substitution of B with A, and recalling that our evolutionary pattern model states that two consecutive intervals of the same cluster are represented only once, the sequences of intervals that characterise non-dangerous and dangerous challenges are shown in Table 13.
Sequences of intervals for non-dangerous and dangerous challenges after the verification of the hypothesis that A and B are equivalent.
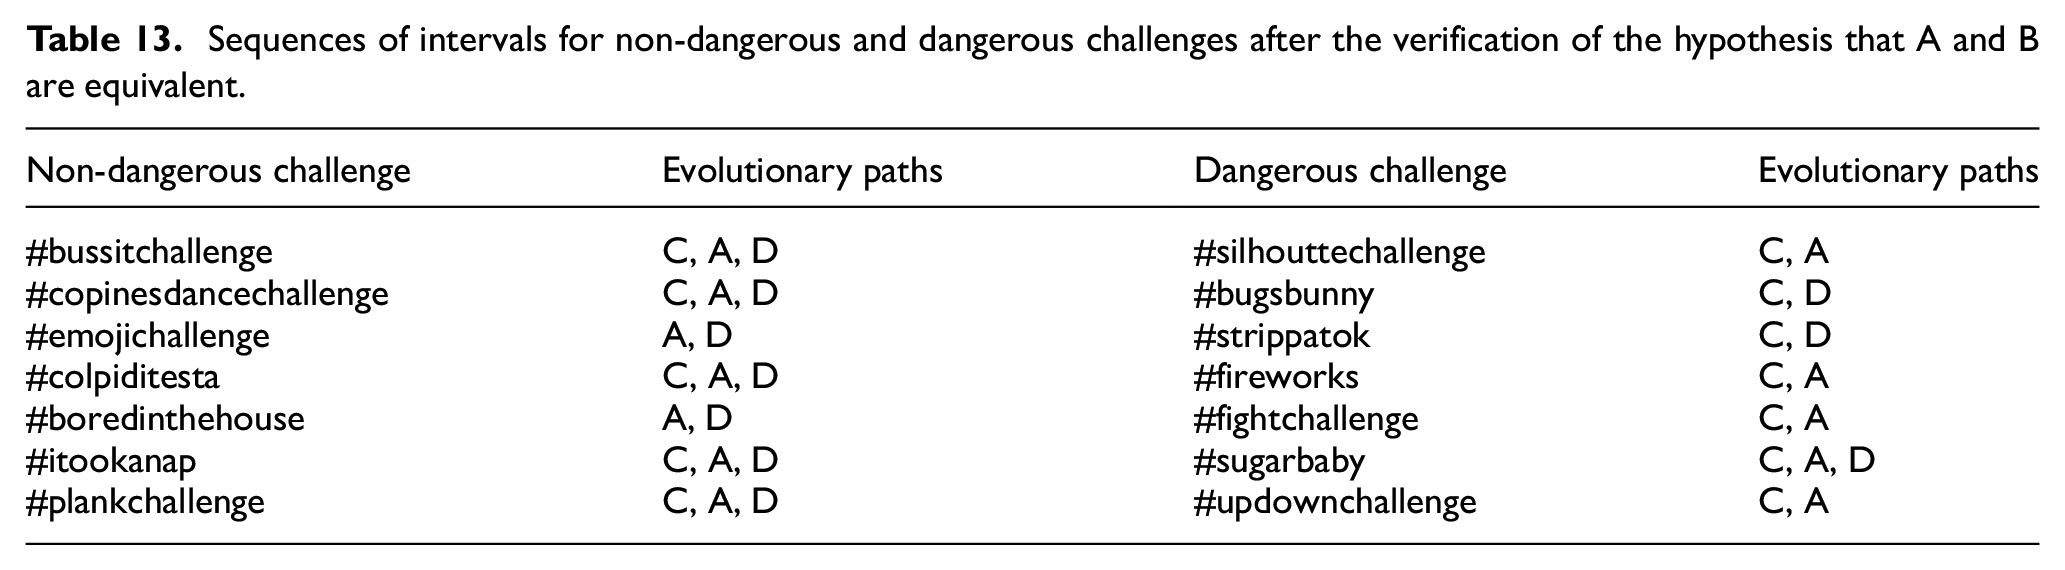
Thanks to this result, we were able to identify some evolutionary patterns characterising non-dangerous and dangerous challenges. Furthermore, since these patterns are different in the two cases, they also allow the distinction of non-dangerous challenges from dangerous ones.
Let us first examine non-dangerous challenges. In this case, we always have the presence of a sequence of intervals of type A, D. This sequence is very often preceded by an interval of type C, so that we have an evolutionary pattern of type C, A, D. We argued that the typical evolutionary pattern of a non-dangerous sequence is C, A, D. In fact, the challenges showing a pattern of type A, D already existed when our research on them began, although the interactions with users that they were able to elicit were almost negligible.
Let us now examine dangerous challenges. In this case, unlike the previous one, there is no single sequence of intervals characterising most of them. Instead, we identified two dominant sequences that correspond to two different ‘fates’ generally characterising the challenges of this type. They are as follows:
C, A: these challenges had a standard initial phase with an interval of type C; then, they reached a peak phase. Finally, they almost suddenly ceased to have meaningful interactions with users.
C, D: these challenges had an initial phase, which was followed by a decay one. In other words, they never reached the peak. They were born, survived for a certain period on the network, and then died.
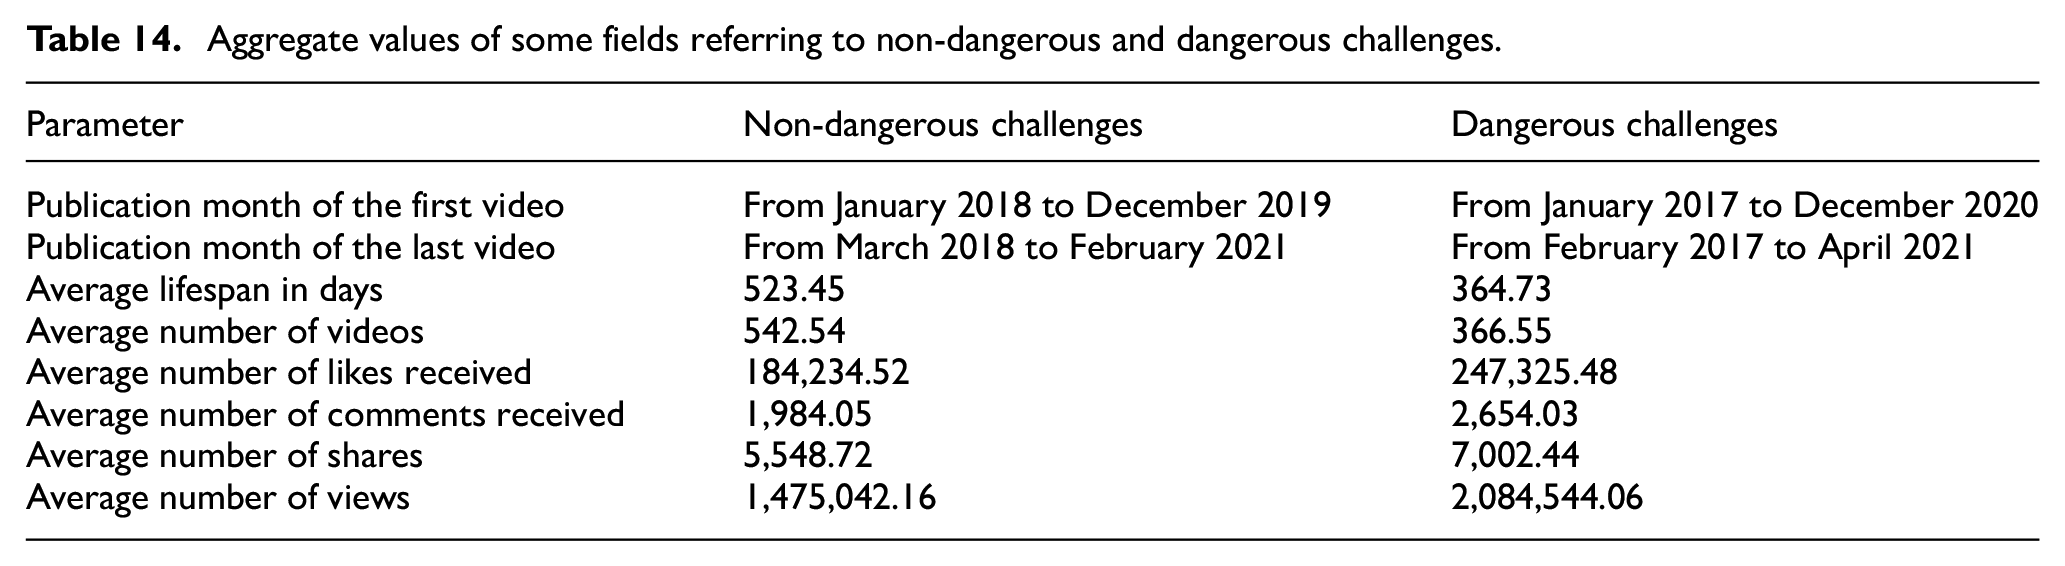
In order to verify the suitability of our approach, we decided to test it on a new data set, larger than the previous one. It consists of 300 challenges (150 non-dangerous ones and 150 dangerous ones). As dangerous challenges are very rare, the 150 dangerous challenges of our data set were obtained from 25 real challenges using the oversampling technique implemented through bootstrap [29]. Due to space limitations, we cannot present in detail the 175 real challenges we used. However, in Table 14, we report the aggregate values of some fields referring to them.
Aggregate values of some fields referring to non-dangerous and dangerous challenges.
The results obtained are the following:
As for non-dangerous challenges:
◦ 132 (i.e. 88.00% of them) followed the evolutionary pattern C, A, D. This is the only significant one we identified for this type of challenges.
◦ 18 (i.e. 12.00% of them) followed a variety of other sequences of intervals.
As for dangerous challenges:
◦ 65 (i.e. 43.33% of them) followed the evolutionary pattern C, A;
◦ 69 (i.e. 46.00% of them) followed the evolutionary pattern C, D;
◦ 7 (i.e. 4.67% of them) followed the evolutionary pattern C, A, D;
◦ 9 (i.e. 6.00% of them) followed a variety of other sequences of intervals.
The results obtained represent a confirmation that the evolutionary patterns we detected actually exist for the two types of challenges into consideration and are capable of discriminating them. In addition, these results show that the patterns we found are really able to capture almost all the behaviours of the communities of TikTok challenges.
7.1. Discussion
In the previous section, we have seen that non-dangerous challenges generally follow the evolutionary pattern C, A, D, while dangerous challenges generally follow the evolutionary patterns C, A or C, D. The pattern C, A, D is regular while the patterns C, A and C, D are both irregular, even if for different reasons. In fact, the pattern C, A, D represents a context in which there is the appearance of a new challenge, its growth to a peak and, finally, its decrease more or less slow, but regular. The pattern C, A is typical of a context in which there has been an almost sudden end of user interactions. This may happen because the challenge ran out of steam very quickly or it was recognised by TikTok as dangerous and was stopped or removed from the social network. The pattern C, D is representative of a challenge that had an initial phase, survived for a certain period without ever reaching a success, and then decayed.
The knowledge derived from the analyses described in Section 5 tells us that dangerous challenges have fewer authors than non-dangerous ones and that these authors are more connected to each other. This tends to set up a more closed scenario, where authors are mutually self-supportive. This is also evidenced by the fact that dangerous challenges have a higher average number of likes, comments, shares and views than non-dangerous ones, as well as by the fact that the authors of dangerous challenges receive many more likes than the ones of non-dangerous challenges. The greater openness of non-dangerous challenges is evidenced by the fact that their authors tend to follow more authors than the ones of dangerous challenges.
As shown in Table 9, the evolution of the two types of challenges is very different. The number of authors of non-dangerous challenges grows in a much more regular way than the number of authors of dangerous challenges. The latter grows very little up to 50% to 75% of the lifespan. At this point, in the challenges following the behavioural pattern C, D, it decays without ever having achieved success.
Instead, in the challenges following the behavioural pattern C, A, it shows an exponential growth. This suddenly stops and decays either because the challenges are recognised as dangerous by TikTok, and therefore are suppressed, or because they lose their appeal to users. This loss happens quickly and, once again, in a much more irregular way than non-dangerous challenges. In fact, the dangerous challenges having a regular decrease are those following the behavioural pattern C, A, D, which, as we have seen above, are a strict minority of the overall dangerous challenges (i.e. 4.67% in the test described in Section 7).
8. Conclusion
In this article, we have studied the different characteristics and evolutionary dynamics of the user communities participating in non-dangerous and dangerous TikTok challenges. This study led us to the identification of evolutionary patterns allowing us to discriminate the communities of users participating in the two types of challenges. We point out again that the approach proposed in this article should be considered a first step in our overall research. Indeed, in its current version, it is able to classify a challenge only near the end of its lifespan, or at least after a rather long period of time since its beginning. However, as we have seen above, defining a mechanism for the early detection of dangerous challenges in TikTok is an important issue, which many researchers are focusing on. In fact, the early detection of dangerous challenges is critical to prevent the latter from being too successful and achieving an exponential growth rate. The early detection of dangerous challenges starting from the evolutionary dynamics of the reference communities can be seen as the final goal of our research, of which the approach proposed in this article can be considered the first step. In fact, we believe that if we were able to reduce the granularity of the time intervals considered, making it much finer, we could verify the possible extension of our approach to identify behavioural patterns characterising communities. These patterns would allow the distinction of the dangerous challenges from the non-dangerous ones already at the beginning of their lifespan.
Our approach, based on the analysis of the behaviour of hundreds or thousands of users participating in a challenge, is robust to the classical tricks used to bypass the current TikTok’s controls. The importance of the detection of dangerous challenges is also motivated by another relevant result we obtained in the article, namely, the fact that when these challenges begin to succeed, they tend to have an exponential growth of the number of their users, even much greater than that of the communities associated with non-dangerous challenges.
In the future, besides investigating the possibility of an early detection of dangerous challenges, we plan to further analyse the evolutionary dynamics of the communities associated with challenges using additional features and concepts derived from Social Network Analysis. Moreover, we plan to further study the distinction between dangerous and non-dangerous challenges by identifying additional criteria allowing the detection of a dangerous challenge as soon as possible and in the most robust possible way. Last, but not the least, we could extend our analysis from TikTok challenges to TikTok trends. Indeed, these last ones have certainly several analogies with challenges, but, at the same time, present also several differences. Consequently, we can assume that many of the results found for challenges can be extended to trends by making suitable modifications, which consider the peculiarities of trends with respect to challenges.
Footnotes
Declaration of conflicting interests
The author(s) declared no potential conflicts of interest with respect to the research, authorship, and/or publication of this article.
Funding
The author(s) received no financial support for the research, authorship, and/or publication of this article.