
Abstract
Research fronts (RFs) represent the most dynamic areas of science and technology and the topics that receive higher attention in a specific field. Their identification has become the focus of global scientific and technological competition. In this study, we performed an analysis of the In-Cites RFs from Web of Science (WoS) in seven Spanish universities as a case study in the period 2015–2019. Our purpose is threefold: (1) to develop a methodology for approximating the ‘alignment’ of scientific articles with the RFs, (2) to test if Highly Cited Papers (HCP) from these universities are more aligned with RFs than the rest of the output, and (3) to test if papers aligned with RFs receive more citations per document than those not aligned. The study uses a novel retrieval method, and the analysis is conducted using a coincidence method (comparison with a standard), in which Mann–Kendall’s test and Pearson’s correlation are used. The results show that there is alignment between output and the HCP and those better aligned, present greater mean ranks of citations per article. This study shows the usefulness of RFs for orienting the research priorities at the institutional level for the university.
1. Introduction
Research fronts (hereafter RFs) have been an increasingly relevant object of research in scientometrics. The literature on this topic grew steadily in the last century and has accelerated and received wide attention over the last two decades [1]. RFs are a hot topic of research and even have been labelled ‘the footprint of the scientific communities’ [2]. RFs have become of interest for several audiences [3], especially for a wide range of stakeholders involved in the definition of priority areas of scientific research and their funding [4]. Nevertheless, there is no widely accepted definition detailing the specific attributes of RFs and emerging research topics and technologies. As Rotolo et al. [5] point out ‘the lack of consensus over definitions is matched by an eclectic and ad hoc approach to measurement’. Their definition of an RF includes, as Wang [6] summarises, five attributes: radical novelty, relatively fast growth, coherence, prominent impact and uncertainty and ambiguity. Wang’s work proposes, develops and applies four criterions: growth (rapid increase in yearly publications), novelty (novel at the early stage of its emergence), scientific impact (prominent volume of citations) and coherence (number of within-cluster citations divided by the total number of publications). A closely related topic to RFs, that of ‘emergence’ (in the case of emerging technologies) has been defined by Small et al. [3] as participating from two key features: novelty and growth. Some authors have underlined [7] the relatedness between RFs and the dynamic, multi-variant and multi-dimensional conception of research activity. According to Upham and Small [8], there are different phases in an RF (intensive phase from emerging to stable fronts; and extensive phase from shrinking and expiring fronts) and their development can either merge into the development of a new discipline or be absorbed by a broader field.
The concept of RFs was first formulated by Price [9] characterising them as domains in which papers cite each other densely. According to this author, there is a tendency for scientists to cite the most recently published articles. He even used terms such as ‘epidermal layer’ or even ‘growing tip’ to describe this concept [10]. Later, several other researchers have conceptualised this term (e.g. Small and Griffith [11]); however, its identification is one of the main concerns in science policy and scientometrics [4]. Different studies have developed quantitative methods that can be used to identify and characterise RFs and their evolution over time. To date, three scientometric approaches are widely used for their identification: analysis of dynamics of change in scientific production, citation analysis and content analysis [4]. The first, relates with the analysis of the number of publications with different paradigms of the growth of scientific knowledge such as Price or Bradford, among others. As an example, Vega-Muñoz et al., [12] identify research trends in the field of tourism by considering Bradford’s dispersion law. However, this approach presents some limitations: there is no consensus on which paradigm reflects better the reality and differences between disciplines. Regarding the second approach, there is an extensive corpus of research using citation networks as a methodology for the identification of RFs. Mainly, as pointed by Shibata et al. [13] research on the topic presents two approaches: one related to time-based indicators (i.e. future citations are predicted by current citations) and the other based on the detection of emerging clusters of densely connected papers. Both involve methods such as direct citation or bibliographic coupling. However, these approaches present some limitations: citation bias depending on authors’ citing motivations (e.g. citation of their colleagues); it takes longer for fields with smaller scales or developing slowly [13] and the fact that higher citation frequency does not necessarily imply greater quality [14]. In recent years, different approaches using content analysis and text mining methods from the third approach have been generalised. These include techniques such as Latent Class Analysis (LCA) or Latent Semantic Analysis (LSA) [14]. As an example, the burst term detection has become popular to explore dynamics and new trends (e.g. the Kleinberg burst detection algorithm) (e.g. see an application for volatility spillovers in financial markets in Chen and Yang [15]). However, as pointed by Li and Chu [7], these techniques are reliant on stochastic models which are particularly sensitive to the initial conditions. Another approach is the set of topic-modelling methodologies [14]. While these attempts allow discovering meaningful categories called ‘topics’ that can be used to understand how research fields change over time, such methods presents some caveats such as the inconsistency in the terminology, which may reduce their usefulness or the ability to name unlabeled topics. Other techniques are related to the use of neural networks technologies (see Fujimagari and Fujita [16]). Mapping and visualisation techniques on the identification of the RFs (e.g. Chen [17]) have also gained popularity in recent years, especially with the proliferation of software such as CiteSpace (Chen [17, 18]), or VOSviewer (Van Eck and Waltman [19]). The method choice used is arbitrary in most cases and selected according to the goal of the study (e.g. emerging RFs are better identified using bibliographic coupling), which remains an unresolved issue (Mazov et al. [4]). Previous studies identifying RFs were developed in a wide variety of fields such as engineering (Shibata et al. [13]), medicine or health-related research (Schwechheimer and Winterhager [20]; Chen et al. [21]), technology (MacDonald and Dressler [22]; Chen and Yang [15]; Upham and Small [8]), or scientometrics (De Moya Anegón et al. [23]), among others. However, to the best of our knowledge, not many approaches focused at an institutional level as we presented in this case study. Other methods based on the use of multi-criteria decision-making methods (MCDM) such as fuzzy TOPSIS (Naseri et al. [24]) might be useful for further developments; MCDM techniques have not been chosen in this research because the methodology relies on only one criterion: coincidence of terms. Nevertheless, in the case of multiple criteria (such as semantic closeness or others), MCDM might be of great usefulness for a more complex analysis.
Clarivate Analytics counts with two products that provide information on RFs. On one hand, In-Cites, which is a customised research evaluation tool allowing institutional benchmarking on output, citation, collaboration, influential work and the discovery of areas of opportunity. RFs are one of its components. However, Essential Science Indicators (ESI) provides data on Highly Cited Papers (HCP; articles in the top 1% of citations in the same field and year) and Hot papers (articles in the top 0.1% of citation frequency in the most recent bimonthly period for the same field and year) since 2013. The filtering options include research fields, authors, institutions, countries and regions and RFs. The RFs at the ESI interface can also be filtered by research fields and they are provided as a set of five strings separated by semicolon. These strings are the result of the ‘analysis of frequently occurring keywords or phrases in the titles of the paper’ (Clarivate Analytics and Chinese Academy of Sciences (CAS) [25]). In total, the interface provides 11,769 RFs for 22 fields. We provide an example as an endnote. The output also contains the number of HCP, hot papers or both (named ‘Top Papers’ in the filtering options) in (it is to say, being the articles that conform the RF) the RF, cites to HCP and cites per HCP as well as the mean year. The identification and definition of the RFs (Clarivate Analytics and CAS [25]) are based on single-link clustering of HCP via normalised co-citation. Co-citation frequency is divided by the square root of the product of the citation frequencies of the two (initial) papers, aggregating other pairs that share common papers. The measure of association applied is the number of times pairs of papers have been co-cited.
The main attributes of the RF provided by Clarivate Analytics are high impact (since they are calculated on HCP) and currency (due to the yearly basis of the calculation and updating of the RFs). As Clarivate Analytics and CAS [25] put it, one of the practical applications of RFs is to ‘(…) assist in identifying areas where important work is being done and where the scientific community is focusing its attention’. This theoretical use of the RFs counts with its practical counterpart in their use for the identification of strengths and areas of opportunity for institutions in the product In-Cites, as well as in the reports produced in collaboration with the Chinese Academy of Sciences, in its seventh instalment in 2021 (Clarivate Analytics and CAS [26]). The size of each RF also depends on the discipline, that is, from 2 to 50 articles according to (Mazov et al. [4]).
Taking into account the prior practical uses of the RF our first objective is to quantify the alignment of the research output of UC3M (Universidad Carlos III de Madrid) in the different fields with the RF.
Despite the fact that RF are based on the terms describing HCP, it does not immediately follow that the degree of coincidence of terms of a given paper and those of an RF is necessarily related to greater volume of citations. This relationship is not self-evident for three reasons – (1) not all articles using terms that appear in the RF are HCP: it is hypothetically possible finding articles (or subject categories) that, despite sharing a large proportion of terms associated with an RF (which is based, in turn, on HCP) does not present significantly greater citations than other papers. Since this is hypothetically possible and we intend to address the relationship between RF and paper’s descriptive terms, it is first necessary testing the extent of that relationship assuming that the probability of non-null relationship is greater than zero. (2) the terms describing the RF are obtained algorithmically by single-link clustering of HCP via normalised co-citation of a set of articles (namely, HCP); the expected relationship between the degree of term overlap between an RF and an HCP paper and, thus, the volume of citations is a priori high, but in the case of non-HCP papers, it is unknown; the terms in the RF are extracted from HCP, but it is unknown if their appearance in non-HCP papers still holds a positive relationship with citations. (3) Concerning the practical use of RF, if we intend to assess the potential usefulness of RF for decision-making, we need to prove that the direct overlap between the terms of RF and scientific articles is not independent from the volume of citations, and that such result is consistent across fields.
In this article, our purpose is threefold: (1) to develop a methodology for approximating the ‘alignment’ of scientific articles with the RFs, (2) to analyse if there is an association (causal or otherwise) between the alignment with RFs and citations for a set of articles from UC3M that are not HCP and (3) to test if papers aligned with RFs receive more citations per document than those not aligned.
2. Data and methods
2.1. Data set
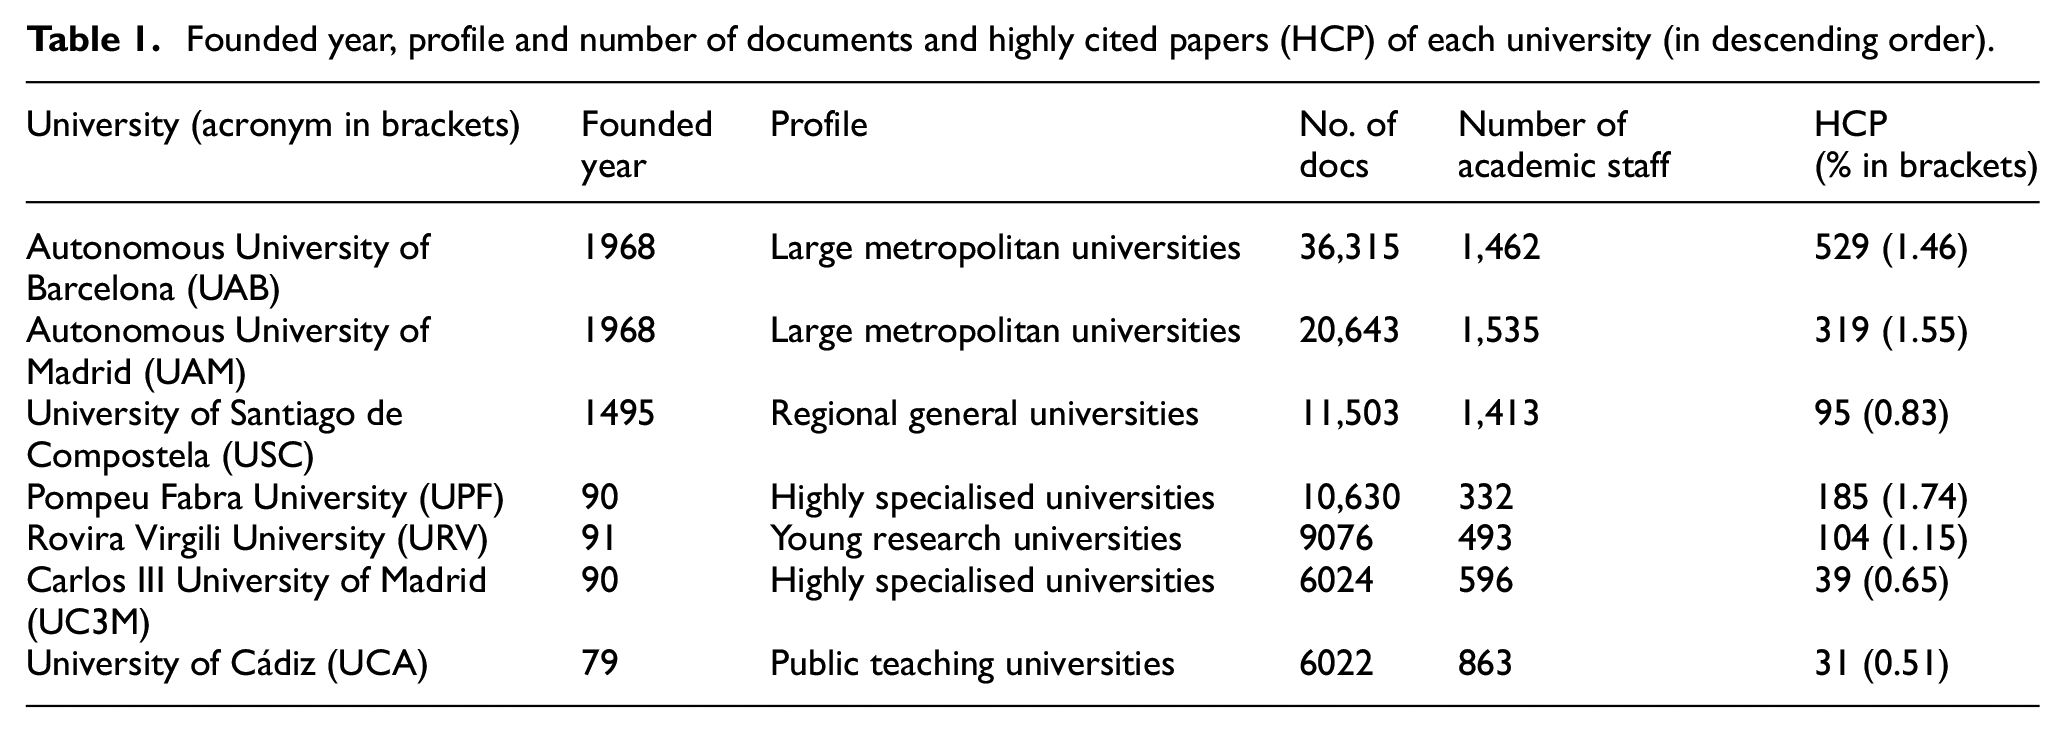
In this study, we have selected seven universities according to their scientific output (IUNE, 2022), and their founded year. The profile covers big metropolitan universities (Autonomous University of Barcelona (UAB), Autonomous University of Madrid (UAM)), highly specialised (UC3M, Pompeu Fabra University (UPF)), generalist (University of Santiago de Compostela (USC)) and teaching universities (University of Cádiz (UCA)) (Aldás et al. [27]). We downloaded all the registers (articles only) of the seven Spanish universities at the WOS’s Core Collection for the years 2015–2019. In our data set, UAB is the most prolific university with 26,439 documents, followed by UAM with 15,087 documents and USC with 8833 documents; however, in terms of HCP, UPF presents a high percentage (1.74) (see Table 1). These universities were selected because they count with a similar number of academic staff to the UC3M. These data were extracted from the IUNE Observatory 1 data in the most recent year available (2019). For this purpose, we used the OG (organisation enhanced) field and retrieved only the articles included at the Social Sciences Citation Index (SSCI), Science Citation Index (SCI) and Arts and Humanities Citation Index (A&HCI). We selected these databases because they encompass most of the publications registered in the three major branches of knowledge. In parallel, we collected all the literal descriptors of the RFs available at the 2020 Essential Science Indicators interface, by research area as in the case of the example provided in the introductory section. The workflow used in this study is summarised in Figure 1 divided into three sections: Data set, Data preparation and analysis.
Founded year, profile and number of documents and highly cited papers (HCP) of each university (in descending order).
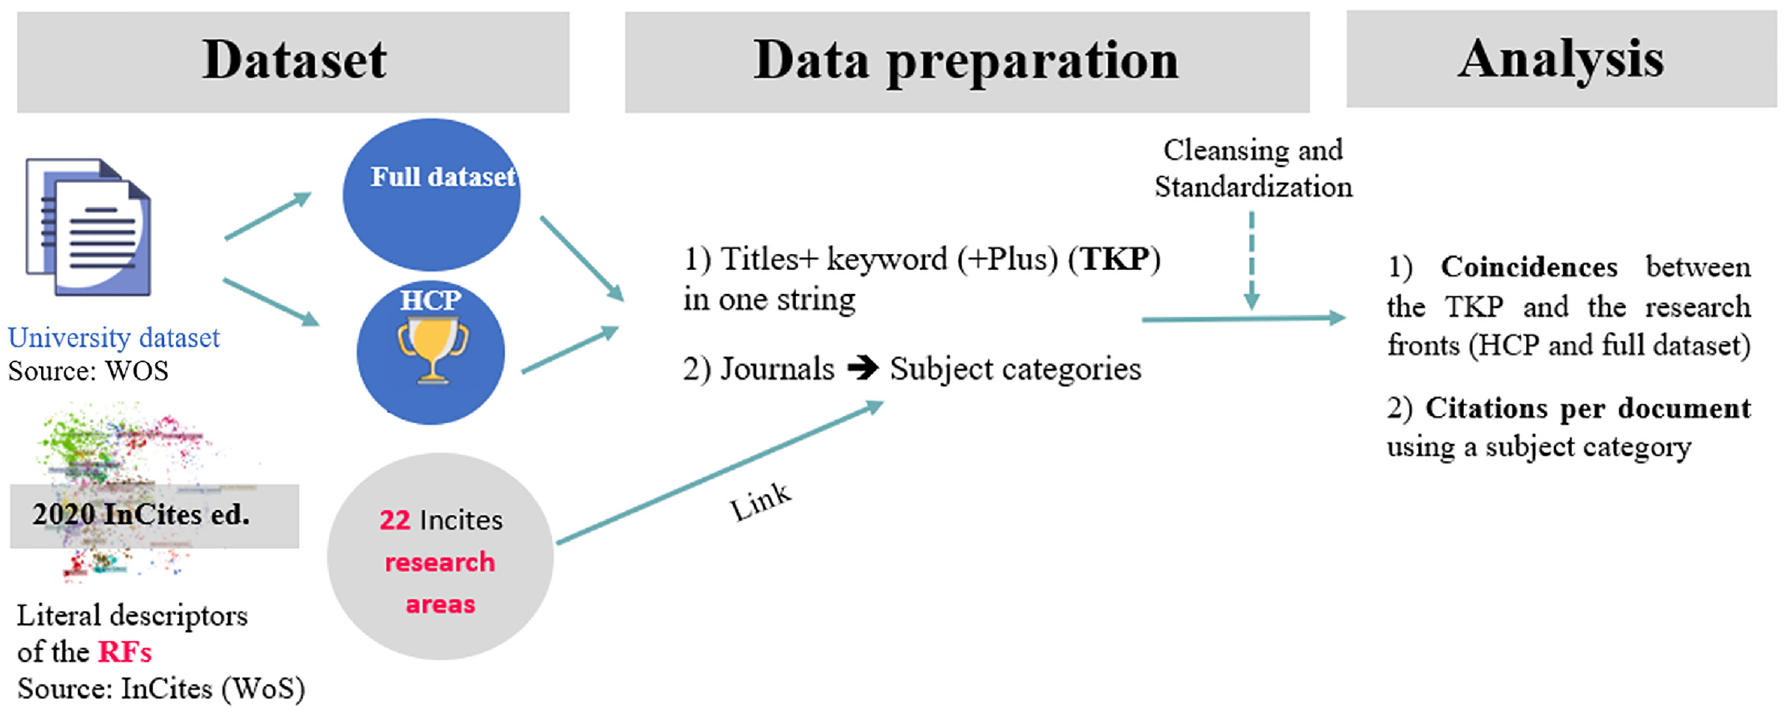
Workflow used in this study for each university.
2.2. Data preparation
Step 1. In this step, we merged the titles, keywords and keywords plus into a single string for each article, extracting noun phrases. We also removed from the matching process all the coincidences of single terms (Cleansing and Standardisation), given the greater likelihood that these terms are void or spurious in terms of their relationship to the strings defining each RF. This was intended to provide a more conservative and robust measure of the alignment of the documents with the RFs.
Step 2. We linked each subject category in which the journals of our data set are classified to one of the 22 In-Cites research areas. For this purpose, we used the list of journals in each In-Cites category and identified the frequency of their WoS category, using the maximum frequency of coincidence as rule of attribution of a WoS category to an In-Cites category. If an article’s journal is classified in two subject categories that belong to the same In-Cites classification, the article was counted as one whole publication classified in that single research area. In the case of a journal classified in n subject categories that were mapped to different In-Cites categories, we calculated a direct fractional score using the formula 1/n, where n is the number of different research areas associated with the subject categories. We then summed the fractional scores for each of the 22 research areas. That value is the number of contributions per research area.
2.3. Analysis
The analysis is conducted in two steps:
Step 1. In a first step, we calculated the number of coincidences between the noun phrases and the RFs. We searched, for each RF definition (containing four separated strings) the coincidence of terms from the contributions’ merged titles, keywords and keywords plus in the same field. For example, we found that an article in the area of Economics contained the string ‘corporate social responsibility’, which is one of the four terms of one of the RFs in that field.
We use only direct matches because we understand that, prior to the utilisation of other methodologies, such as those relying on the semantical distance in the co-occurrence matrix (having cos (α) as the most frequently used distance measure, this being a form of ‘indirect relationship’), it is necessary to test whether a direct approach, namely, direct matching, does produce any relationship between RF and articles’ terms overlap and the citation count. Such methodologies will be, nevertheless, considered for further research into the topic. The result of this process was, on one hand, the number of coincidences between each article’s noun phrases and the RF in their own research area for the overall output of the UC3M and, on the other, the number of coincidences between the University’s HCP and the RF in their research area.
Keywords Plus are, according to WoS, 2 ‘(…) words or phrases that frequently appear in the titles of an article’s references, but do not appear in the title of the article itself’. According to the same source, ‘KeyWords Plus may be present for articles that have no Author Keywords, or they may simply include important terms not listed among the author keywords’ [28]. Despite the fact that the titles and keywords of the articles (being compared with the RFs terms or used for the creation of the RFs), these are understood as a controlled vocabulary that extends the set of terms used in the titles and keywords further, including potential terms that, despite being relevant and definitory of the article’s contents, might not have been included in the title or keywords by the authors. The inclusion of keywords plus responds to the need of counting with a precise but extended enough set of terms for the analysis of the overlap with the RFs. For some authors Keyword Plus terms, ‘go into far more detail, describing the article’s contents with greater depth and variety’, or ‘Keywords Plus terms are more comprehensive and general than Author Keywords’ (Garfield and Sher [29]). For Zhang et al. [30] ‘Keywords Plus terms emphasized research methods and techniques, whereas Author Keywords tended to hone in on specific diseases and conditions’. They claim that ‘Bibliometric analyzes of the structure of scientific fields should use Keywords Plus, because the large quantity of terms and their broad meanings confer several advantages’.
The use of data from UC3M as an example is due to the fact that all authors of this research work at the institution. A significant part of our activities carried out in the research group are directly related to the analysis of the scientific output of the Spanish universities through the Observatorio IUNE (https://iune.es/), but special attention is paid to the case of UC3M, for which specific analyses and reports are produced. Such activities allow the researchers counting with a deeper and better empirical knowledge of the research activities carried out at UC3M when compared with other universities, but also a general overview of its strengths and weaknesses. Choosing UC3M is related to the fact that, apart from the specific results obtained in the analyses carried out in this research, our direct knowledge of the output of the university allows us to better assess the plausibility of the specific results by assessing if they are congruent with our knowledge of the output of UC3M, knowledge which is not available with the same depth for other institutions.
Step 2. We also calculated the citations per document using the fractional counting method. In a final step, we compared the citations per document using a WoS subject category scheme between the document with at least one coincidence with the associated research area’s RF and those without coincidences. We tested the existence of statistically significant differences using Mann–Whitney’s U test.
3. Results
3.1. Developing a methodology for comparing the ‘alignment’ of scientific articles with the RFs
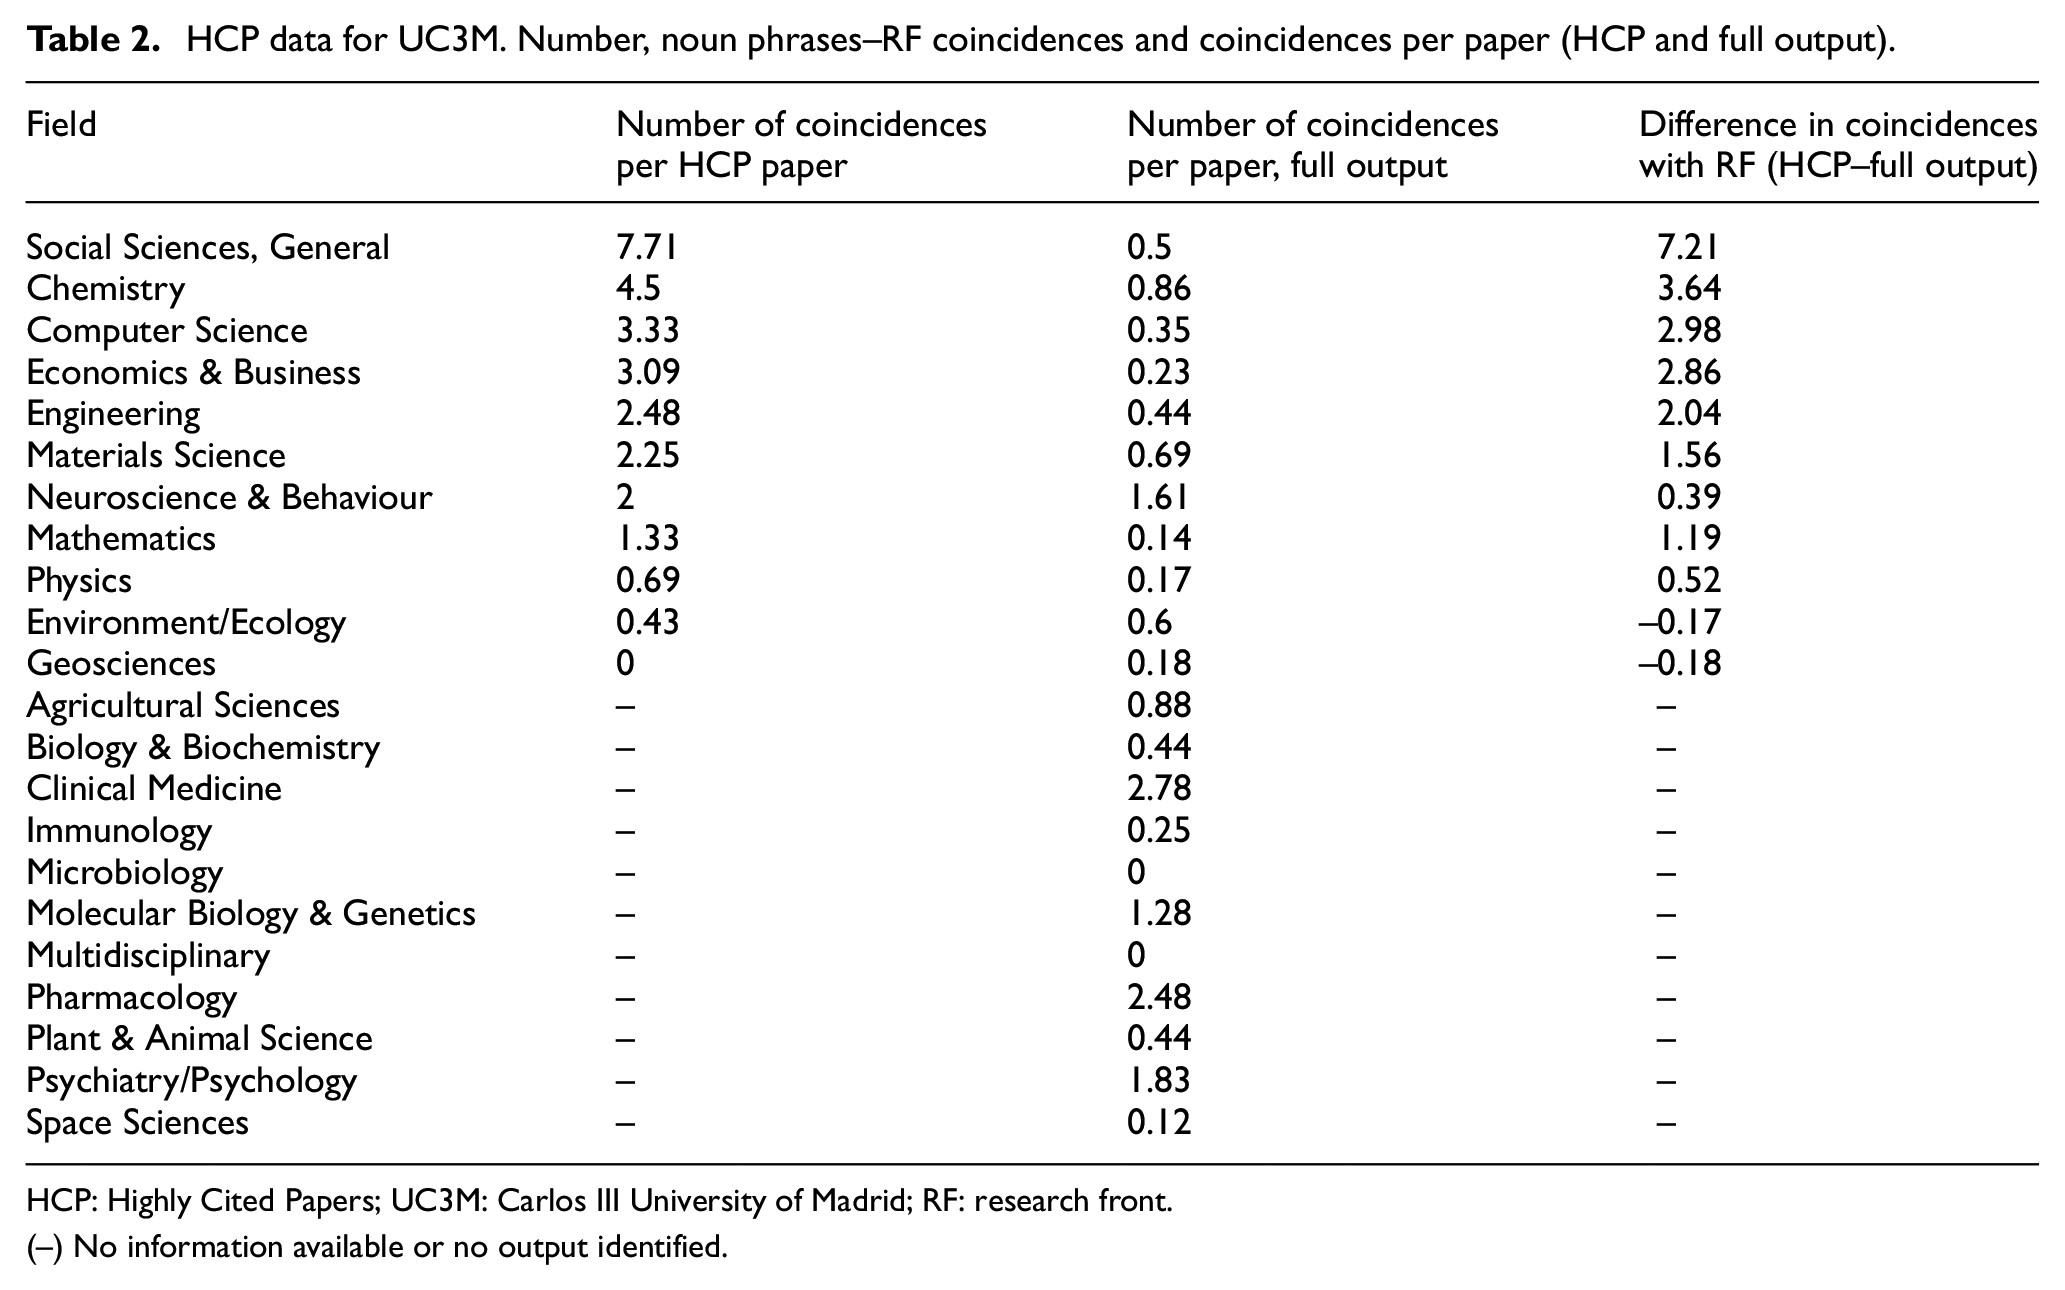
In this study, we identified 4831 papers from UC3M, from which 39 are HCP in the field. The number of coincidences between the noun phrases and the RF for HCP and full output of UC3M for the period are presented in Table 2.
HCP data for UC3M. Number, noun phrases–RF coincidences and coincidences per paper (HCP and full output).
HCP: Highly Cited Papers; UC3M: Carlos III University of Madrid; RF: research front.
(–) No information available or no output identified.
Table 2 illustrates the range of values of coincidences per paper in the case of HCP papers. These range from 0.43 (Environment/Ecology) to 7.71 (Social Sciences, General) with a mean value of 2.78 (SD = 2.13). The coincidences per paper in the case of the full publication output of the UC3M present values much lower than those of the HCP. These range from 0 (in areas such as Microbiology or Multidisciplinary) to 2.78 (in Clinical Medicine), with a mean value of 0.74 and a standard deviation of 0.79. With the exception of Environment/Ecology and Geosciences, in all fields where there are HCP to compare with, these present a greater ‘alignment’ with the RFs.
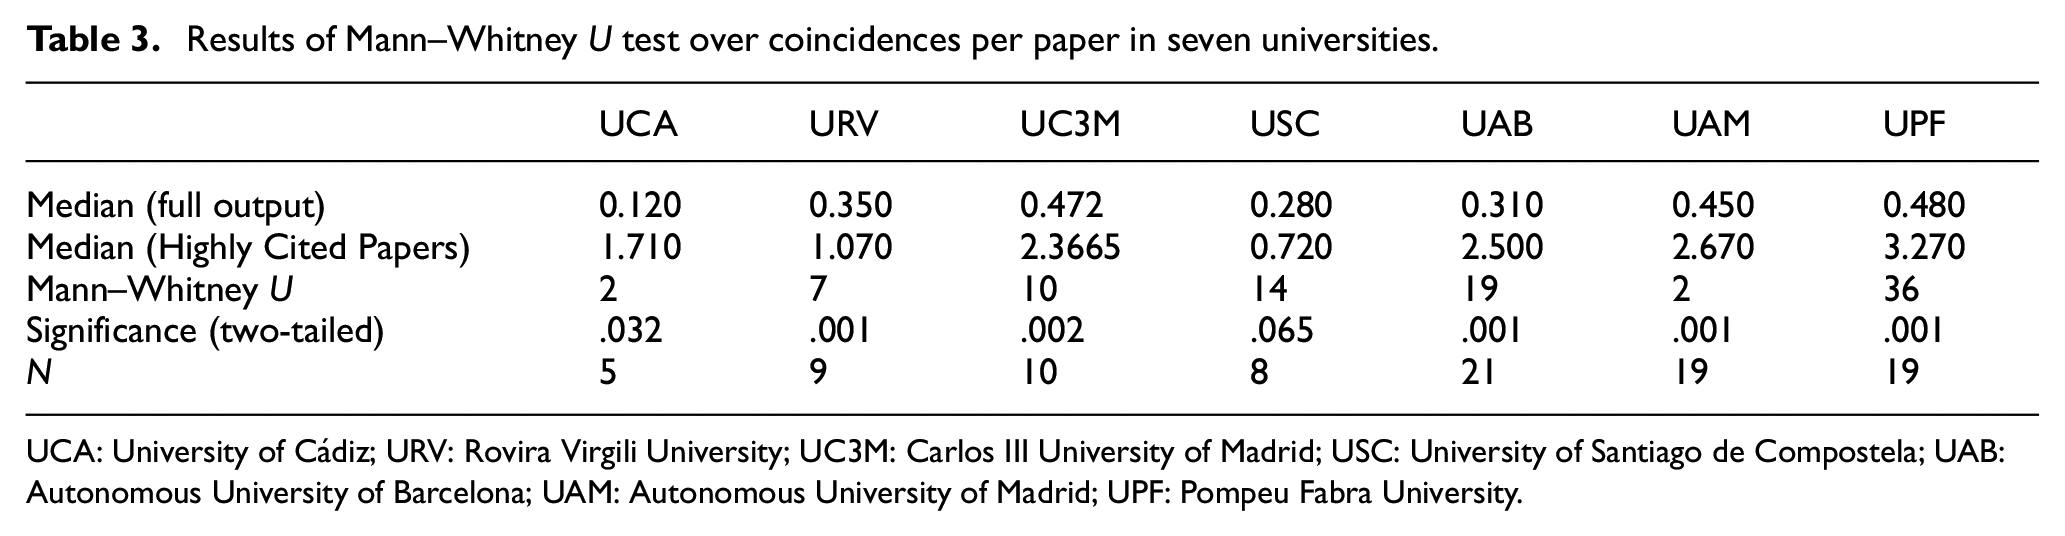
We applied the same methodology for the full output and HCP output of other six universities. For these universities and for the data in Table 3 for UC3M, we applied a Mann–Whitney U test over the number of fractioned coincidences for the full output and the HCP output (using the In-Cites area) in order to test the null hypothesis stating that the medians of the coincidences per paper are the same in the two groups. The results and main statistics are presented in the following table.
Results of Mann–Whitney U test over coincidences per paper in seven universities.
UCA: University of Cádiz; URV: Rovira Virgili University; UC3M: Carlos III University of Madrid; USC: University of Santiago de Compostela; UAB: Autonomous University of Barcelona; UAM: Autonomous University of Madrid; UPF: Pompeu Fabra University.
As can be seen in Table 3, in all cases but USC, there are statistically significant differences between the coincidences per paper in the full output and in the HCP and, in all the cases, the medians are greater for the HCP output (especially in PFU and UAM).
3.2. Alignment of HCP with RFs
Table 4 illustrates, for UC3M, a selection of fields in which the median citations per document is statistically significantly greater for the articles that present coincidences with the RF. Out of 135 subject categories in 82 cases (60.74%), the papers with RF coincidences present values of citations per document greater than those without coincidences with the RF. In 12 subject categories, these differences are statistically significant (using Mann–Whitney’s U test) and the medians are greater for the papers with RF coincidences with the exception of the field Nuclear Science & Technology.
Descriptive statistics for the contrast of medians between the articles aligned and not aligned with the RF at UC3M.
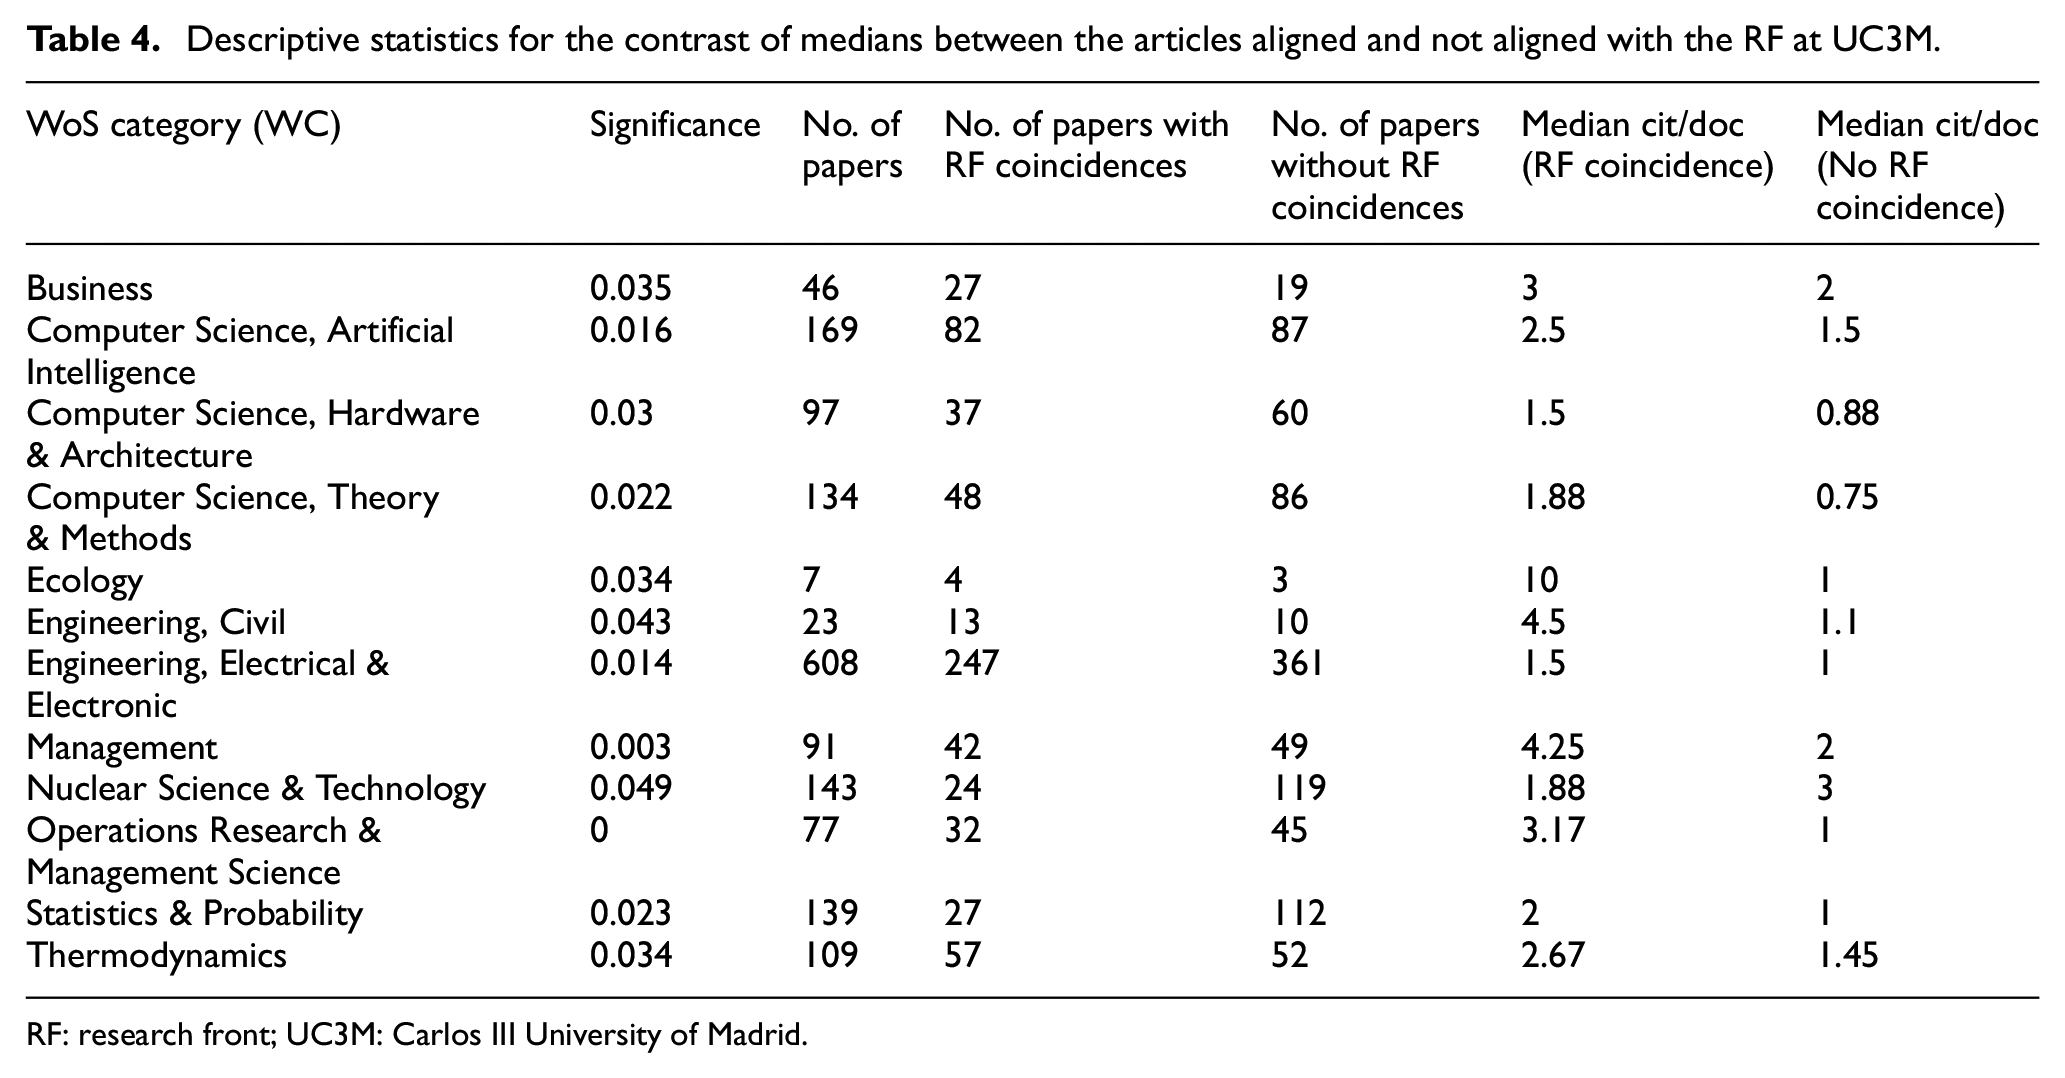
RF: research front; UC3M: Carlos III University of Madrid.
3.3. Alignment with RFs with citations
For six out of the seven universities under study, we found that articles with coincidences with RF present greater mean ranks of citations per article than articles without coincidences and of these differences are statistically significant. Table 5 presents the results of the Mann–Whitney test for the citations per document for the two types of articles for each institution (with and without coincidences with the RF).
Main statistics and results of Mann–Whitney U tests: citations per document of coincident articles and non-coincident articles.
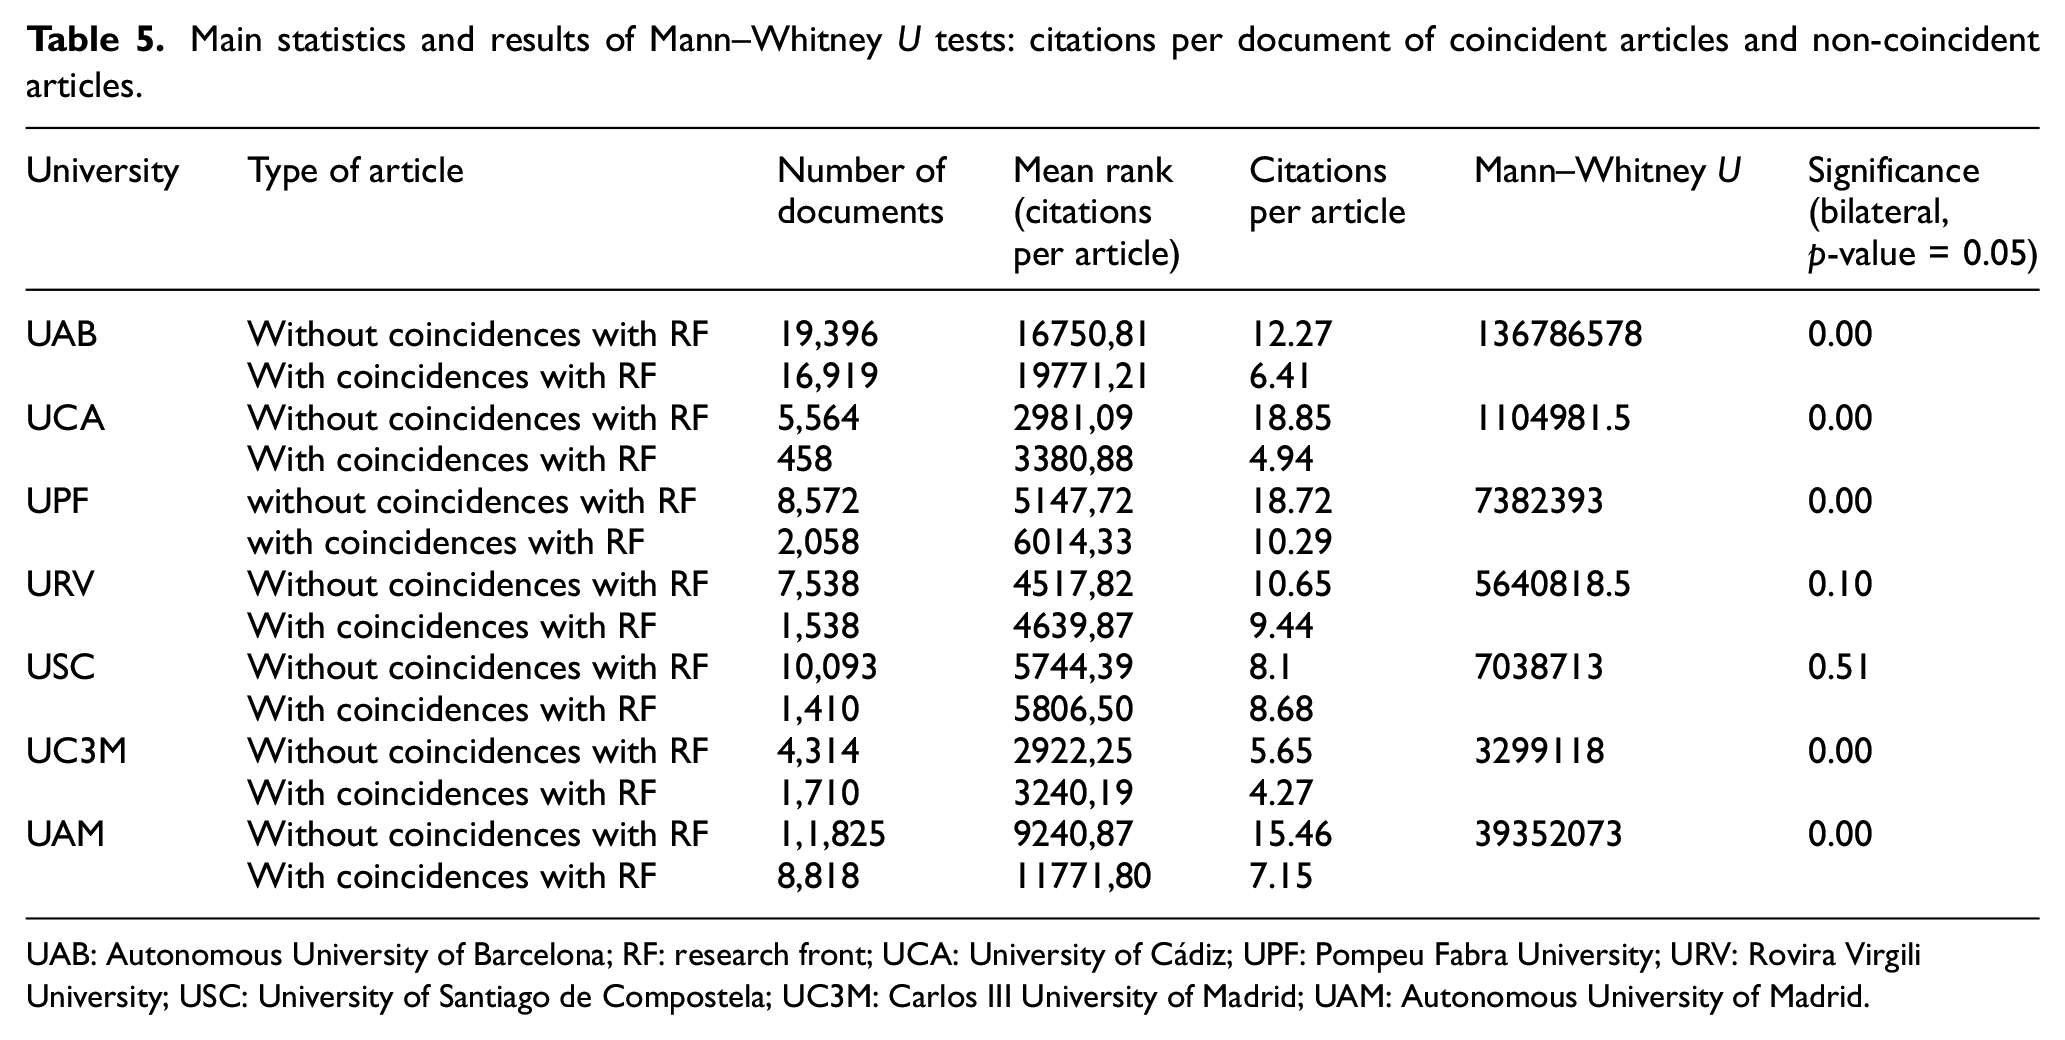
UAB: Autonomous University of Barcelona; RF: research front; UCA: University of Cádiz; UPF: Pompeu Fabra University; URV: Rovira Virgili University; USC: University of Santiago de Compostela; UC3M: Carlos III University of Madrid; UAM: Autonomous University of Madrid.
Among the seven cases studied there is a notable exception to the general trend: USC (Santiago de Compostela University). The explanation of the causes or variables that might contribute to this observation falls outside the realm of this research, but a closer look to the fields in which the citations per document are greater for non-coincident articles shows a certain thematic relatedness: Microbiology, Clinical Medicine and Molecular Biology & Genetics (with 4, 2.7 and 2.5 citations per document more in non-coincident articles than in coincident articles, respectively). The general trend is clear (alignment with RF is not independent from scientific impact), but the exception points out that such lack of independence can be overcome by other factors, unknown for the moment.
The magnitude of the differences in the citations per document between the two groups does not seem to be independent from size, in terms of number of lecturers. The differences appear to be greater for ‘larger’ universities, that is, with more research staff (e.g. Autonomous University of Madrid with a difference of 8.28; Pompeu Fabra University with 8.43).
The analysis of the ‘advantage’ or otherwise of articles with coincidences over their counterpart by fields is a potential source of interesting information for decision-making, concerning the relative importance of aligning the publications with the RF in the various fields of knowledge. Table 6 presents the citations per document for both types of articles for UC3M and the difference in citations per document in each group.
Citations per document for articles with and without noun phrases–RF coincidences by field and differences between the two groups: UC3M.
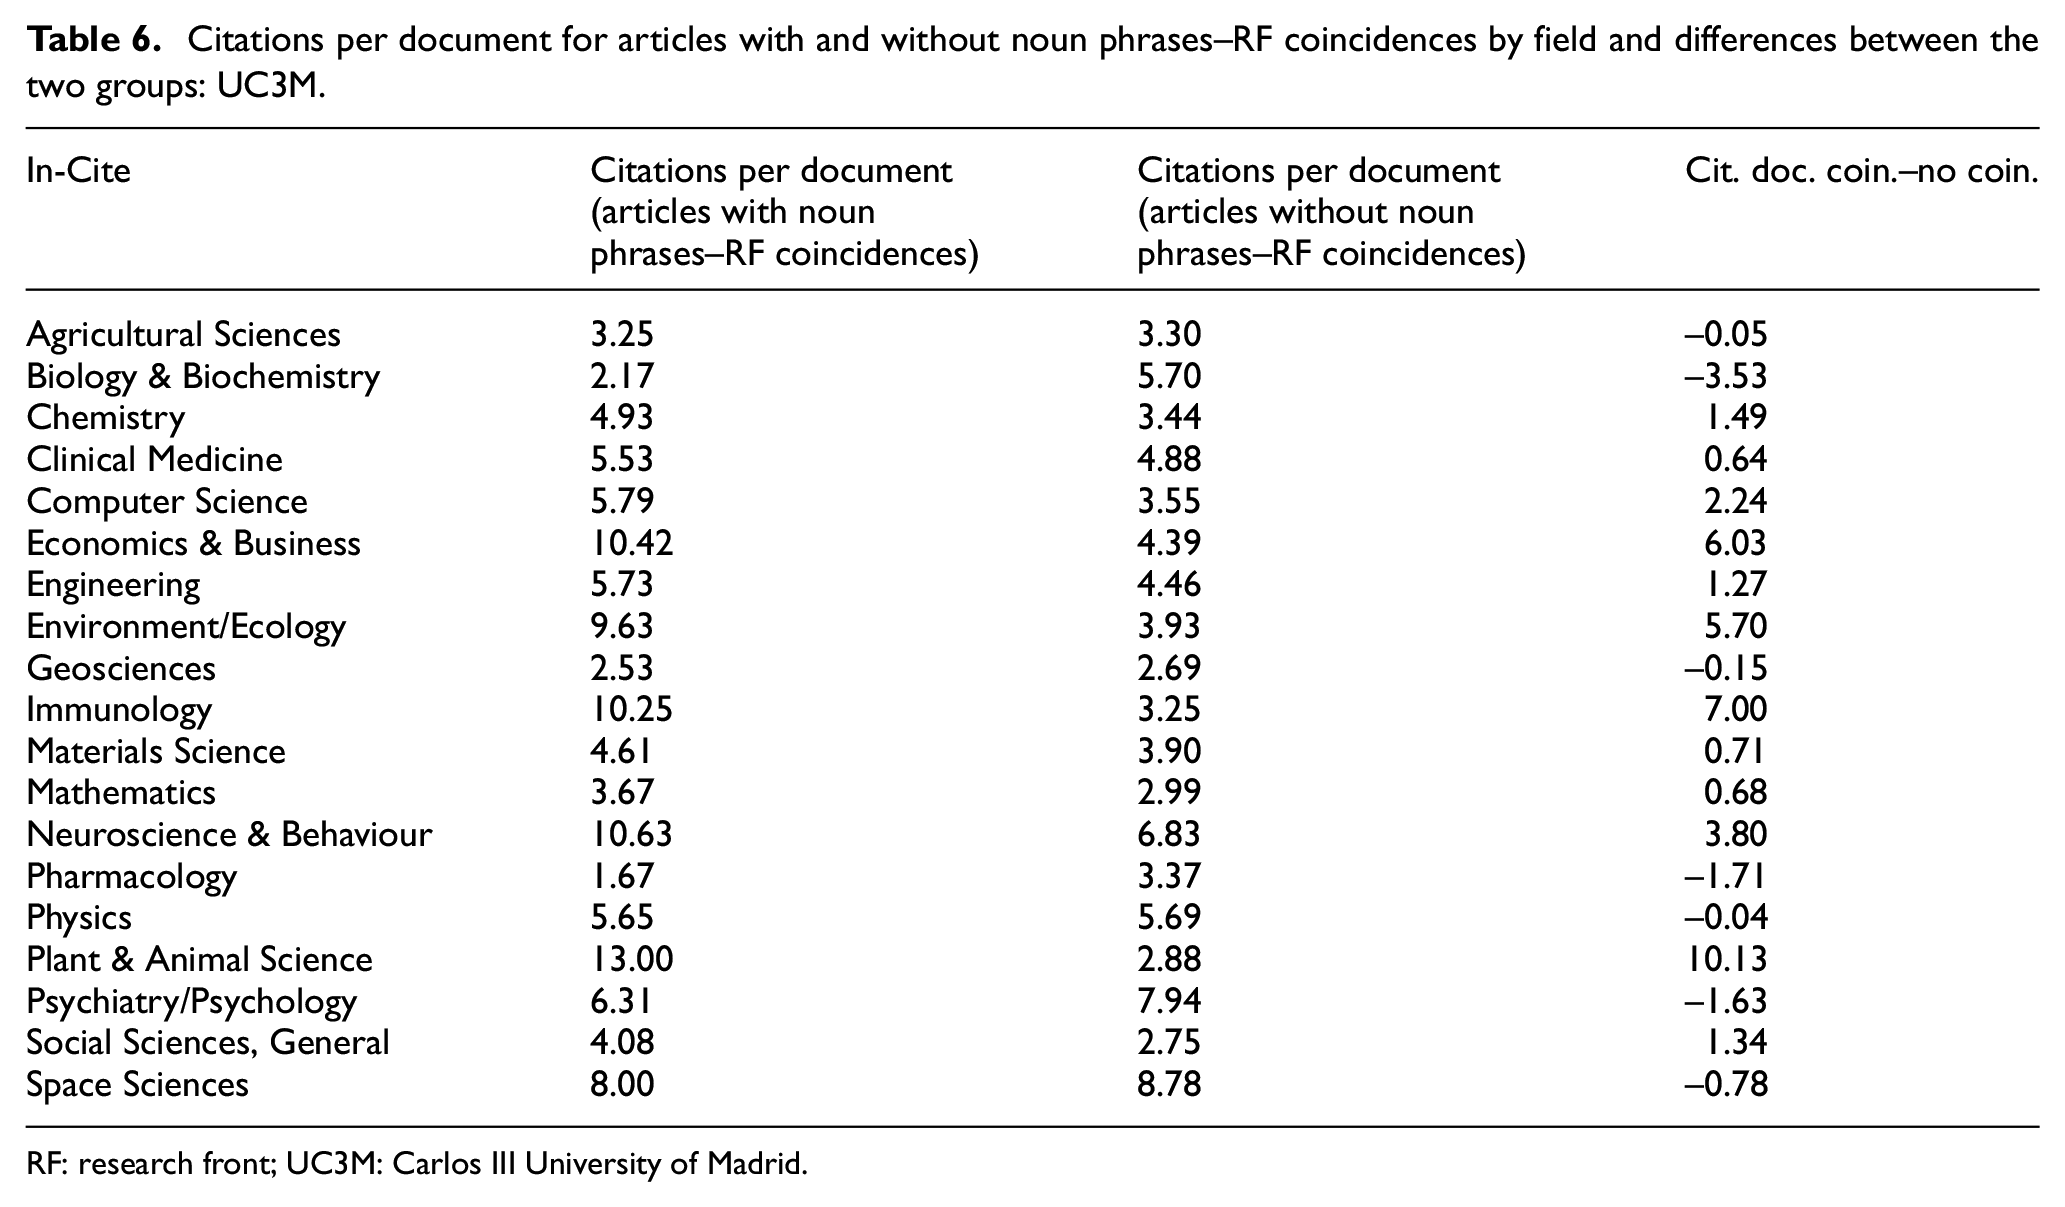
RF: research front; UC3M: Carlos III University of Madrid.
Fields such as Plant & Animal Science, Economic & Business and Immunology seem to present a stronger relationship between RF alignment and scientific impact whereas for others, such as Biology and Biochemistry, Pharmacology and Psychiatry/Psychology, such relationship is inverse. This structure of relationship between two variables is probably to be dependent of the institution and potentially useful for decision-making in terms of research policy.
Until this point, we have performed the analyses dichotomising the independent variable: the coincidence or otherwise of the title, keywords and Keywords Plus with the terms comprising the different RF. The dichotomisation of the variable is, in fact, a transformation of the original data in order to be able to perform the hypothesis contrasts scheduled initially. Such original data includes, for each article, the number of terms that are coincident between its noun phrases. We wish to test if there is a linear relationship between the number of noun phrases--RF coincidences and the scientific impact and to know which is the variability of such hypothesised linear (positive) relationship. For this purpose, we calculated Pearson’s correlation between the fractionalised citations per document and the fractionalised number of noun phrases–RF coincidences. As in previous analyses, we present first the data for the UC3M, followed by the aggregated data for all the institutions under study (Table 7).
Correlation between fractionalised noun phrases–RF coincidences and citations per document for UC3M, by field.
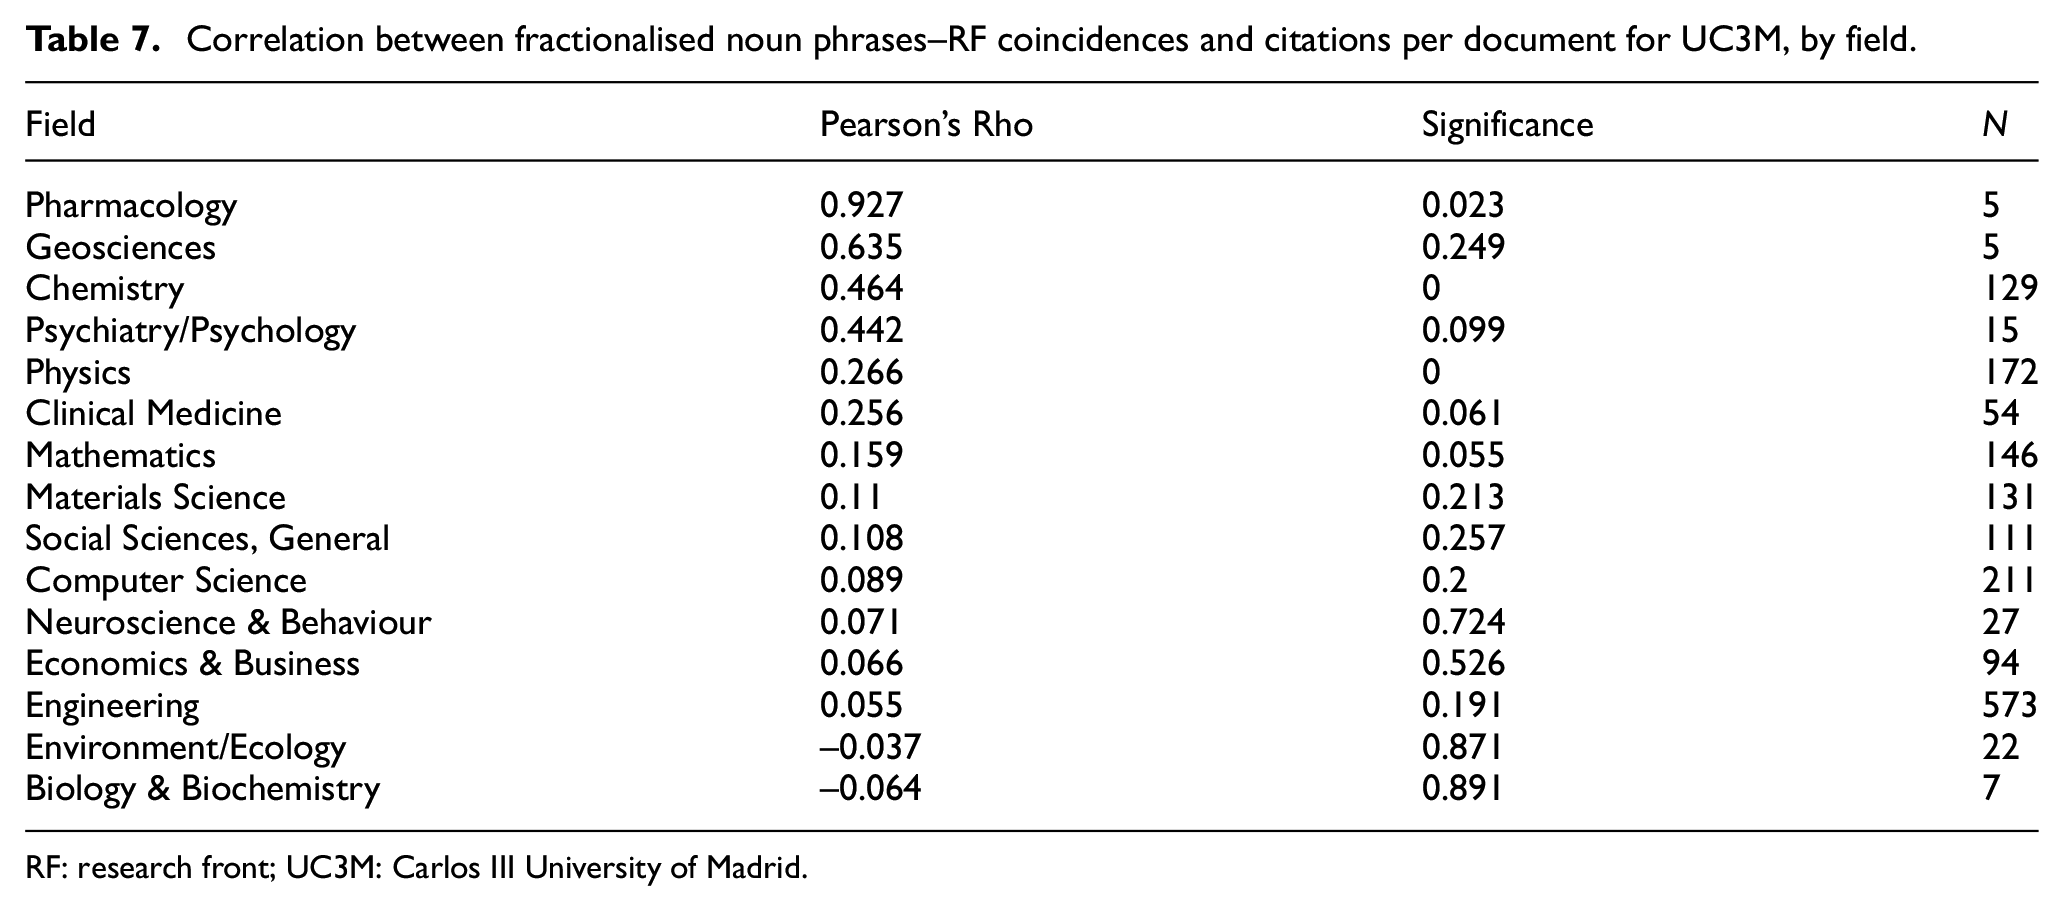
RF: research front; UC3M: Carlos III University of Madrid.
The first relevant observation from Table 7 (which shows the correlation between fractionalised noun phrases--RF coincidences and citations per document by field) is the strong variability of the correlations observed: these rank from weak negative to strong positive. The second observation is that most correlations are positive. The third observation is that only one field presents a strong correlation and one a moderate correlation, both with a very small number of cases. From Table 7, it can be concluded that the general trend is a weak positive relationship between the number of noun phrases–RF coincidences and citations per document.
Next steps would include the replication of the analyses presented in Table 5 by research fields and, for all research fields, the analyses of the largest differences between articles with and without coincidences with the RF in terms of citations per document.
4. Discussion
Detecting RFs is a challenge for researchers, policy makers and other groups as it helps with resource allocation and technological forecasting to policy, among others [14]. This study presents a new method approach to identify RFs applied to a case study of seven Spanish universities (at organisational level) for a 5-year period. The results show there are statistically significant differences between the coincidences per paper in the full output and in the HCP and, in all the cases, the medians are greater for the HCP output (e.g. UPF and UAM). Although one might presume this is logical (as HCP are derived from the papers), this provides new insights into the Clarivate Analytics and CAS [25] products (In-Cites and HCP), as differences between disciplines can be observed, for example, some areas such as clinical medicine are more aligned, while the ‘Multidisciplinary’ field is less pronounced. This concurs with previous studies that suggest multi- and interdisciplinary approaches are difficult to identify [4].
We found that articles with coincidences with RF present greater mean ranks of citations per article than articles without coincidences (and are statistically significant). According to the results obtained from the universities of these studies, alignment with RF is not independent from scientific impact but the exception indicates that this lack of independence can be overcome by other factors. This provides new insights into methods in the literature for detecting RFs based on citations (Mazov et al. [4]; Shibata et al. [13], Marrone [14]).
The results do not allow establishing a causal relationship between RF alignment and citation potential, but yes a positive association. The results evidence a greater impact of RF-aligned research over non RF-aligned papers: this does not immediately follow from the definition of the RF (which are extracted only from HCP), but rather suggest the existence of a continuum of alignment between papers and RFs beyond the boundaries of the HCP set. If this continuum exists, the ‘distance’ or ‘alignment’ with RF seems to be non-independent from the existing citation count and possibly from the citation potential of scientific literature. Moreover, the magnitude of the differences in citations per document between the two groups does not seem to be independent of size, that is, the number of lecturers. The differences appear to be greater for ‘larger’ universities, that is, with more research staff.
Although the data are not fully developed yet, preliminary comparisons of citations per document by field of knowledge show that universities output in several fields is below the median for the public Spanish University System. This might also correspond with a lower alignment of its research lines with the RFs. Despite the lack of proven causality, the clear association between alignment and impact underlines the usefulness of taking the descriptors of the RFs as potential points of reference for decision-making concerning the prioritisation of research lines, resource allocation and economic incentives (Chen and Jang [15]).
This research presents some limitations that the authors intend to overcome in the near future. The first limitation has to do with the limitations of the sample: the sample is relatively small and, thus, might present specific biases that cannot be clearly identified. WoS database has a significant impact on the results on the detection of RFs and may have limitations owing unequal coverage in comparison with other databases (e.g. Google Scholar and Scopus) across scientific fields and the underrepresentation of non-English-speaking countries. HCP considered in this study are not limited to a given time period, which might imply a form of bias in the analysis of the RFs alignment (an HCP from 2012 might present spurious alignment with current, 2019 RF). In addition, these results can be considered valid for the outputs of these universities, but further research implies the necessity of testing the congruence of these results with other institutions of different types (technical, generalist, established and new universities). It has not been possible to establish a causal relationship between citations and alignment with RFs and this might limit the usefulness of the conclusions for the university, albeit RFs are systematically used for similar objectives in Clarivate Analytics’ In-Cites. In this sense, despite already taking into account some of the main sources of variability in citations (the same institution and most lecturers and their output divided by fields of knowledge), we expect to isolate other intervening sources of variability maximising the ceteris paribus scenario in further research. Concerning the methodology used for counting the coincidences, the authors acknowledge that more sophisticated procedures have been developed and tested for text-based relatedness measures, such as those detailed in section 3.2 of Waltman et al. [31]. In this first approach, we used a simpler methodology in terms of co-occurrence in order to serve as a proof-of-concept, but further developments would imply the use of the aforementioned measures and procedures when applicable. Finally, we only counted coincidences as a dichotomous variable: an article presents a coincidence with a RF if two or more terms coincide. The degree of alignment of an article with a RF could vary substantially taking into account the number of coincidences for a single paper (i.e. paper ‘a’ presents 1 coincidence whereas paper ‘b’ presents four coincidences’, both with the same RF). That gradation ought also to be addressed in further research.
5. Conclusion
In the last decades, there has been a research interest in the identification of RFs in the scientometrics field. This topic is of importance, especially in terms of decision-making in research policy or grant allocation. However, the majority of efforts in academic research have focused on the use of citation or text mining methodologies with a limited number of case studies that focused on organisational level.
This article uses a case study of seven Spanish universities to examine the RFs in the WoS literature over a 5-year period. The main contribution of our article is to propose a novel approach to identify RFs through a coincidence method using In-Cites and HCP data. To our knowledge, it is the first to use the Mann–Kendall test to understand HCP alignment with RFs and to analyse the extent to which RFs receive or do not receive more citations than those that are not aligned at the organisational level. We believe that the methodology used would be helpful to researchers who wish to replicate these results in other organisations/fields using a new approach. This information would also help governments develop institutional research agendas and identify where to focus efforts or target funding.
Footnotes
Author note
This study has partially been presented at the International Society for Scientometrics and Informetrics (ISSI) 2020 conference (Mañana-Rodríguez, Bautista-Puig and Sanz-Casado [![]() ]). Núria Bautista-Puig is also affiliated with Department of Information and Library Science, Complutense University of Madrid, Spain.
]). Núria Bautista-Puig is also affiliated with Department of Information and Library Science, Complutense University of Madrid, Spain.
Declaration of conflicting interests
The author(s) declared no potential conflicts of interest with respect to the research, authorship and/or publication of this article.
Funding
The author(s) received no financial support for the research, authorship and/or publication of this article.