
Abstract
In this article, we present PostGage, a new framework that identifies the most suitable publishers of target content on social media, based on the level of user engagement they are expected to generate. PostGage uses a network-based data model that considers the characteristics of publishers, as well as the degree to which the semantic content and lifespan of the posts to be published overlap with those of the posts already published. Leveraging this data model, PostGage builds a multinomial classifier based on a graph neural network (GNN). The alignment between the graph-based data model and the GNN technology allows a precise classification of publishers based on their potential to generate user engagement for target content. This feature enables a more precise definition of publishing strategies on social media, as it allows the selection of the most promising publishers for a given post. The network-based model, the post ageing mechanism and the adoption of the GNN as a multiclass classifier represent PostGage’s key contributions. We also present a series of tests performed on X that demonstrate the high quality of PostGage’s results (e.g. 92% precision in predicting high-engagement posts), establishing it as an invaluable tool for various applications, including marketing and social media management.
1. Introduction
In recent years, online social media have assumed a key role in social interaction and information exchange among people. Although this phenomenon has its roots in the late 1990s, it is with the COVID-19 pandemic that social media have taken an even more critical position as the main channels for disseminating news and information [1,2]. Such a pervasiveness has led the industrial world (and beyond) to make massive use of these platforms to maintain relationships with people. In fact, the new paradigm of Society 5.0 [3,4] is increasingly pushing towards the massive use of online social media as a means of creating a continuous and dynamic channel between companies and customers, as well as between government agencies and citizens [5]. In this context, terms like ‘human-centric’ and ‘mass-personalization’ of products and services subsume the need to massively involve people, their opinions and preferences in the design of new products and services [6–8]. In this scenario, a social media user is both a consumer and a publisher.
However, in order to fully exploit the potential of social media, it is necessary to cope with the continuous large-scale production and distribution of new content, while taking into account the factors that lead to an increase in user engagement. In this regard, it should be pointed out that the retrieval of interesting content is a well-known issue in the literature [9]. In contrast, user engagement in specific contexts, such as ad hoc communication, advertising or marketing campaigns, is an important open issue that has received much attention from researchers [10]. Moreover, it is particularly felt by marketers, who are arguably the main promoters of direct interactions with the customer base in the industrial world [11,12]. To address this issue, researchers have begun to define appropriate metrics for user engagement. The latter term originates from the Information Systems field, where it is defined as a combination of different aspects of the user, including her or his experience, psychological state and behaviour [13]. As for the context of our interest, user engagement implies possible user actions in the underlying social medium. For this reason, the corresponding metrics defined in the past have been based on the rate of these actions [14,15]. Clearly, the actions allowed to the user depend on the functionalities offered by the social medium. However, user engagement metrics generally focus on very common and basic actions that are generally present in most social media, such as ‘comments’, ‘likes’ and ‘re-posts’ [11].
After studying the metrics of user engagement, researchers investigated the dynamics that lead to an increase in user engagement with posted content. These analyses showed that such engagement is related to three main feature categories concerning: (1) the user posting the content (e.g. popularity, age, location); (2) the context of the post (e.g. time of posting, explicit targeted list or group of users); and (3) the content itself (e.g. topic, quality of language used, length, use of media or special characters) [16]. The above feature categories have been used by researchers to apply Machine Learning approaches to predict user engagement generated by specific posts [17,18]. Again, other researchers have argued that an additional key factor in generating user engagement is the ability of a community to ingest new content. Indeed, they have begun to consider features related to connections between users, and thus structural properties of the underlying social platform [15,19].
Due to the complexity of the above prediction task, many previous approaches have focused on a simplified version of it. In particular, they consider a binary classification of posts to determine whether they are likely to receive a response (nonzero engagement rate) or are destined to go unnoticed. In [20], the authors show that the accuracy of such a binary classification task can be improved by combining the features mentioned above with information on the semantic relationships between the content of the target post and that of the already published ones. To learn additional features from the semantic relationships, they propose a graph neural network (GNN)-based approach. They then investigate the role of these new features in the prediction task through an ablation study.
In this article, we want to explore this setting and propose PostGage, a multiclass GNN-based framework for predicting post engagement in social media. PostGage identifies the best candidate publishers in social media, that is, those who can maximise the user engagement that can be achieved on the target content. It combines knowledge about two different aspects of engagement dynamics, namely: (1) the role of the publisher in the social medium under consideration and (2) the semantic relationships of the target post with respect to previously published content. Indeed, the role of the publishing user is crucial for maximising the dissemination of the target content through a social medium. On the other hand, the fact that such content is well related to other already published content favours its placement in discussion threads and thus its ability to generate user engagement.
PostGage shifts the engagement prediction from binary to multiclass. As a consequence, our framework can distinguish between different levels of engagement for a given post. PostGage uses a network-based model with nodes representing posts. To process post content, it adopts BERT with the goal of obtaining an embedding of the text [21]. The nodes in our model also inherit the features of the users who publish the corresponding posts. These features take into account the role and popularity of these users in the social medium of interest. Examples of features are the number of followers and followings, the total number of previously published posts and so on. An edge exists between two nodes if the corresponding posts have overlapping content. Each edge stores (directly or indirectly) two pieces of information, namely: (1) the degree of semantic overlap between the two posts and (2) the expected lifetime of a post in a social medium. In the literature, there are several ways to calculate the degree of semantic overlap of two contents. The most straightforward of them is probably the one that uses keywords manually entered by the authors themselves, since these keywords represent the meaning of the posts as thought by the users who posted them. Most existing platforms explicitly recommend the use of such keywords, as they are useful to build their search indexes. In any case, whenever they are missing, keywords can be derived from the texts through various text mining approaches already existing in the literature. In our model, the weight of the edges is related to the number of keywords shared by the corresponding posts. However, it has been shown in the literature that the lifetime of a post is limited, in the sense that users’ interest in a post lasts for a limited time interval [22,23]. For this reason, PostGage employs an ageing mechanism that prunes the network by removing edges whose associated posts were published at timestamps that are so far that one of the two posts was published outside the lifetime of the other. This strategy also reduces the computational cost and ensures the scalability of our framework.
Since our information representation model is network-based, the use of a GNN [24] as the underlying multiclass classifier seems very reasonable. Indeed, it allows the native processing of our representation of the scenario involved. The multiclass nature of our classifier allows for a refined comparison of the user engagements generated by the posts. In fact, thanks to this feature, given a set of candidate users, PostGage can identify the best publishers for a given content by simulating a posting action and comparing the predicted engagements generated.
To validate our approach, we chose X. The reasons for this choice are twofold. First, this social network has been the reference platform for much related research in this area [25,26]. In addition, at the time of writing this article, it provided access to its data thanks to a rich and well-established set of Application Programming Interfaces, through which the datasets needed for the experiments could be built. The results obtained show that our intuition about the crucial role of connections between posts in promoting user engagement is correct. Finally, they show that PostGage is very accurate in identifying users who can achieve the highest level of engagement on a target content.
In summary, the main contributions of this article are as follows:
We define an approach that uses GNNs to classify posts based on their potential for user engagement.
We propose a network-based model capable of representing posts and their relationships. Our model is very rich because it allows for the representation of semantic links between posts, textual features and post publisher information.
We formalise and test an ageing mechanism to preserve the scalability of the solution by retaining only meaningful semantic links between posts.
We define a novel framework for identifying the best publishing strategies to maximise achievable user engagement in social media. To the best of our knowledge, it is the first framework with this goal, since all related approaches proposed in the literature use only binary classifiers.
PostGage can be particularly useful to help companies (resp., public authorities) identifying the best influencers for their information campaigns and, more generally, to reach their potential customers (resp., citizens) in a consistent and continuous way.
This article is structured as follows: In Section 2, we present the related literature. In Section 3, we provide a detailed description of PostGage. In Section 4, we illustrate the experiments we conducted to evaluate its validity and performance. In Section 5, we propose a discussion of the main results obtained, the limitations of PostGage and the future developments of our research. Finally, in Section 6, we draw our conclusions.
2. Related work
Researchers and companies have long studied the dynamics behind the generation of user engagement in online social networks for a long time [10,11,27]. In fact, due to the enormous popularity of social media, companies (and, more recently, government agencies) are making huge investments in content creation and distribution. This is because, on social media, the more people one can reach, the greater the corresponding income. With this in mind, defining effective ways to create and distribute posts on social platforms becomes a critical task [10].
Depending on the social network, users can take different actions with a post. Examples of interactions are likes and retweets on X, upvotes and downvotes on Reddit, and likes and comments on TikTok. Several metrics have been proposed in the literature to evaluate user engagement from these interactions [11,14,15,28]. In particular, in [15], the authors start with a collection of users and tweets, calculate the engagement of a tweet as the sum of the number of retweets and favourites it receives, and train a model to rank the observations according to their importance. We decided to use this metric as the default one in PostGage when evaluating user engagement.
Many approaches have been proposed to study user engagement in social networks [17,29]. Most of them, especially the most recent ones, use Machine Learning and Deep Learning techniques. Considering our network-based perspective, we distinguish three groups of user engagement prediction approaches in the literature, that is, (1) Group 1: approaches that are not graph-based; (2) Group 2: approaches that are graph-based but do not use GNN; and (3) Group 3: approaches that are graph-based and use GNN.
As for the approaches belonging to Group 1, researchers extract features from the user history, the performance of the post in terms of interactions, and the analysis of its content using Natural Language Processing techniques. For example, the authors of [30] exploit features related to user behaviour, tweet statistics and text semantics using BERT. They then exploit these features to train a Light Gradient Boosting Machine (LightGBM) and a Multilayer Perceptron for classification. In [31], the authors predict the popularity of news articles published on Facebook and X using only their headlines. In [32], the authors evaluate the effect of sentiments and topics on user engagement according to different interactions, such as views, likes, comments and cross-platform posts. For each post, they compute four engagement metrics taking into account possible interactions and then train an AdaBoost, a Decision Tree and a Random Forest to predict them. Similarly, in [33], the authors analyse the effect of topic distribution on user engagement and categorise it into four levels. In [27], the authors propose a neural network that separates the general media adorability of content from the social platform where it was created. In this way, they calculate the user engagement that could be achieved by the same content in another social network. In [18], the authors investigate the relationship between misinformation and user engagement in COVID-19-related tweets. They first evaluate the user engagement of a post as the sum of likes and retweets. Then, they create two classes representing high and low engagement based on the median value of user engagement. From the text of the post, they extract some features, such as the number of words and Part-Of-Speech tagging. Finally, they use Gradient Boosting, Multinomial Naive Bayes and Random Forest to carry out classifications and obtain promising performances. It should be noted that all these approaches do not take into account user and/or post interactions, which are the core of Social Network Analysis and from which relevant features can be extracted to improve classification results.
As for the approaches belonging to Group 2, researchers extract features from post content, user history and graph-based structures representing user and/or post interactions. For example, in [19], the authors fine-tune two variants of multilingual deep language models, called M-BERT and XLM-R, on X datasets. They use embeddings from these models to obtain tweets and user representations. These are given as input to a feed-forward network characterised by a fully connected layer and ReLU activation, which combines all previous components and trains them together to maximise the accuracy of user engagement prediction. The features used can be grouped into four categories, namely: (1) engaging user, (2) tweet creator, (3) tweet content and (4) interactions. The same authors then propose an extension in [34], where they introduce a pipeline consisting of gradient boosting, neural network classifiers, multilingual language models and collaborative filtering features to predict user engagement on X. In [35], the authors fine-tune a DistilBERT model [36] on X data to obtain a text embedding and use the same text as a compressed representation of the tweet semantics. In addition, they add some features extracted by community detection algorithms on engaged-engaging user graphs and obtain complex structures of mutual interaction between users, where large communities have lower interaction strength. A simple feed-forward neural network receives these latter features as input to predict user engagement. In [37], the authors predict the ranking of MovieTweetings tweets based on the expected level of interaction, which is obtained by summing the number of retweets and favourites. In this approach, the features are user history, tweet content, movie information (e.g. the number of times a movie was tagged in a tweet) retrieved from IMDb and network-based information obtained from a relevant graph. All of these features are used to train a Decision Tree, an AdaBoost and a Naive Bayes, which provide the final prediction of user engagement. In [38], the authors introduce PCNA (People-Content-Network Analysis), a framework for studying user behaviour in social networks. It includes three categories of features, namely: (1) community features, (2) author features and (3) content features. Finally, they train a Support Vector Machines classifier and show that these feature categories are important to achieve good performance. In [39], the authors propose a two-stage ensemble model. The first stage includes three classifiers, namely LightGBM [40], Gradient Boosting and a neural network, while the second stage contains an additional LightGBM classifier. The input to the ensemble model consists of two categories of features, namely: (1) user behaviour features and (2) tweet text features. In [41], the authors extract features from the tweet text, user profile and user connections graph, and then train two-stage stacking models to predict different types of engagement on X, such as like, reply, retweet and retweet with comment. In [42], the authors propose a framework that leverages user behaviour on Facebook and contextual information from the network to predict engagement on a brand’s posts. They first create a metapath-based Heterogeneous Information Network and then use a Graph Attention Network to predict user engagement. In [43], the authors use graph mining to evaluate user engagement on X. They assume that the engagement is related to the number of user connections to a tweet and the tweet statistics, such as the number of retweets and replies. The approaches described above are graph-based like PostGage and therefore take into account interactions between users and/or posts. However, none of them have PostGage’s two other fundamental characteristics, namely: (1) the use of a GNN as a multiclass classifier and (2) the post ageing mechanism that disregards oldest posts’ contributions.
As for the approaches belonging to Group 3, researchers use GNN because it is an architecture that fits very well with the network model they employ to represent interactions between users and posts. For instance, in [44], the authors propose some definitions of user engagement according to different business scenarios and then introduce an end-to-end neural framework called FATE, implemented using a GNN, an LSTM, and a mixed attention mechanism. In [45], the authors adopt a GNN to predict user engagement on X leveraging features coming from the user, the tweet content and the engagement graph of users and tweets. In this approach, the GNN is used to combine the tweet features and graph structure for predicting user engagement. In [46], the authors propose a temporal GNN-based framework to predict the popularity of some target entities in social networks. This framework learns the temporal representations of a target in each social network snapshot and predicts the popularity of a particular entity in the next snapshots. In [20], the authors propose a GNN-based framework for predicting engagement on X. Their approach represents tweets as nodes and connects them according to content-based relationships such as shared hashtags. It combines structural links with text and user features. It performs binary engagement prediction and demonstrates that incorporating graph relationships between tweets improves accuracy compared with methods that rely solely on text and/or metadata. In [47], the authors introduce KEGNN, a knowledge-enhanced GNN to predict user engagement on social media. KEGNN integrates standard GNN message passing with weighted logical constraints that encode external domain knowledge. This allows contextual information to support the learning process. Finally, in [48], the authors propose GACE, a GNN with attention mechanisms that predicts customer engagement on brand posts on social media. GACE adopts a heterogeneous network structure that includes brand posts and users and connects them through content consumption interactions. Specifically, GACE adopts this structure to learn latent representations of users and posts and then enriches these representations with attention to highlight more informative connections. Similar to the approaches of Group 2 and to PostGage, the approaches of Group 3 are graph-based. Unlike the approaches of Group 2, both the approaches of Group 3 and PostGage use a GNN. However, unlike PostGage, the approaches of Group 3 lack a mechanism to filter out older posts. In addition, the GNN is used for different purposes in each of these approaches but never to select the publisher most likely to engage users with a given post, as PostGage does.
After reviewing related approaches, we can see the contributions of PostGage by comparing it to the approaches we have reviewed so far. In Table 1, we report the relevant features of the cited works and PostGage. Specifically, Model represents the type of model used to predict engagement, such as classical Machine Learning (ML), Deep Learning (DL) and Graph Neural Networks (GNN). Engagement specifies the features used to represent user engagement, which also depend on the social platform (e.g. Like, Retweet, Reply and Comment for X; Session time for Snapchat). Content Features, User Features and Graph Features indicate whether the approach exploits features from the content posted by the user (e.g. embeddings of tweets), the information about the user profile (e.g. the number of followers) and a network representing connections between users and/or posts (e.g. friendship networks or post networks). Temporal Features indicates whether the approach uses the timestamp of the posts in any way (e.g. the time a post was made). Multiclass Engagement indicates if the approach categorises the engagement into some classes and identifies the posts that received low, medium and high engagement.
Comparison between PostGage and the other related approaches available in the literature.
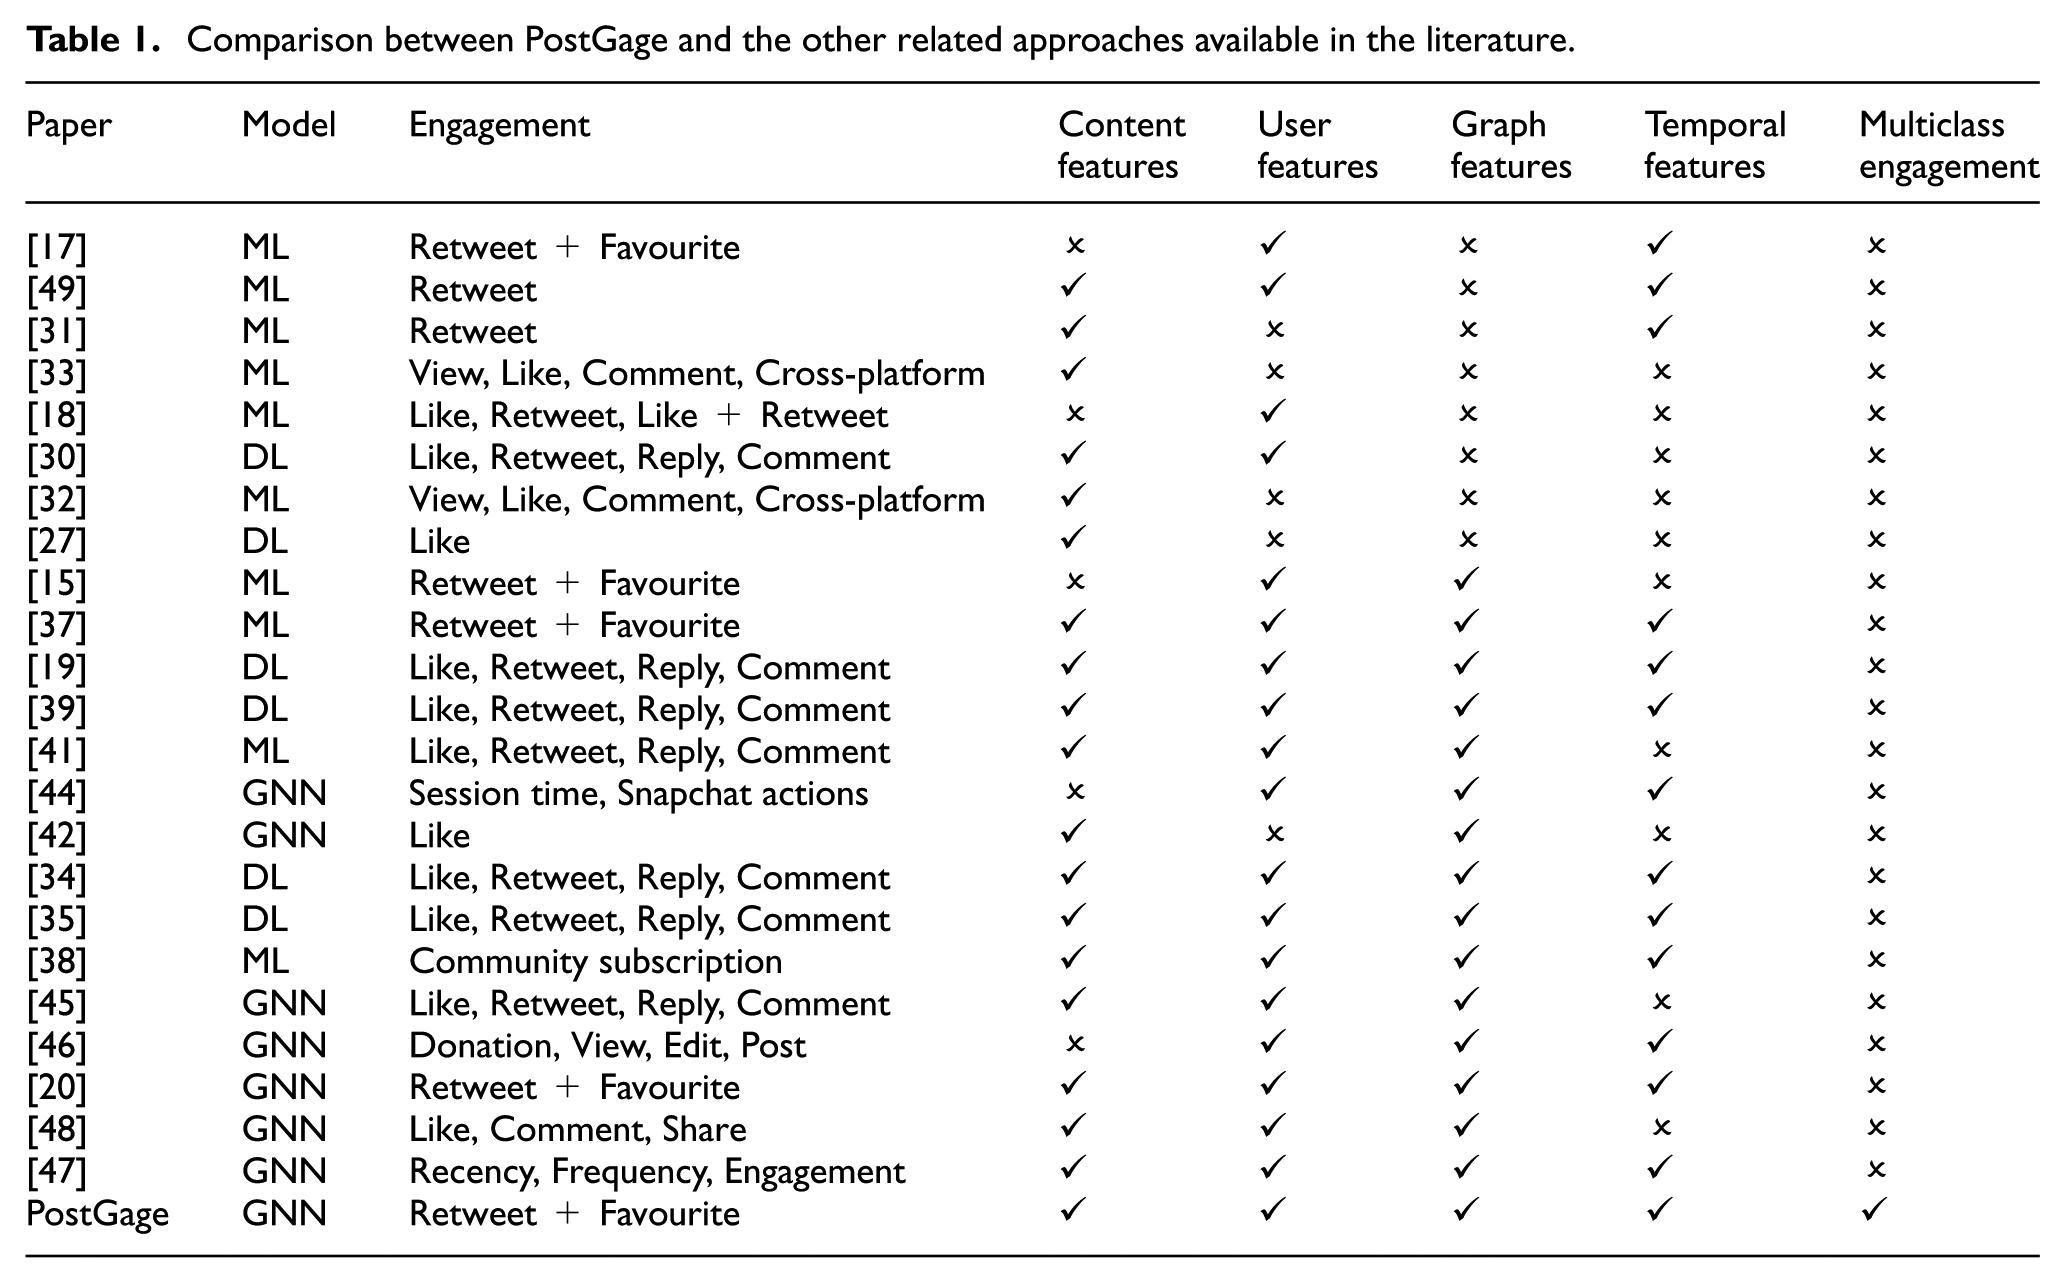
From the analysis of Table 1, we can observe that although PostGage shares similarities with the approaches described above, it also exhibits several key differences. First, the underlying model of PostGage is unique. Unlike other approaches, it not only associates a node with each post (containing content and user features, which is a common practice in the literature) but also creates edges using both shared hashtags and the lifespan of the corresponding posts (and this is a distinctive feature of PostGage). Furthermore, PostGage’s approach to embedding temporal features into PostGage is unique, as it directly models relationships based on the hashtags and creation timestamps of posts. This method effectively reduces the computational cost of PostGage while preserving the meaningful relationships – both semantic and temporal – represented by edges in the graph. Instead of treating the timestamp as an explicit feature of a node, PostGage inherently captures it through the structure of the graph itself, where edges encode temporal connections between posts. Therefore, PostGage integrates multiple features from various perspectives in this scenario, since it processes information about social network content, user profiles, relationships between posts, and their lifespans that encode the temporal feature. Finally, PostGage employs a Deep Learning strategy based on Graph Neural Networks (GNNs), tailored for graph-based data. To the best of our knowledge, it is the first approach to leverage GNNs for multiclass user engagement prediction.
3. PostGage description
In this section, we describe the architecture and behaviour of PostGage. Specifically, in Subsection 3.1, we present the starting hypotheses. In Subsection 3.2, we illustrate the network-based model within our framework, as well as the metric used to compute user engagement. In Subsection 3.3, we present the multiclass GNN-based solution, which is the core of PostGage because it allows predicting the engagement level of a post. Finally, in Subsection 3.4, we describe the workflow of PostGage.
3.1. Starting hypotheses
To define PostGage, we start by stating our initial hypotheses about the possible patterns and relationships between data in our reference scenario. Such hypotheses will serve as a driver for our investigation, allowing us to identify the best directions for data collection, feature extraction and engineering, and Machine and Deep Learning model identification. The main idea behind these hypotheses comes from the observation that, to understand engagement dynamics, one should mainly consider the contribution brought by a post content inside the target social platform. This should be analysed with respect to existing posts, taking into account the context (i.e. the time period) in which such posts have been published. Therefore, PostGage will be designed and evaluated in relation to our prior intuitions, as expressed below:
As said, our hypotheses revolve around the main idea that the success of posts is mainly due to their content in relation to existing discussion topics within the reference social medium. Following this intuition, in order to properly process our data for the construction of our framework, in the next section we will first define a new network-based data model focusing on semantics (i.e. a content-oriented model) and relationships between posts (Section 3.2). Then, we will proceed by operationalising the above initial hypotheses into a specific prediction task, which is the basis of the proposed PostGage system. Interestingly, the results on the accuracy of PostGage’s prediction task will also allow us to quantify the truth of our initial hypotheses (Section 3.3).
3.2. The network-based model
In this section, we describe our network-based model, which aims to represent posts published on a social platform along with their connections. One of the strengths of our model is that it is general and applicable to most social platforms in the current Internet scenario. As we will see below, our model is based on general concepts (such as posts, timestamps, publishers) that may have different names in the different social platforms but are present in most of them.
Let

Here:
In the following, we indicate by
A particularly important feature in
Another particularly important feature in

Here:
In the following, we denote by
We are now able to introduce the network-based model employed in PostGage. It can be represented by a graph:


It is possible to define a function
As seen in equation (4), our model stores two pieces of information about the edges, namely the number of keywords shared by the two posts and the maximum lifetime. In all social networks, keywords are a solution to collect posts on similar topics. They can be generic (like ‘research’, ‘data’, etc.) or specific (like ‘machine learning’, ‘GNN’). The ‘lifecycle’ of a keyword is not easy to estimate; for example, a hashtag on X can last days or months. Consequently, a post published today may contain the same keywords as very old posts, even if the former is about a new event on the topic that has nothing to do with the latter. The time threshold
As mentioned above, PostGage needs a metric to evaluate the engagement of a post. In Section 2, we have already seen that several metrics with such an objective have been proposed in the literature. Among them, we have chosen the metric proposed in [15] as the default one. According to this metric, the engagement

where
It should be noted that, although PostGage adopts likes and reposts as indicators of engagement, other approaches in the literature explore alternatives, sometimes even richer. For instance, some approaches aggregate multiple interaction indicators, including likes, reposts, replies and quote tweets, to capture a wider range of user activities [41,48,34]. Other works normalise engagement scores based on the author’s follower count or the number of impressions [46,52]. Another commonly used indicator is dwell time, which measures the time a user spends on a given post and is often considered a proxy for engagement instead of explicit interaction [53–55]. Each choice has its strengths and weaknesses. Multi-interaction metrics better reflect conversational dynamics, but they depend on the availability and weight of the various indicators. Normalisation strategies require access to reliable audience and exposure statistics, which are not always consistently available. Dwell time is sensitive to attention, but it is difficult to obtain it consistently across different platforms. We decided to use likes and reposts in PostGage to avoid the weaknesses of the other approaches and because of our desire to compare PostGage with several well-known prior approaches working on X, which adopt these two indicators in their tests [15,20,52]. However, we point out that PostGage is agnostic with respect to the specific engagement definition. In fact, it uses a semantic graph of posts as a model and can be trained on any engagement indicator, whether single, aggregated or normalised.
Generally speaking, the value of

In this condition, it is assumed that
Clearly, the more we divide the range of
3.3. Multiclass graph neural network
Since the data model supporting PostGage is network-based, it seemed natural for us to adopt a Graph Convolutional Neural Network (GCNN) as the multiclass classifier within our framework [56]. In fact, this architecture is intrinsically capable of learning interesting patterns in graphs that otherwise would not be detected by other kinds of classifier. To the best of our knowledge, PostGage represents the first attempt to use GCNN to perform multiclass classification of posts with respect to user engagement values. To formalise this idea, we borrowed the concept of GraphSAGE [56] and adapted it to our target context.
Let
In order to train the GCNN classifier underlying PostGage, we used the cross-entropy loss. Let
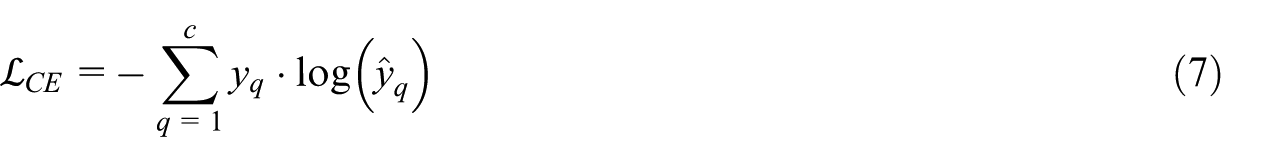
Here,
The complete workflow of our multiclass engagement classification mechanism is reported in Figure 1.
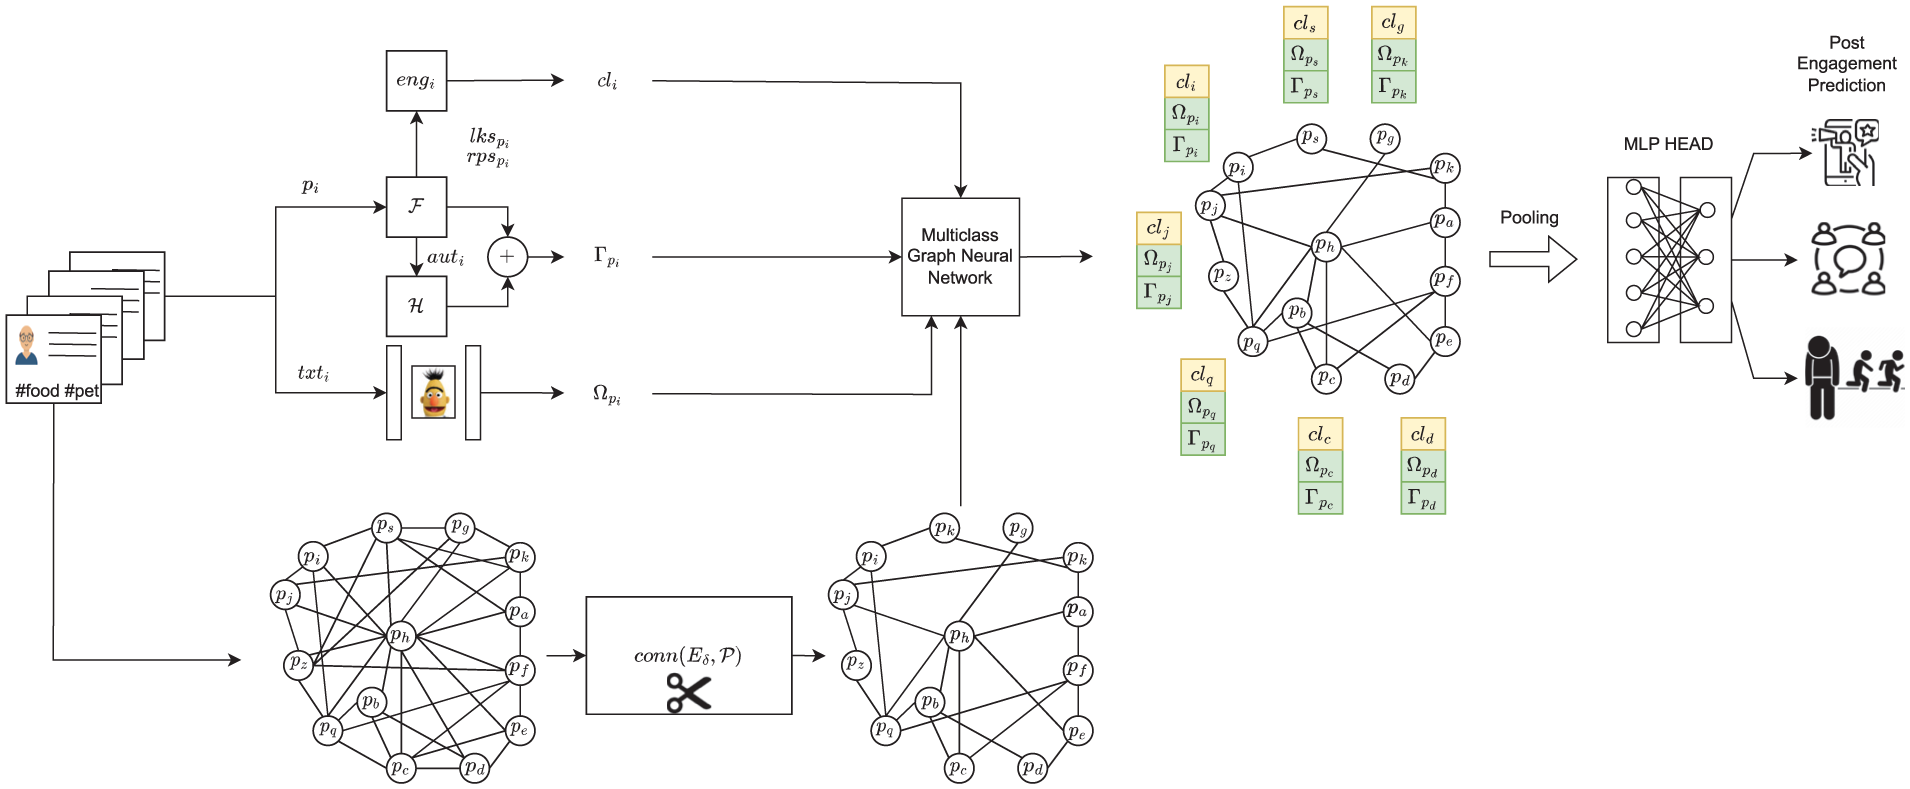
The workflow of the proposed multiclass engagement classification mechanism consisting of the following steps: (1) extraction of the features for each post
3.4. Description of PostGage behaviour
Having seen how the multiclass engagement classification mechanism underlying PostGage works, we can now describe the overall workflow of our framework. Recall that its goal is to identify the best candidate publisher on a social platform for a target content in such a way as to maximise the achievable user engagement. We have already seen that in order to achieve this goal, PostGage combines knowledge about two different aspects of engagement dynamics, namely the role of the publisher in the considered social platform and the semantic relationship of the target post with respect to other published content. In fact, while the role of the publishing user is crucial to maximise the dissemination of the target content through a social medium, the fact that this content is related to other already published ones allows a better placement in the discussion threads.
Our framework is designed for all contexts in which content needs to be disseminated (e.g. marketing campaigns, advertising, citizen information). For example, consider the case where a marketer produces content to be distributed in a social network. Of course, she or he may rely on a number of publishers (typically influencers, spin doctors, content creators, etc.) to collaborate with her or him by distributing content on her or his behalf. In such a scenario, the ultimate goal is to achieve maximum content distribution and user engagement.
An overview of the behaviour of PostGage is shown in Figure 2. As mentioned in the Introduction, our framework is general and orthogonal to most currently existing social platforms. To be used in PostGage, the only constraint a social platform must follow is to allow the extraction of the values of all features of
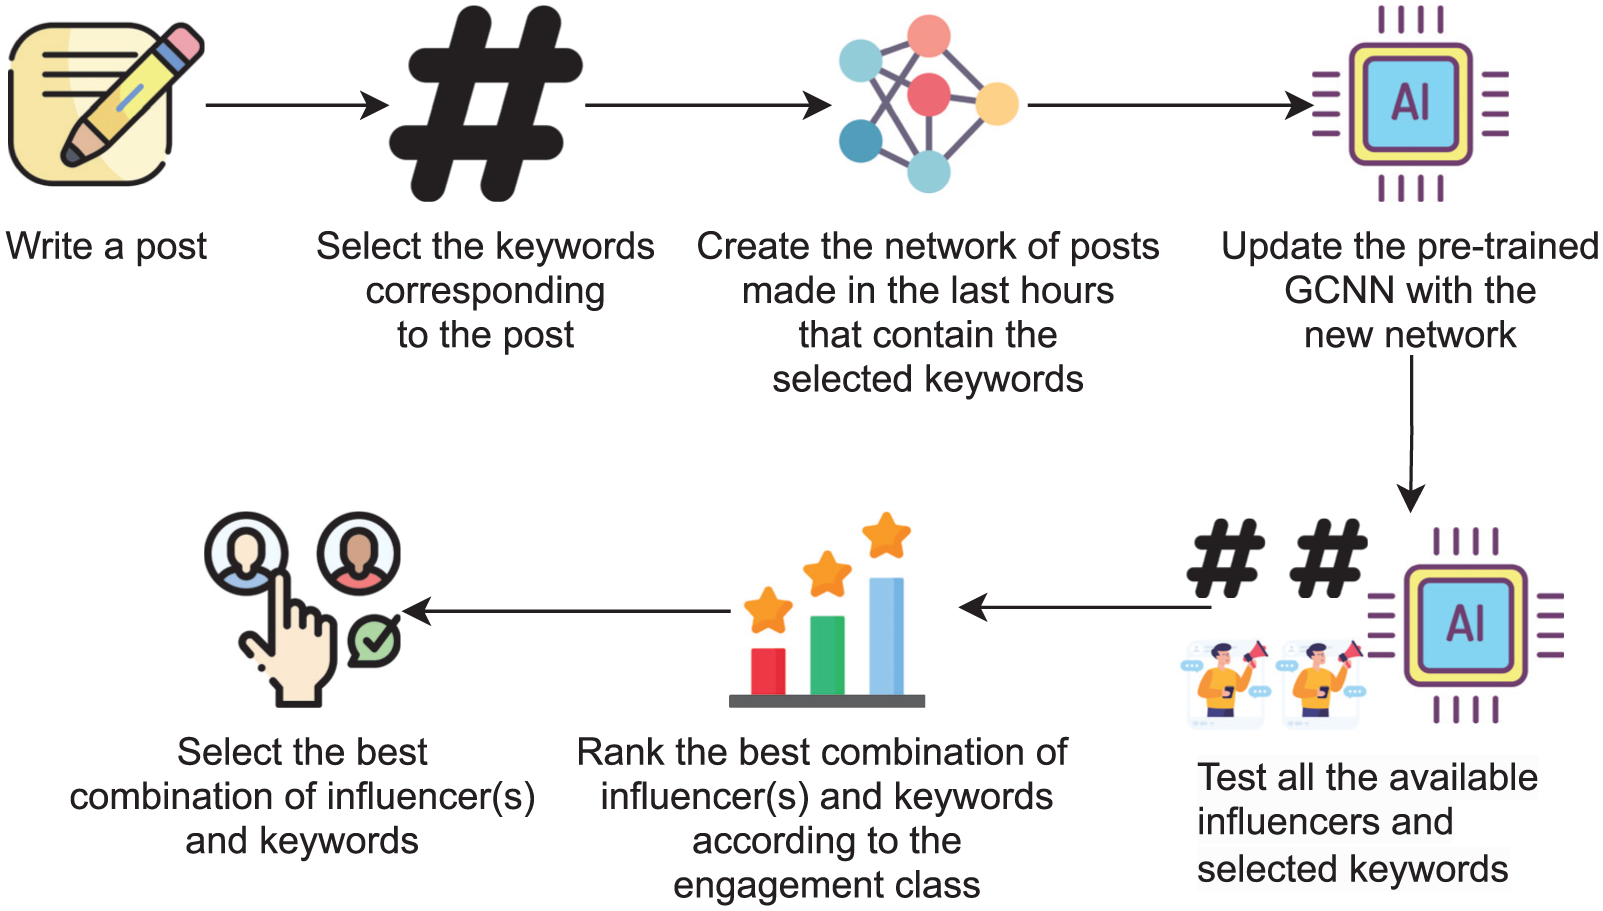
The general workflow of PostGage.
The first step described in Figure 2 occurs when a company (or government agency) wants to create a post that will hopefully receive the highest number of customer (or citizen) interactions. To achieve this goal, publishers (e.g. marketers, managers, public administrators) must first select the keywords that best define the post topics. For this task, any existing approach can be used to identify trending keywords that may be close to the post itself [57,58]. The identified keywords are then collected in a list. They will be crucial for focusing the environment in which the post will be published, as well as for identifying existing posts to consider for the prediction task. As far as the content of the post is concerned, there is no limit to the publisher’s expression. The publisher can add media, such as photos and videos, to the post to make it more appealing.
The next step is to build the network
At this point, PostGage proceeds to update the GCNN classifier by providing the updated network
The PostGage behaviour described above can be formalised as follows. Let

Here,
The underlying graph is given as input to the GCNN classifier underlying PostGage. This returns a set of pairs
Finally, we define the function
At this point, PostGage determines the set

In other words,
We conclude this section by noting that while the set of steps PostGage takes to achieve its goal may seem simple and straightforward at first glance, our framework actually uses complex data structures and algorithms in each step of its workflow. Because of this, it can solve a very tricky issue that many companies or government agencies face on a daily basis. As we have seen in the previous sections, PostGage considers many facets of a post to achieve its goal, including its text embedded by BERT, its keywords, its relationships with the text of other posts already published and the characteristics of the user who posted it.
In the next section, we will illustrate a thorough experimental campaign dedicated to validating all the steps of the PostGage strategy.
4. Experimental results
In this section, we describe the experiments we conducted to evaluate PostGage. Specifically, in Subsection 4.1, we illustrate the dataset and the corresponding network-based model. In Subsection 4.2, we highlight the correlation between centrality measures and engagement classes. In Subsection 4.3, we report the performance of our multiclass GNN-based model on our dataset, along with an analysis of the impact of
4.1. Dataset description
As mentioned in the Introduction, we focused on X as a test platform for our approach. Specifically, we used X’s streaming API and considered tweets posted during November 2021.
1
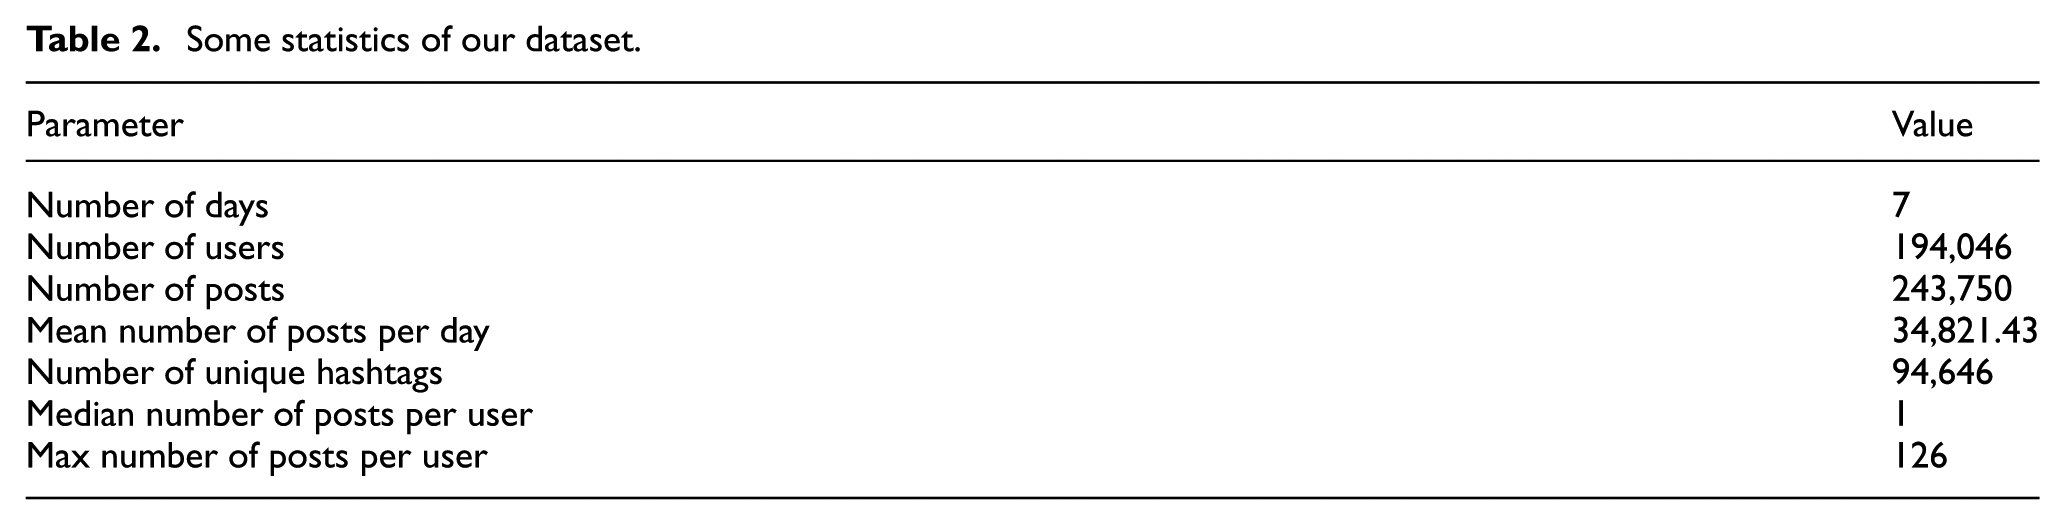
After collecting all tweets related to this period, we performed the data cleaning operations of the set
Some statistics of our dataset.
To analyse the engagement of the posts in our dataset, we computed their distribution against the values of this parameter. The results are shown in Figure 3.
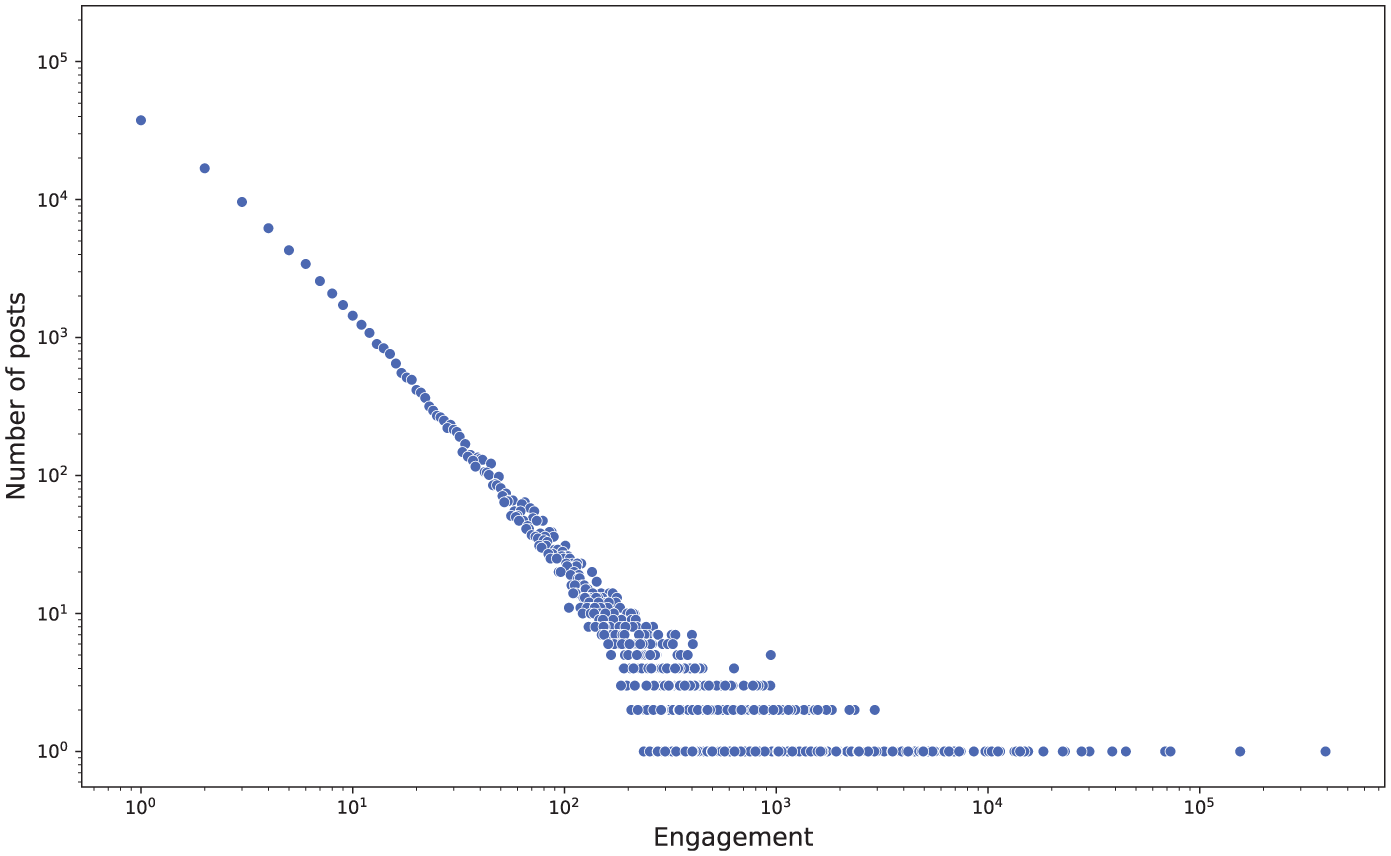
Log–log distribution of posts against engagement values.
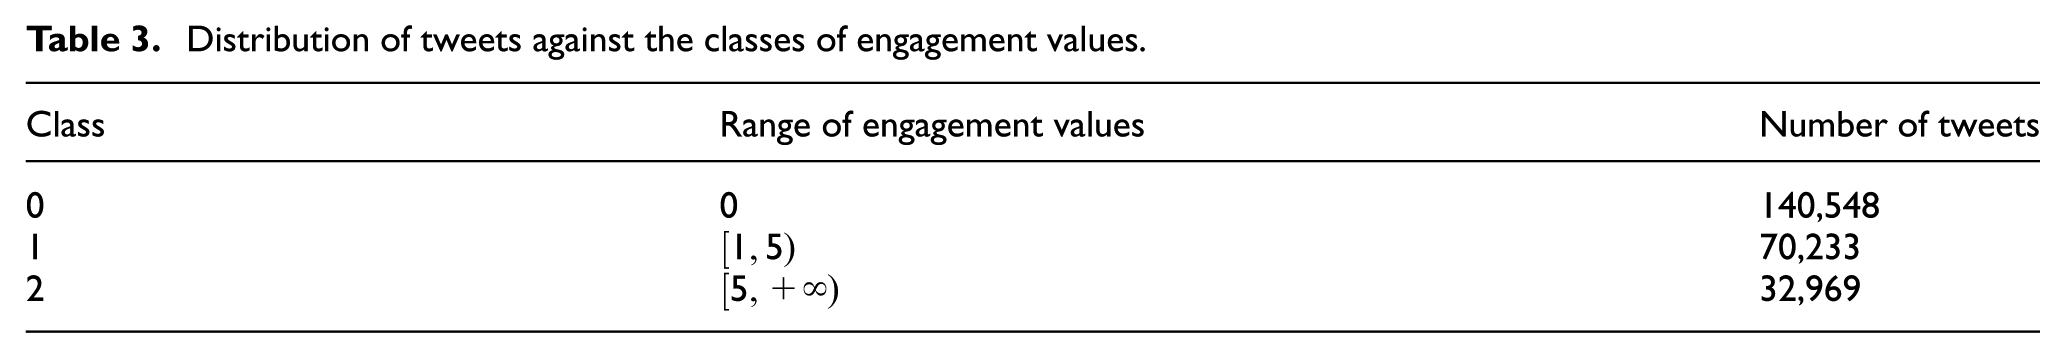
Analysing this figure, we can see that the distribution of posts against the engagement values follows a power law. Unfortunately, this distribution has a very strong impact when discretising the engagement values into three or more classes, since a balanced distribution of observations within these classes is necessary to train our solution. To this end, we tested all possible combinations of quantiles to divide the tweets into 3, 4, or 5 classes. The best option in terms of balanced distribution and model accuracy is shown in Table 3. From the analysis of this table, we can see that class 0 contains tweets with a null engagement value, that is, tweets that received no likes and no retweets. Class 1 consists of tweets with a low engagement value, while class 2 contains tweets with a medium to high engagement value.
Distribution of tweets against the classes of engagement values.
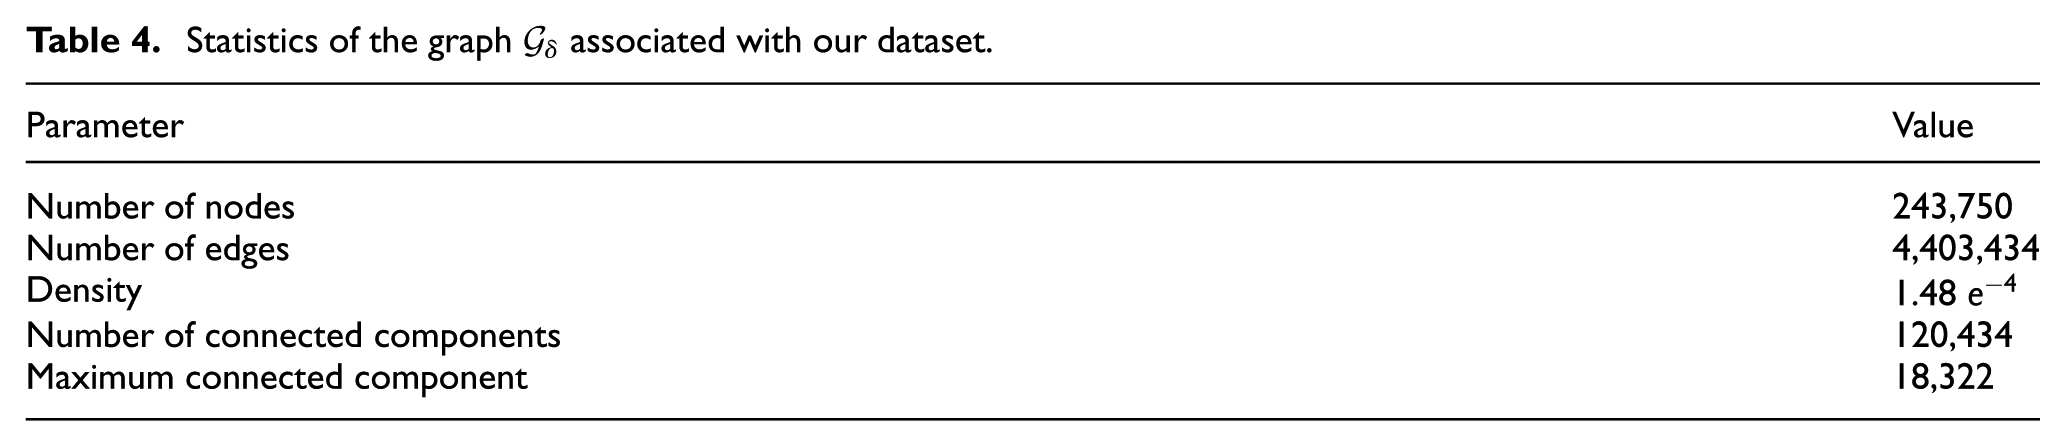
At this point, we can construct the network
Statistics of the graph
After constructing
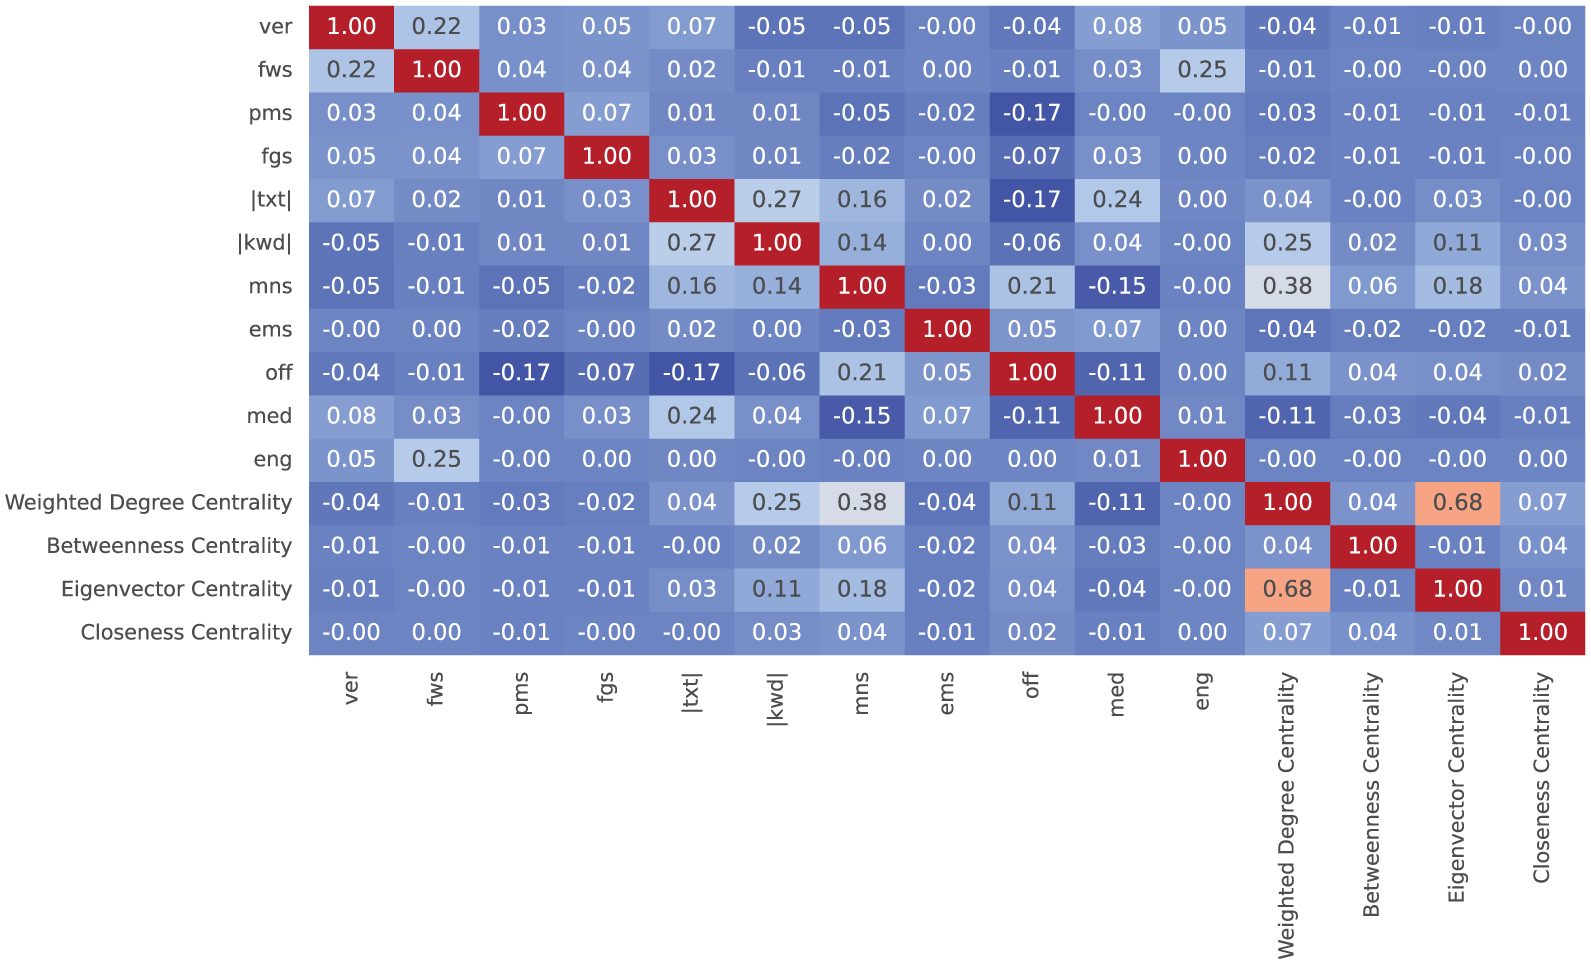
Correlation matrix between centrality measures and dataset features.
4.2. Correlation between centrality measures and engagement
In this experiment, we wanted to further investigate the correlation between Social Network Analysis centrality measures and tweet engagement classes. Recall that each centrality describes a different power exerted by nodes, such as having a high number of connections, being a crucial element in communications, or being connected to important entities.
To further investigate the relationship between tweet engagement and centrality measures, we looked at the difference in centrality between posts of different classes. For this purpose, we divided the posts by the engagement classes and computed the corresponding network centrality distribution. The results are shown in Table 5. From the analysis of this table, we can see that posts in class 0 have higher values than the other two classes for all centrality measures. Therefore, these posts are well connected in
Statistics on centrality measures for the nodes of
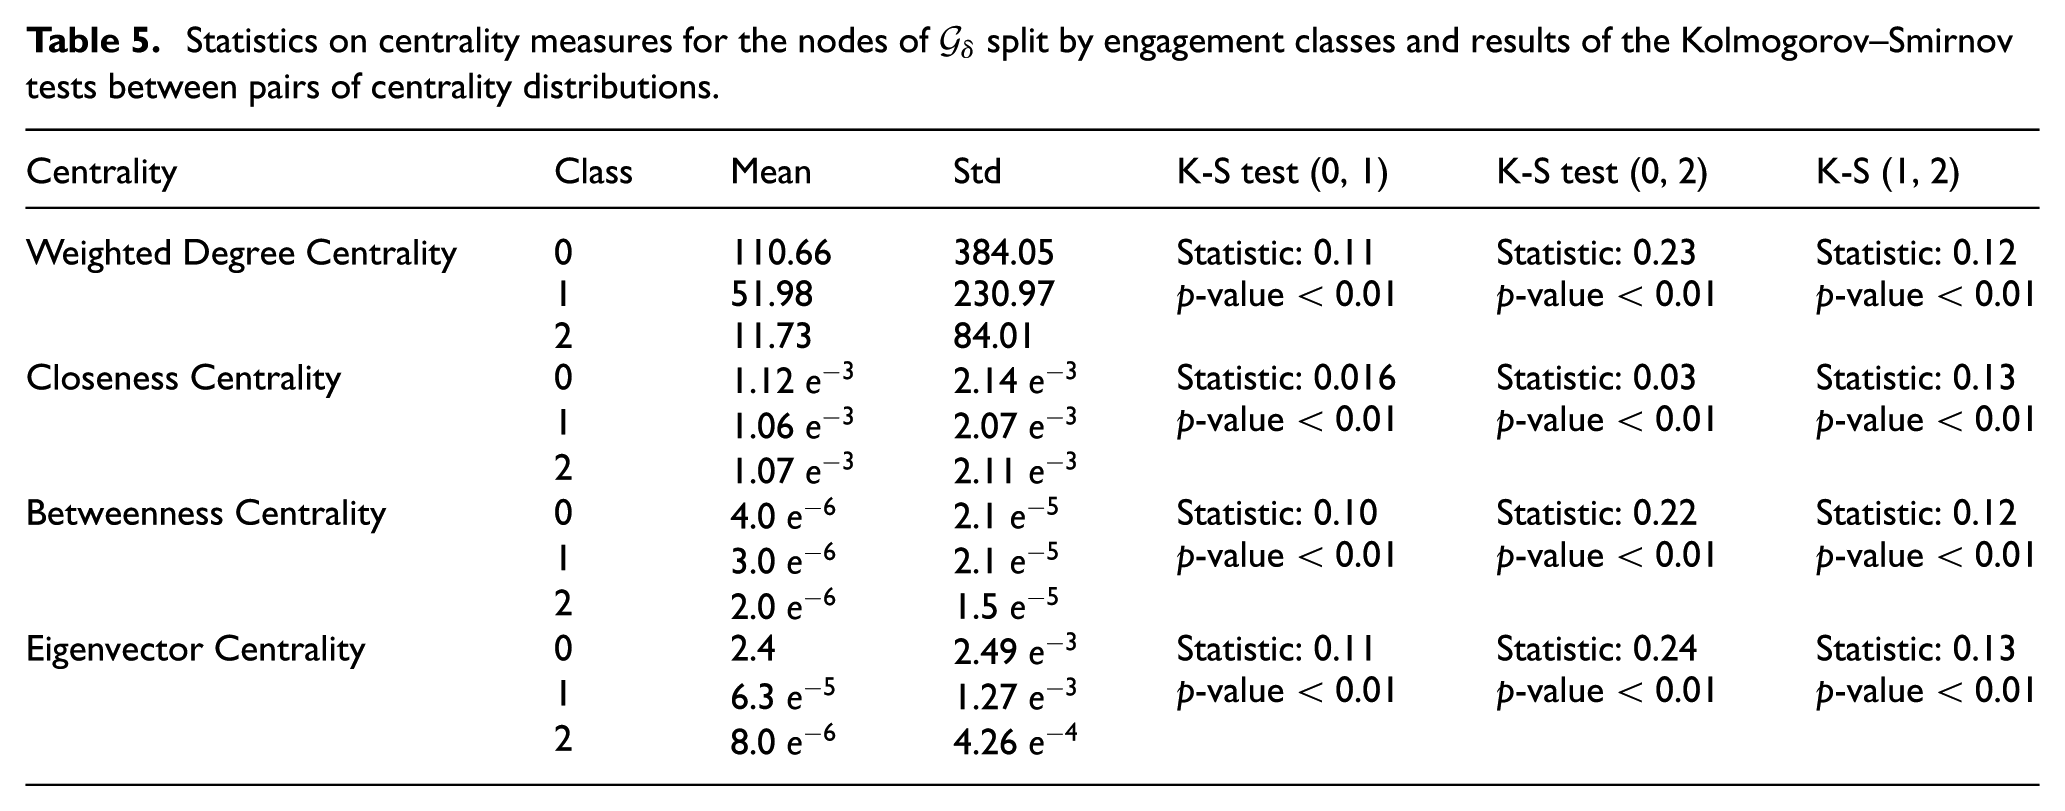
As for the closeness and betweenness centrality, we cannot observe differences in the mean and standard deviation. This can be explained by the different type of distribution that these two centrality measures follow in Social Network Analysis compared with weighted degree centrality and eigenvector centrality, which usually follow a power law distribution. Finally, the values of eigenvector centrality have a similar (though much more extreme) distribution across classes as for weighted degree centrality. In fact, the mean eigenvector centrality for class 0 is 10 times larger than that of class 1 and 100 times larger than that of class 2. In terms of the structural properties of
Finally, in Table 5, we report the results of the Kolmogorov-Smirnov (K-S, for short) test between pairs of distributions of the two classes. K-S Test (0,1) indicates the results of the test between the distributions of tweets of classes 0 and 1. A similar notation applies to K-S Test (0,2) and K-S Test (1,2). We can see that the p-value is less than 0.01 for all possible combinations of K-S Tests. This result, together with the ones seen above, allows us to conclude that the distributions of the centrality measures of the three classes are statistically different from each other, thus confirming all the conclusions we have drawn above.
4.3. Analysis of the performances of the multiclass GNN model
In this section, we report the performance analysis of our multiclass GCNN model to evaluate its ability as an engagement classifier. In this experiment, we first checked the correct number of labels against our reference dataset. For this purpose, we considered three possible configurations, each characterised by a different number of classes, namely 3, 4 and 5. An important problem to be solved is the construction of the dataset to train our classifier. In such a task, the requirement is that data should be balanced across the different classes. In the construction of our training set, we decided to avoid the use of ‘synthetic’ oversampling techniques, like SMOTE [60]. As a matter of fact, while such tools can be effective for constructing numerical balanced datasets, their application to short text datasets, such as the one considered in these experiments, can introduce important biases. Indeed, textual data contain intricate contextual, syntactic and semantic relationships that ‘synthetic’ generators cannot fully replicate. In fact, SMOTE, for instance, generates new textual data points by interpolating features derived from text embeddings. This could potentially lead to distorted meaning for the text. Because PostGage leverages just semantic relationships among posts to build an engagement predictor, the use of a synthetic generator would create unrealistic and misleading relationships, thus producing invalid insights, which can ultimately degrade its performance. The main idea behind PostGage is to model the ‘human’ trends inside an online community (through our semantic network-based data representation) to predict the expected success of a new post. Any synthetic data addition may compromise such representation, thus leading to incorrect results. For this reason, we strove to construct our training set by carefully partitioning a real-life dataset into homogeneous groups based on similar engagement patterns. Therefore, in order to identify the correct ranges for constructing our training set with respect to the target number of classes, we used the engagement distribution of the posts to define the ranges that equally divide the tweets into the target classes. To identify the best configuration, we tested our solution focusing on several performance metrics, namely Precision, Recall, F1-Score, Overall, 2 and Accuracy. To ensure a fair comparison of the various approaches in the three experimental settings (3, 4 and 5 classes), we used the same total size for both training and test sets (90,000 and 20,000 posts, respectively).
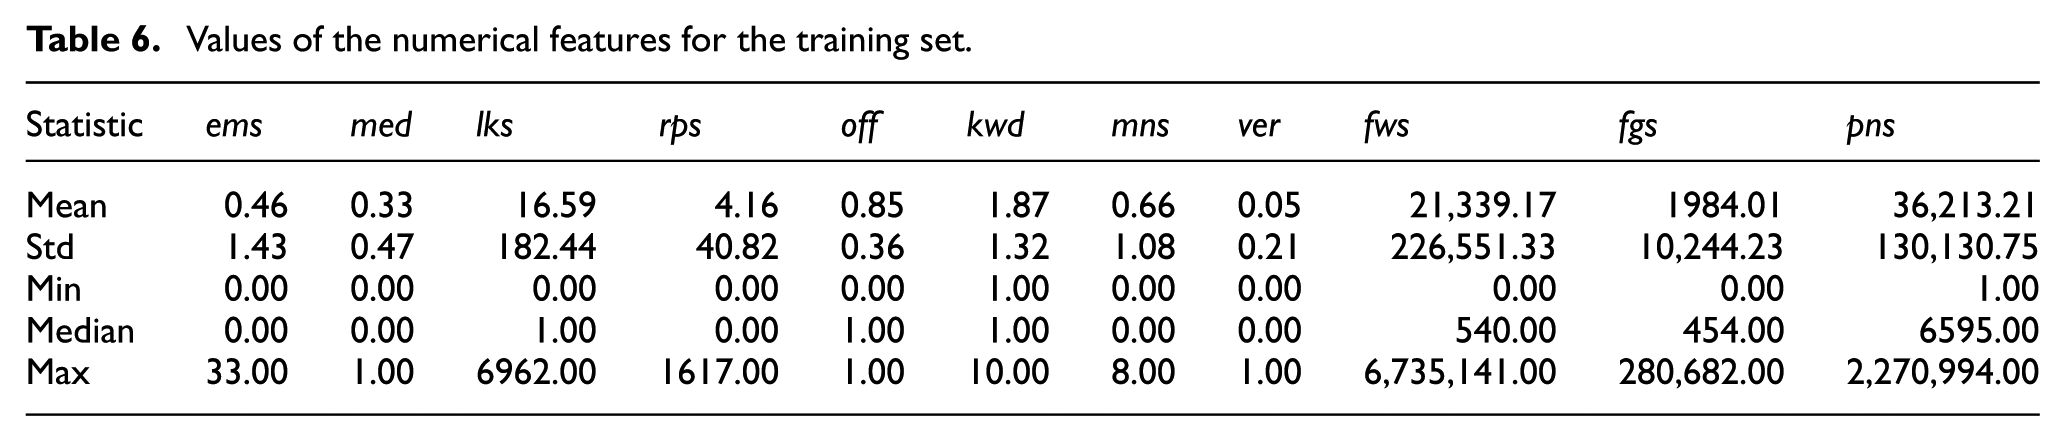
Tables 6 and 7 show the values of the numerical features introduced in Section 3.2 for the training and the test sets, respectively. These tables provide a clearer and more detailed overview of the characteristics of the two sets.
Values of the numerical features for the training set.
Values of the numerical features for the test set.
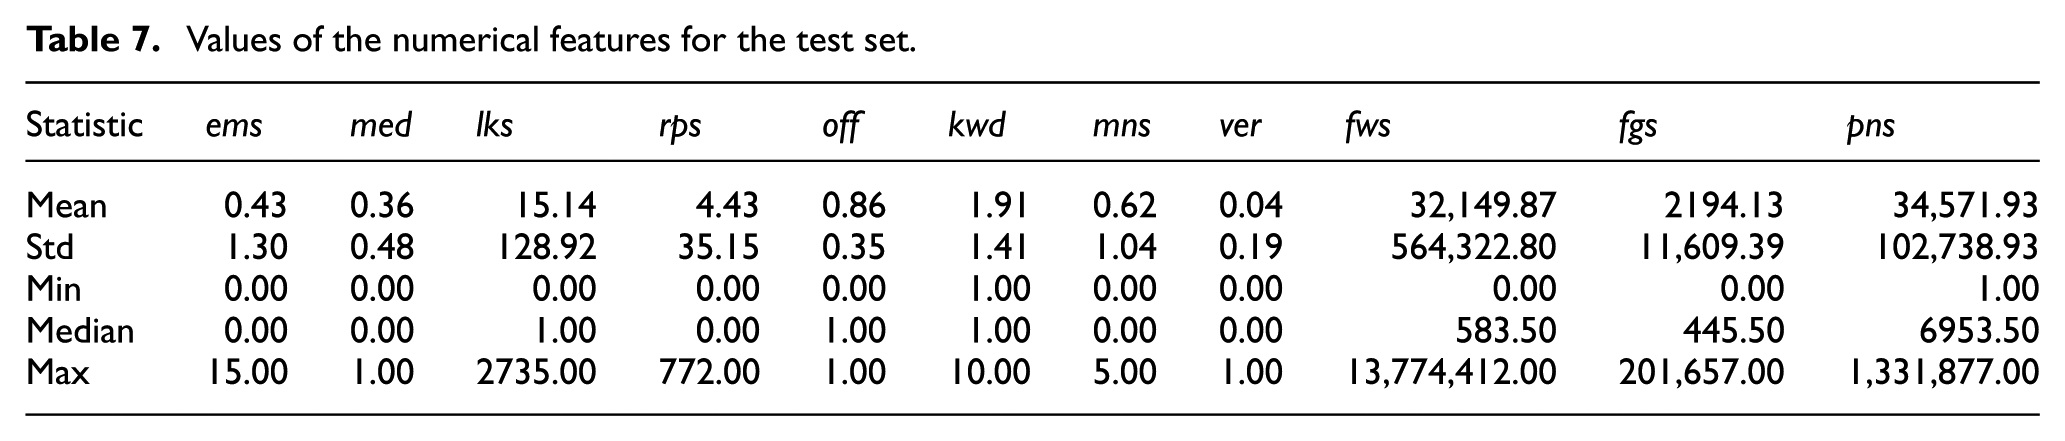
Both datasets exhibit highly skewed distributions across engagement-related parameters, such as the number
Finally, we performed balanced and stratified partitions of both training and test sets so that each class contained a similar number of posts. The results of this experiment are shown in Table 8.
Performance metrics of our multiclass GCNN classifier with different numbers of classes.
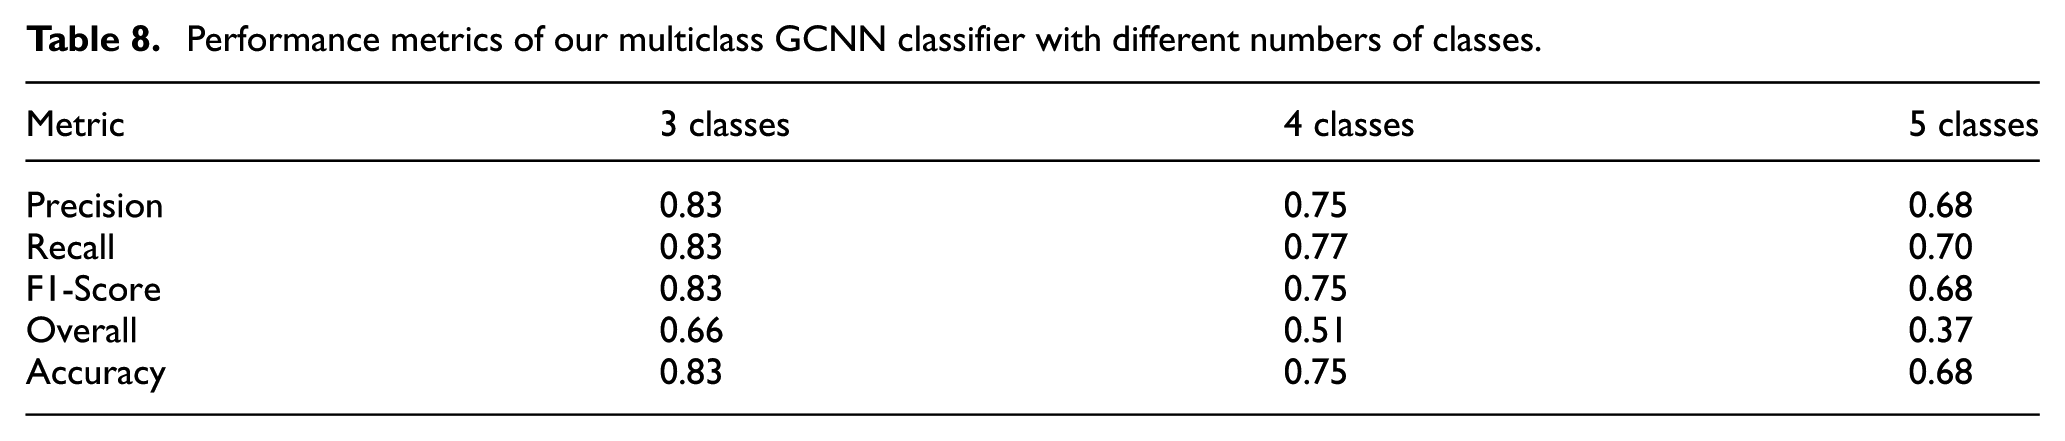
It is worth noting how the model performance decreases as the number of classes considered increases, highlighting the limitations imposed by the nature of data. The results clearly show that as the number of classes increases, the performance of the model, in terms of Precision, Recall, F1-Score and Overall decreases. This trend indicates that the model’s ability to distinguish between more classes becomes more challenging, leading to a reduction in overall performance. Because the data distribution follows a power law, our main concern was the possibility that our model might perform poorly in handling the middle classes. This was because the posts near the highest and lowest thresholds may have shared many characteristics with the posts in the other two classes.
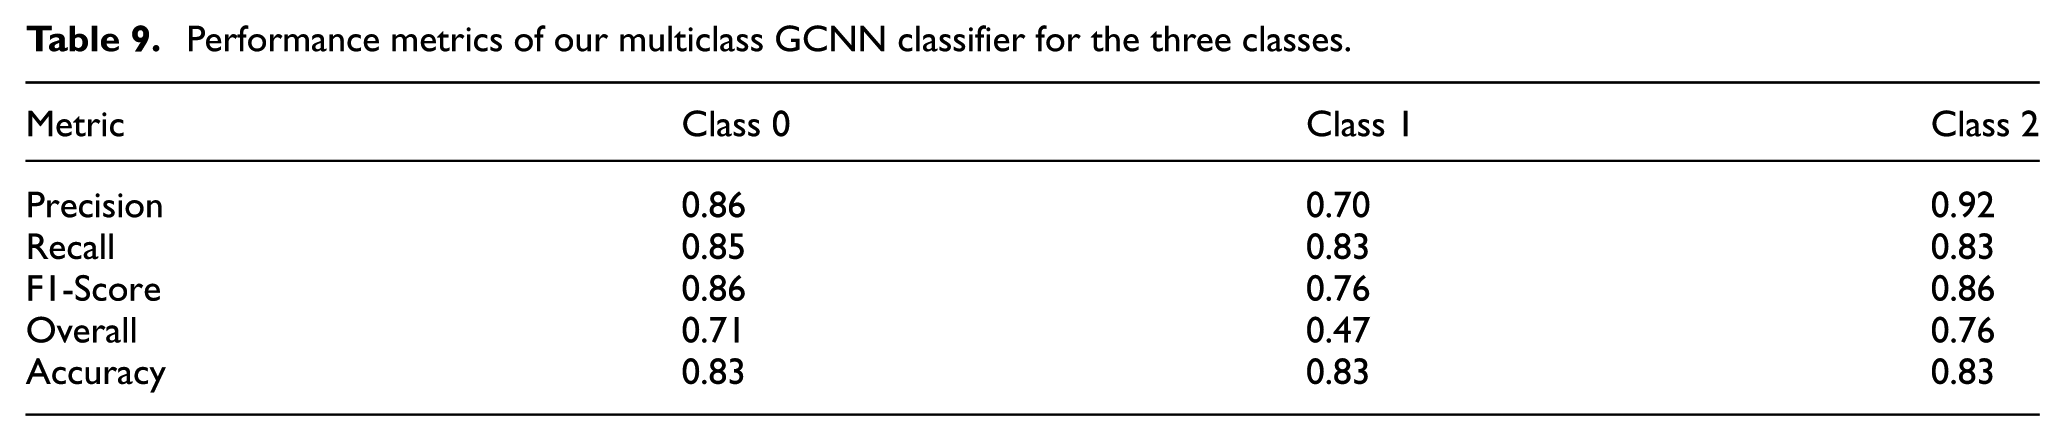
To test whether our concern was well-founded, we focused on the configuration with the best performance (i.e. the one with three classes) and computed the four performance measures separately for each of the three classes. The results are shown in Table 9. Analysing this table, we see that the classification performance for the middle class is lower than the other two classes, as expected. This is reflected in all metrics, where Precision, Recall, F1-Score and Overall show a significant decrease for the middle class. In any case, the results obtained are satisfactory. A closer inspection of Table 9 reveals that Class 1, the middle class, exhibits Recall and Accuracy values that are comparable to those of the other two classes. However, its Precision, F1-Score and Overall values are notably lower. Since F1-Score and Overall are based on Precision and Recall, the lower values of these two measures for Class 1 depend on the Precision values for this class. In our scenario, Precision denotes the number of Class 1 posts that were correctly classified as Class 1. A Precision value of 0.70 for this class implies that 30% of the posts the classifier assigned to Class 1 actually belong to Class 0 (characterised by low engagement values) or Class 2 (characterised by high engagement values). This high percentage of misclassified posts is explained by the steep power law distribution of posts against engagement values (see Figure 3). This problem affects the intermediate class more than the other two classes because it is subject to shifts to both the higher class and the lower one (see the confusion matrix illustrated in Figure 5). Examining the characteristics of the data points belonging to Class 1 in more detail reveals two key patterns for a small percentage of these posts. In fact, some posts have values similar to the values of the Class 0 posts for most features but higher values for some features, which causes them to not belong to Class 0 and be assigned to Class 1. So, it could happen that posts in Class 0 with low values for almost all features and slightly higher values for some features (though not enough to move them to Class 1 in reality) are incorrectly assigned to Class 1 by the multiclass GCNN classifier. Conversely, some Class 1 posts have values similar to Class 2 posts for most features, but lower values for some features, which prevents them belonging to Class 2. So, it could happen that Class 2 posts with high values for almost all features and slightly lower values for some features (but not low enough to move them to Class 1 in reality) are incorrectly assigned to Class 1 by the multiclass GCNN classifier. However, since this overlap affects only a small fraction of the data points, our classifier can still achieve very good overall Accuracy.
Performance metrics of our multiclass GCNN classifier for the three classes.
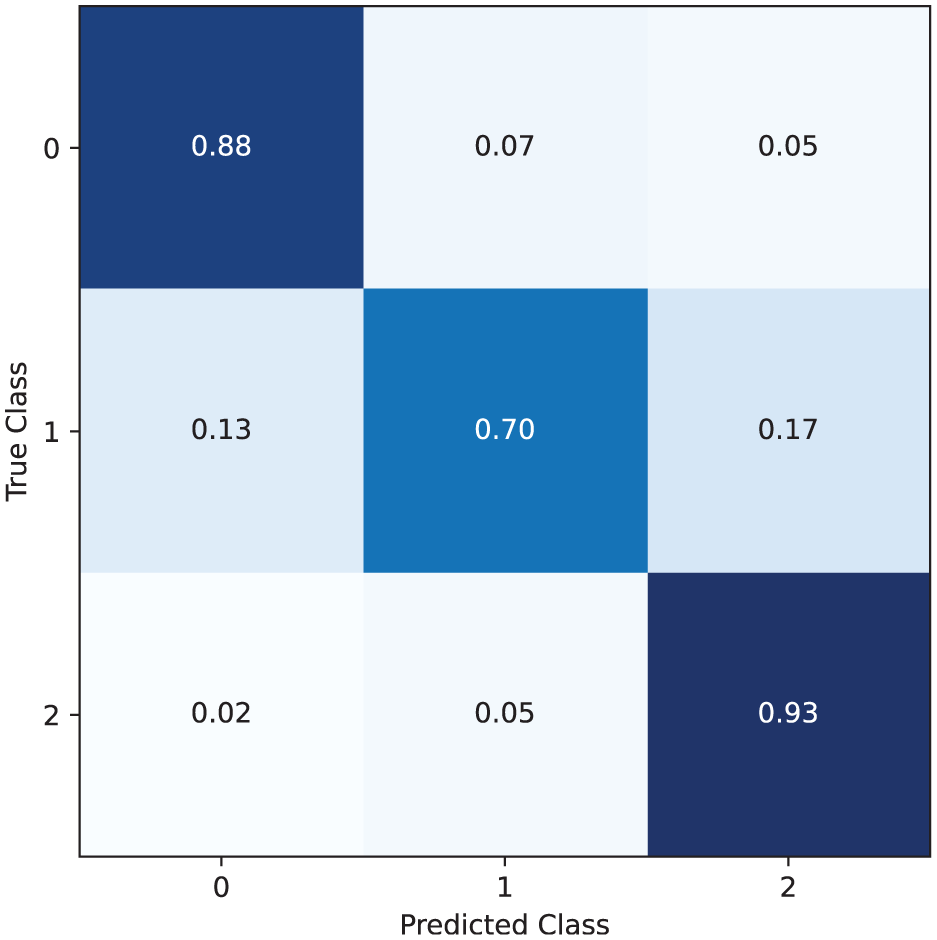
Confusion matrix of our multiclass GCNN classifier.
The high performance of our prediction task is also a strong indicator that our claims expressed in Hypotheses HP.1 and HP.3 are well-founded. In fact, our prediction task is strongly correlated with the characteristics of the network
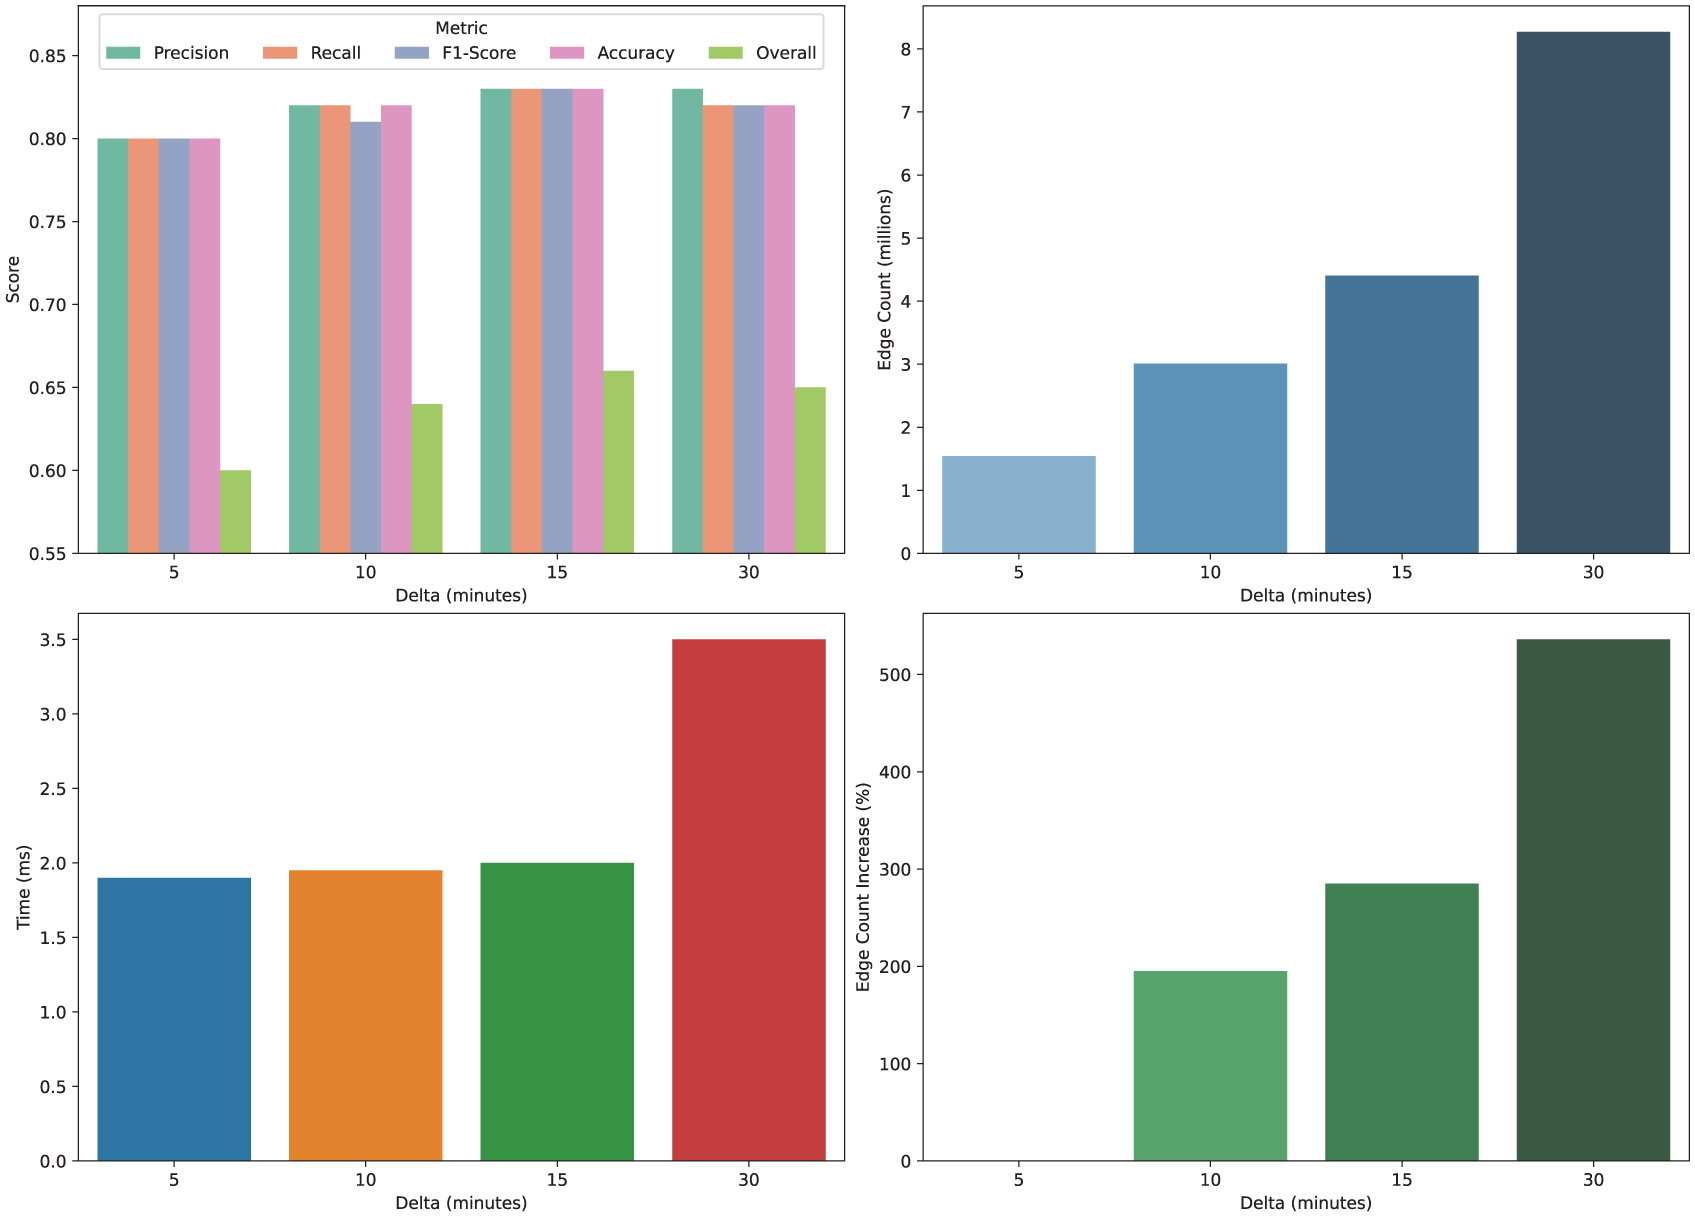
As mentioned in Section 3.2, in order to control the size of the post network so that it contains only meaningful and recent connections, PostGage uses an ageing mechanism configured by a time threshold
Performance metrics of our multiclass GCNN with different values of
For scalability purposes, in addition to performance metrics, another crucial parameter to consider is the size of the graph in terms of the number of edges. This size not only impacts the inference time of PostGage but also defines the characteristics of the computational architecture required for training (e.g. GPU RAM, processor count and characteristics, system RAM). It is worth pointing out that n-ary classifiers, obtained by combining the results of several binary classifiers, despite their potential, are not feasible for real-time predictions due to the high cost of loading the graph multiple times, which can make inference time prohibitively long. Since the main application of PostGage is its integration into a recommender system, both inference time and hardware requirements are vital aspects to consider. As shown in Figure 6, our decision to set the threshold
Concerning the inference time, we tested our model on a system equipped with a single GPU, namely a Tesla t4 with
As a final test, we measured the inference time of the optimal configuration (i.e. the one with
4.4. Comparison with related approaches
PostGage is one of the very few approaches that address multinomial engagement prediction. This limits the possibility of a direct comparison with previous works pursuing the same objective. However, some methods, such as those proposed in [20,52], focus on binary engagement prediction, a task that is closely related to the one addressed by PostGage. Therefore, we trained and tested these models on our dataset in a binary setting. In particular, the models taken into consideration are the following:
BERT FT, a BERT model fine-tuned on the post corpus;
MLP, a Multilayer Perceptron with two layers and 32 hidden neurons;
CNN, a Convolutional Neural Network featuring a one-dimensional convolution layer followed by a fully connected classifier;
XGBoost, the model that won the
Since we had to evaluate a binary engagement prediction task, for PostGage we considered the average performance for Classes 0 and 2, representing low and high engagement.
In order to enable a fair comparison in the multiclass engagement prediction scenario, we adapted a set of state-of-the-art approaches to our task. These approaches are:
Temporal Graph Convolutional Network (TGCN) [61], which integrates Graph Convolutional Networks with Gated Recurrent Units to capture both spatial and temporal dependencies.
Temporal Graph Attention Network (TGAT) [62], which aggregates temporal-topological neighbourhood features and models time–feature interactions through attention mechanisms.
Temporal Graph Networks (TGN) [63], which is a general and efficient framework for deep learning on dynamic graphs represented as sequences of temporal events.
Heterogeneous Graph Transformer (HGT) [64], which models heterogeneity using node- and edge-type dependent parameters to compute attention across different edge types.
Knowledge-Enhanced Graph Neural Network (KEGNN) [47], which leverages external textual knowledge within a GNN-based architecture to capture temporal and structural patterns in user dynamics, thereby improving engagement prediction.
Graph Neural Network with Attention Mechanism for Customer Engagement Prediction (GACE) [48], which captures user–content interactions in brand-related social media posts.
To compare the aforementioned systems with PostGage, we had to consider two scenarios since some of the above systems were temporal and others were heterogeneous. The temporal systems differed from each other in the way they handled time. In fact, TGCN integrates temporal gating through recurrent units; TGAT uses attention on temporal neighbours; TGN maintains a dynamic memory state to model evolving dependencies. For all these systems, we reorganised the dataset as a stream of events. Specifically, we modelled each post as an event timestamped at publication time and connected to other posts that shared at least one hashtag (temporal co-hashtag edges) within a sliding window of 15 min, which is the same as in PostGage. We used the same post features as PostGage (i.e. textual/content embeddings and the same auxiliary attributes) to ensure a fair comparison.
Instead, for heterogeneous systems we extended our graph with explicit user and hashtag nodes to capture the authoring and semantic context. Moreover, we added user-post (‘user writes post’) and post-hashtag (‘post contains hashtag’) relationships. We mapped all types of categorical nodes into 64-dimensional dense embeddings. For KEGNN, we added a knowledge enhancement gate, which fuses post embeddings with aggregated representations of neighbouring entities. This gating mechanism is implemented as a learnable sigmoid function that dynamically controls the contribution of external knowledge to post representation.
We trained all the above systems to address a three-class engagement classification task using a softmax output and cross-entropy loss. Hence, they generated a multiclass engagement prediction with three classes (‘low’, ‘medium’ and ‘high’). To ensure comparability, we used the same settings (i.e. two message-passing layers, hidden layer size of 64 neurons, Adam optimizer with a learning rate of
Performance metrics of PostGage and some related approaches in an engagement prediction task.
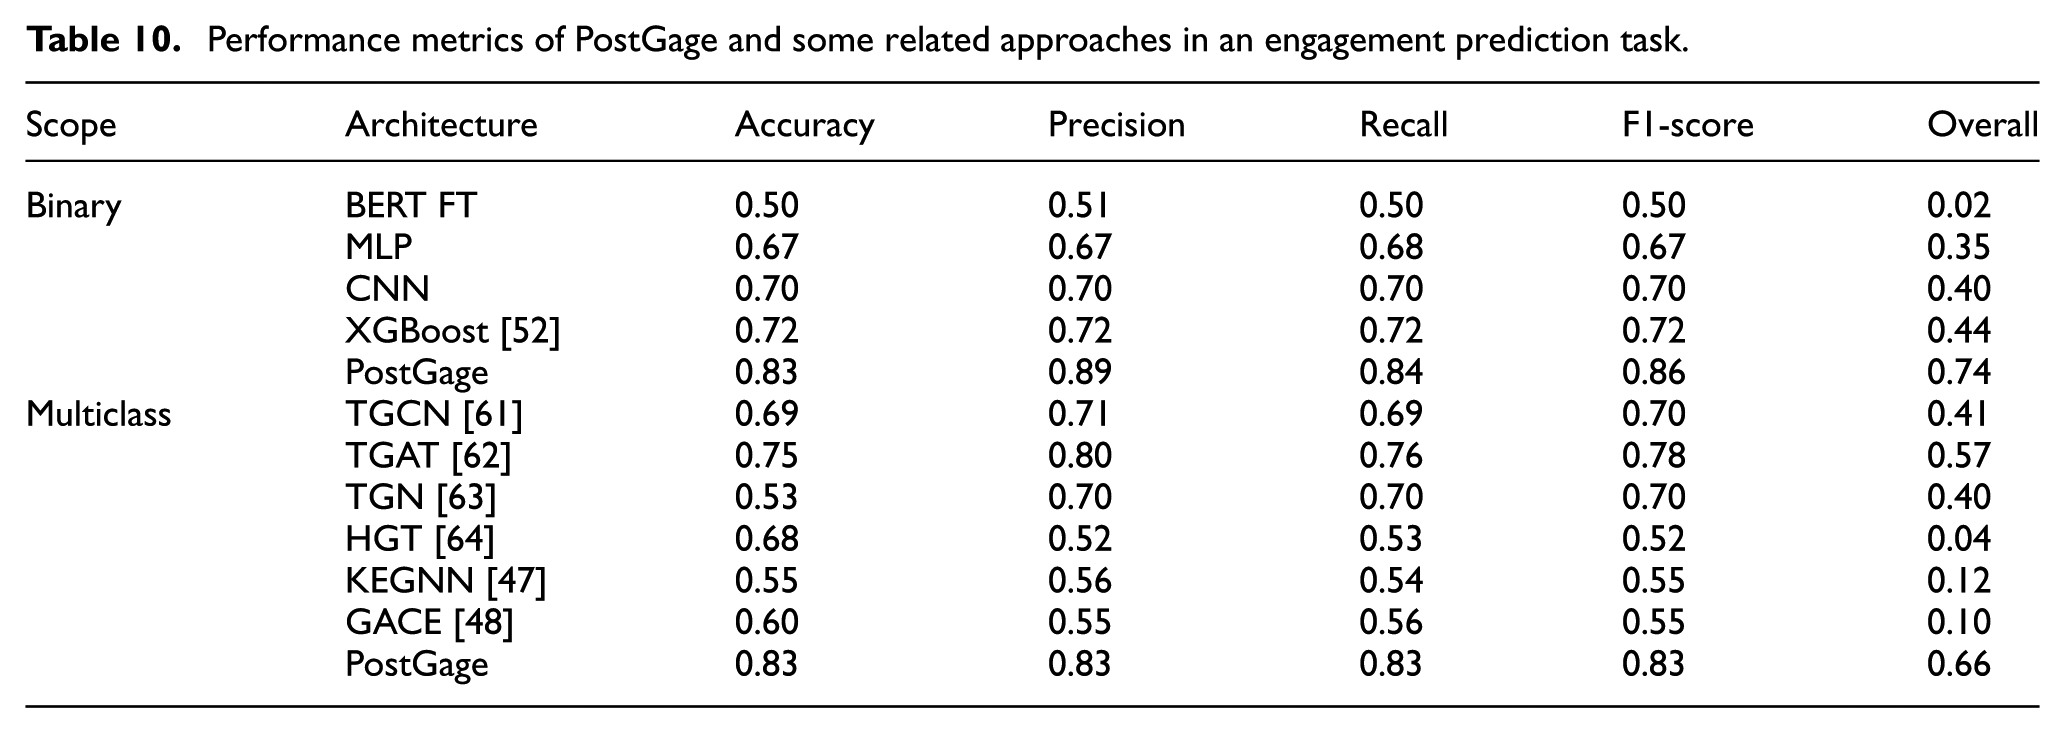
The analysis of this table shows that, for the binary engagement prediction task, Machine Learning and Deep Learning based approaches (MLP, CNN, XGBoost) achieve Accuracy values between 0.67 and 0.72. Fine-tuned BERT performs close to random. In contrast, PostGage reaches an Accuracy value of 0.83, outperforming all binary baselines. This confirms that graph-based semantic representations capture relationships between posts that purely textual or tabular models fail to exploit. For the multiclass engagement prediction task, temporal models (TGCN, TGAT, TGN) and heterogeneous models (HGT, KEGNN, GACE) achieve Accuracy values ranging from 0.53 to 0.75. In contrast, PostGage achieves an Accuracy value of 0.83, confirming its suitability in this challenging scenario.
4.5. Analysis of the performance of our system
In this section, we evaluate the performance and effectiveness of PostGage in a specific example scenario. However, we emphasise that our engagement prediction framework is generic enough to be used in many other settings.
Suppose a company marketer needs to write a tweet to promote a product. She or he has written the text and selected hashtags, and now needs to select a publisher to post the tweet. A marketer usually has a number of people who can sponsor the company’s products. However, she or he does not know who is the best person to sponsor this product at this time. She or he can use PostGage, along with her or his expertise, to identify the best influencer who can post this tweet.
In Section 3.4, we saw that the performance of the GCNN underlying PostGage is very promising, as it achieves an Accuracy of 0.83 and a Precision for class 2 (which includes high engagement tweets) of 0.92. The latter result indicates that our framework is able to correctly classify tweets with high user engagement. High Accuracy is critical for the marketer because, once a tweet is classified as class 2, it has a very high probability of achieving good engagement. This also means that the combination of text and hashtags it contains, as well as the influencer who posted it, is good for generating online reactions.
Suppose a marketer needs to select an influencer from a set of known people who are possible candidates to publish the target tweet. We assume that the publishers available to the marketer have similar characteristics in terms of followers, followings and overall activity. In fact, if one of the candidates has outstanding statistics compared with the others, the choice would obviously fall on her or him. In order to create a real-world context for our experiment, we proceeded as follows. From our test set of tweets, we selected only those belonging to class 2 and derived the corresponding influencers. For each of them, we computed an index describing their popularity in a social network [65]. For this purpose, we decided to use the FollowerRank metric [66]. The FollowerRank of a user is defined as the ratio between the number of followers and the sum of the number of followers and the number of followings. This metric is effective and addresses the situation where users have many friends whom they follow and who, in turn, follow them back, which could mean that they are not primarily followed for the quality of their tweets. This feature of FollowerRank allowed us to identify a homogeneous set of influencers in terms of their popularity.
We then noticed that this set still had a skewed distribution of the number of tweets posted. This is not consistent with our assumption that the candidate set of users should have similar popularity. To respect this assumption, we selected only those users who had a similar number of tweets posted among the popular users according to FollowerRank. Having done that, we considered the resulting set as
To obtain a ground truth, from the original set of tweets posted by the influencers of
We repeated this experiment for different values of FollowerRank. Interestingly, we obtained similar results for each range of these values we considered. Therefore, due to space limitations, we only report the results obtained for some of them, namely
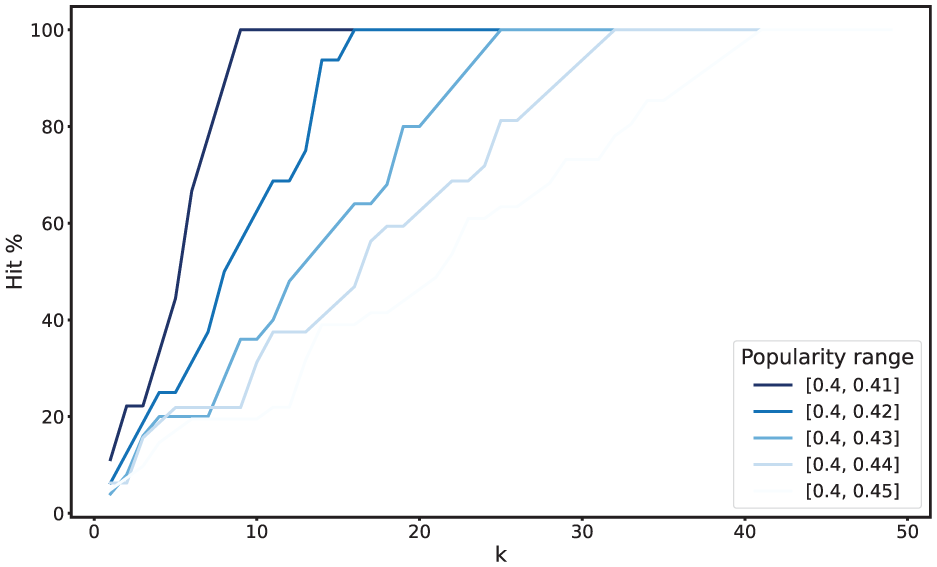
Percentage of hits against the cardinality of
In Figure 8, we show the trend of the computation time against the sample size. The computation time reported in this figure corresponds to the time required to associate posts with the set of users considered, including updating the underlying graph

Computation time against sample size.
5. Discussion
In this section, we present a discussion of the main results obtained with PostGage during the experiments. They will allow us to draw a picture of the phenomenon of post engagement, highlight the strengths of PostGage and test whether the hypotheses we made when defining our system were true. We will also examine the limitations of PostGage. Finally, we will outline some possible future developments related to our system and this research topic in general.
The first result we found during the experiments is the one shown in Figure 3, which indicates that the distribution of posts against engagement values follows a power law. This means that many tweets generated little interest and therefore very few likes and retweets, while very few tweets generated a lot of interest. This result is not surprising; in fact, it is consistent with what generally happens in the context of social media, where most phenomena exhibit a power law distribution.
The second result is highlighted in Figure 4 and concerns the lack of correlation between engagement and the four classical measures of centrality in Social Network Analysis. This result is the foundation of our paper, as it indicates that the classical centrality measures are not able to explain the underlying dynamics of post engagement, thus justifying the search for a new approach able to quantify this phenomenon, which is one of the main objectives of our paper.
The third result can be deduced by analysing Table 5, in which we can see that tweets belonging to class 0 (and thus tweets with no engagement) have many more arcs with higher weights. This implies that tweets with no engagement tend to be connected to many other tweets. Given our definition of the network
The fourth result can be deduced by analysing Figure 6. In fact, it shows us that the optimal value of
The last result relates to a specific case study, but one of the most important in the context of post engagement. Specifically, it involves the posting of tweets to promote a product. The ultimate goal was to understand whether PostGage was able to recognise the original influencer who posted the tweet. Indeed, as explained in Section 4.5, the ability to do so provides very strong evidence that our framework is adequate as a tool to support maximising achievable engagement. The results of these experiments are shown in Figures 7 and 8. The analysis of Figure 7 tells us that PostGage can easily identify the influencer who actually posted the tweet, and is therefore very effective at maximising achievable engagement. Figure 8 tells us that PostGage is not only effective, but also efficient, since even considering case studies that stress the system far beyond what happens in practice, its computation times are very low (just over 1 s for 10,000 inferences) and fully compatible with those of a system operating in real time.
It is worth noting that the set of results from the experiments also represents a confirmation of the hypotheses behind PostGage that we expressed in Section 3. In particular, recall that the hypotheses were: (1) HP.1: the probability that a post will have a high engagement level depends on its textual content (i.e. its topics) and how it relates to the content of other previously published posts; (2) HP.2: the engagement level of a post is related to the originality of its content (i.e. we expect posts that discuss original content, thereby creating new discussion threads, to be more likely to generate high engagement); and (3) HP.3: Relationships between posts are more meaningful if their publication events occurred within a limited time span. The high classification performance of PostGage indicates that this framework and the underlying model are well suited for the task for which they were designed. We recall that in the PostGage’s model there is an edge between two nodes only if the corresponding posts have similar content. Based on these considerations, we have derived an indicator of the correctness of the hypothesis HP.1 (see Section 4.3). The high performance of PostGage and the fact that in the underlying model there is an edge between two nodes only if the associated posts are published within a short time interval, are indicators of the correctness of the hypothesis HP.3 (see Section 4.3). Another indicator of the correctness of the same hypothesis is the existence of an optimal maximum acceptable time interval between two posts for the existence of an edge linking the corresponding nodes. In fact, we found that this interval is 15 min, whereas shorter and longer intervals lead to a decrease in performance (see Section 4.3 again). Finally, the substantially lower values of weighted degree and eigenvector centralities obtained for nodes associated with highly engaging posts are an indicator that these posts present original content not recently published in other posts (see Section 4.2).
The results obtained so far and their ability to fulfil the hypotheses underlying PostGage are the strengths of our system. However, it also has some weaknesses, which at the same time become challenges for possible future improvements.
The main limitation of PostGage is the need to define intervals for grouping posts into classes. In the best case, this problem should be interpreted as a regression instead of a classification, in order to get a finer prediction of the potential engagement. As we have shown in Figure 3, the retrieved dataset was highly unbalanced towards posts without engagement, making it difficult to define a solution that was robust to the high bias of our dataset. As mentioned in Section 4.1, this dataset imbalance is not an isolated case. It is well known that most social network phenomena follow this type of distribution [67]. Determining the optimal number of classes and their boundaries requires a costly data preparation task. In particular, in our case study it required testing all possible quantile combinations. Despite its computational cost, this procedure can be applied in any setting and thus does not hinder the generalisability of PostGage. However, the associated time consumption may influence its overall performance, particularly during model tuning. It is important to note, however, that this tuning is not always necessary, but only when using PostGage for the first time (pre-processing) and possibly periodically thereafter, if the distribution of user engagement varies quickly. In practice, factors influencing user engagement vary slowly compared with post publication dynamics, so we can assume that the data preparation task is rarely necessary. Furthermore, while this task may impact the performance of the (rare) PostGage tuning activities, it does not impact the PostGage performance at runtime. Therefore, the ability to perform the data preparation task in any application scenario, coupled with the rarity with which this is necessary, does not limit the range of application environments in which PostGage can be used.
Another limitation of PostGage concerns the lack of analysis of images or videos attached to posts. In fact, in almost all social networks, users can add media content to their posts that could contain additional information to predict engagement. Taking this content into account can help achieve more accurate results in engagement prediction. This limitation could affect PostGage’s accuracy if images or videos are necessary to convey a piece of content, rather than merely complementing the post’s text. From a technical standpoint, however, this does not impact the generalisability of PostGage since there are already approaches that associate a textual description with a non-textual object. The difficulty lies in identifying the best approach for a given application scenario. In this regard, we would like to point out that images and videos often have keywords associated with their content. In this case, PostGage could use these keywords in its analysis. If keywords are absent, one of the already existing computer vision systems capable of generating a textual description of an image or video could be employed. While this solves the accuracy problem, it leads to a deterioration in PostGage’s response time at runtime, which could be not acceptable in some application contexts. Therefore, depending on the application scenario and the extent to which images and videos are used in the posts, a trade-off must be found between response time and result accuracy. This trade-off varies from case to case. In some circumstances, it will be necessary to carry out tests during the pre-processing phase to identify the best solution.
We would like to conclude this section by highlighting a number of possible future developments. In fact, while PostGage is the end point of a number of researches we have conducted in this area, it is also the starting point for further researches. These are aimed both at overcoming the limitations we have identified in PostGage and at extending it in various directions. For instance, to find a solution to the problem of unbalanced dataset, it might be possible to simulate a balanced dataset by oversampling the minority classes. However, this possible solution opens to the difficulty of simulating a realistic dataset, especially in terms of generating the texts of posts. Since PostGage is highly dependent on the content and style of the text of posts and the connection between the posts obtained from the hashtags in their corpus, it would be very challenging to realise a simulator capable of producing realistic posts. Furthermore, we plan to extend our graph-based model by moving from a single-mode model to a multi-mode one. In this new model, there could be more categories of nodes (e.g. nodes associated with authors and nodes associated with posts) and/or more types of relationships between nodes. Such a rich model could allow us to further improve current engagement prediction and/or better classify a user’s engagement level. In addition, PostGage could be extended to fully handle multimedia posts, such as tweets containing images or videos. To do this, we could use computer vision techniques to extract new features from these media and see if they can improve classification accuracy and engagement level. Last but not least, we could extend our data model and our prediction approach so that, given a user, it can identify the best content to recommend to her or him based on the probability that it will be a high engagement content for her or him and its affinity to her or his interests.
6. Conclusion
In this article, we proposed PostGage, a framework to support the identification of the best influencers for a target content, that is, those publishers who enable it to achieve high engagement in social media.
In defining PostGage, we addressed several research challenges. First, we introduced a new way of looking at engagement prediction problem in the literature. Specifically, we moved from a binary to a multiclass formulation, where we identify different levels of engagement that can be generated by published content. In addition, we used semantic relationships between posts to include information about the placement of the target post in specific discussion threads. To this end, we introduced an enhanced network-based model that represents posts and their relationships, and includes information about the underlying network of users. To build the classifier in PostGage, we used a GNN-based model to deal natively with our network-based model.
To validate our proposal, we used a X dataset and conducted a careful experimental campaign. Our original idea of taking into account the semantic relationships between posts allowed us to obtain very satisfactory results. The tests carried out on PostGage as a whole confirmed its effectiveness as a support tool for maximising the engagement that can be achieved by a post in social media. In particular, PostGage was able to achieve 92% Precision in predicting high engagement posts. Such capability of our system could help the development of frameworks for content diffusion. In fact, identifying optimal publishers for a post could ensure the highest dissemination of it within the target social platforms.
Footnotes
Declaration of conflicting interests
The authors declared no potential conflicts of interest with respect to the research, authorship and/or publication of this article.
Funding
The authors received no financial support for the research, authorship and/or publication of this article.