
Abstract
Given the growing importance of academic search engine optimization (A-SEO) in enhancing research visibility, it is critical to understand how different SEO analytics tools impact quantitative research findings. This study compares four leading SEO analytics tools – Ahrefs, SEMrush, Serpstat, and Ubersuggest – using data from two well-known academic open-access mega publishers (MDPI and Frontiers) to assess the similarities of the web metrics provided, specifically organic keyword counts, keyword search volumes, and URL-based web traffic. Results show significant variation in the data, with a low overlap in organic keywords and URL-based web traffic across tools, suggesting that tool selection significantly determines findings. The study also highlights methodological challenges when comparing SEO tools, most notably differences in filtering procedures that jeopardize a rigorous comparison of tools. This work provides valuable insights for researchers and reviewers, offering guidelines to improve research designs and enhance A-SEO research transparency.
Keywords
1. Introduction
Academic SEO (A-SEO) is set of predesigned tasks and actions for creating, publishing, disseminating, and promoting scholarly literature in a way that makes it easier for search engines to crawl and index that literature, thus favoring its appearance at the top of a search engine results page (SERP) for the highest number of search terms (i.e. organic keywords) possible [1] (inspired by Beel et al. [2]).
A-SEO can be employed in many types of studies to address a series of different questions. For example, in web search analyses, it helps determine which search terms users use to locate scholarly resources [3]; in web visibility studies, it resolves which scholarly resources rank highest when different search queries are formulated [4]; and, in web impact/influence assessments, it identifies the effects that featuring – or not featuring – on a SERP has on scholarly resource usage and citation [5].
Despite the large number of search engines available, A-SEO studies to date have primarily focused their attention on Google Search, which, as of December 2024, holds 89.73% of the global market share, according to StatCounter. 1 In the specific case of academic search engines, A-SEO has tended to focus primarily on Google Scholar, although in this case, no associated commercial SEO tools have yet to be developed.
Choosing an appropriate data provider for quantitative A-SEO studies presents something of a problem, a challenge that is likewise faced when selecting the bibliographic databases in which to conduct bibliometric analyses [6–8] or literature reviews [9,10].
However, comparative studies conducted in the scientific literature of SEO data providers do not allow authors to justify the decisions they make, a problem attributable to the fact that SEO tools have to be paid for, while their specific services are tied to different tiers of payment. Furthermore, SEO tools are not intended for academic purposes but rather for professional use, and as such, on occasion, lack the standardization required for scientific studies. As with social media platforms, the lack of APIs aimed at the scientific community constitutes a limitation when it comes to carrying out research using digital web research methods [11]. Finally, the opacity of their operation, reflecting issues of industrial property and market competitiveness, prevents researchers from knowing the coverage and precision of these tools when employing them in scientific studies.
For this reason, A-SEO scholars are largely unable to build up a body of evidence that can support their decision-making. Moreover, they tend to be overly dependent on availability – that is, being limited to those tools already contracted by their institutions – something that is typically highlighted as a shortcoming by reviewers during the peer-review process.
Other authors might opt to base their decisions on the comparisons reported in the technology blogs published by specialized professionals, 2 professional publications, 3 or data providers. 4 However, such comparisons tend to evaluate SEO tools in terms of their features and price, and often ignore aspects related to the data collected and, more significantly, the data overlap between the tools.
Given the interest in applying SEO metrics to measure research objects, a greater understanding of SEO tool databases is needed to ensure their more judicious use in scientific work. Consequently, this study seeks to answer the following research questions:
RQ1. Does the number of organic keywords collected for a domain name differ from one SEO tool to another?
This research question examines whether the metric organic keywords – the number of search queries for which a domain appears within Google’s top 100 results – varies across SEO tools. Because this metric is commonly used as an indicator of web visibility, consistent counts would be expected if tools capture comparable representations of search engine rankings.
RQ2. What is the overlap in organic keywords between SEO tools?
This research question investigates whether the specific search queries identified as organic keywords are consistent across SEO tools. If a domain ranks within the top 100 Google Search results for a given query, that query should theoretically be recognized as an organic keyword by multiple tools. Measuring overlap helps assess the consistency of keyword detection.
RQ3. Do the search volumes calculated for a given organic keyword differ from one SEO tool to another?
This research question evaluates whether SEO tools assign similar search volume estimates to the same keyword. Search volume represents the estimated number of monthly searches for a query in Google Search. If tools rely on comparable estimation procedures or data sources, the reported values should be relatively consistent across platforms.
RQ4. What is the overlap in organic URLs between SEO tools?
This research question examines whether different SEO tools identify the same pages from the analyzed domain as ranking in Google’s search results. Because URLs represent the specific resources receiving visibility and potential visits, consistency across tools would indicate similar detection of which pages are effectively positioned in search results.
RQ5. Does the traffic generated by a given organic URL for a given keyword differ from that generated by an SEO tool?
This research question assesses whether SEO tools estimate similar levels of traffic for the same organic URL. Traffic refers to the number of visits generated when users click a ranked result in Google’s search results page. Comparable values would suggest similar traffic estimation models across tools.
2. Research background
Search engines constitute one of the main ways of accessing information, as evidenced by the approximately 6.3 billion searches carried out worldwide every minute [12]. Faced with such a magnitude of daily search queries, websites seek to position their content in search engines strategically using the techniques of search engine optimization (SEO), since optimizing their appearance in search engines can generate up to 60% of a website’s organic traffic [13].
The scientific community, aware of the fundamental role played by search engines and SEO, has been studying this phenomenon of web visibility for nearly 20 years [14], concentrated essentially in four principal streams of research.
The first concerns itself with providing a definition of the concept of web visibility itself. Thus, [15] defines web visibility as the possibility that a user finds a reference to a website by taking an information retrieval approach, a definition that finds support among other authors (see [16,17]). Others, however, define web visibility by taking a quantitative approach and the computation of web indicators, including the number of external links or indexed pages [18–20]. More recently, defining web visibility by taking a more specific SEO approach, that is, as the set of positioning strategies that help a website to be ranked on a SERP, has gained currency [21].
The second stream is concerned with identifying and proposing strategies to improve a site’s web visibility. This stream of research includes reverse engineering studies [22,23] and specific case studies. Among the latter, there is a growing volume of research focused on objects related to science, such as publications [24], universities [4], scientific journals [25–27], and repositories [28,29].
The third stream of research seeks to measure web visibility using big data tools, such as SEMrush [30,31], Ahrefs [32,33], Sistrix [34,35], Majestic [1,36], and Ubersuggest [37,38]. Similarly, we also find research related to scientific objects, such as publications [39], journals [40], and repositories [41].
A fourth stream of research concerns the influence of artificial intelligence (AI)–based search tools on SEO practices. The recent emergence of generative AI systems capable of retrieving and synthesizing information from the web, such as ChatGPT Search [42], is probably to alter traditional patterns of web visibility and traffic acquisition. When such systems generate synthetic answers to user prompts, they often select and link specific web pages as sources, potentially concentrating traffic on the selected resources while excluding others from visibility. Early evidence suggests that generative AI chatbots are already becoming measurable sources of web traffic to scholarly platforms such as journal portals [43]. Consequently, a new line of work is emerging around generative engine optimization (GEO), which explores strategies to improve the likelihood that web resources are selected and cited by AI-based search systems [44].
SEO research relies on SEO tools for the massive collection of indicators (e.g. organic traffic and keywords). However, each tool employs its own technology, methodology, and nomenclature, generating different results that can compromise the validity of their findings. Despite this, no study to date has addressed this shortcoming, which we seek to rectify in the present work.
3. Methods
3.1. Data collection
Four widely used tools in the SEO industry were selected: Ahrefs, SEMrush, Serpstat, and Ubersuggest (Table 1). The four tools enjoy a strong market presence and a high degree of popularity, provide comprehensive coverage, and operate databases that include keyword research and web traffic data. As such, they have all the characteristics allowing us to meet the research objectives we outlined above.
SEO platforms.

Ubersuggest uses the Moz API to obtain backlink data, and as the keyword coverage statistics are not officially published, we can assume that these are also sourced from Moz.
The performance of each tool was checked using two domain names so as to obtain more robust evidence of the possible similarities or differences between platforms. To this end, we used two academic publishers: MDPI (mdpi.com) and Frontiers (frontiersin.org). The two publishers were selected because they share several characteristics that make them suitable cases for SEO-based analyses. Both MDPI and Frontiers are large multidisciplinary open-access publishers that produce a high volume of scholarly content annually. Their articles are published in full open access and hosted within their main domain names, allowing search engines to crawl the complete content rather than only bibliographic metadata. In addition, both publishers apply relatively standardized web structures across their journals and maintain centralized domain architectures, which facilitates large-scale SEO data collection. These characteristics make them appropriate environments for analyzing keyword and URL visibility.
Each tool was configured to collect data from the US/English market in desktop mode to ensure comparability across platforms. Most SEO tools allow users to define a specific geographic and language market (e.g. the United States and English), which determines the database used for keyword rankings and traffic estimations. This configuration is necessary because Google Search results vary depending on the user’s geographic location and language settings. By applying the same market configuration across tools, the analysis ensures that all results refer to a comparable search environment.
Serpstat operates differently, as it does not allow filtering by country and language simultaneously but instead requires the selection of a specific Google version. In this case, the “google.com” version was selected as the closest approximation to the US/English configuration used in the other tools. Consequently, the data obtained from Serpstat should be interpreted with caution, as they correspond to a slightly different configuration and are, therefore, not strictly comparable to the results obtained from the other platforms.
The following metrics were obtained directly from each SEO platform: Organic keyword count (i.e. total number of organic search terms in which the domain name appears in a given range of the SERP; top 100 by default) and Domain-based organic visits count (i.e. total number of visits driven from the SERP to the domain name when searching for each search term).
The list of organic search terms for each domain name was first downloaded from each SEO tool. Given the impossibility of downloading all the search terms for which a particular domain name ranks, the keywords were sorted according to the traffic generated by the domain name’s best-ranked URL when querying through the corresponding keyword. Then, all the available keywords were downloaded according to the limits of the license obtained on each SEO platform. 5 For each keyword, the Keyword search volume (estimated number of monthly searches on Google) was collected.
The list of organic URLs ranked on the SERP by each search term was also downloaded for each domain name and SEO tool. Protocols (e.g. http, https, and www) were removed from each URL, aggregating the corresponding traffic for duplicate URLs to provide a single URL list.
The URL-based organic visit count (number of visits driven to the domain name from the URL when searching by any organic search term) was collected for each URL.
To minimize consistency errors between SEO platforms, all data were downloaded simultaneously on 5 July 2024 (thereby covering all data up to and including June), obtaining a total of 151,145 keywords and 84,386 URLs across all tools and domain names.
3.2. Data analysis
Correlation coefficients were used to check the statistical relationship between the four tools when providing search volume (of keywords) and traffic (from URLs) data. After applying different normality tests using XLStat (Shapiro–Wilk, Anderson–Darling, Lilliefors, and Jarque–Bera), the risk of rejecting the null hypothesis (i.e. that the distribution of search volume data follows a normal distribution), although true, was lower than 0.01% for all four SEO tools. Given the lack of normality, Spearman correlations were used.
In addition, the coefficient of variation (CV) was calculated for each keyword/URL covered by at least three platforms so as to better understand the relative closeness between the values provided by each tool
where σ is the population standard deviation and μ is the population mean.
Overlap analysis was used to determine the uniqueness of, and the similarities between, SEO tools when generating rankings of keywords and URLs by organic traffic.
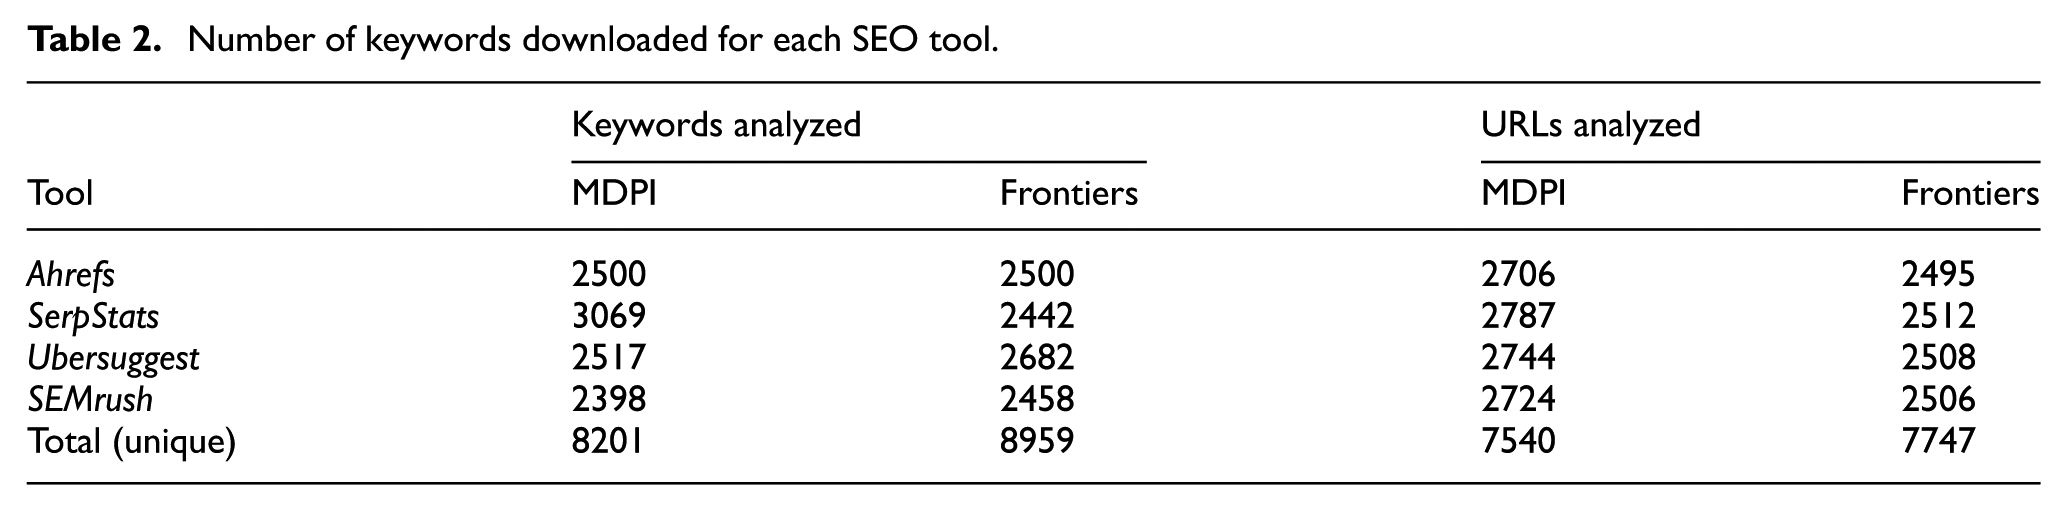
Given the differences in the number of keywords downloaded by each tool, only those that met a given condition were analyzed to allow a comparative analysis without size biases. In this case, the top 2500 keywords generating the most traffic were considered. All keywords with the same traffic value as the 2500th keyword were also included. Similarly, the overlap analysis of hosted URLs was only carried out for the top 2500 URLs generating the most visits from Google’s SERP. The number of keywords and URLs analyzed for each SEO tool is shown in Table 2.
Number of keywords downloaded for each SEO tool.
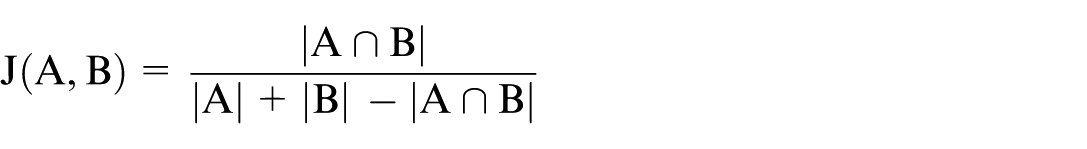
Finally, the Jaccard Index (JI) was calculated to measure the similarity between pairs of tools, both for the keyword sets and the URL sets obtained from each tool.
4. Results
4.1. Keywords
4.1.1. Organic keyword counts (RQ1)
The domain name with the highest number of organic keywords varied according to the tool: MDPI in the case of Ubersuggest and SEMrush, and Frontiers in that of Serpstat and Ahrefs. This obviously makes the drawing of any clear conclusions as to which domain name is more visible on Google difficult.
SEMrush and Ahrefs provided a similar number of organic keywords in the two measurements performed (MDPI and Frontiers), considering the order of magnitude of the data (millions of keywords). The results provided by these tools, however, are much lower than those provided by Ubersuggest and Serpstat (Figure 1).
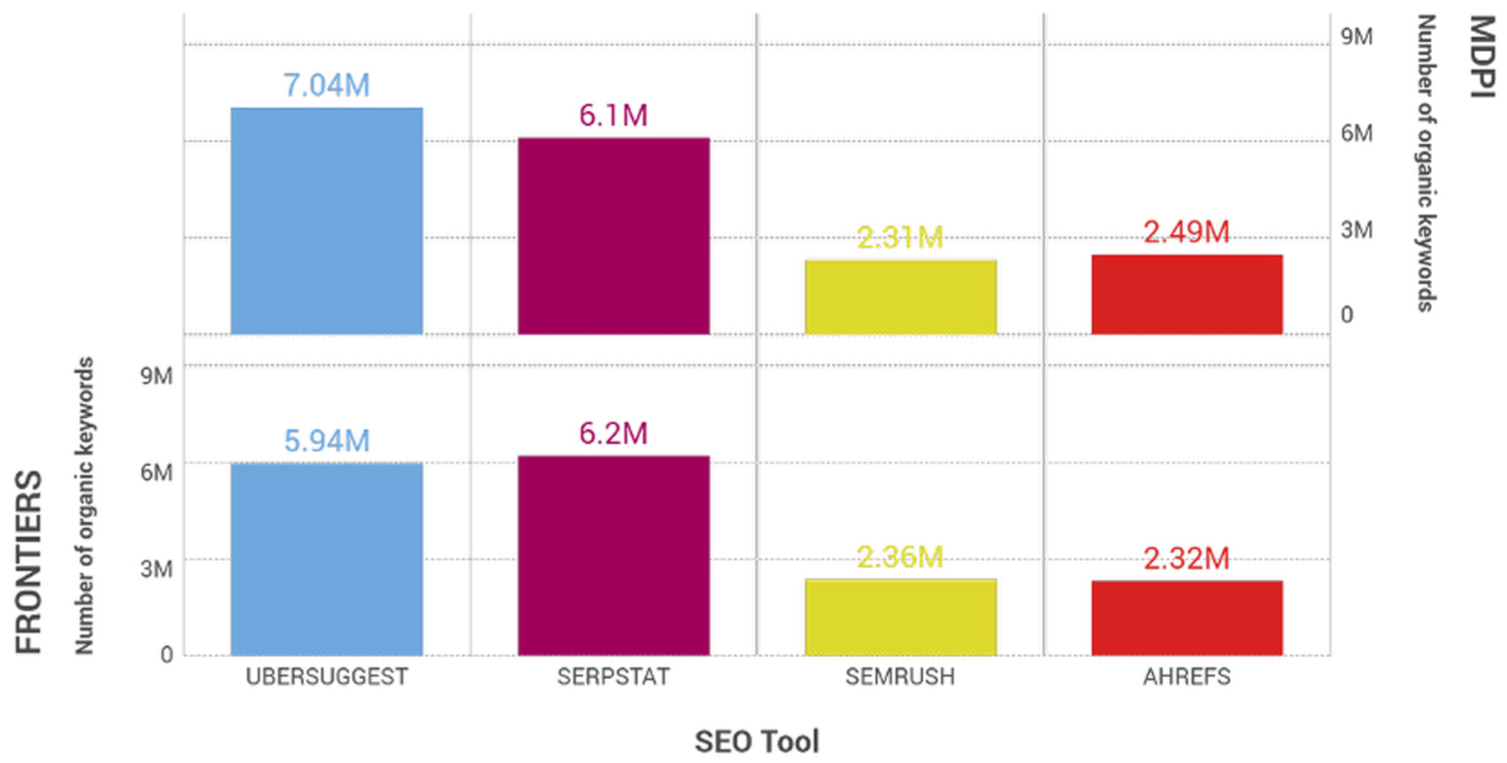
Number of organic keywords (June 2024) for MDPI (top) and Frontiers (bottom) from SEO tools.
The different filtering procedures employed by each tool account for these findings. While Ahrefs and SEMrush offer data filtered by language/country, Ubersuggest only provides a total organic keyword value, despite performing the search by language/country. 6 In the case of Serpstat, recall data collection is filtered by domain name (google.com), as previously indicated in the methodology section. This explains why the data from these tools are far greater, even when their keyword coverage is lower (Table 1), and a direct comparison is, therefore, not possible.
If we only consider SEMrush and Ahrefs data and focus on the most critical keywords (i.e. those whose search includes the analyzed domain name within the top 10 results in Google), we observed a significant difference in the performance of each domain according to the tool used. However, the monthly evolution trends varied significantly between the tools. For example, from May to June, there was an increase in Frontiers, according to SEMrush, but a significant decrease, according to Ahrefs (Figure 2). The discrepancies in the evolutionary data were even more significant for the domain name with the lowest organic keyword volume (MDPI).
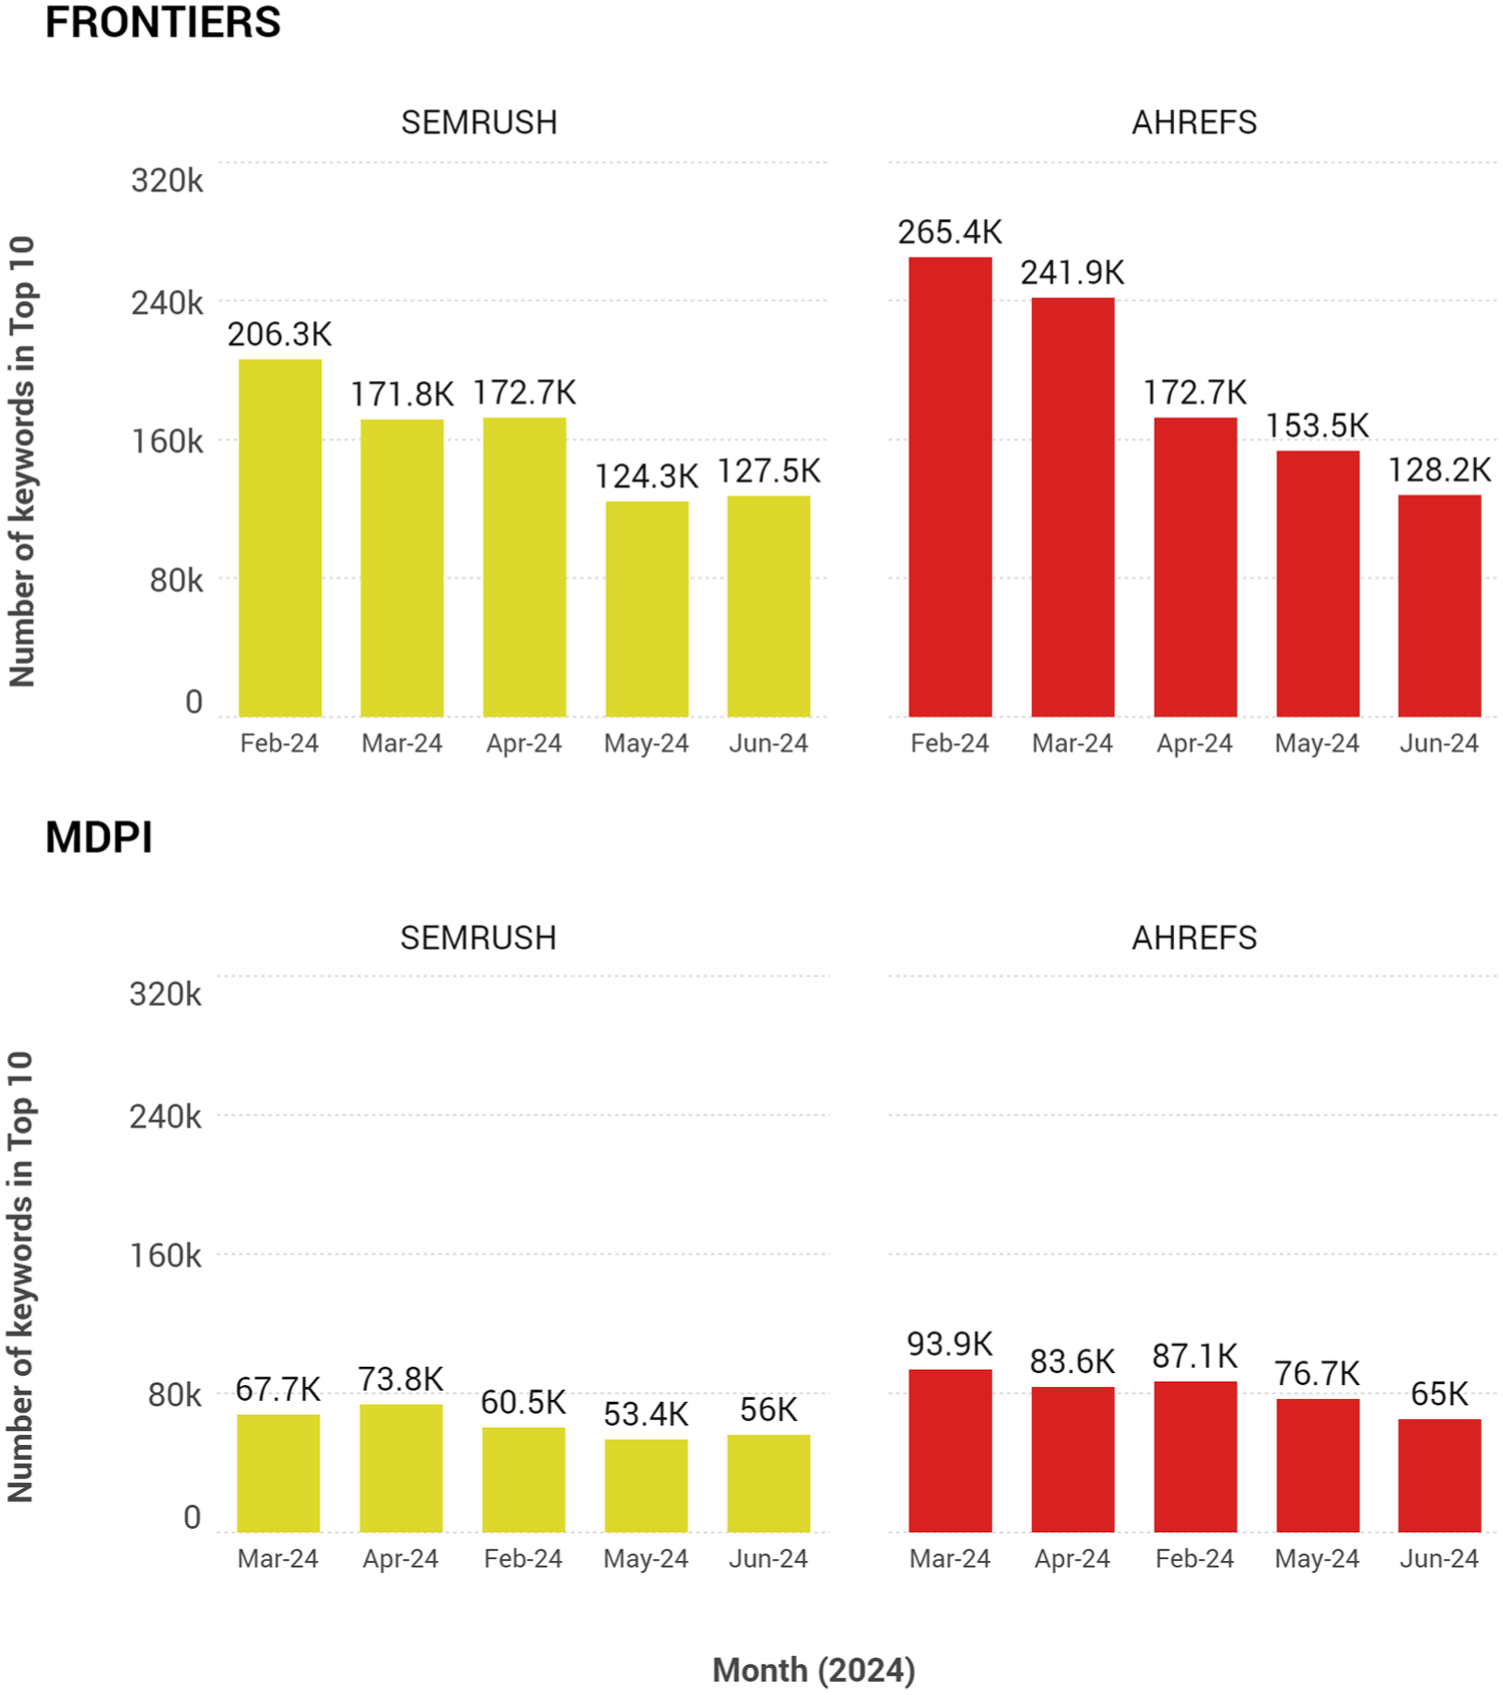
Number of organic keywords in Top 10 positions for Frontiers (top) and MDPI (bottom) according to SEMrush (left) and Ahrefs (right).
4.1.2. Organic keyword overlap (RQ2)
Keyword overlap between pairs of tools was low, both in total (R) and percentage (%) values, as well as by the low JI (J) values computed (Table 3).
Keyword overlap between SEO tools.
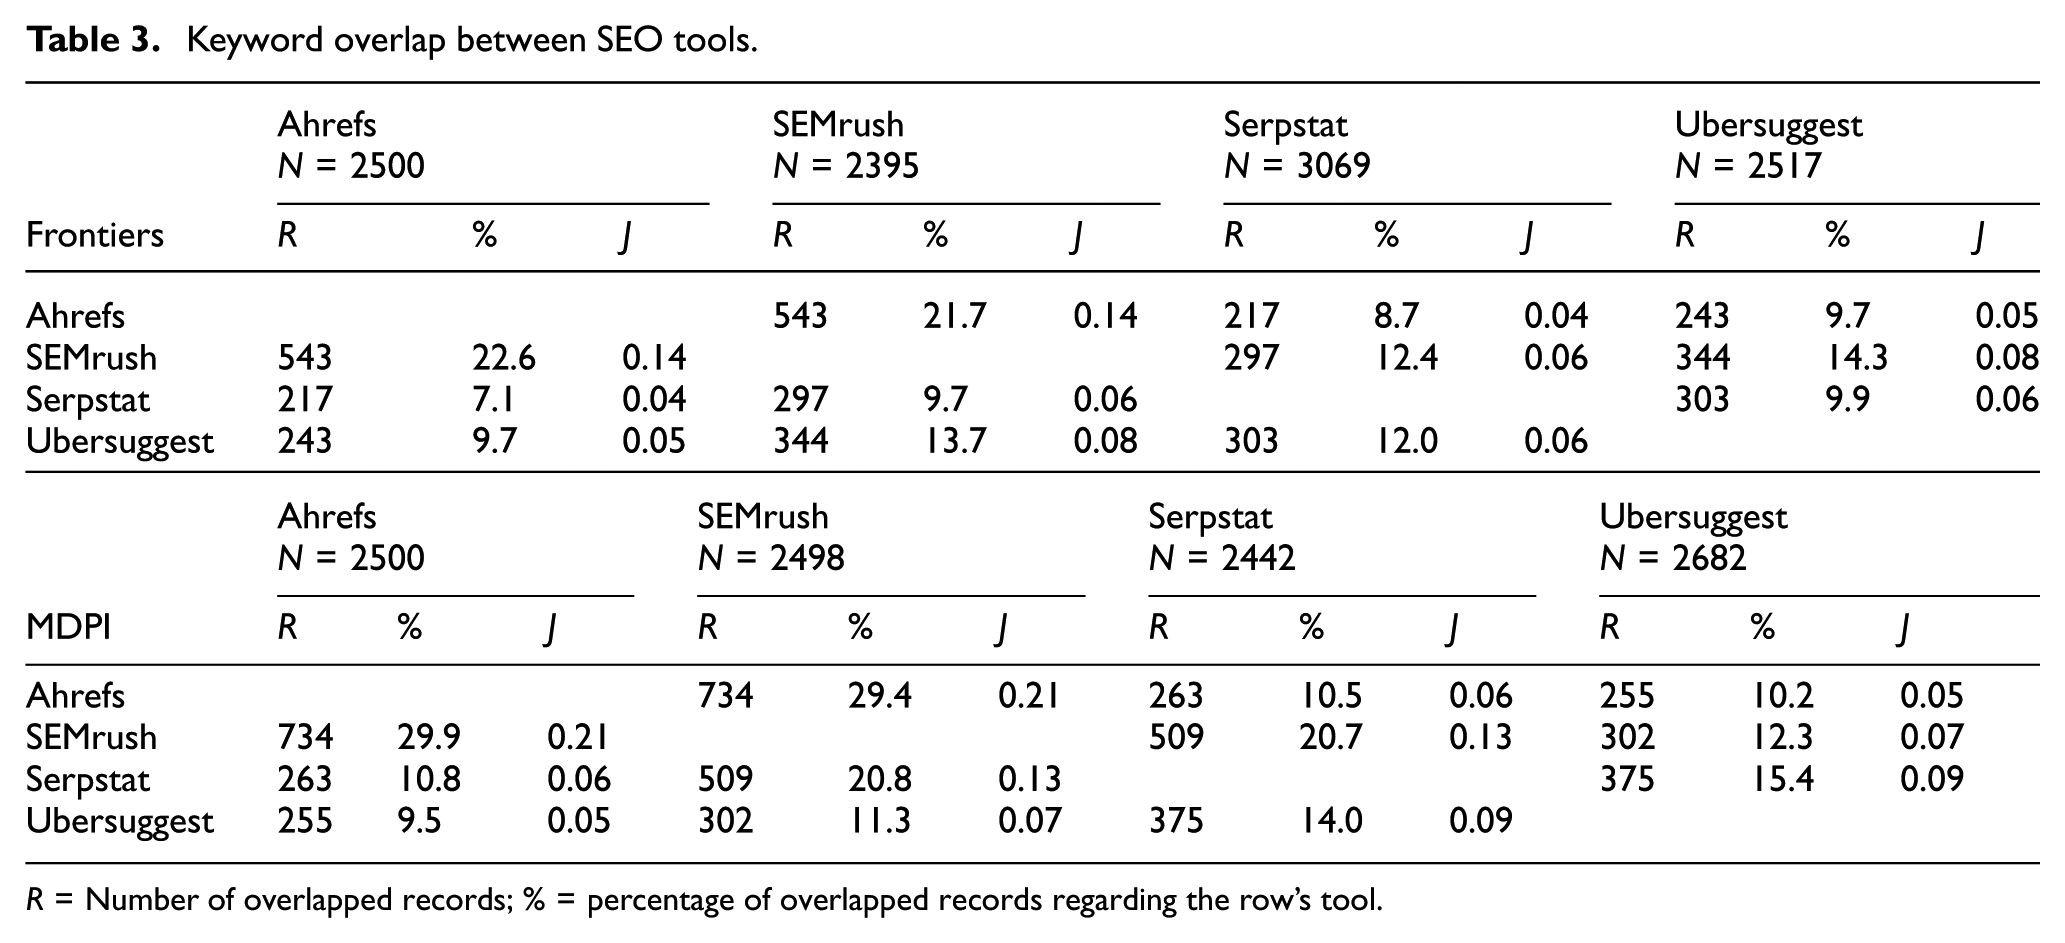
R = Number of overlapped records; % = percentage of overlapped records regarding the row’s tool.
Ahrefs and SEMrush are the tools that overlapped the most, sharing 543 terms in the case of Frontiers (21.7% of the keywords available in Ahrefs) and 734 (29.4%) in the case of MDPI. Otherwise, the greatest overlap was observed in the case of the MDPI analysis, especially between SEMrush and Serpstat (509 terms in common between these two tools, compared to 297 in the Frontiers analysis).
4.1.3. Search volume counts (RQ3)
Of the 151,145 unique keywords collected, only 356 appeared in all four SEO tools. The monthly search volumes shown for each of these keywords correlated positively and significantly between all tools (Figure 3), especially between Ahrefs and SEMrush (Rs = 0.93; p = 0.000; α < 0.001) and between Serpstat and Ubersuggest (Rs = 0.97; p < 0.0001; α < 0.001).
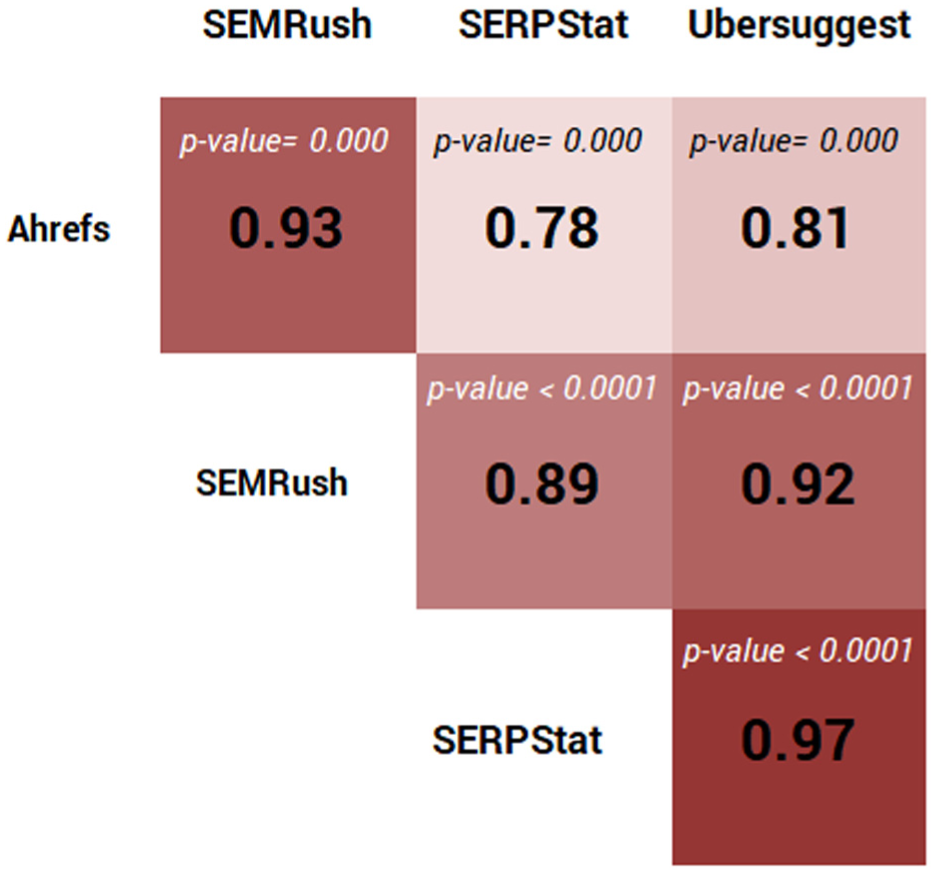
Spearman correlation matrix of the keywords search volume values between SEO tools (N = 356).
Of the 2563 terms retrieved in both Ubersuggest and Serpstat, the search volume results were identical in 2189 (85.4%) cases, which explains the high correlation between these tools that could be obtaining their search volume values from the same source. The differences might be due to the data update procedures followed by each tool.
Beyond the correlation values, the search volume’s CV was calculated for each keyword – considering only those keywords collected in at least three of the four tools (N = 2545) – to determine whether the values provided by each tool were similar.
The average CV is 0.43, while we obtained values lower than 0.5 for 66% of the keywords analyzed, indicating a narrow distribution and low variability between the tools (Figure 4).
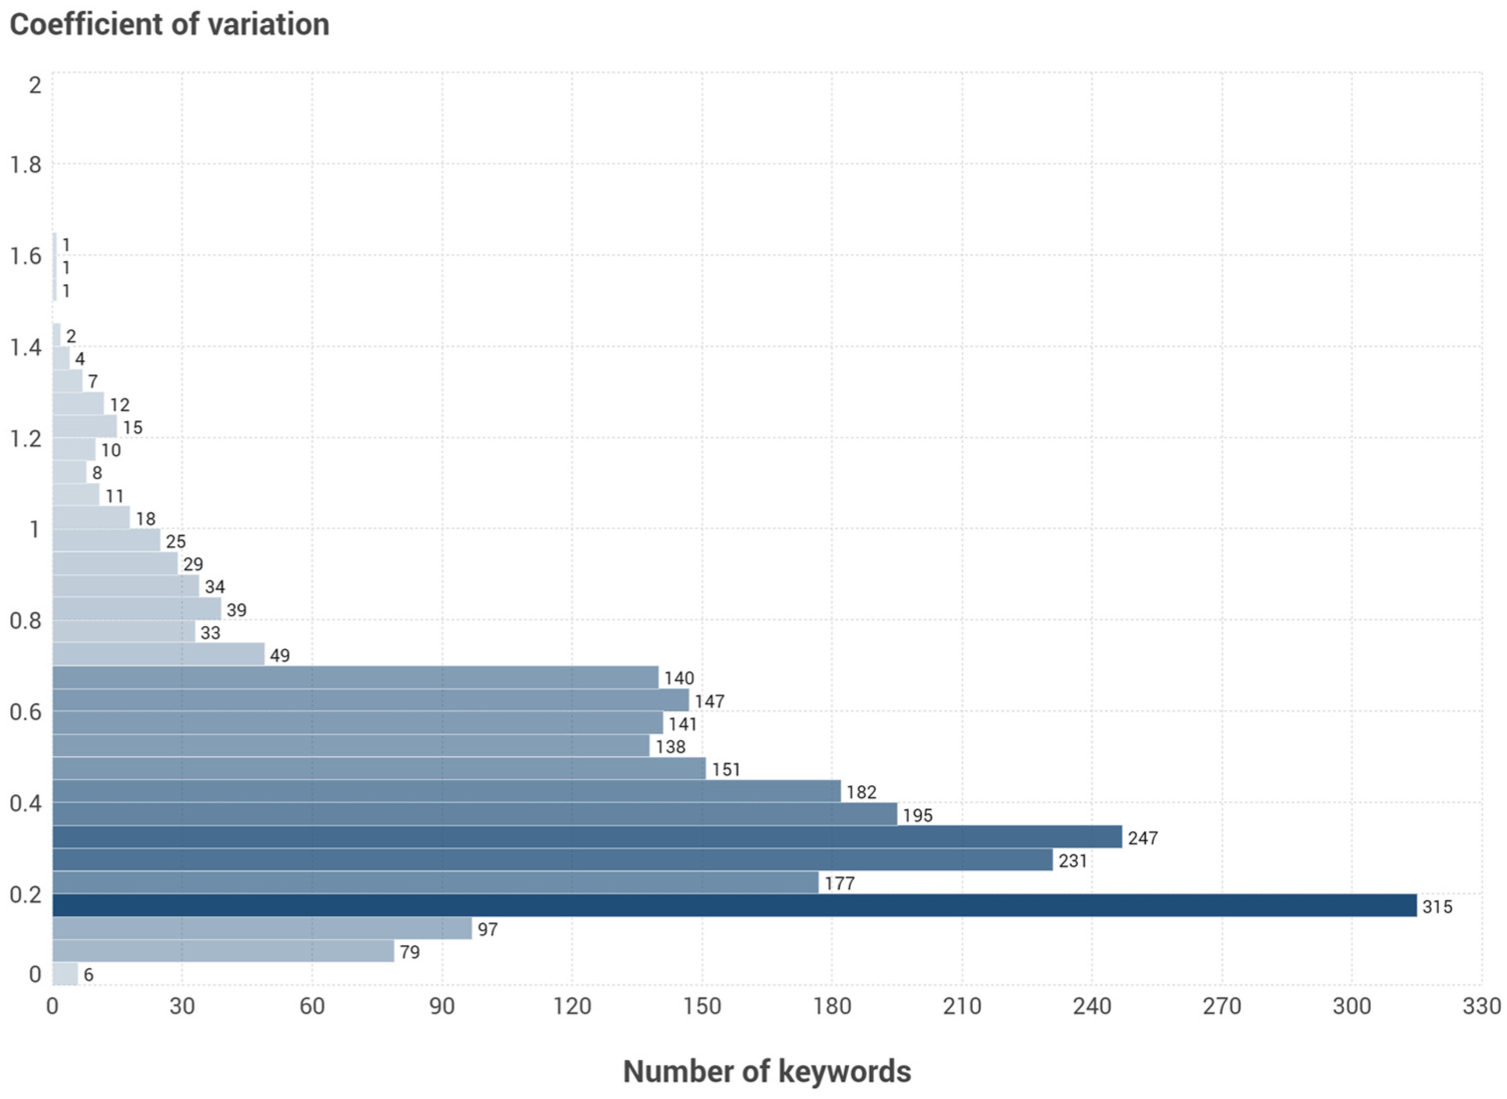
Search volume coefficient of variation for each keyword (N = 2545).
4.2. URLs
4.2.1. Organic URLs overlap (RQ4)
The overlap between the top 2500 URLs driving the most traffic is low (Table 4). No pair of tools obtained a JI higher than 0.3, showing no similarity between the sets of URLs collected in each tool.
URL overlap between SEO tools.
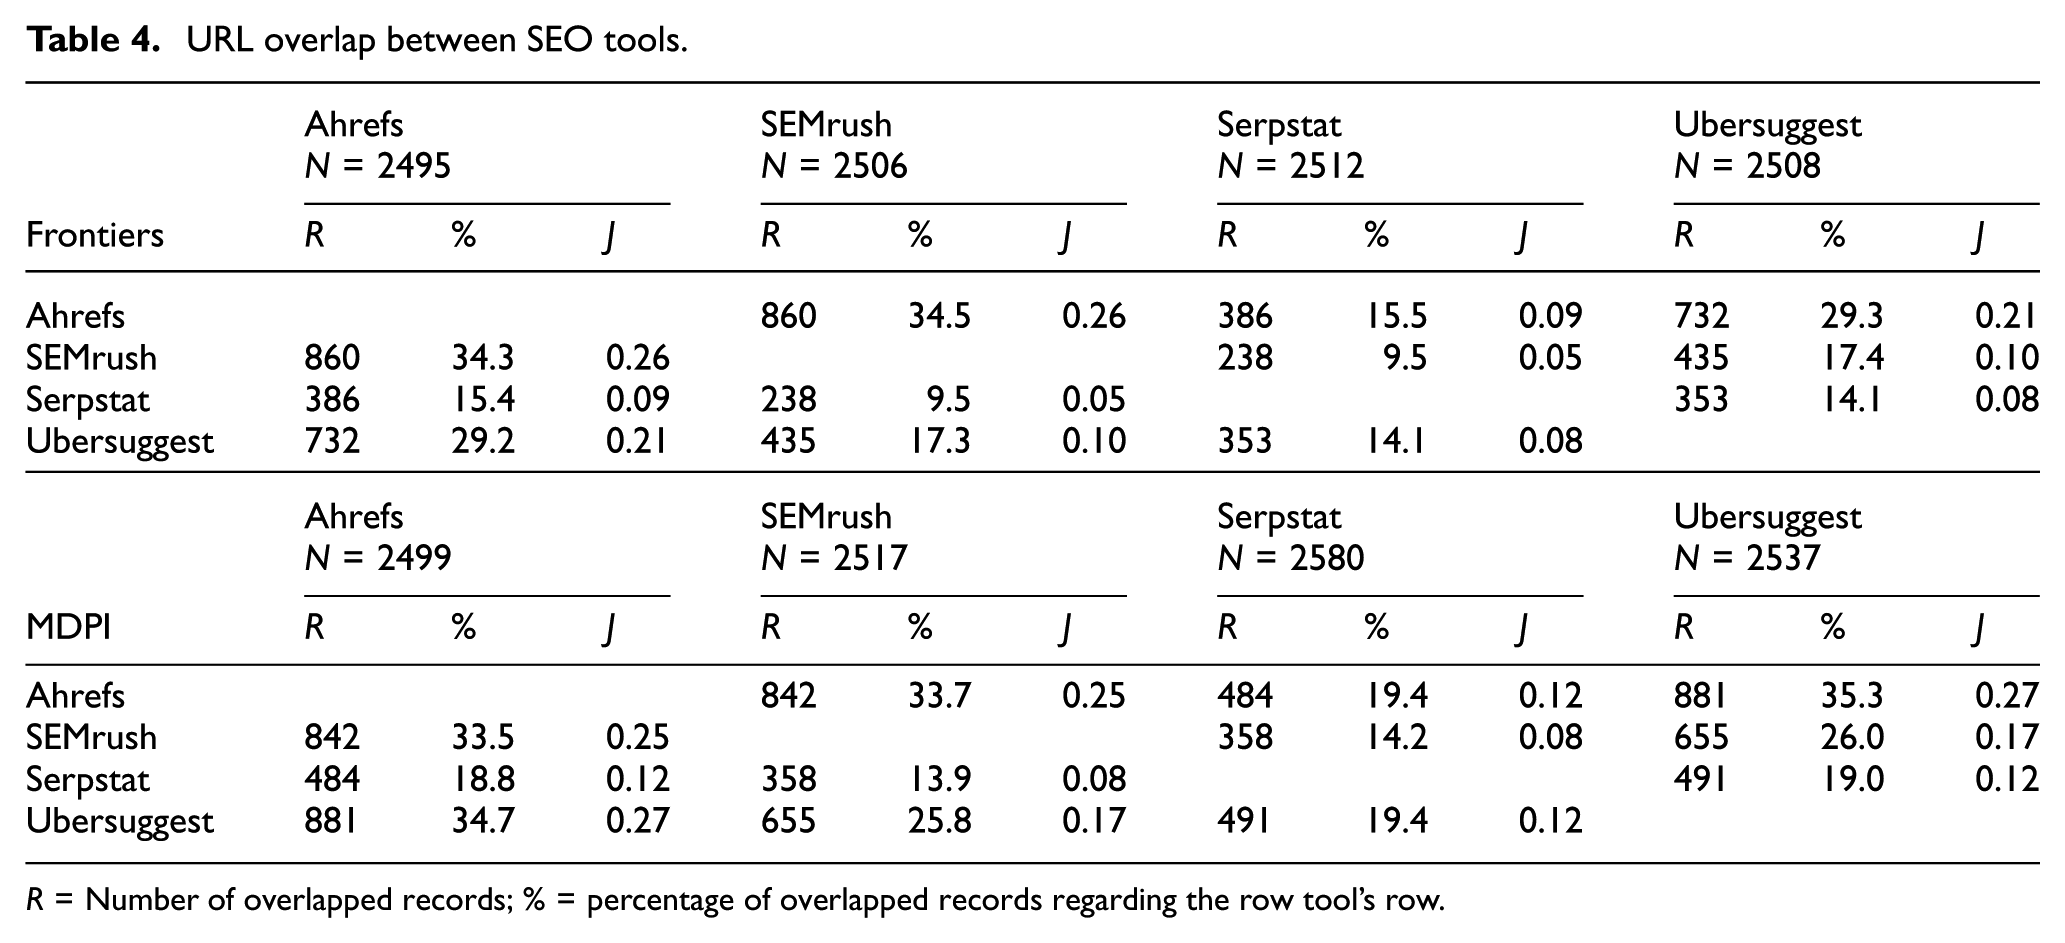
R = Number of overlapped records; % = percentage of overlapped records regarding the row tool’s row.
Ahrefs shared about a third of its URLs with both SEMrush and Ubersuggest in both case studies, meaning the sets of URLs collected in each tool, sorted by traffic generated, are noticeably different.
The MDPI analysis again showed slightly higher levels of overlap than Frontiers, except for the pair Ahrefs–SEMrush, which was marginally lower (from 860 to 842 URLs).
4.2.2. Web traffic counts (RQ5)
Of the 84,386 unique URLs collected, only 1914 (2.3%) were included in the four platforms analyzed, serving as the basis for the comparative web traffic analysis.
The correlation of the web traffic value assigned to a URL between the tools was positive and statistically significant. However, URL-based traffic correlations were weaker than keyword-based search volume correlations. Again, the correlation between Ahrefs and SEMrush (Rs = 0.73; p = 0.000; α < 0.001) stands out (Figure 5).
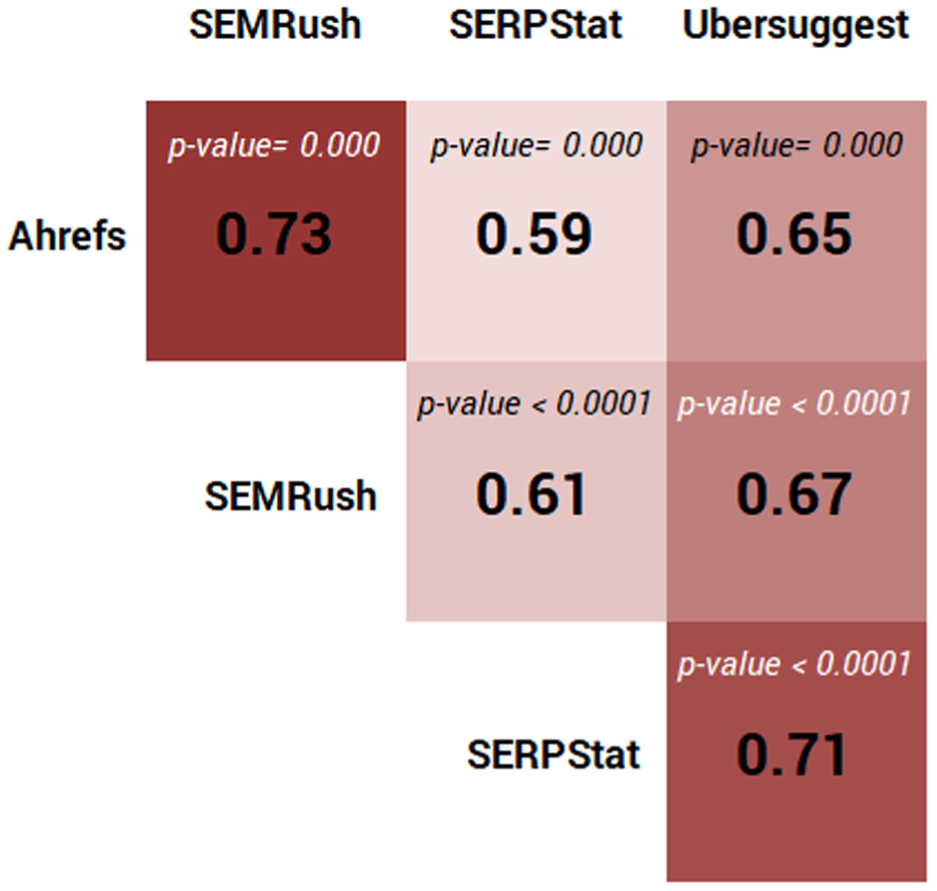
Spearman correlation matrix of the traffic values between SEO tools (N = 1914).
The web traffic’s CV was calculated for each URL collected in at least three of the four tools (N = 6825). In this case, the results show moderate to high values. The average CV was 0.77, surpassing the value of 0.5 (50% of variation) in 80% of the URLs analyzed, indicating a broad distribution and high variability between the tools (Figure 6).
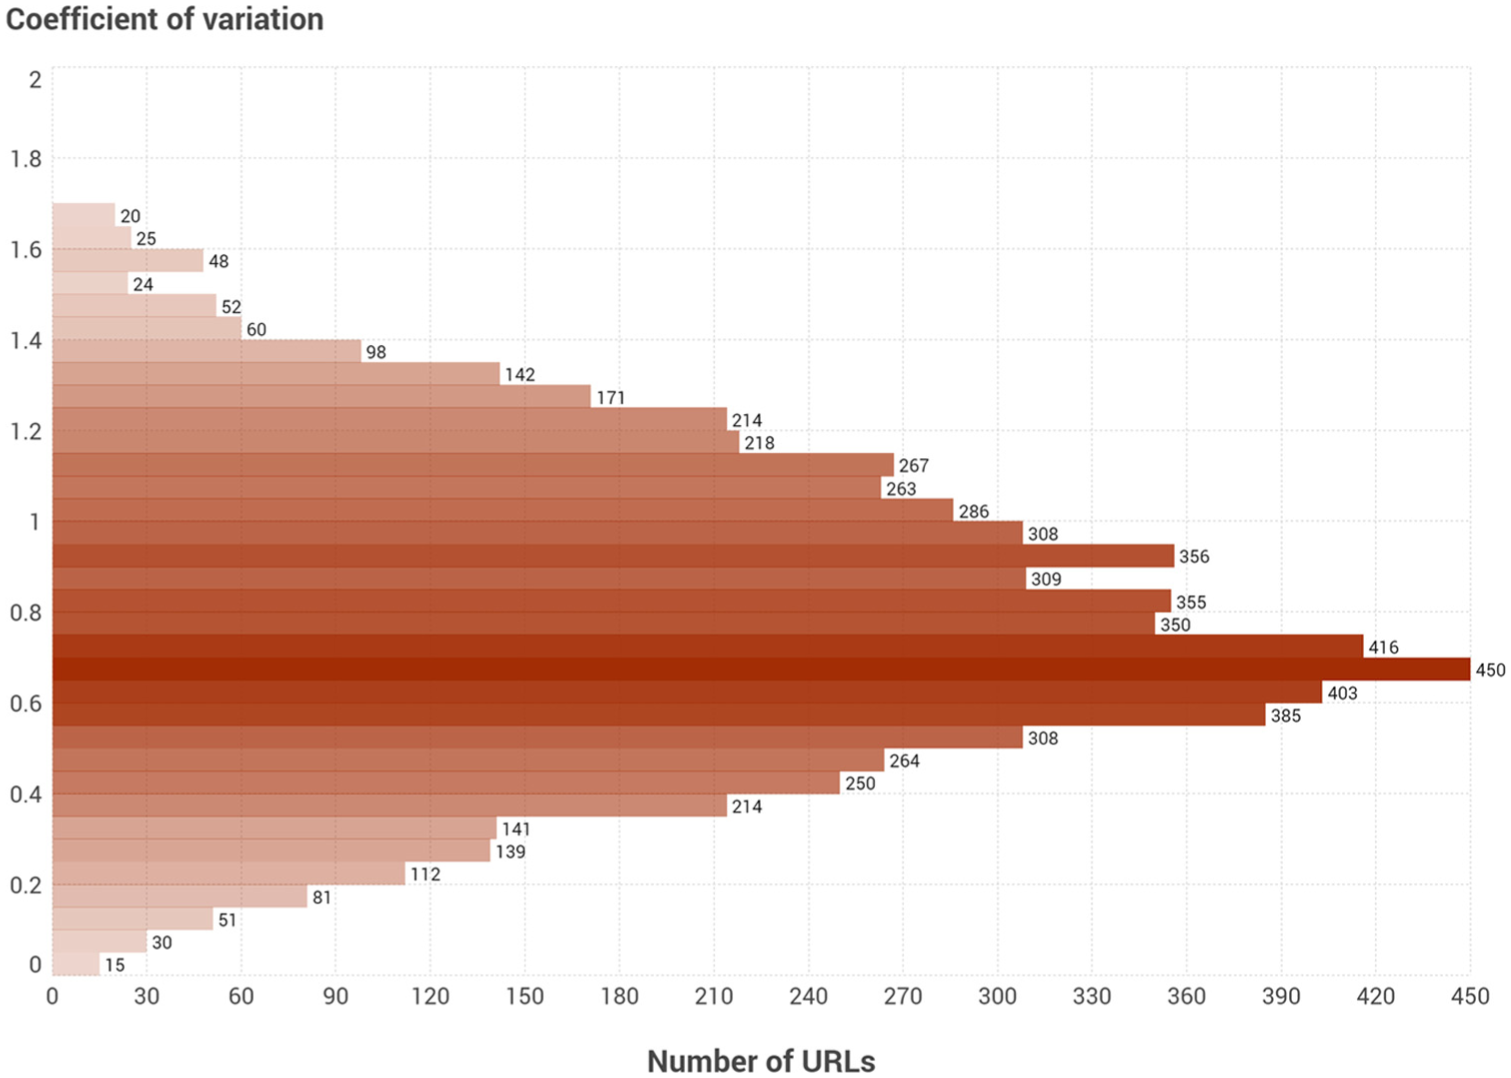
Traffic coefficient of variation for each URL (N = 6825).
5. Discussion
5.1. General considerations
This study has compared four widely used SEO tools –Ahrefs, SEMrush, Serpstat, and Ubersuggest– by analyzing the organic keyword counts, keyword search volumes, and URL traffic for two academic publishers. The analysis reveals significant variability between the tools, highlighting the strengths and limitations of each when collecting web metrics relevant to quantitative science studies. While SEO tools are increasingly being used in scientific research – especially for case studies [1,30–32,34,36–38] – cross-comparisons are scarce, and their different methodologies limit direct comparisons with the results presented here.
For example, [32] describes different indicators that can be used with different SEO analytics tools (Moz, Majestic, Ahrefs, and Alexa), but they do not consider the reliability of these metrics. [45] uses two tools simultaneously (SEMrush and Sistrix) and empirically demonstrates differences in the data provided by them; however, they do not explore the reasons for these differences. In contrast, [33] specifically addresses the reliability of such metrics, focusing its study on Moz, SEMrush, and Ahrefs. However, the primary goal of their study is to identify the ranking factors affecting their case studies by means of reverse engineering.
In the case of the study reported here, our analysis has revealed that the number of organic keywords varies from tool to tool (RQ1), and the differences between the tools are great enough for us to draw different conclusions in comparative studies. Counting only those keywords that rank URLs in the first 10 positions of the SERP offers better results; therefore, we recommend using this metric instead of the total number of keywords. Similarly, monthly trends vary significantly from one tool to another, even being diametrically opposed in many cases, which means evolutionary data are unreliable for scientific purposes.
When considering the 2500 keywords that generate the most traffic to the domain names analyzed by each tool, the results reveal a slight overlap in the two case studies. Thus, we confirm that the set of most relevant keywords in terms of traffic differs from one tool to another (RQ2). Since the terms are ordered by traffic, this lack of similarity can be attributed to the procedures employed by each tool to estimate the traffic to each URL ranked in the search results for a given keyword. Therefore, we recommend counting keywords that appear in as many different tools as possible, using a traffic estimate based on the average traffic of each tool, and eliminating extreme values to minimize error.
The ranking of keywords by search volume is very similar in all four tools (RQ3), but the search values assigned to the same keyword differ (with the exception of Ubersuggest and Serpstat, which seem to obtain the results from the same source). These results indicate that SEO tools have different procedures for estimating keyword search volumes, given that this metric is not taken directly from Google.
The most relevant URLs in terms of traffic differ depending on the tool (RQ4), showing again that the procedures for estimating traffic hold the key to explaining the differences between the tools. Otherwise, the traffic assigned to each URL correlates positively and significantly across the four tools. However, the high coefficients of variation computed point to the differences in traffic by tool (RQ5). This means it is advisable to quantify and analyze only those URLs that generate a significant amount of traffic (top 2500 or URLs with a certain traffic threshold) in more than one tool and to work with estimates based on traffic averages for each tool, eliminating extreme values.
5.2. Methodological recommendations for the use of SEO tools in quantitative research
The results of this study allow several methodological recommendations to be proposed for researchers using SEO analytics tools in quantitative analyses of web visibility.
First, researchers should rely on multiple SEO tools whenever possible. The results show substantial differences in the sets of keywords and URLs detected by each platform. Using more than one tool allows researchers to triangulate the data and reduce the risk of relying on incomplete or tool-specific data sets. In this regard, the relatively similar order of magnitude observed between Ahrefs and SEMrush suggests that combining these tools may provide more stable results than relying on a single platform.
Second, analyses should prioritize elements detected across several tools. Considering only keywords or URLs identified by multiple platforms can reduce the influence of tool-specific coverage differences. When traffic estimates are required, it is advisable to calculate averages across tools and eliminate extreme values to minimize estimation bias.
Third, search volume indicators appear to be more stable than traffic estimates. The results show strong correlations between tools for keyword search volumes and relatively low coefficients of variation. Consequently, this metric may be more suitable for comparative analyses across platforms than traffic estimates.
Fourth, traffic metrics should be interpreted cautiously and preferably as relative indicators rather than precise measurements. The analyses reveal substantial variability in traffic estimates across tools, partly due to methodological differences in how each platform defines and calculates this metric (e.g. estimated visits, expected users, or monthly visitors). These definitional differences hinder direct standardization and limit the comparability of absolute values.
Fifth, transparency in data collection is essential. Researchers should clearly report the SEO tool used, the date of data extraction, the market configuration applied (e.g. country/language settings or Google versions), and the definitions of the metrics provided by each platform. Such documentation facilitates reproducibility and improves the interpretability of results across studies.
5.3. Limitations
One of the main challenges faced in undertaking this study has been making the comparison as exact as possible since each tool has slightly different functionalities. This hinders the direct comparison of the metrics collected.
The most notable instance of this is the traffic metric, the definition of which, together with its nomenclature, varies from tool to tool. Thus, in the case of Ahrefs, it is the estimated number of monthly visits; in that of SEMrush, it is the number of users expected to visit the analyzed domain in the coming month in which the monthly traffic flow stays relatively the same; in the case of Serpstat, it is the number of visitors per month; while in that of Ubersuggest, it is again the estimated number of monthly visits. Although they are all traffic indicators, they do not employ the same metric, which might account for the differences reported in the previous section.
Although other tools on the market could have been included in this study, the ones included allow us to answer the research questions raised. Other tools (e.g. Moz, Sistrix, and Majestic) were tested but were ultimately discarded as they limited the comparative task or did not provide the required metrics.
The study reported here made several methodological decisions, the ramifications of which need to be addressed. First, each tool’s keywords and URLs were obtained by ordering these elements based on their assigned traffic. However, there may be alternative methods for completing this ordering, and we might even have opted for a larger number of elements than the 2500 used. Nonetheless, the process and sample used can be considered sufficient for the objectives of this study. Second, we chose to analyze two elements (keywords and URLs) and two metrics (search volume and traffic); however, there are more elements and metrics available to explore in future studies. Third, the overlap, correlation, and variation analyses have been performed here with a reduced amount of data, given that obtaining larger samples is difficult, as it requires that the keywords and URLs be included in all the tools analyzed. Nevertheless, the results are sufficiently robust and significant to obtain evidence of the similarity and dissimilarity of the data analyzed. In any case, it is noteworthy to mention that, as the data sources, crawling strategies, and estimation models used by each tool are not publicly documented, differences in coverage and metric calculation are difficult to evaluate or standardize.
Finally, it should be noted that this study aims not to compare domain names but rather tools. The domain names analyzed serve simply as two measures of case studies for determining whether the differences between the tools are maintained or vary from one domain to another. Likewise, two domains corresponding to academic mega publishers with similar characteristics were chosen, but other comparisons are possible. Here, it should be borne in mind that MDPI and Frontiers publish thousands of articles in multiple areas, so that the low overlap of keywords obtained in this case might not be as marked in less diverse websites. Future studies, based on other comparisons, are, therefore, recommended to better understand the features of SEO tools and their use in quantitative science studies.
6. Conclusion
The results reveal three distinct sources of variability across SEO tools: differences in database coverage (reflected in keyword and URL counts), differences in the elements detected by each platform (overlap), and differences in the estimated values assigned to those elements (search volume and traffic). These discrepancies can lead to different conclusions in SEO-driven quantitative research, especially when these metrics are used to study web visibility and web impact. Such variability underscores the relevance of tool selection in SEO-based research.
This article provides a number of insights for meta-researchers and A-SEO scholars into the reliability of SEO tools for conducting web visibility studies. As such, it should improve the rigor and transparency of academic SEO research and its applications in quantitative science studies. For editors and peer reviewers, the study also underlines the importance of evaluating SEO data critically and ensuring that the tools used in academic research are chosen and reported transparently.
Finally, the study also provides valuable feedback for SEO tool developers, encouraging them to consider standardizing metrics for academic and scientific use. Indeed, ultimately, a better understanding of tool performance and data accuracy within the scientific community should lead to enhanced research analytics products.
Footnotes
Acknowledgements
The authors would like to thank Iain Robinson for professional proofreading services and Oleg Shchegolev, CEO of SEMrush, for his valuable comments.
Ethical considerations
Not applicable.
Informed consent statement
Not applicable.
Funding
The authors disclosed receipt of the following financial support for the research, authorship, and/or publication of this article: Grant PID2022-142569NA-I00, funded by MCIN/AEI/ 10.13039/501100011033 and by “ERDF A way of making Europe” and Grant PID2021-123579OB-I00, funded by MCIN/AEI/ 10.13039/501100011033 and by “ERDF A way of making Europe.”
Declaration of conflicting interests
The authors declared no potential conflicts of interest with respect to the research, authorship, and/or publication of this article.
Data availability statement
The data supporting the findings of this study will be deposited in Institutional Repository after acceptance.