






Abstract
The popularization improved the trend towards visual social media platforms, presenting novel strategic opportunities for the media industry. This study presents a data-driven framework for visual content strategies, addressing a notable research gap regarding the strategic utilization of Instagram by news organizations. Drawing on internal and external data sets gathered during the COVID-19 pandemic, the research employs a mixed-methods approach comprising longitudinal statistical analysis, computational sentiment analysis, and quantitative discussion. The findings demonstrate that narrative engagement plays an important role in involving audiences. Instagram readers on the website increased, as well as their engagement, revealing the assertiveness in content selection. The results underscore the positive effect of vivid content and illustrate the strategic advantages of integrating a data-driven decision-making framework into editorial workflows. These results assist social media managers in defining an editorial strategy to maximize reach and enhance reader conversion.
Keywords
1. Introduction
In the current digital landscape, the pervasiveness of real-time reader interaction generates vast quantities of granular data for media organizations. This shift into the big data era has necessitated the adoption of sophisticated technologies, integrating data science (DS) and business intelligence (BI) capabilities directly into publishing workflows [1,2]. Consequently, the decision-making processes governing content distribution and promotion have grown increasingly multifaceted. Within this framework, data visualization and analytical modelling have become pivotal instruments for optimizing marketing strategies and editorial interventions across the reader conversion funnel [3].
In the last decade, publishers faced a digital transformation that introduced challenges and opportunities to the media industry [1,4]. As people engage with social media (SM) platforms [5–7], news organizations have had to adapt their strategies to engage followers and boost readers’ engagement on their own platforms [8]. Furthermore, the increase in visual content published online has induced communication researchers to study this recent reality [9]. As argued by Araujo et al. [9], news image analysis is of interest to all sorts of communication researchers. However, the role and strategy of specific SM content is understudied [9,10].
Authors argue that audiences are sensitive to the tone and style of communication [11]. Furthermore, news organizations have been embracing the use of analytics as part of editorial decision-making in a big data environment [2,12]. Technological tools [13], organizational structures, and cultural components were necessary parts to build a prodata culture in the newsroom [14,15]. Consequently, social media editors (SMEs) serve as critical intermediaries between digital audiences, newsrooms, and marketing departments [12]. Given their strategic positioning within the organizational hierarchy, SMEs are tasked with the continuous refinement of engagement strategies [15]. This process is increasingly facilitated by BI tools, which enable the systematic monitoring of decision outcomes and the iterative optimization of strategies to foster deeper audience engagement. Concurrently, the proliferation of COVID-19-related misinformation [16] has necessitated the integration of automated detection models [17], providing SMEs with the computational support required to identify and mitigate the spread of fraudulent content.
Furthermore, the research literature performed by Rejeb et al. [18] showed a lack of research on studying SM strategies [19], particularly in media [20,21]. Having recognized this gap and motivated by the increase in interest in SM strategy [12,22], especially in the media industry [23], this research focuses on the effectiveness of a visual content data-driven strategy used by the Portuguese publisher Público.
The bibliometric analysis presented by Rejeb et al. [18], regarding Instagram research, concludes that studies can be carried out using quantitative approaches to better understand the role of Instagram in influencing users’ behaviour. Moreover, inspired by the successful business case of financial times [24], the multi-dimensional RFV (recency, frequency, and volume) role of Instagram in influencing users’ behaviour. Moreover, in the recent research on Instagram use, the COVID-19 pandemic is one of the dominant topics [18]. However, none related to how to implement a data-driven strategy to avoid misinformation and promote constructive journalism [18] with visual content.
Furthermore, authors argue [7] that there are few studies on the approaches that organizations use to communicate information on Instagram, as there are some limitations, such as how the platform’s algorithm works. However, there is a strong interest in understanding how to meet audiences’ needs [25] and which types of content have more responses or engagement from the readers [7]. Moreover, recent researchers have tried to explore how audiences are responding to content on Instagram [25,26]. Thus, in this exploratory research, we aim to address four research questions (RQs) that are linked to the four main reader funnel steps presented in Figure 4. In the first step, “attract reader,” we would like to know whether there are new approaches and formats of Instagram posts that are more engaging? Which type of message is the most effective? (RQ1). Then, from a journalistic point of view, we aim to understand whether there is a constant/unbiased tone in caption posts that ensures authenticity and trustworthiness? (RQ2). Then, regarding the conversion into a website reader, we explore how a data-driven strategy can leverage website readers from Instagram? (RQ3). Finally, we aim to explore whether those readers present a high propensity to convert as paid subscribers, that is, are Instagram visits contributing to new online newspaper subscribers? (RQ4)
By answering these RQs, this study aims to contribute to the literature on visual communication, visual content data-driven strategy, and also to guide SMEs on how to effectively promote content that users engage with and consequently convert into subscribers. Drawing on data from external and internal databases, collected between January 2020 and September 2021, we analyse the strategy followed.
2. Literature review
2.1. Reader engagement and SM
Authors agree that reader engagement is a multi-dimensional phenomenon [27] encompassing emotional, cognitive, and behavioural involvement with media content [28–31]. Extensive research has further established a significant correlation between SM strategies and heightened levels of engagement [32,33]. Concurrently, recent studies highlight a paradigm shift in news production, characterized by an increased reliance on data analytics and visual SM content to facilitate multi-platform dissemination [15]. However, in the case of Instagram, literature is rather scarce, especially in the media industry [6]. By consulting the digital database Scopus, which is the largest abstract and citation database of peer-reviewed literature [34], the following query to articles’ titles, abstracts, and keywords only returns 56 relevant documents (as of September 2025).
(TITLE-ABS-KEY (instagram AND (newspaper OR engagement OR online OR publisher) AND news AND strategy))
Throughout the COVID-19 pandemic, SM has become the mainstream communication tool for content generation, dissemination, and consumption [5,11,18,35]. This dominance was largely driven by government-mandated non-pharmaceutical interventions, which restricted physical mobility and necessitated prolonged periods of confinement [36]. Despite its utility, SM platforms also facilitated the rapid proliferation of misinformation and biased information [5,37,38]. In fact, empirical evidence has established a significant correlation between the consumption of false information and adverse psychological outcomes, including heightened mental distress, self-harm, and increased suicide rates [19,39,40]. Conversely, the literature suggests that constructive journalism serves as a vital mitigating factor, exerting a positive influence on public well-being during periods of crisis [23].
A systematic review of literature on health-related misinformation [41] presents the main psychological aspects that make the snowballing of misinformation occur. The authors concluded that potential interventions should act on cultivating critical thinking (Wang et al.). Furthermore, research indicates that during the COVID-19 pandemic, the use of media for information seeking was associated with increased loneliness and, in turn, decreased satisfaction with life [42]. Thus, journalism plays a crucial role in society and democracy by providing verified knowledge about current events [43] and creating social bonds in times of crisis [18], by adding awareness and distributing accurate content [44] on the Internet.
In the Portuguese context, news organizations proactively mitigated the spread of misinformation by suspending paywalls for critical COVID-19-related coverage [5]. The subsequent growth in the subscriber base [45] proves that readers pay for trustworthy journalism [8]. Consequently, SM platforms provide significant opportunities for expanding audience reach [46] and fostering reader advocacy [47]. By implementing data-driven strategies across the reader conversion funnel, publishers can leverage these platforms to stimulate subscription growth and secure long-term institutional loyalty [3].
2.2. Instagram and visual journalism
Studies have examined user-generated content (UGC) to explore determinants of user engagement on social networks by focusing more on text analysis [33] and less on visual content [9,23]. However, recent experiments suggest that including pictures in a post leads to greater levels of engagement [48]. Furthermore, visual solutions journalism [13] provides comprehensive coverage of an issue, showing problems and responses [49]. Moreover, the availability and low cost of mobile devices popularized videos as an example of virtual reality, promoting the rise of immersive journalism [13]. According to [32], “vividness” is related to how a post simulates several senses by incorporating sound, movement, and visual elements into the post or content. Research has studied vividness and its effects on news coverage of violence and war [23].
Instagram is a visual social network [9,18,50,51] and a multimedia sharing platform to use on mobile devices [18,19,52]. The user can upload images and videos [50], and it can use a range of options to improve content presentation, such as filters, GIFs, or captions [52]. Instagram is the fifth most preferred SM platform for sharing news [5]. Its SM penetration in Portugal was 69% [53]. Furthermore, Instagram was the fifth SM platform most used by users aged 16 to 64 years and verified the highest advertising reach compared with the total population aged more than 13 years (42%) [53]. In January 2020, 54% of Portuguese Instagram users were people aged 18 to 34 years. In 2021, this proportion was 50% [54], indicating that half of users are older than 35 years, the target with a higher propensity to buy an online newspaper subscription [55].
Instagram revealed a strong potential for brand awareness by spreading trustworthy content in a visual format [56] that reduces readers’ uncertainty, especially in a crisis context [23].
2.3. Big data and analytics-driven journalism
Nowadays, companies are facing challenges to catch users’ attention [24]. Due to the speed with which users interact, each second of time results in millions of reader interactions and huge volumes of data [24]. Editorial analytics have thus emerged as a critical component in media organizations [15], enabling audience-oriented editors to decode complex consumption environments and optimize strategic decision-making [14,57]. In fact, six main uses of analytics are identified by Lamot and Paulussen [14]: story placement, story packaging, story planning, story imitation, performance evaluation, and audience conception.
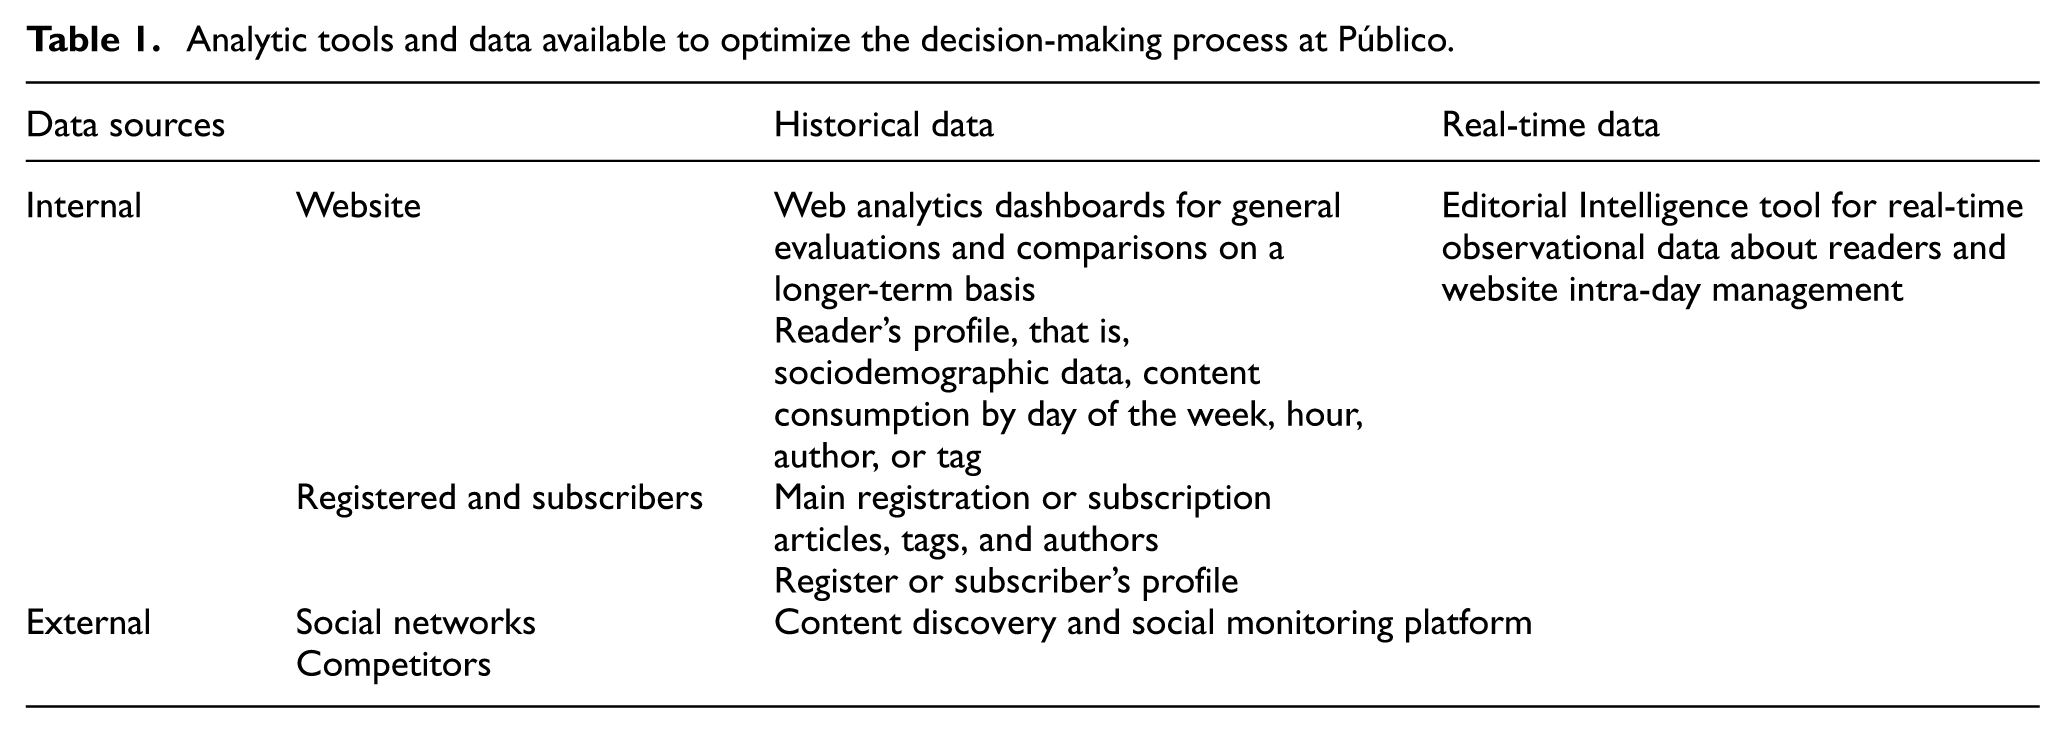
Moreover, SMEs are intermediaries between audiences, newsrooms, and marketing departments [12]. Thus, to maximize content mobile-first distribution, SMEs are allowed to observe internal and external data sources from historical to real-time data [15] through personalized BI (see Table 1). Analytic tools provide web analytics metrics to measure website performance and the overall story’s engagement [15]. SMEs can identify missed opportunities and improve their strategy in future decisions. Furthermore, SMEs have access to real-time metrics that help to decide the content to be promoted by the platform according to content type and level of importance [14,58].
Analytic tools and data available to optimize the decision-making process at Público.
To quantify readers’ engagement, most authors use attention-based metrics, such as average time per session or viewport time (i.e. time spent at each part of the article) [59]. Furthermore, the literature seems to agree that reader retention is related to how often a user reads (regularity) [60]. Consequently, this study analyses the frequency of sessions per user and pageviews per session as primary indicators of engagement (see Figure 5). Moreover, inspired by the successful business case of financial times [61], the multi-dimensional RFV engagement metric [62] was operationalized at Público in September 2020 to provide a more granular assessment of audience loyalty.
The widely applied RFM (recency, frequency, and monetary) model [63] was adapted to the media business context by replacing the monetary dimension with the number of articles visited, that is, the volume of content consumed. Thus, R measures how recently the consumer has visited the website in days, F is the number of website visits within a time period, and V indicates the total number of articles read in a period. The RFV scoring process, for quantifying reader behaviour, uses the quintile method [63]. Thus, an RFV value that goes from 111 to 555 is assigned to each reader. A total of 125 combinations (5 × 5 × 5) that divide the sample into 125 equal clusters. The readers who have the highest RFV scores are the most engaged, corresponding to readers who visited the website most recently, made more visits (highest frequency), and read many articles (highest volume) for 90 days.
To measure users’ SM engagement in the platform [31], researchers study two types of metrics [48]. One related to the direct response, or interactions, with the posts, such as the number of likes or comments [32]. The second is related to the sharing and propagation of the published content that allows the user to recommend content to their followers. In this study, we will focus on interactions, such as the number of likes or comments and the number of video visualizations. As Instagram is a photo-sharing SM platform [9,48], we aim to examine how posts’ characteristics (e.g. content, interactivity, and vividness) [32] impacted user engagement and the relation between post engagement and website traffic from Instagram users.
To answer the previously raised RQs (also presented in Figure 1), our study consisted of five distinct steps: editorial strategy understanding, data gathering and analysis, results achieved, discussion, and, finally, limitations and conclusions.
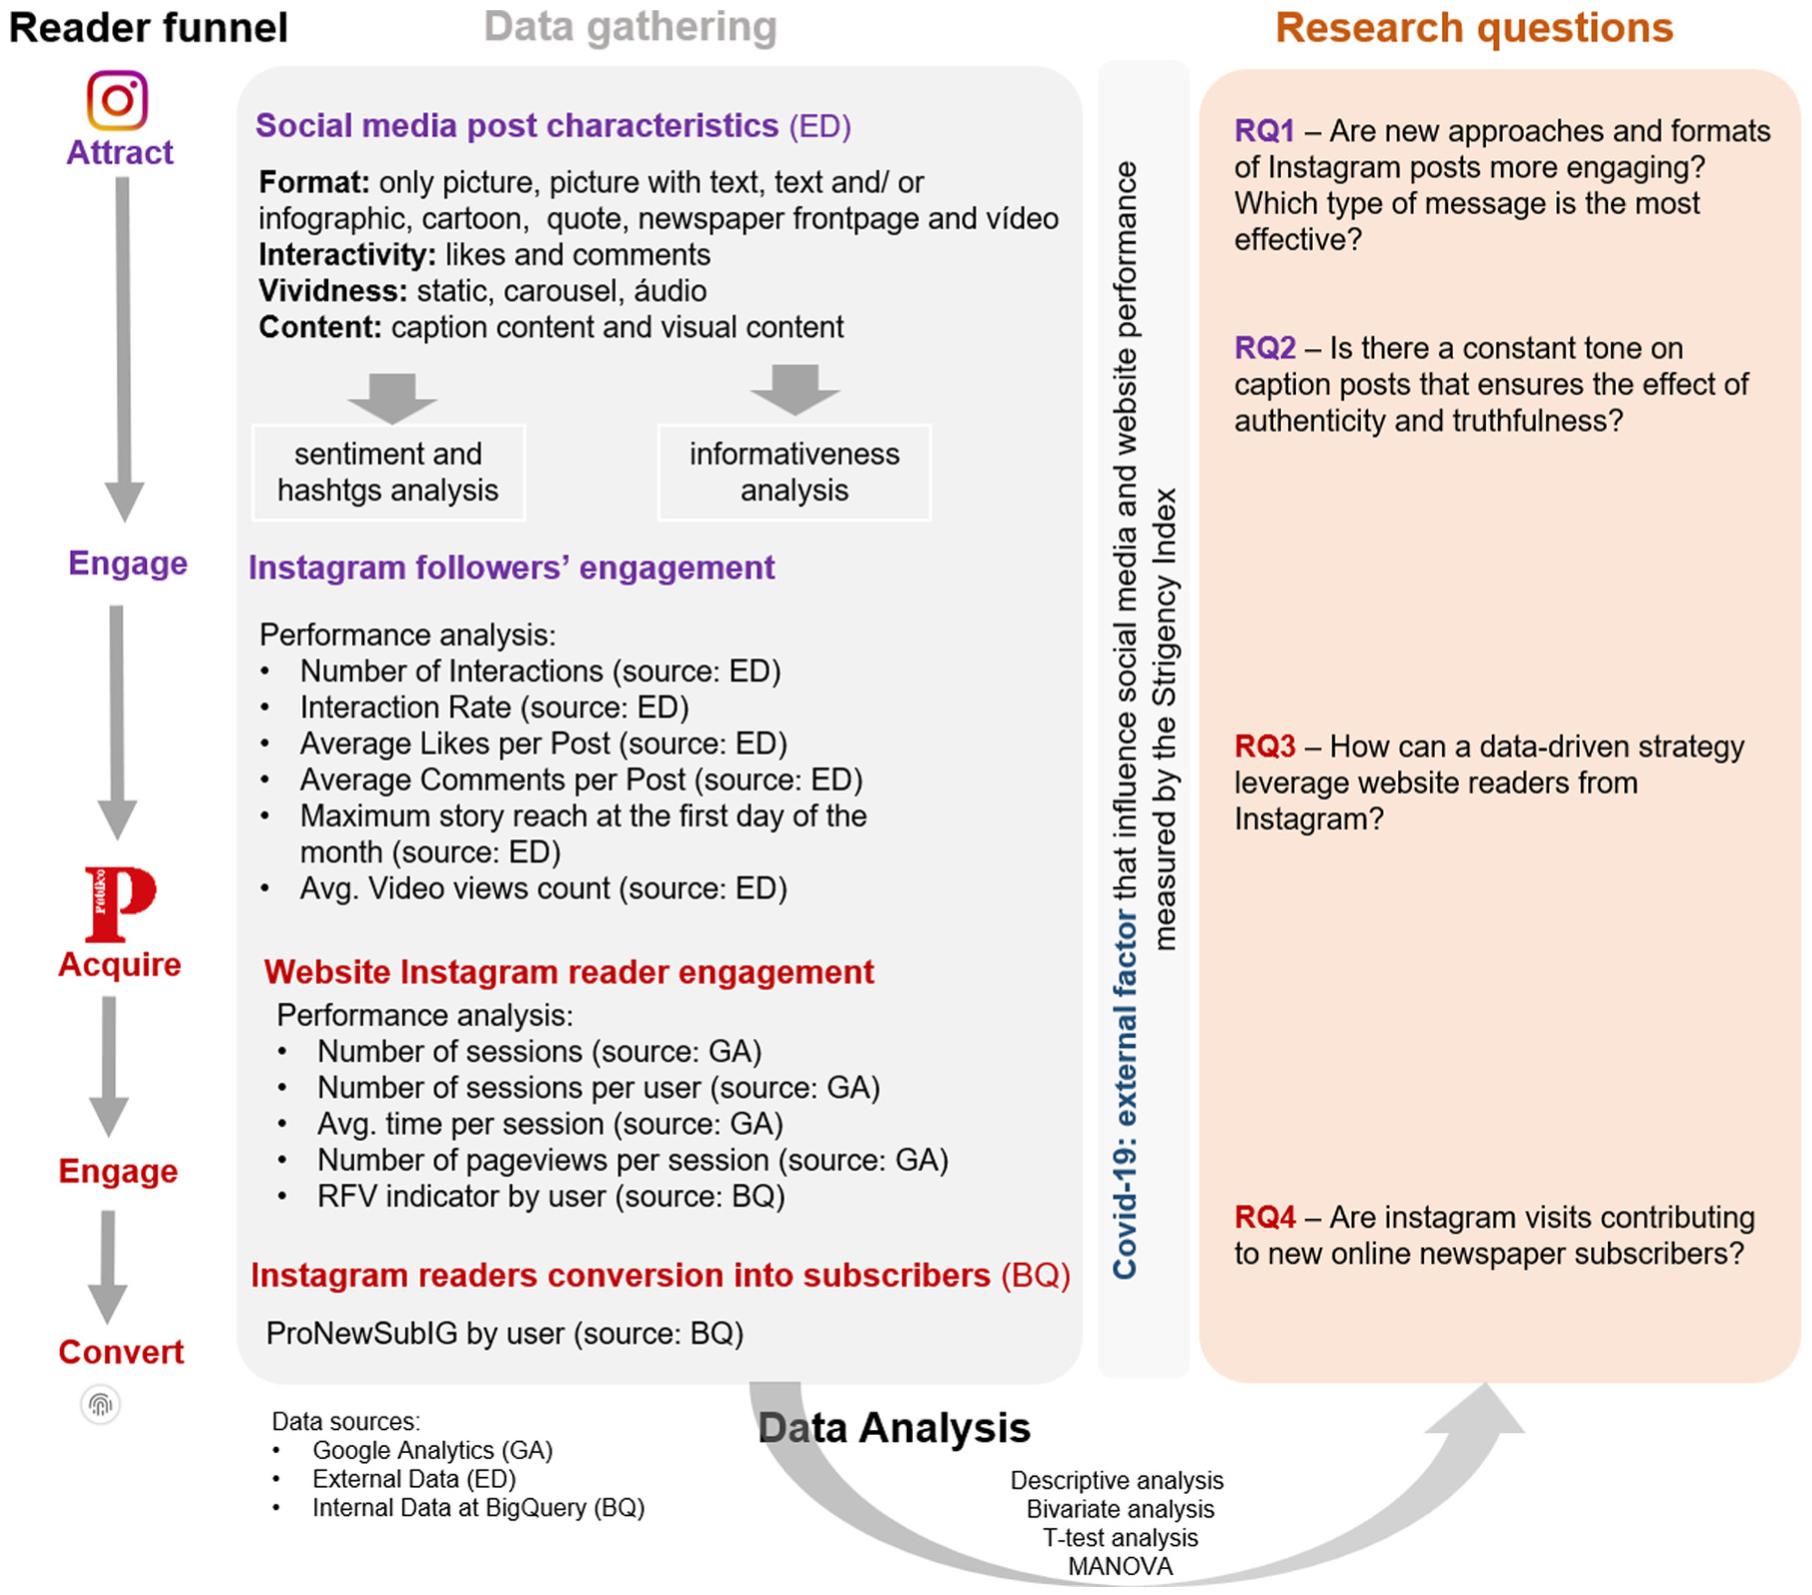
This figure delineates the operational variables and RQs mapped across the successive stages of the reader conversion funnel.
3. Methodology
3.1. Editorial and content strategy of Público
In the daily routine, SMEs monitor audience engagement by quantifying levels of attentiveness and interactivity to continuously improve and create more engaging and relevant content posts. This dynamic workflow is sustained by a multidisciplinary team integrating expertise in graphic design, content distribution, and data analytics elements dedicated to the empirical testing of innovative engagement strategies. Guided by real-time dashboard analytics and predefined key performance indicators (KPIs), the team systematically adapts creative approaches to align with the evolving behavioural patterns of Instagram users. Hence, the main goal in the digitalization and platformization of Público journalism was to raise readers’ engagement along the reader funnel [3] (see Figure 2) by distributing the right content at the right time in the right format.
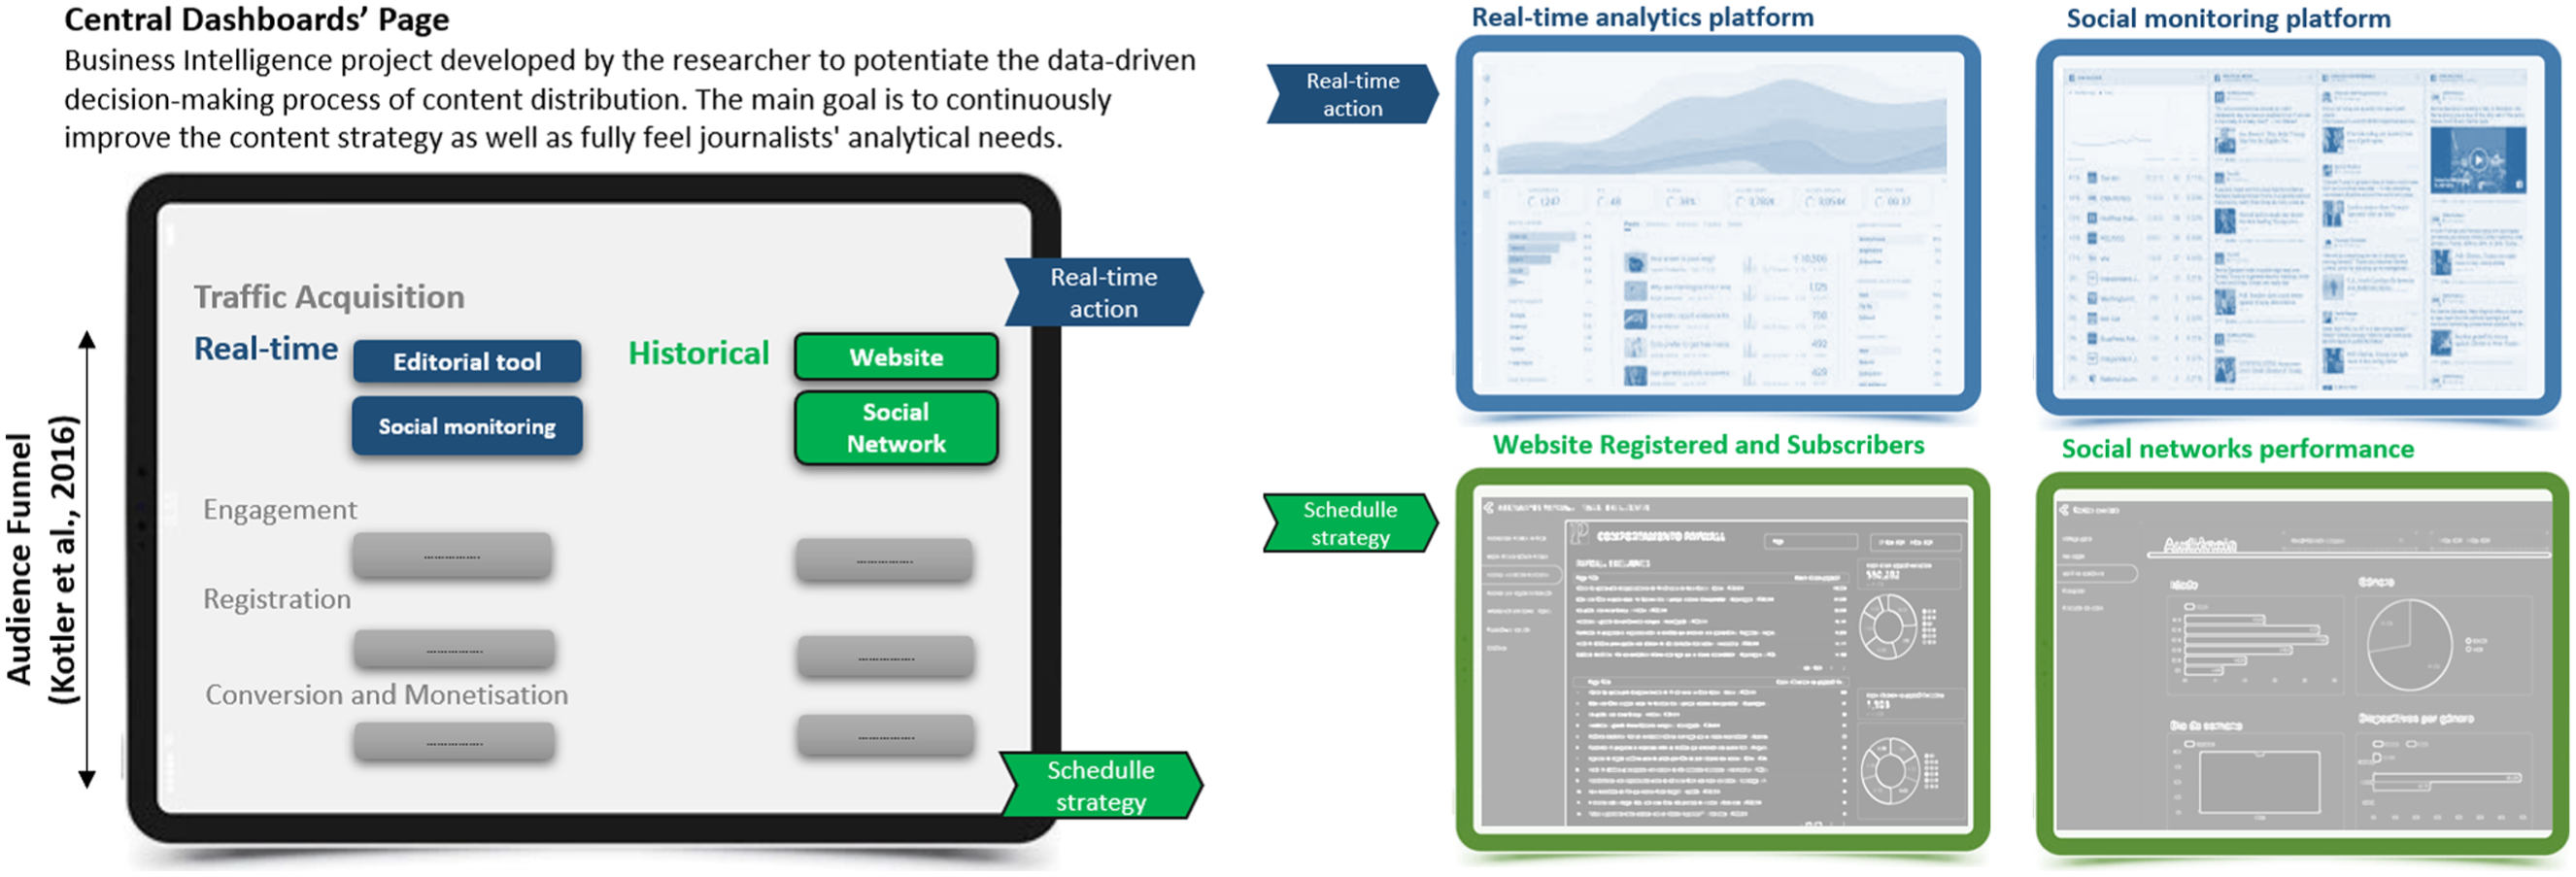
This schematic illustrates the synthesis of real-time and historical data streams from web and social media platforms, operationalized through a centralized Google Looker Studio (formerly Data Studio) ecosystem [64].
Thus, the researcher made available a central dashboard page (see Figure 2) to allow SMEs to easily find the main information to drive the decision-making process (real-time and historical data, respectively, shown in blue and green colour). Thus, depending on SME information needs, they can take real-time decisions based on what is happening now by using real-time dashboards, or what the trend was in the past by analysing historical dashboards. As an informed data-driven process, the team analyses the content produced by journalists and decides which stories can be promoted on Instagram. Furthermore, SMEs do not influence content production induced by engagement metrics; they optimize content distribution.
The following sections delineate the iterative decision-making framework employed by SMEs, characterized by its responsiveness to real-time audience metrics and its commitment to delivering high-utility, empirical information. This strategic workflow is fundamentally anchored in the core institutional values of Público, ensuring that content distribution remains rigorous, authoritative, and intrinsically valuable. By synthesizing real-time behavioural analytics with traditional journalistic standards, the process bridges the gap between digital reactivity and editorial integrity.
First, to take real-time decisions, SMEs combine information from the real-time analytics platform (see blue colour in Figure 2) and the social monitoring platform to monitor content performance across channels, devices, or user types, as well as to monitor and discover misinformation spread in SM that can be clarified with Público content. The goal is to optimize content distribution by channel, along with informing and clarifying the misinformation that is over-performing in other SM accounts. As an example, the content presented in Figure 3 shows a carousel post and a story that clarifies to readers about the hypothetical pandemic end.
Second, by identifying the content produced by the newsroom that needs to be posted on Instagram (i.e. content ideation), the team defines the design approach (content creation) and selects the right time for publishing. Furthermore, BI work from the researcher was performed to develop proper dashboards that provide historical data from different sources (see at Figure 2 in green colour we present the information flow related to historical data. Those pages provide top articles read by registered readers and subscribers, which allows the editor to see levels of engagement by tag or section). Furthermore, the dashboards allow SMEs to analyse previous decisions, to decide the content to schedule, and to promote content on Instagram according to followers’ profiles as well as previous content performance. Dashboards developed by the researcher allow the comparison of behaviours between anonymous, registered, and newspaper subscribers. Thus, by customer type, SME can compare engagement KPI’s across social media sources and devices in the green section at Figure 2.
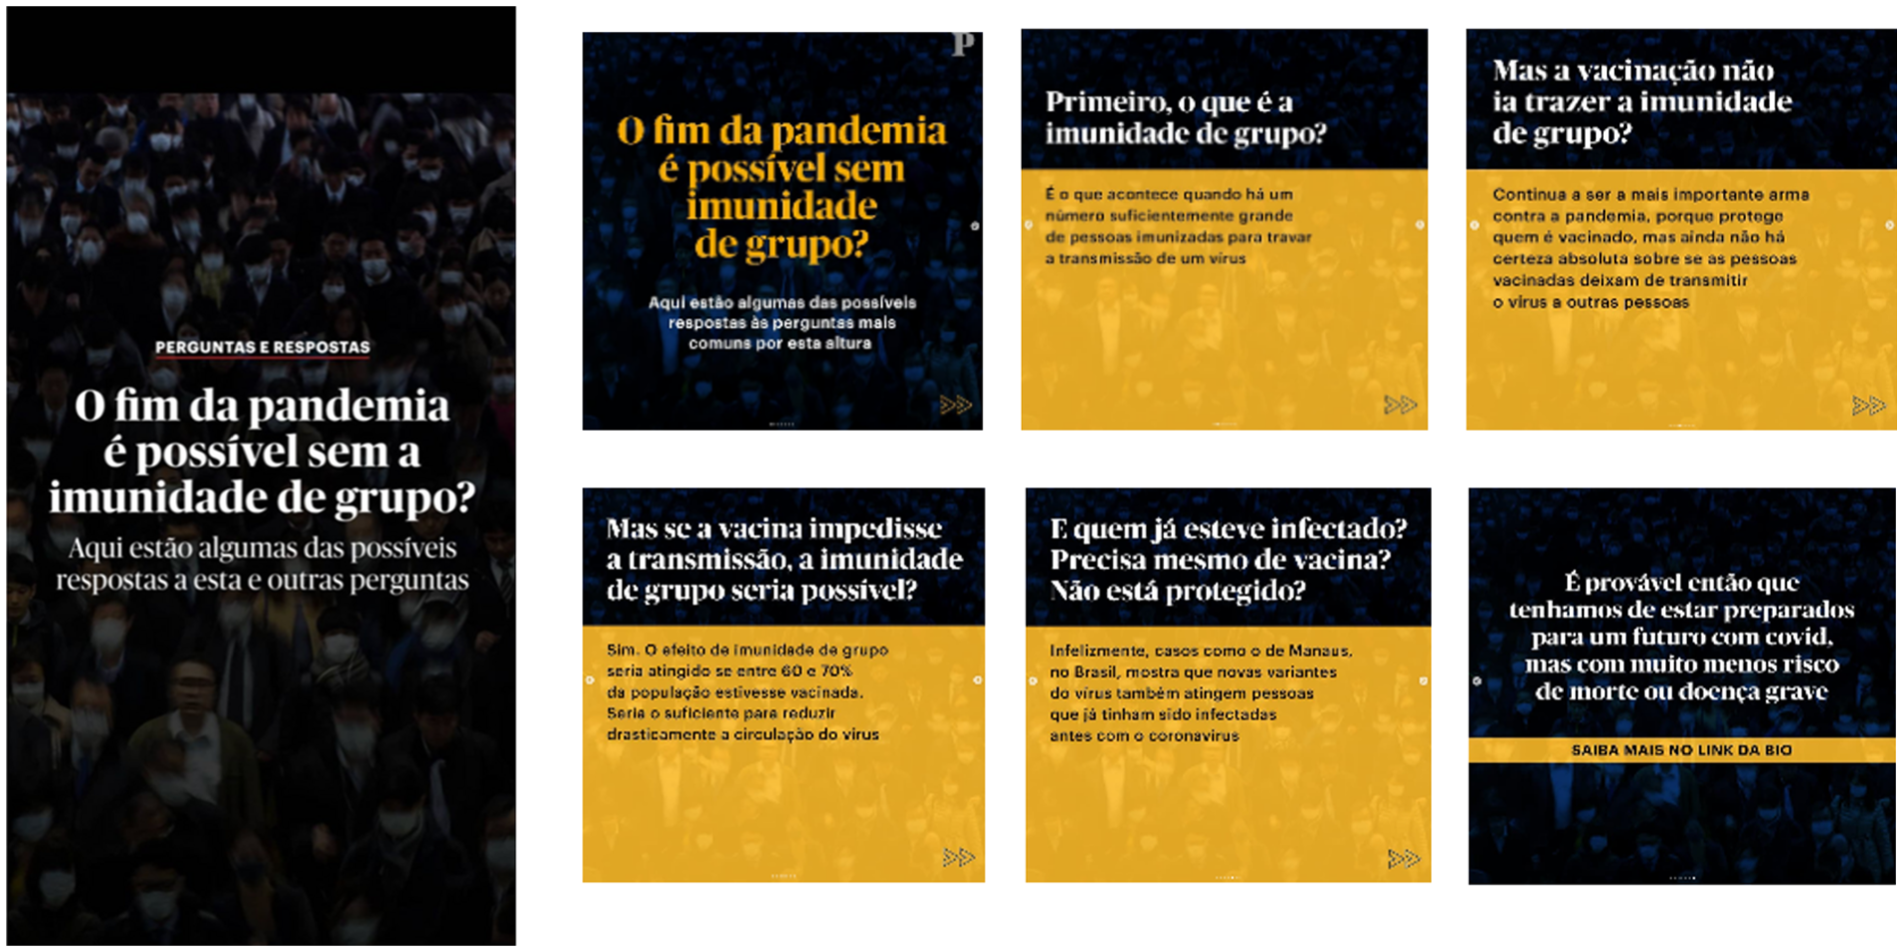
Example of an informative quiz, posted in a story and in a carousel, about group immunity and the possible pandemic end, posted on 19 March 2021.
As an example, evergreen content, that is, content that is consistently of readers’ interest [64], is presented at the historical dashboard. By cross-checking the matters that had good performance by hour or day of the week from Instagram, and the evergreen content for this target, the SME decides the content to schedule on Instagram. As an example, in Figure 4, two types of content are presented, one related to Alzheimer’s disease and the second about the bees’ world. Both are multimedia formats produced by the newsroom that SMEs posted because usually Instagram followers engage with these formats and content.
Finally, entertainment content, such as pictures or videos, is scheduled according to the best days and hours for this format.
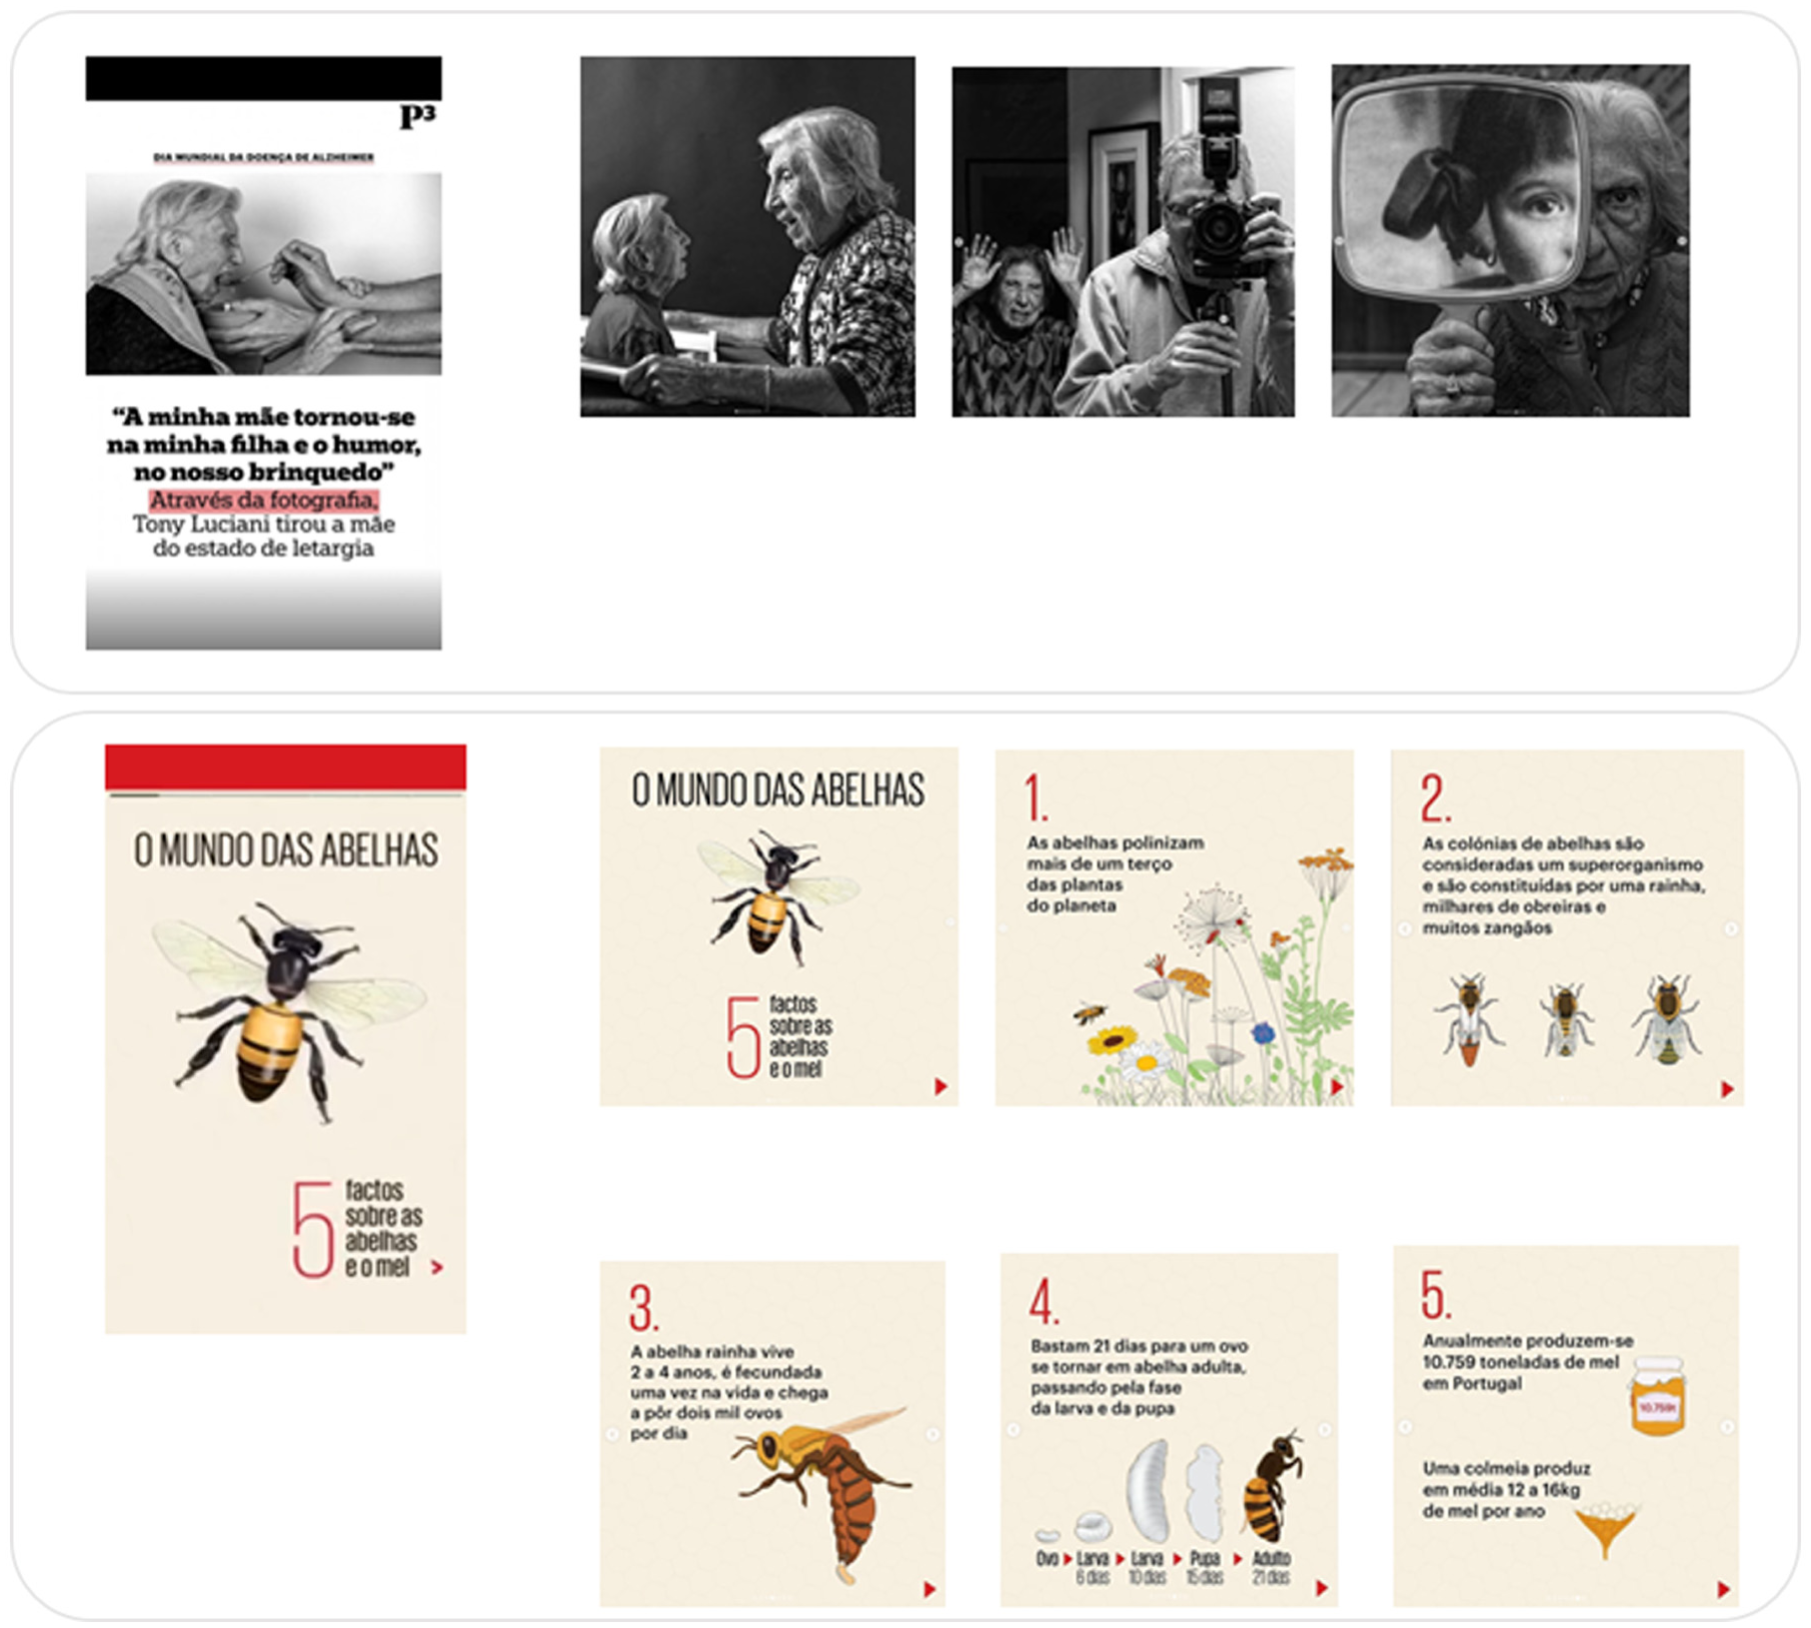
Example of content about Alzheimer’s disease posted on 21 September 2020, and the “bee’s world” posted on 6 June 2020.
The team also focuses on writing informative text in the posts, with an unbiased tone to ensure neutrality and steadiness [11], and a careful hashtag selection. Moreover, the team meets frequently with the design team to improve content ideation, creation, and planning, always focused on readers’ profiles (i.e. readers’ age and preferred tags). For SMEs, it becomes clear which audiences they want to focus on and the goals to achieve.
3.2. Data gathering
To evaluate the efficacy of the implemented strategy, this section delineates the multi-source data set synthesized for this study. To explore the dynamics of user engagement and conversion during the COVID-19 pandemic, Público provided access to primary data derived from four distinct sources: website data via Google Analytics (GA) [65], granular internal records retrieved from BigQuery (BQ), a Google-managed data warehouse [66], Instagram external data (ED) extracted through the InstLoadGram platform [67], and epidemiological data sourced from the Our World in Data repository [68] (as presented at Figure 4). Quantitative analysis and data processing were executed utilizing Microsoft Excel in conjunction with the R statistical computing environment [69].
As prior research suggested that there are several factors affecting the popularity of posts and subsequent engagement, such as the ease use of the technology, user motives and values, psychological factors, and post characteristics [32], the following post characteristics were collected (see Figure 1): Post date, content (caption, hashtags), interactivity (total number of likes, total number of comments, and total number of views by post), vividness (is carousel, is video, has audio), and video duration in seconds. Then, the number of hashtags per post and the number of words per caption were calculated. From Instagram, we also saved user profile characteristics such as age, gender, and city, as well as competitors’ public data such as the number of followers.
Among the KPIs to analyse website users’ engagement (see Figure 1), we highlight the time per session, typically expressed in seconds, an important KPI for publishers [57] that measures Instagram users’ attention to the content on the website. Furthermore, at the individual level, we monitor the multi-dimensional RFV, an indicator of the reader’s behaviour, implemented in September 2020, as well as the number of new subscribers who made at least one visit from Instagram during the subscription month. That allows us to calculate the ProNewSubIG, which is the proportion of new subscribers with website visits from Instagram. These indicate how Instagram readers are converting into subscribers.
Besides, we added an external variable, the Stringency Index (see Figure 1) that “is a composite measure based on nine response indicators including school closures, workplace closures, and travel bans, rescaled to a value from 0 to 100 (100 = strictest)” [68]. After the initial data collection, we perform a descriptive analysis presented as follows.
4. Results
4.1. Message type and format analysis
In this section, we will focus on posts’ characteristics by studying posts’ interactivity, format, vividness, and content by post type, along with website users’ engagement and conversion metrics. Message strategy and engagement effectiveness were examined. Microsoft Excel and the R statistical tool [69] were chosen to conduct the analysis.
Then, to analyse Instagram posts’ effectiveness, all 2202 posts published at the Público Instagram account from January 2020 to September 2021 were scraped in November 2021. Content shared may be in a variety of formats, such as text, static or dynamic visuals, or a combination of all these [32]. Furthermore, each post can be published in a carousel-horizontal format, that is, by using multiple photographs or videos that can be viewed by swiping or clicking left. Thus, inspired by the study [48], posts were manually categorized into seven types: only picture, picture with text, text and/or infographic, cartoon, quote, newspaper frontpage, and video (see Table 2).
Instagram post statistics by format considering vividness levels and interactivity metrics.
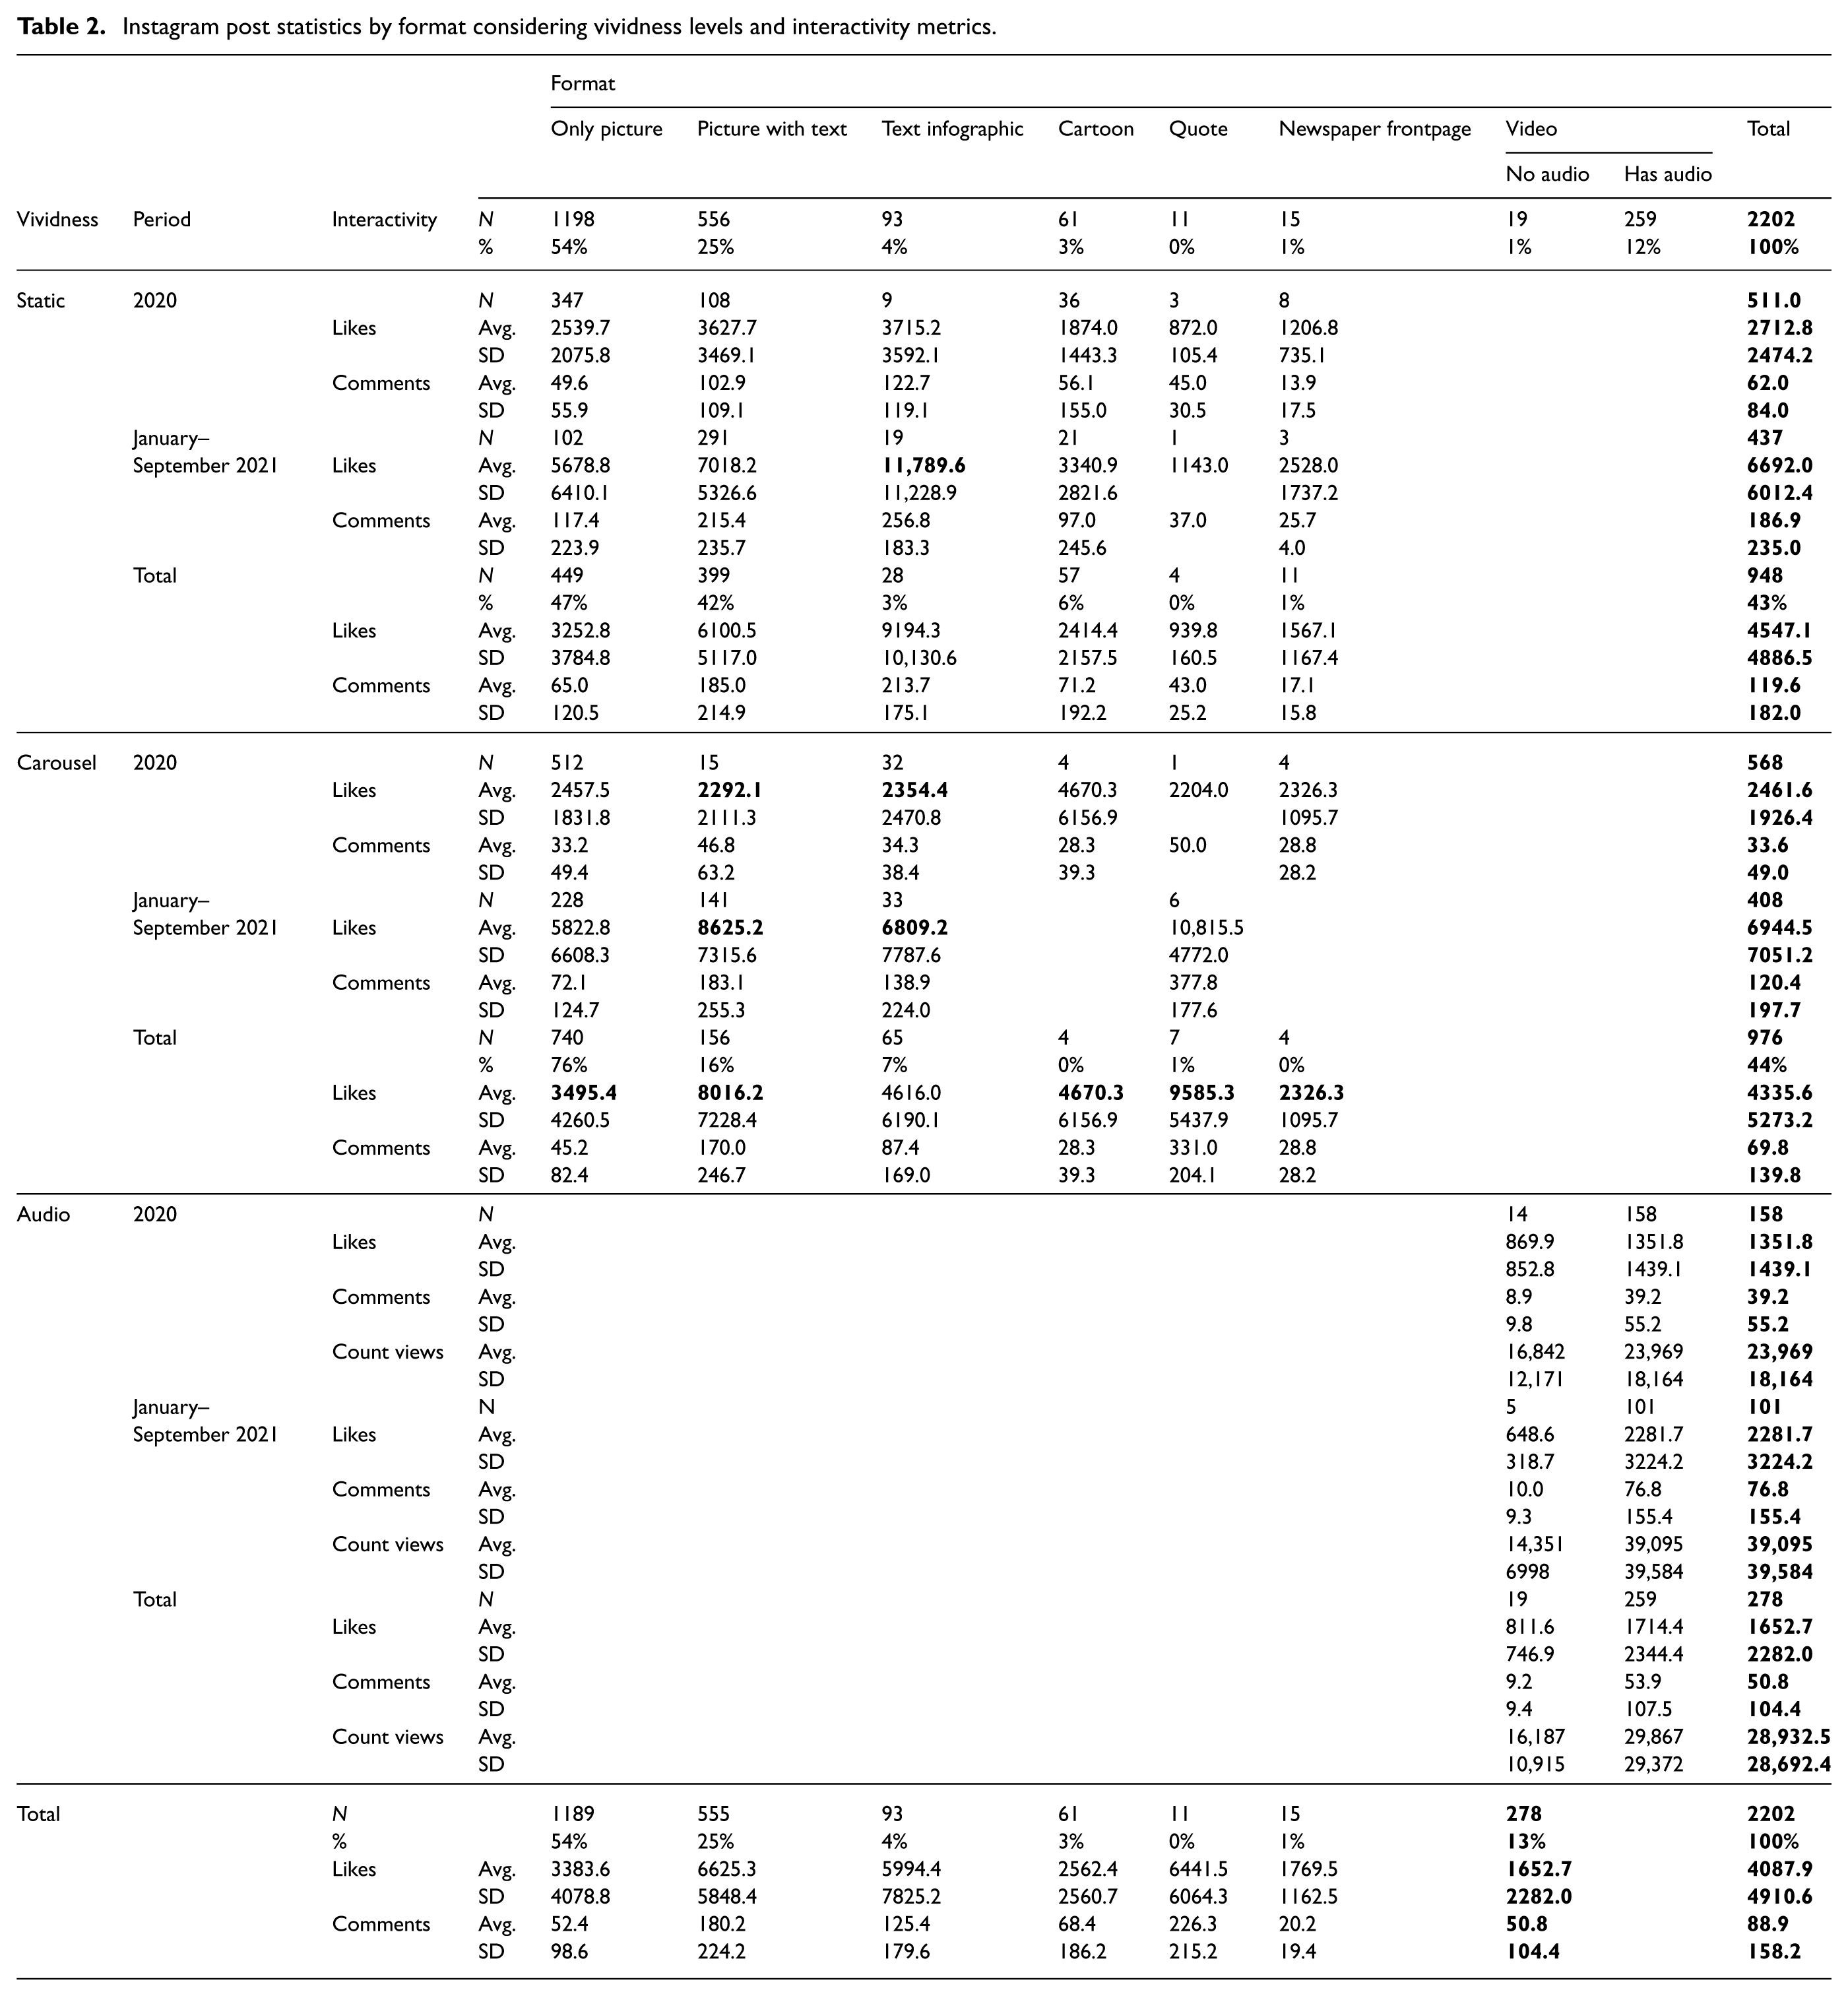
On the sample (see Table 2), less than half of the posts were static (948), most of which were in the form of a simple picture (47%) or a picture with text (42%). From all the content shared, 44% were carousels, 12% were videos with audio, and only 1% were videos without sound. In terms of post format, the most frequent (54%) was only a picture with 740 carousel posts and 449 static.
Despite the pandemic reality, in the first semester of 2020, Instagram engagement KPIs flattened (see Figure 5(b)). Thus, in the last trimester of 2020 (yellow box at Figure 5), a data-driven approach combined with an iterative editorial decision-making process was tested to address content readers’ needs and preferences according to dashboards’ information, coupled with design improvements. Depending on the content presentation, the level of interactivity differed. Thus, by experiments, the post’s performance was continuously analysed to improve the next decision-making. As presented in Figure 5(a), more pictures with text and text infographics were posted. This resulted in a decrease in only picture posts (from 347 to 102, between 2020 and 2021, see Table 2).
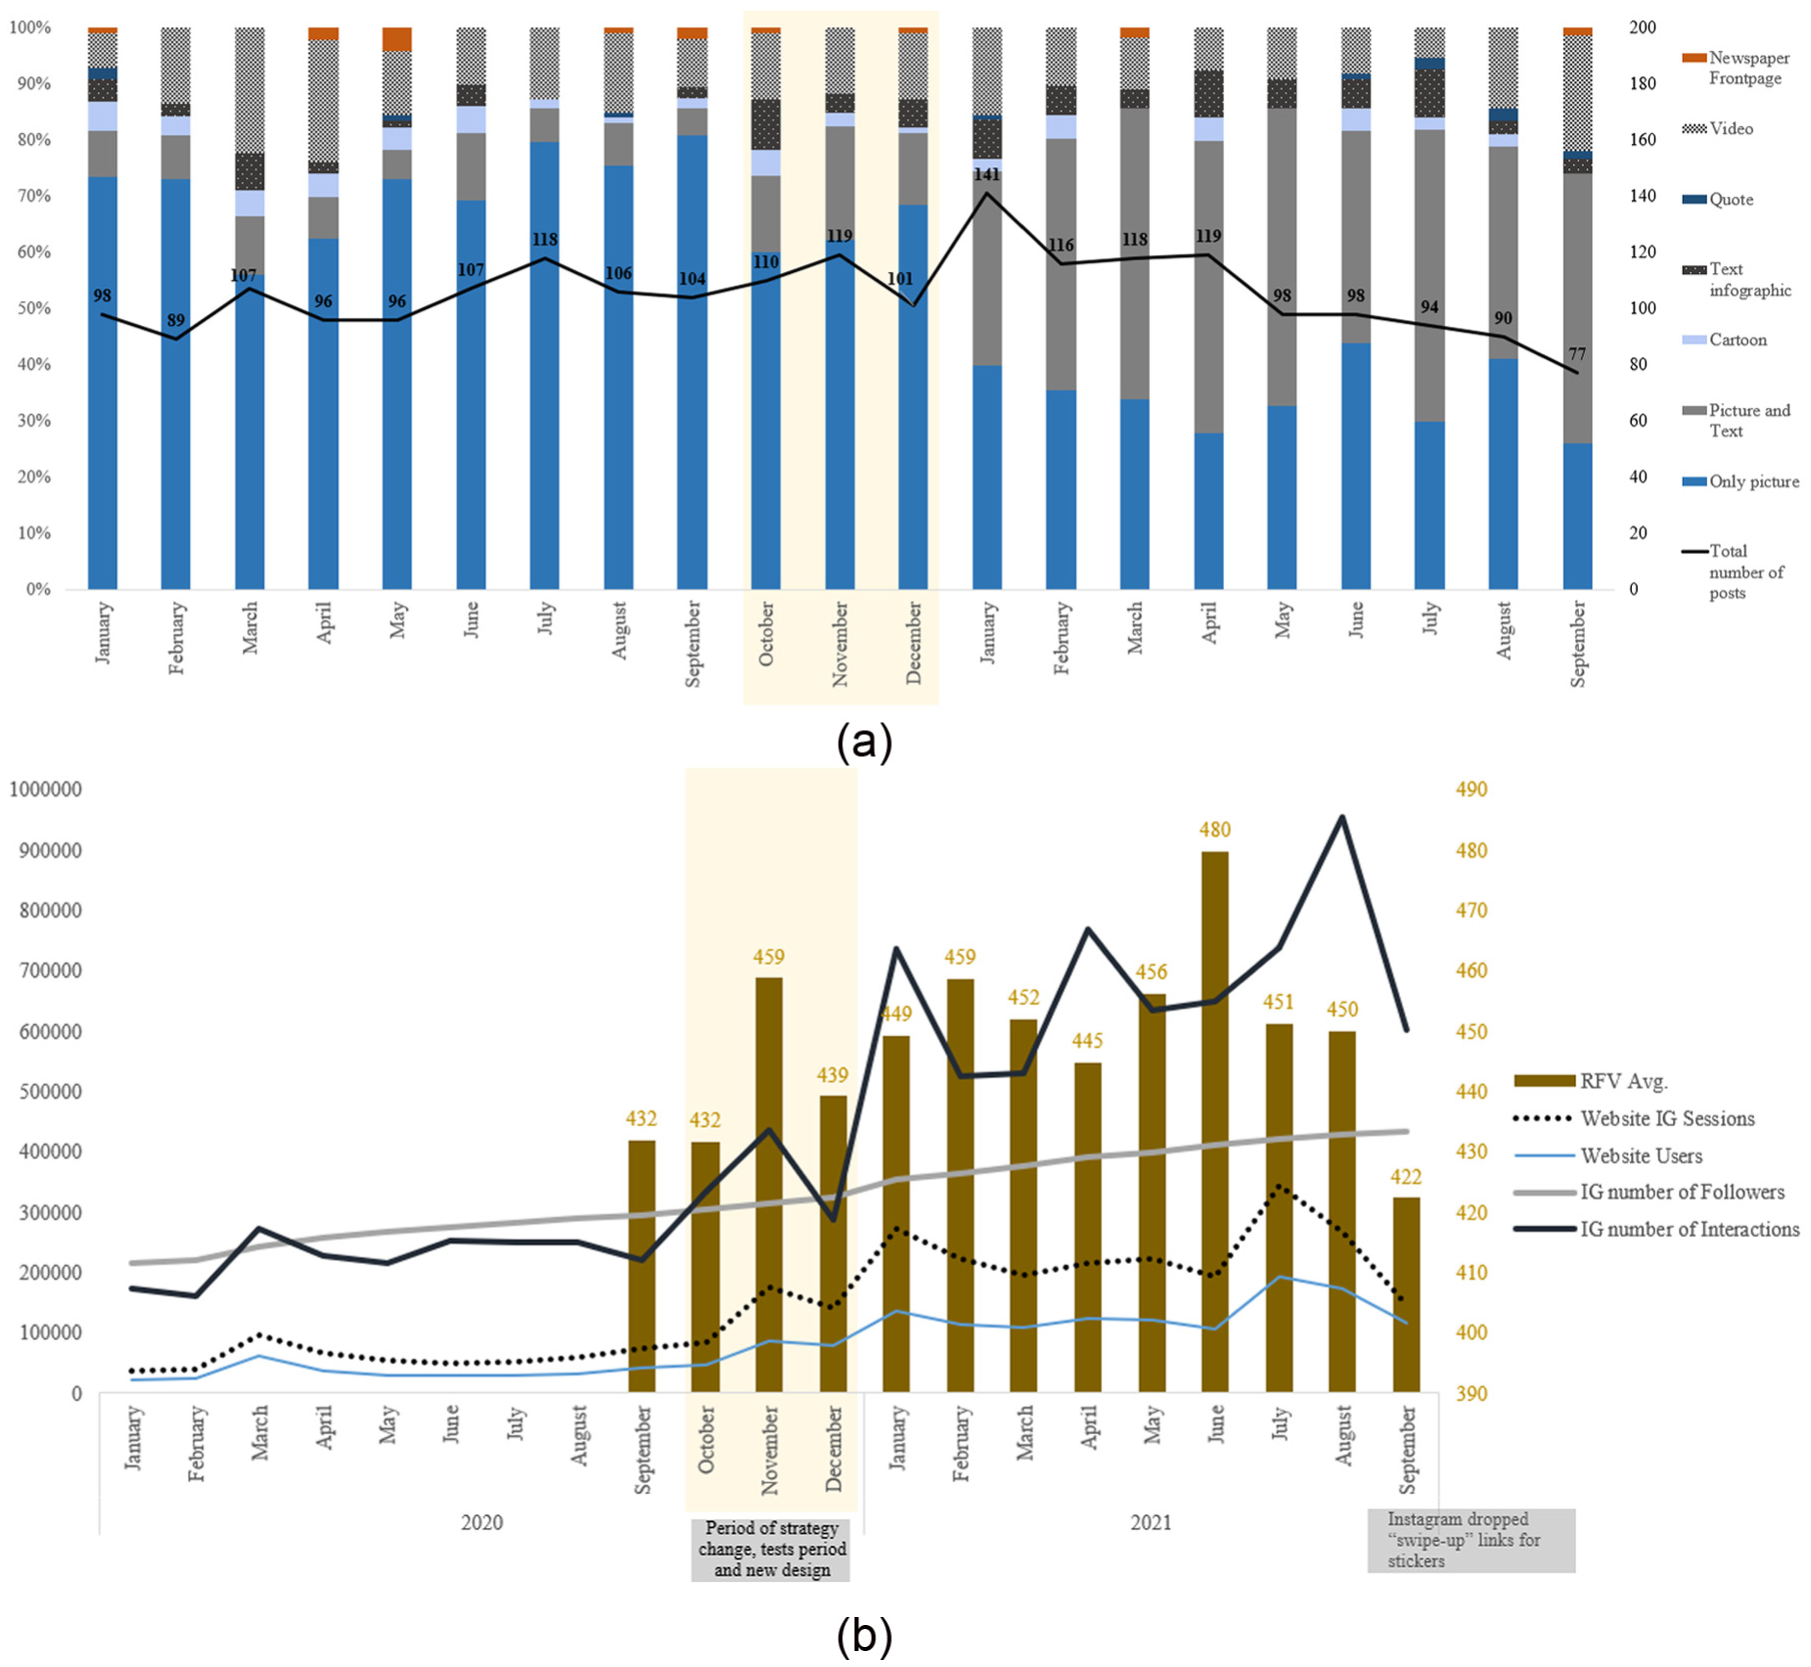
(a) Monthly posts by post category and (b) website number of users from IG, sessions, and, respectively, average RFV, plus Instagram followers and interactions during the timespan under study.
In terms of interactivity, among the posts analysed, the mean number of likes was 4088 with a standard deviation of 4910 (see Table 2) as a result of different types of post content and vividness. Pictures with text posts verified the highest average number of likes (6625.3), followed by posts with author quotes (6441). Interestingly, the increase in average likes between 2020 and 2021 on pictures with text in carousel format (from 2292.1 to 8625.2), as well as text and/or infographic (from 2354 to 6809), reflects the importance of explaining the content visually and dynamically. This finding is consistent with the work of the author [49], which suggests that solutions-oriented photojournalism leads to higher user engagement [70].
Unsurprisingly, carousel posts revealed a high average number of likes by formats (see Table 2), except for the infographic. Researchers argue that vividness features in posts lead to higher total interaction [32]. In our sample, static text infographic posts verified the higher average likes in 2021 (11,789.6), because those posts were related to pandemic news and closures clarifications.
In what concerns comments, the average number of comments is higher on quotes (226.3), followed by pictures with text (180.2), proving that visual content with text promotes user reaction [70]. Furthermore, posts with author quotes on carousel present an average of 331 comments, revealing higher reader involvement in narrative content. These results are consistent with the work of the author [70].
To empirically examine the influence of the type of image content on reader engagement, a t-test was applied to compare the average likes by year (see Table 3). There is a statistically significant difference in the following formats: only picture, picture with text, cartoon, text infographic, and quote, proving the positive impact on interactivity as a result of the editorial process followed.
t-Test: Two-sample assuming unequal variances.
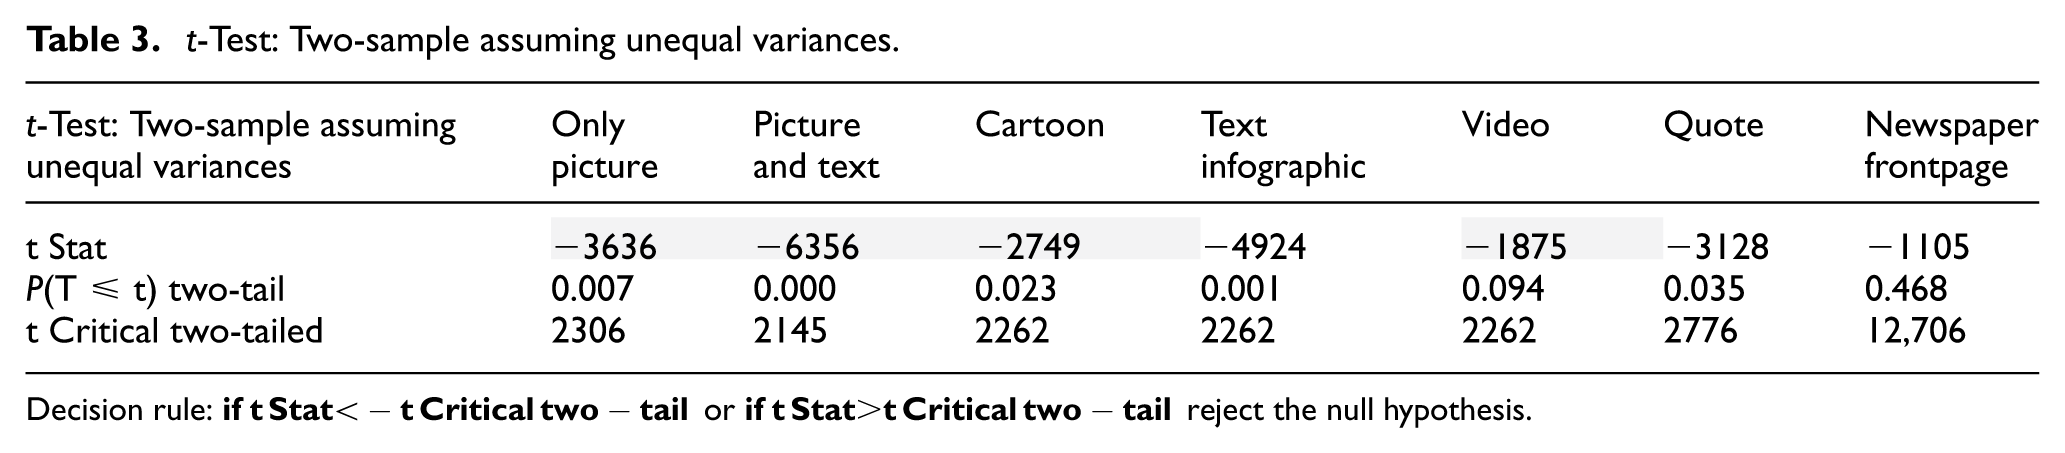
Decision rule:
To analyse the effects of message type on the number of likes and comments. An MANOVA was conducted by using the post format as the independent variable. The overall MANOVA (Multivariate Analysis of Variance) tests of Pillai’s are significant (
4.2. Text analysis
In terms of text content features, we consider the influence of caption content and visual content. Therefore, on the caption, we study text sentiment and text dimension (number of words and number of hashtags); on the image, we analyse informativeness, that is, if the image was edited by adding text or not.
The sentiment score was calculated through the sentimentR package using the open-source R statistical tool [69]. SentimentR was designed to calculate text polarity sentiment (TPS) at the sentence level and optionally aggregate by rows or grouping variable(s) [71]. For corpus handling and text preprocessing, we used the tm [72], the NLP [73], and the qdap packages [74]. Preprocessing involved punctuation, numbers, and white spaces removal, as well as Portuguese stopwords such as “de” or “a.” A score of 0 means that after the algorithm processed the sentence, the net emotional polarity was zero. This happens in two main scenarios:
Purely factual: the sentence contains no words found in the sentiment dictionaries (e.g. “The table is made of wood”).
Perfect balance: the sentence contains positive and negative elements that cancel each other out perfectly (e.g. “The movie was good, but the performance of the actor was bad”).
In this study, the descriptive statistics indicate that captions tend to be neutral (
Furthermore, by calculating a term frequency-inverse matrix, the words with more relative importance among captions emerge. As expected, in the top 10, we found Portugal, Lisboa, covid, pandemia, mundo (world), and coronavirus. Also, we note that words like animais (animals), pessoas (people), ambiente (environment), and natureza (nature) are also frequent, revealing the diversity of content published.
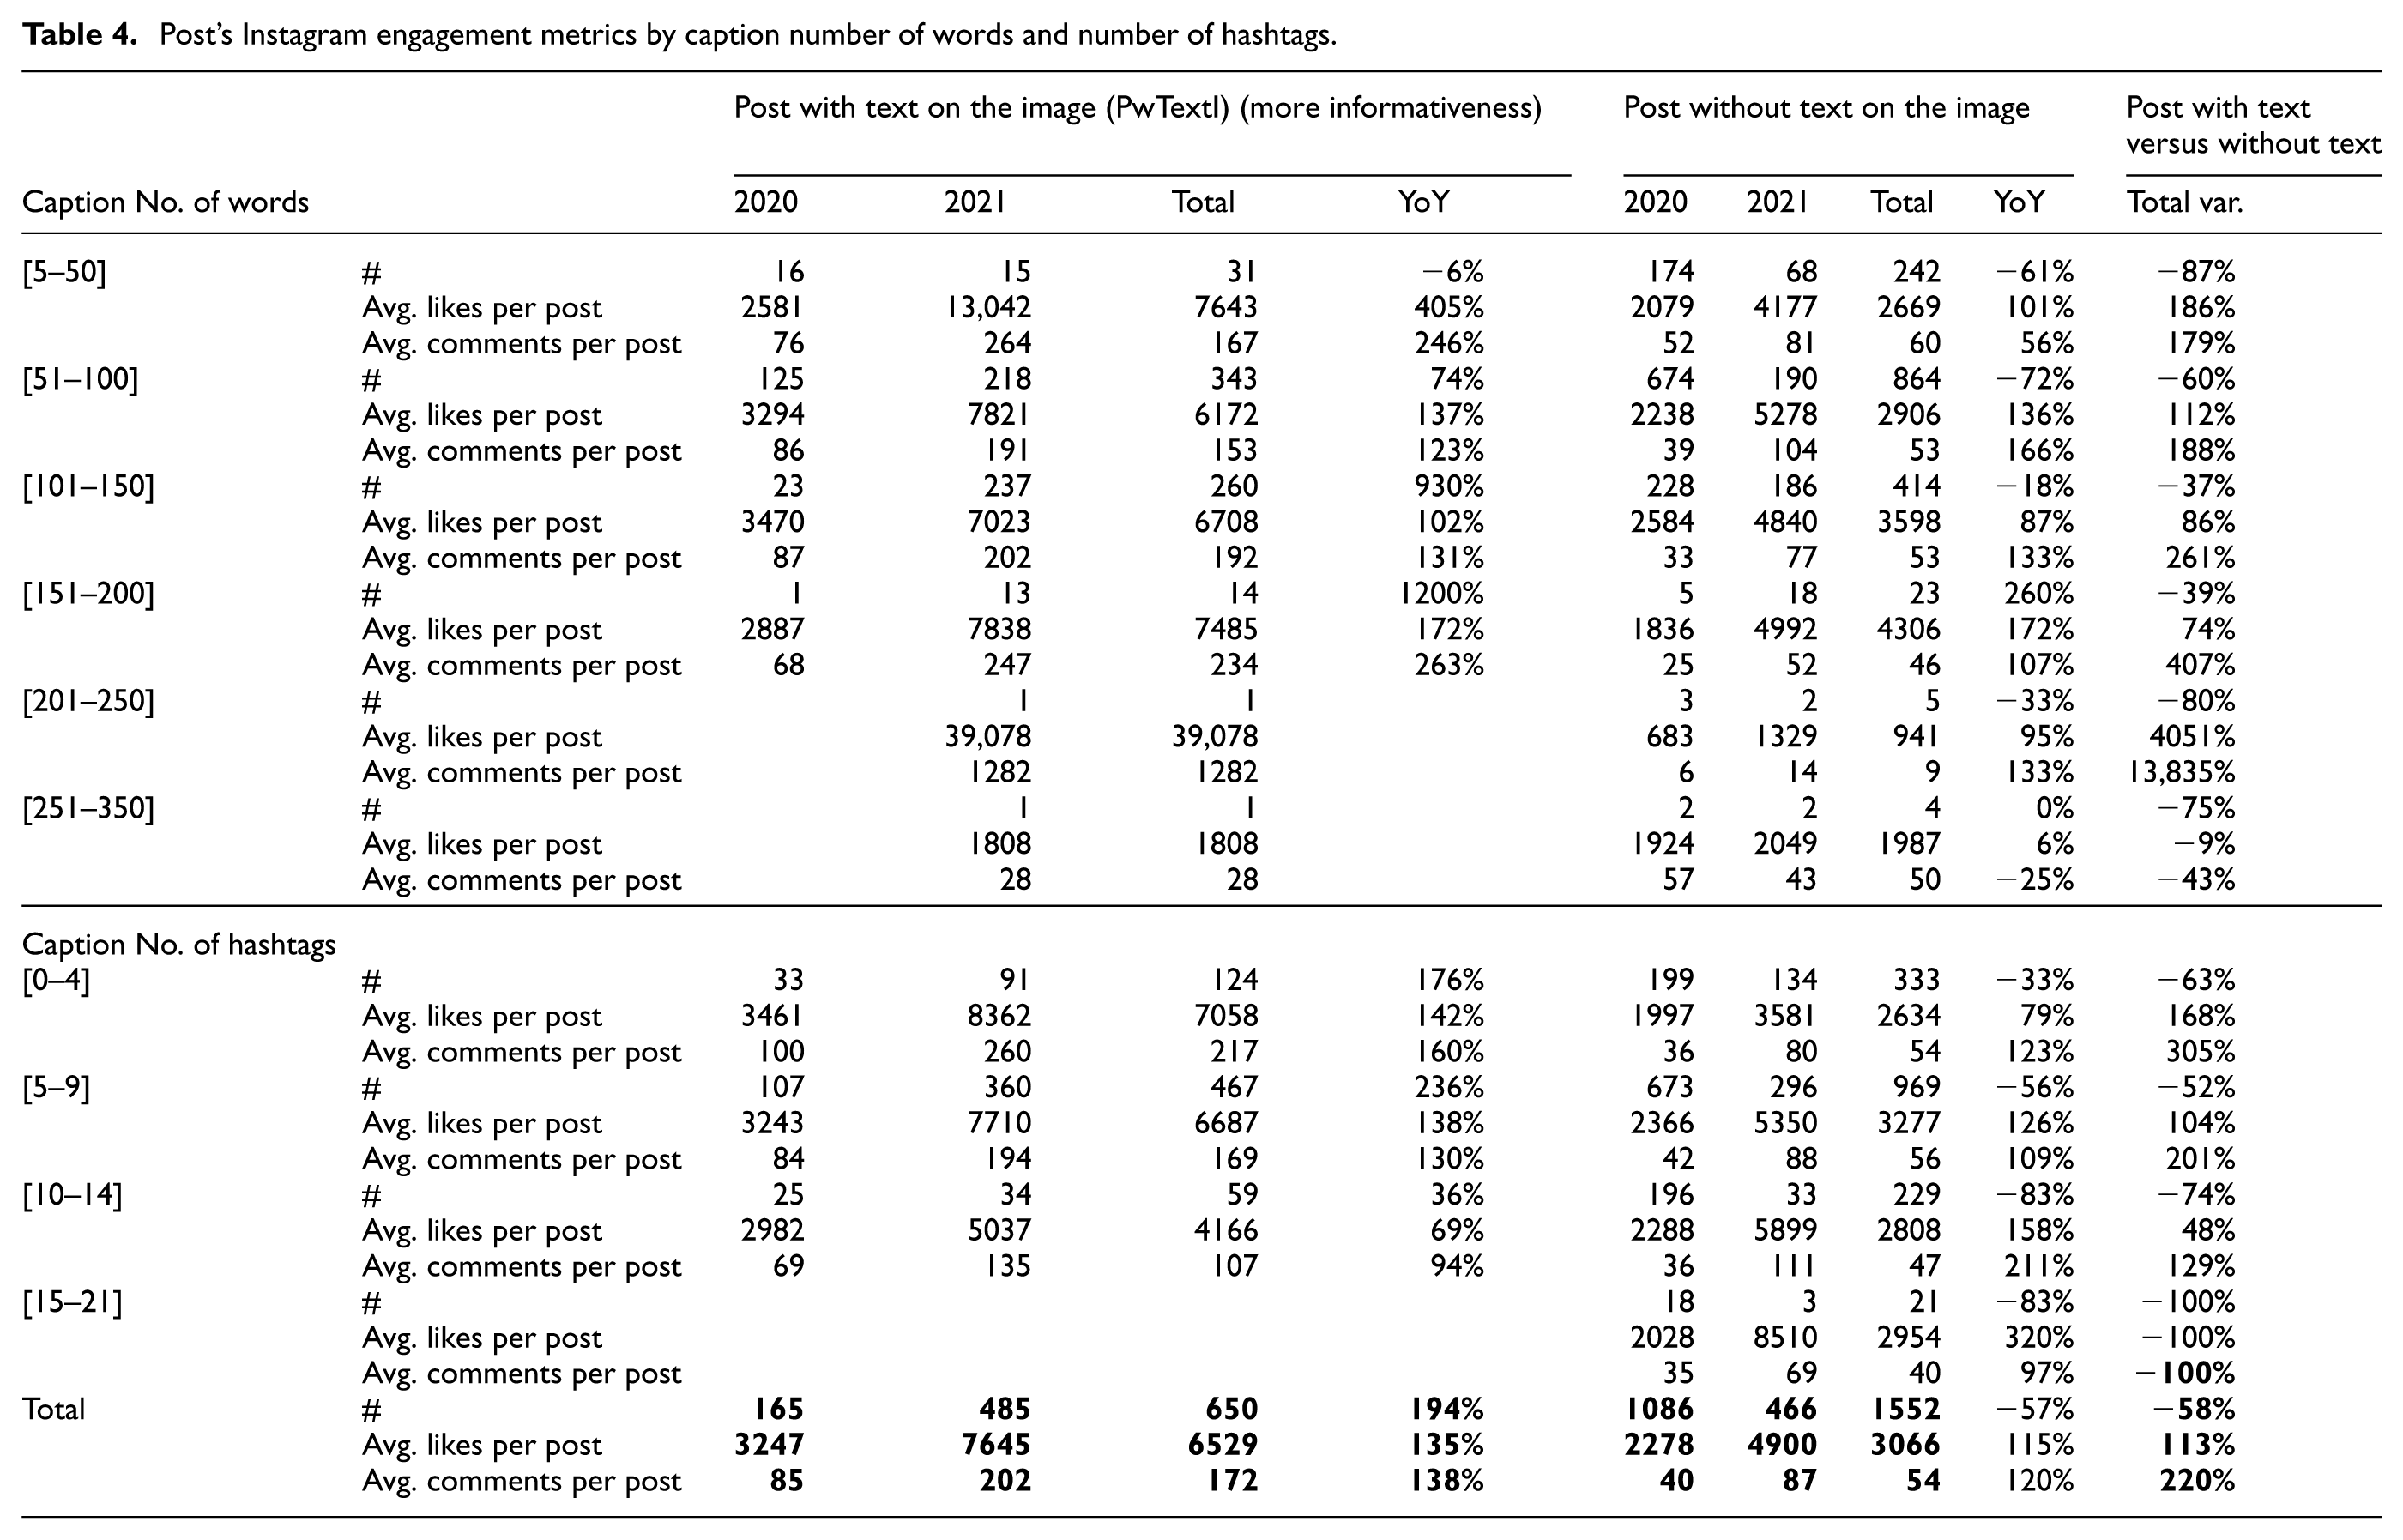
Moreover, the text dimension was studied by calculating the number of words and hashtags. The number of post words ranges between 6 and 284 words, with an average of 80. The number of hashtags varies between 0 and 20, with an average of 7 per post. Thus, the variable number of words was categorized into six classes and the variable number of hashtags into four classes, as presented in Table 4.
Post’s Instagram engagement metrics by caption number of words and number of hashtags.
Among the 4149 hashtags, the authors also examine hashtag frequency and the engagement KPIs registered on the respective hashtags’ posts. On the most used hashtags, we found #covid (644), #portugal (346), #pandemia (300), #coronavirus (177), #pandemic (160), and #animais (153). Between the hashtags with frequency higher than 50, we found #ambiente, #natureza, #ciencia, or #sociedade. However, the most used hashtags are not necessarily related to the hashtags from posts with high interactivity. Therefore, we calculate an engagement score that sums the normalized average number of likes per hashtag and average number of comments per hashtag, giving each one a weight of 50%. A hashtag with a high engagement score value indicates that, among the sample, this hashtag was used on posts that registered the highest average number of likes and average number of comments.

For instance, #Tokyo presents the highest engagement score (3.21) in 2020, despite being the 48th hashtag most used. While, in 2021, #sociedade presented the highest score (4.55), and it was in the 45th place of the rank (see Figure 6). Furthermore, the year 2021 presents more hashtags with positive scores (24 versus 19 in 2020), indicating more engagement in a wide variety of matters, such as architecture, Joe Biden, tourism, history, or biodiversity.
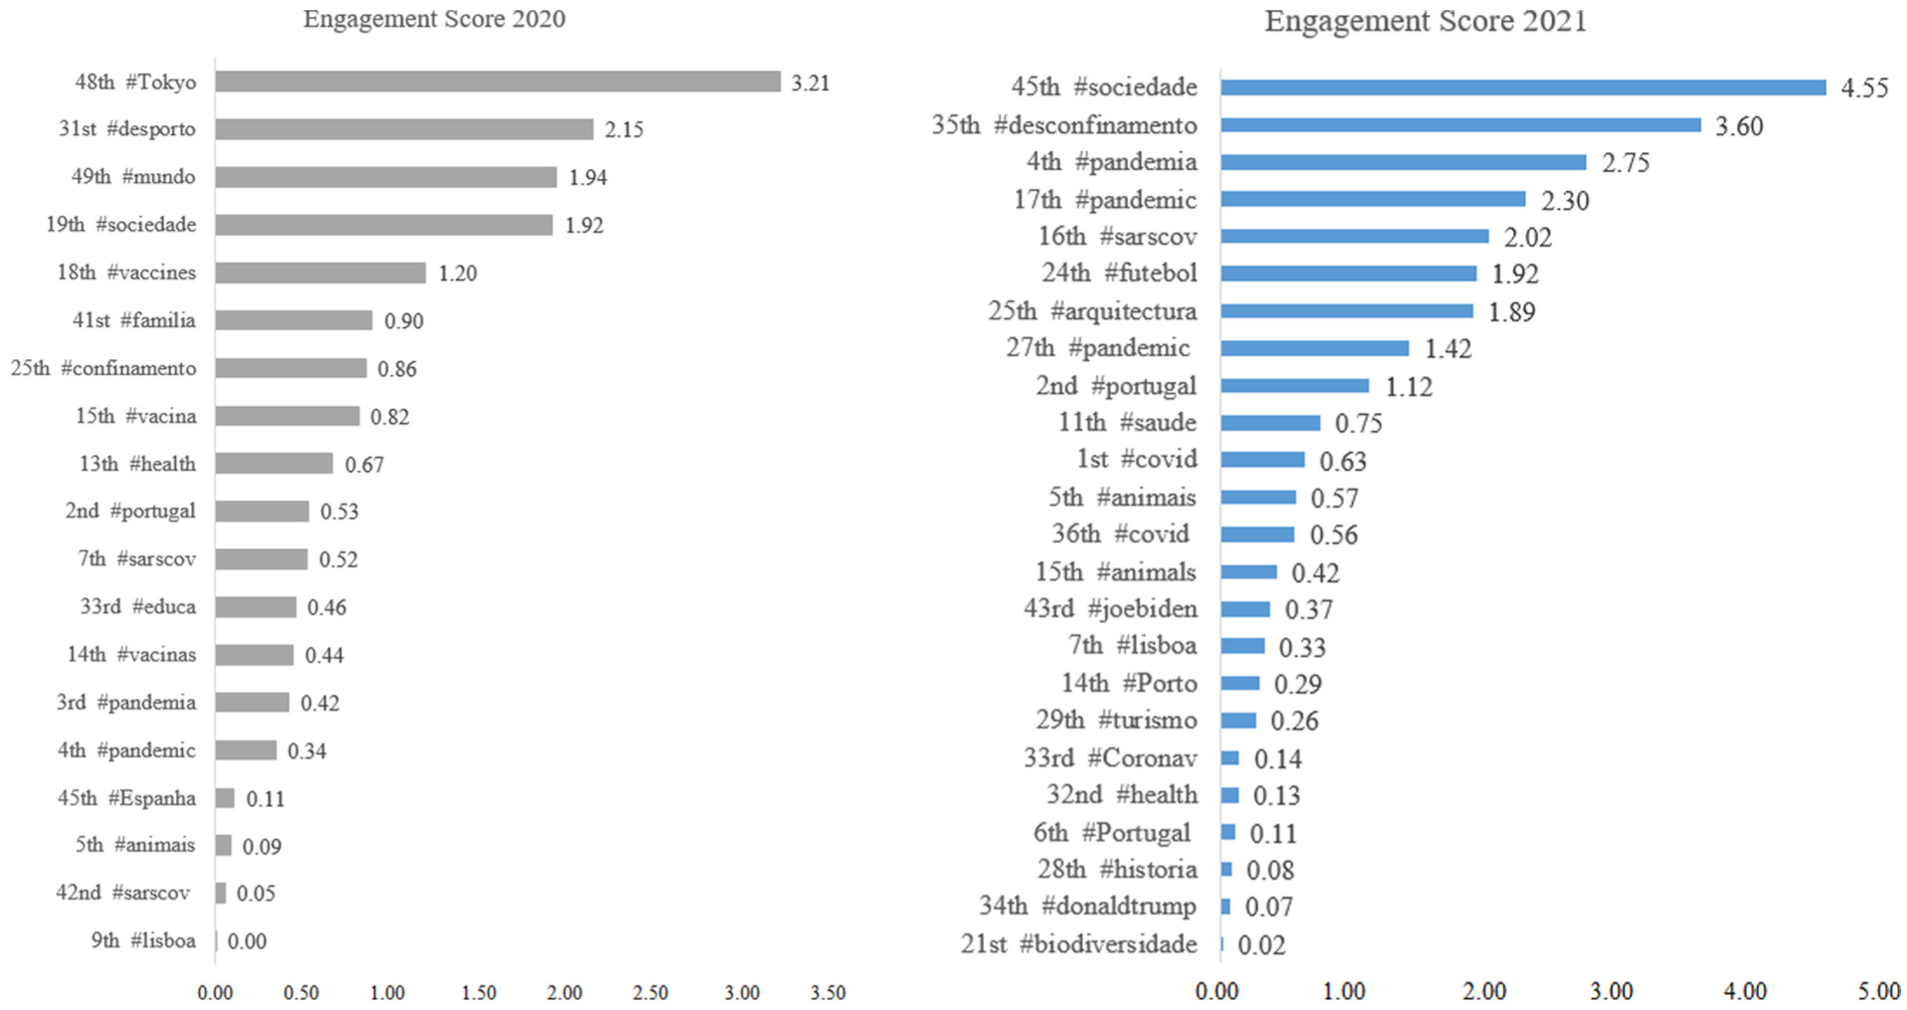
Hashtags with positive engagement score by year and respective rank position.
In both years, sports posts conquer higher levels of engagement (#tokyo, #desporto, #futebol), as well as animal posts (#animais). As expected, hashtags related to the pandemic or related to the Portuguese actuality (#sociedade) are at the top of the most engaging posts and are also the most used. Interestingly, the hashtag #covid is the first one more written on both years; however, in 2020, the average number of likes and comments by post was significantly lower than the other hashtags; thus, the engagement score was less than zero. That does not happen in 2021, indicating that the decisions made to improve content presentation on Instagram, as well as to clarify pandemic information, resulted in more user involvement.
As presented in Table 4, the average number of comments on posts with edited text on the image (PwTextI) is three times higher than without text, and the average number of likes is more than double, indicating that the presence of more information induces more users’ reactions. Interestingly, PwTextI with edited text on the image increased (194%), especially on posts with more than 101 words and less than 150 words (930% YoY).
Furthermore, by comparing the average likes, by groups of caption number of words, posts without text increase the number of likes as the number of words increases in the caption (from 2669 to 4306). While PwTextI presents values between 6172 and 7643 likes. In terms of hashtags, 467 of the 650 PwTextI present between five and nine hashtags. However, posts with more likes and comments present fewer than five hashtags, indicating that the user reaction is more related to the information on the image than the number of hashtags.
4.3. Engagement and conversion between periods
To examine the impact of the new strategy followed in 2021, Table 5 presents the t-test on the metrics between 2020 and 2021. There is a statistically significant difference between the average number of sessions by month between periods, because the sessions increased by over 17% monthly in 2021. The monthly average of the number of interactions, interaction rate, likes per post, comments per post, and stories reach also presented a statistically significant difference between the two years.
t-Test: Two-sample assuming unequal variances.
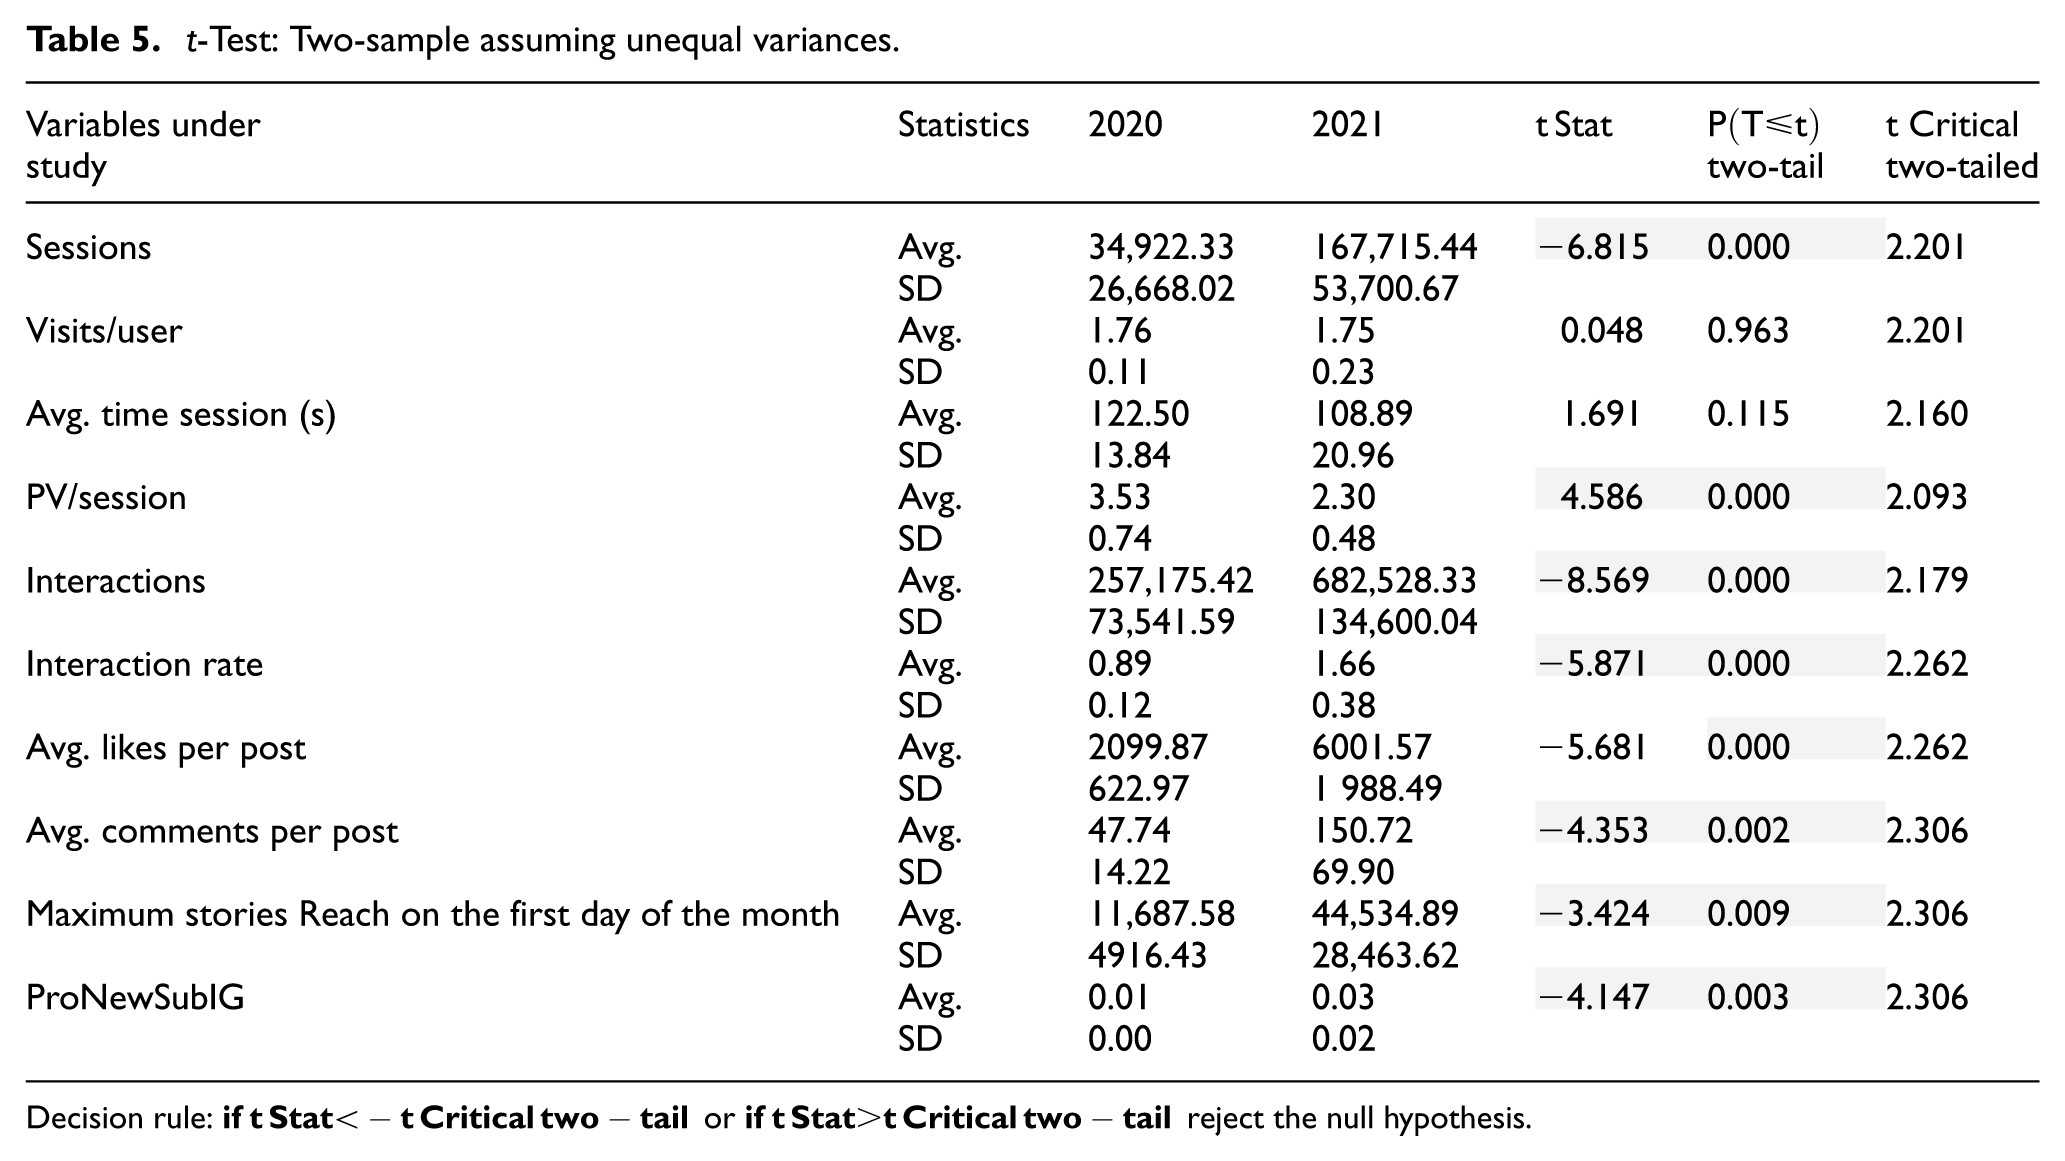
Decision rule:
Furthermore, as presented in Figure 5(b), since September 2020, there was an increase in followers (3% monthly on average), and the average number of monthly website visits more than doubled. The monthly number of interactions registered an increase of more than 265% between 2020 and 2021. Moreover, we also found a significant increase in the proportion of new subscribers that came to the website from Instagram (3% in 2021). Besides the monthly number of posts (see Figure 5), the number of words and hashtags per post remained relatively stable across both years, at approximately 88 words and 7 hashtags per post.
Meanwhile, the variables visits per user and average time session do not present a significant difference between years, indicating that, despite the peak in sessions, these users tend to keep the levels of engagement during website visits. In fact, the RFV indicator, since September 2020, presented an average value of 448 (see Figure 5(b)) with a standard deviation of 14.7. Thus, the results suggested that the strategy followed attracted an engaged audience.
4.4. Correlation analysis
According to the author [3], across the five stages of the customer funnel, the goal is to convert the maximum number of anonymous users into highly loyal customers [2]. Low levels of conversion rates result in low customer attraction, low curiosity, low commitment, and low affinity [3]. Thus, this section aims to analyse the relationship between the variables under study.
The correlation coefficient is a statistic that measures the strength of the relationship between two variables [75]. The Pearson correlation coefficient describes the proportion of the total variance in the observed data that can be explained by a linear model of the variables under study [76]. It takes values between −1 and 1. To interpret those values, labelling systems coupled with the statistical significance of the correlation coefficient allow us to define the kind of relationship that exists between variables [75]. The
As presented in Table 6, the correlation matrix suggested that the variables – sessions, interactions, interaction rate, average likes per post, average comments per post, and ProNewSubIG – were significantly positively correlated. Furthermore, the number of followers increased along with the number of interactions; the interaction rate is significantly correlated with all the variables except the Stringency Index. Therefore, across the conversion funnel, as the number of Instagram followers increases, the number of readers on the website increases, and consequently, the subscription conversions increase.
Pearson correlation between variables.
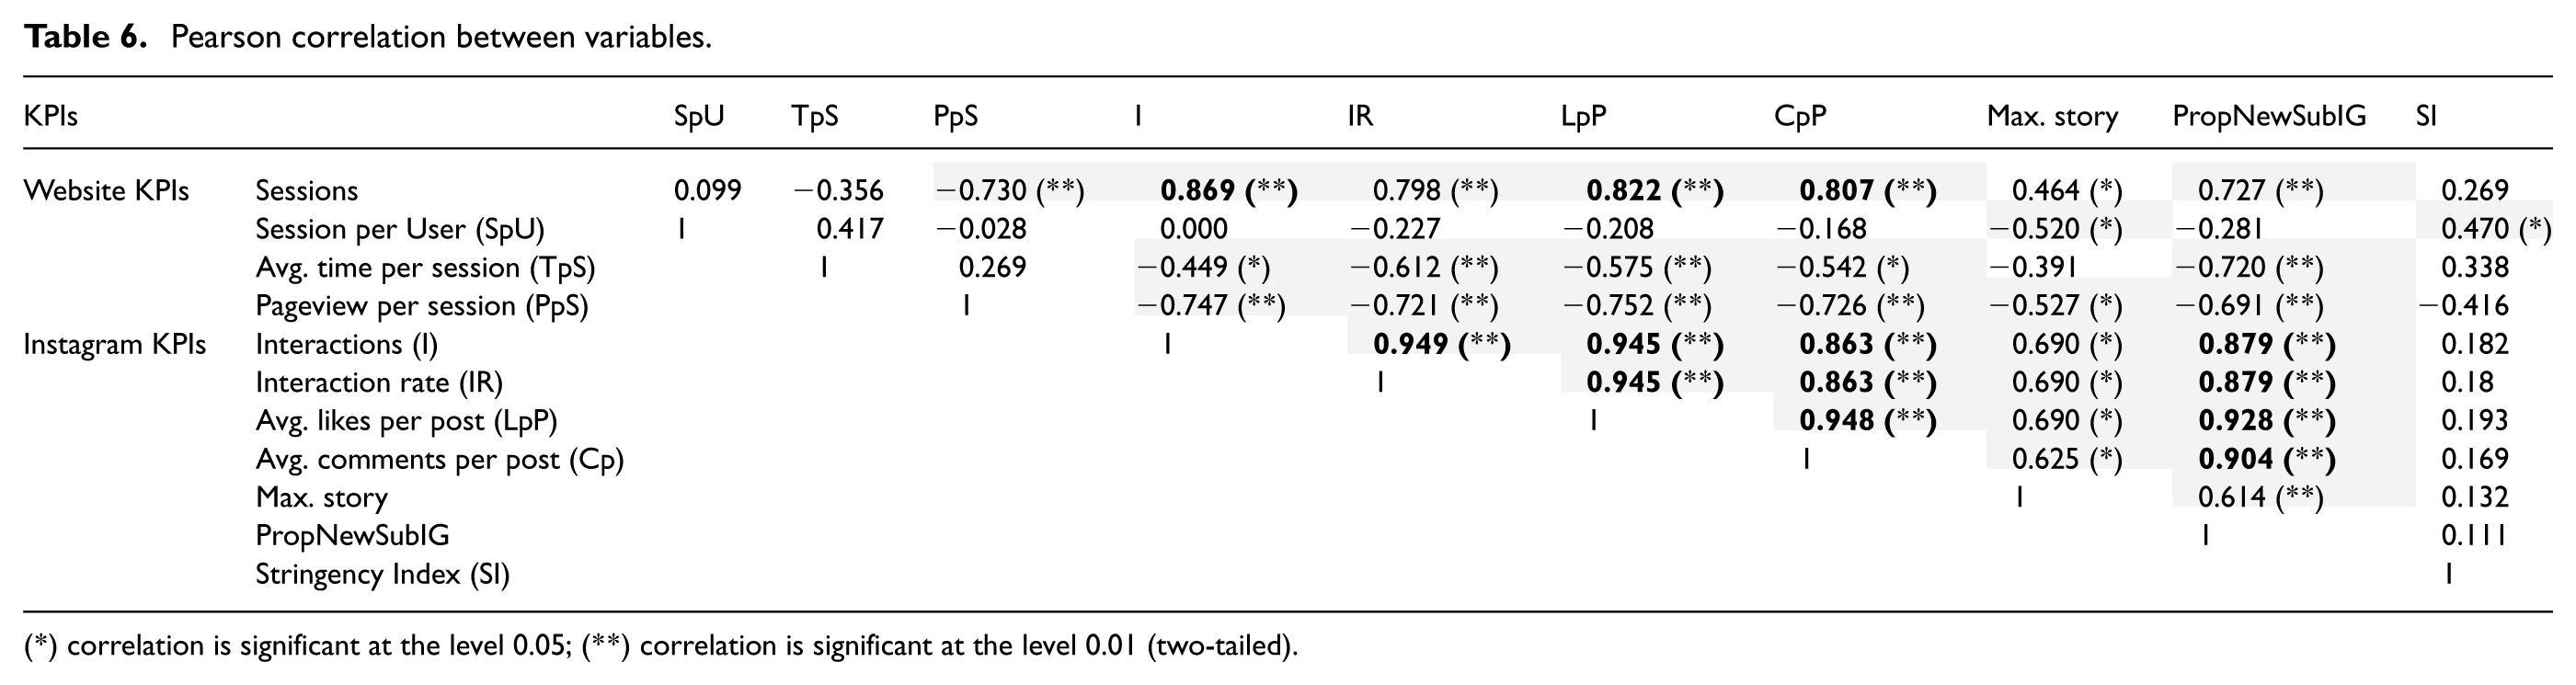
(*) correlation is significant at the level 0.05; (**) correlation is significant at the level 0.01 (two-tailed).
4.5. Competitors analysis
To analyse Público’s market position, Table 7 presents a comparison between market players.
Followers and monthly interactions comparison between Público and its competitors.
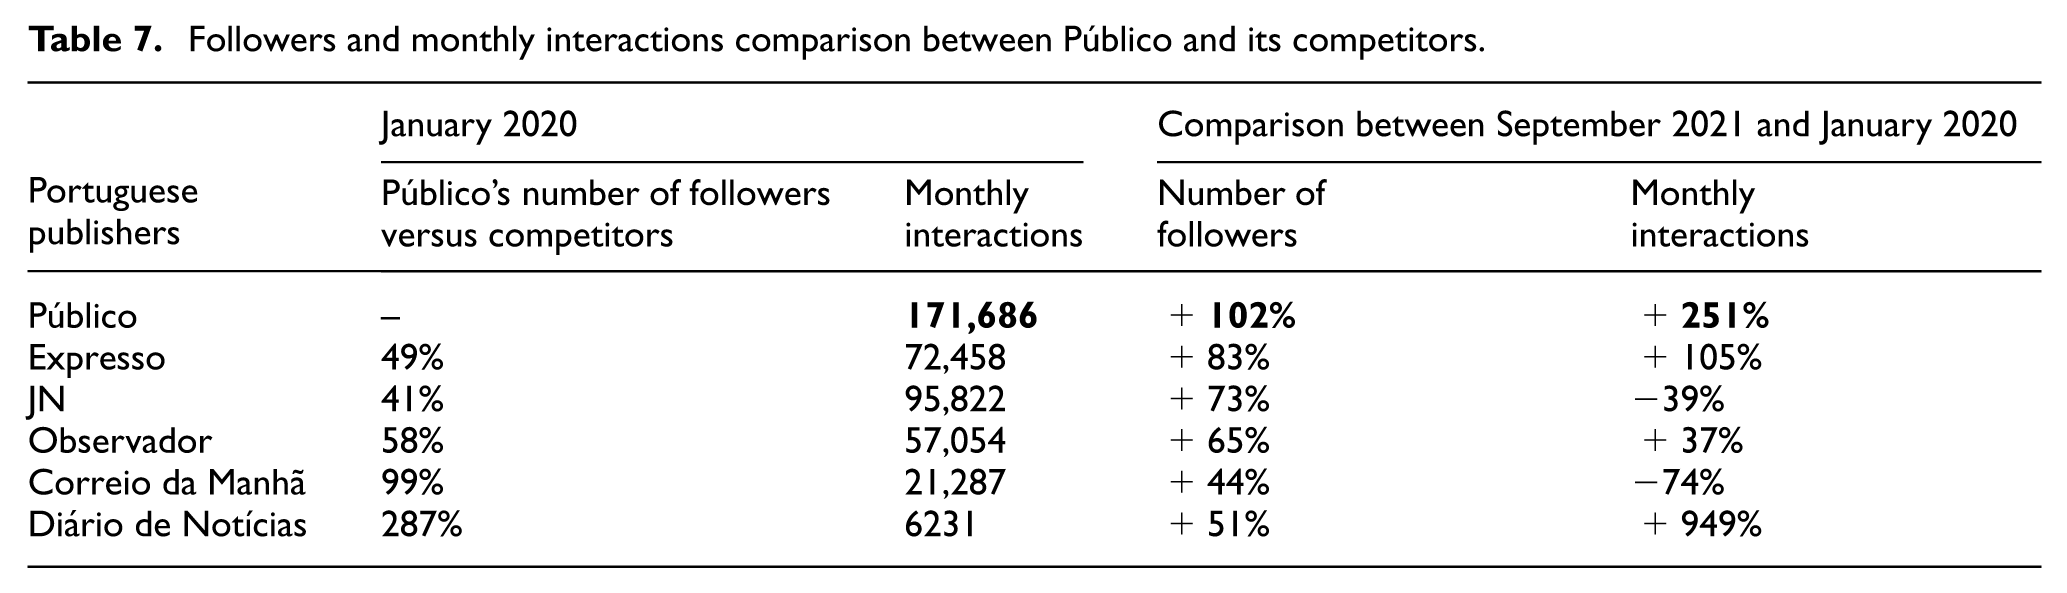
In January 2020, Público already had more followers than its competitors. Through the strategy followed, Público increased 102% the number of followers and 251% the number of monthly interactions, leading the Portuguese ranking on this platform.
5. Discussion and RQ analysis
This addresses four primary RQs, as illustrated in Figure 1. Seeking to answer RQ1, previous analysis demonstrated that as the number of informative posts increases, and the subsequent growth of followers and interactions. This aligns with previous scholarship [49,70] suggesting that narrative engagement plays an important role involving audiences [24]. Notably, the follower base expanded significantly even while the monthly post volume remained constant, signifying a high degree of editorial efficacy in content selection. Moreover, the interaction rate and the maximum story reach on the first day of the month more than tripled during the observation period. Statistical validation via t-tests confirmed a significant positive difference in average likes and comments between the 2 years analysed. Consequently, the integration of textual information within visual formats serves as a critical mechanism for stimulating reader interest – a finding consistent with the empirical work of Aydin [32].
To answer RQ2, a text analysis was performed. The wide range of hashtags with a high engagement score indicates that there was a daily understanding of the reader’s information needs. Furthermore, sentiment analysis demonstrated that the TPS tend to be neutral across the timespan, that is, the text is either devoid of emotion or perfectly balanced. Thus, engagement increased across the funnel while maintaining a journalistic ethical perspective. The content remained objective and fact-based, and was, in most cases, purely descriptive.
Some authors defend that SM affects the way news is produced. However, Público SME’s approach prioritizes the strategic curation of existing editorial content to maximize engagement among Instagram audiences [37]. This curation process is simultaneously informed by an institutional commitment to mitigating misinformation. By implementing a data-driven framework, the team was able to systematically identify and prioritize newsroom output that aligned with audience interests. The efficacy of this strategy is evidenced by the 2021 performance metrics: within the first 9 months, sessions originating from Instagram surpassed the total volume of the preceding year by 23%.
Seeking to investigate RQ3, a correlation analysis was performed. The low Pearson correlation between the Stringency Index and the number of sessions indicate that the increase in website sessions is not directly related to the strictness of lockdown. Thus, the increase in website sessions was a result of the efforts to optimize the SM strategy guided by data. Moreover, the strategic selection of content, the careful choice of content formats (detailed at the editorial strategy understanding section), drove followers who kept engaged with posts, as the interaction rate increased and consequently drove readers to the website. Despite concerns about glorifying analytic tools [15], this research aims to provide an example of how a data-driven SM strategy can keep journalism principles and inform readers who consequently become subscribers.
On the contrary, in terms of acquiring readers with more propensity to subscribe (RQ4), an increase of more than 300% on readers aged 45 years and more was verified, as a result of a 156% growth in website sessions from Instagram. In January 2020, the majority (60%) of Público Instagram followers fell in the age group 25–44 years and 30% had more than 44 years (see Figure 7(a)). When comparing January 2020 and September 2021, the distribution of the followers by age did not present significant differences. However, when we explore the users on the website that come from Instagram, the distribution is quite different (see Figure 7(b)), that is, 46% of the readers were more than 44 years. Interestingly, the daily decision-making process increased the right target of readers to subscribe as the historical dashboards are prepared to understand content consumption by hour, day, age, etc.
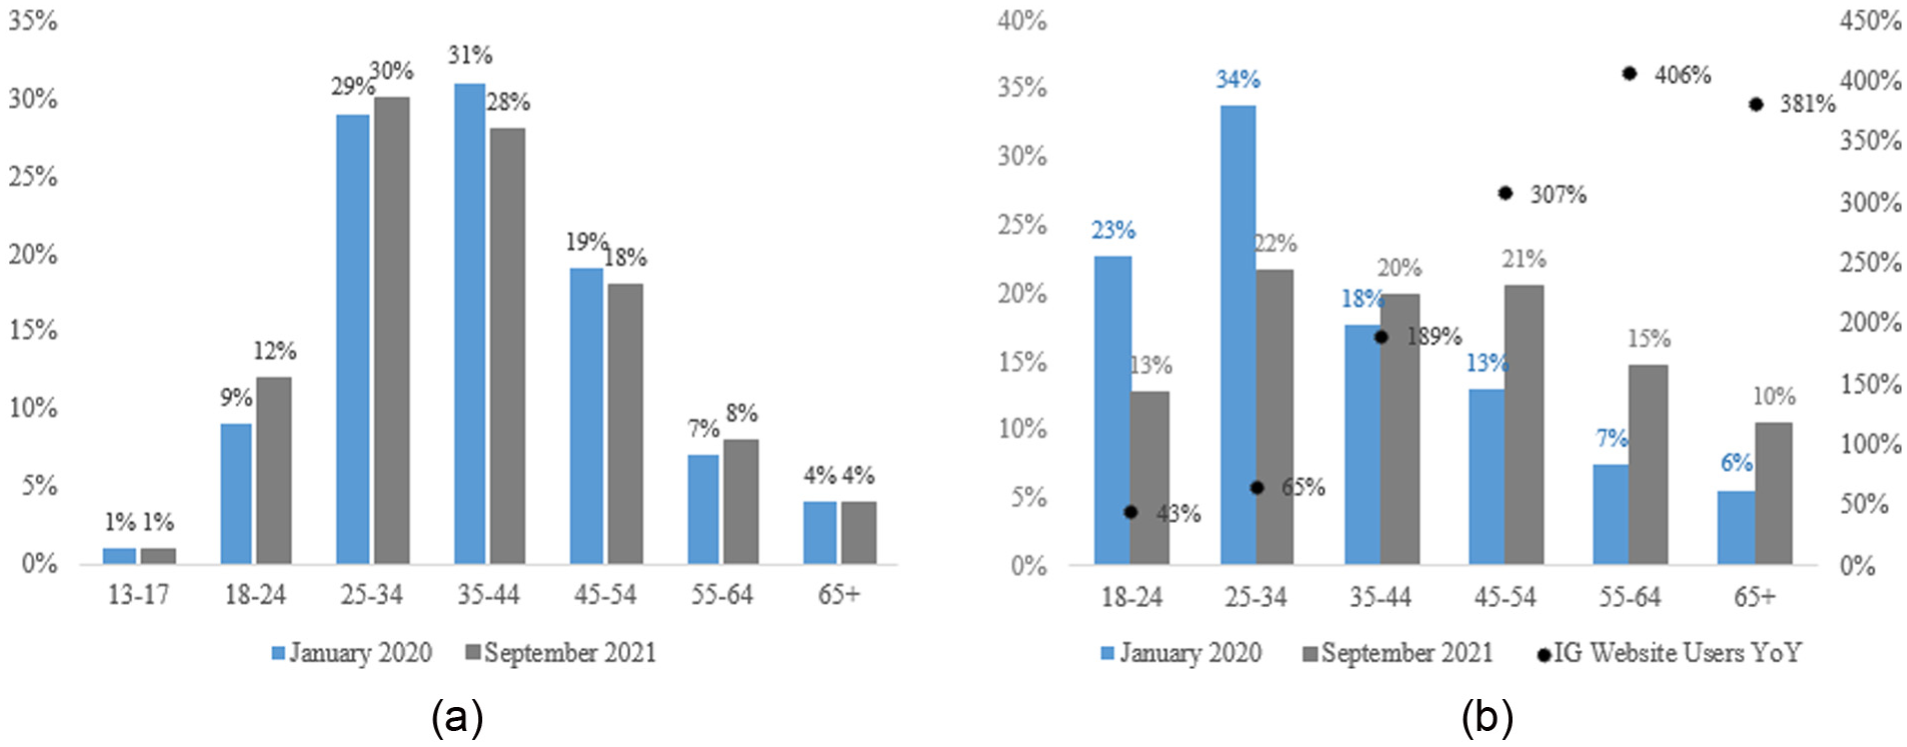
Instagram followers by age (a) and website users from Instagram by age (b).
Besides, there is a strong positive correlation between PropNewSubIG, sessions, and interactions, indicating that the Público Instagram audience is reading more on the website, and it is reading content that induces the subscription purchase. Furthermore, Instagram readers on the website maintained the number of sessions per visit as the RFV engagement metric, revealing the assertiveness in content selection. Thus, answering positively to RQ4, the proportion of new monthly subscribers that visit the website from Instagram increased from 0.6% on January 2020 to 5.6% on August 2021. While some authors agree that SM contribution seems underwhelming [77], others agree that it can boost website engagement [31]. This research provides evidence that SMEs can apply a subscription data-driven strategy in SM that increases reader engagement without affecting journalistic output.
6. Conclusion and limitations
The diversification of journalistic distribution channels marks a structural transition from single-channel dissemination to integrated multichannel communication strategies [1,13,58]. This empirical study evaluates the impact of a SM content strategy that synthesizes reader engagement with data-driven methodologies. By leveraging high RFM (RFV) value content to drive web traffic, the strategy facilitates the conversion of casual visitors into subscribers. The findings demonstrate that users like and follow pages that provide them with useful and timely information in a convenient way [32]. Furthermore, text analysis revealed a predominantly neutral sentiment in social media output, suggesting that SMEs successfully eschewed “clickbait” tactics in favour of informational integrity [11]. Moreover, the implementation of an iterative testing and analysis methodology resulted in a measurable increase in engagement metrics across the reader conversion funnel. Thus, this paper shows how SMEs navigate the complexities of digital content delivery and adapt to evolving user behaviours and platform algorithmic updates. Furthermore, the BI framework developed herein provided the newsroom with actionable insights, ultimately enabling Público’s SMEs to realize their strategic objectives.
Indeed, the data-driven strategy leverages data analytics in four main fronts: at Instagram, to determine optimal content and timing to post, since follower habits continuously change during the pandemic; at the website, to determine the best content to post and attract users to the website with high propensity to subscribe; at real-time decision-making to inform breaking news and update latest top stories, and finally, on misinformation monitor to determine the content that need to be clarified.
Moreover, the proposed methodology and strategic framework demonstrate significant potential for scalability across diverse business contexts and communication industries. By integrating a culture of continuous experimentation with a robust BI strategy, content producers can systematically expand their audience reach and catalyse higher levels of engagement. This iterative approach facilitates the optimization of content performance through empirical validation, offering a replicable model for organizations navigating the increasingly volatile digital landscape.
Despite this paper identifying several working tactics and successful patterns, the study was not immune to limitations. This study only considered data from one Portuguese online newspaper between January 2020 and September 2021. Besides, other content information could be used to analyse post-performance, such as colourfulness or the presence of human faces. Furthermore, the Instagram platform is always evolving by changing features and algorithms. Thus, it could be interesting to analyse the evolution of the data-driven strategy to face Instagram changes and to keep growing engagement across the funnel.
Finally, SM strategy is dynamic and must be an ongoing task. Thus, future research could explore visual content SM strategy from other news media organizations in different countries.
Footnotes

Funding
Declaration of conflicting interests
The authors declared no potential conflicts of interest with respect to the research, authorship, and/or publication of this article.
Data availability statements
The data sets analysed during this study are not publicly available due confidential company data by Público.