






Abstract
Mental health issues significantly affect workers and industries by reducing productivity, generating economic losses, and contributing to psycho-physical conditions. Technological advancements are transforming workplaces, emphasizing mental health care through digitalization and automation. This study introduces Kaire, an intelligent model designed to identify and predict work-related stressors in industrial settings. Kaire utilizes an ontology-based framework combined with semantic rules and machine learning algorithms, including Support Vector Machine (SVM) and Random Forest (RF), to classify stressors and forecast events. Synthetic data simulating industrial routines evaluated Kaire’s performance, with SVM achieving 99.36% accuracy, 99.55% precision, 98.84% recall, and 99.19% F1 score. The Group Stress Index (GSI) analysis showed 88.39% similarity between calculated results and simulator outputs. While event prediction scored lower across all evaluated configurations, stressor identification and GSI estimation showed consistent results in the simulated scenario. Kaire contributes to stress identification and monitoring, supporting industries in promoting workers’ mental health and well-being.
Introduction
Mental health is a worldwide concern that impacts the industry economically. According to the World Health Organization, 1 mental disorders are health conditions characterized by changes in emotions, thoughts, behaviors, or a combination of these factors. These changes affect daily life, impairing relationships, and cognitive activities, causing body responses that are not common, such as sweating or tachycardia for certain phobias.2,3 Many of these conditions can be diagnosed, treated, and prevented. However, without proper intervention, mental disorders can progress into severe conditions or even lead to suicide, accounting for more than 700,000 deaths worldwide each year.4–6 According to the World Health Organization, 7 15% of working-age adults were estimated to have a mental disorder in 2019. This scenario causes workers’ productivity to fall and generates a loss of US$ 1 trillion each year. The COVID-19 pandemic has also been a source of mental health problems. This crisis has collapsed health systems around the world, causing negative psychological effects due to fear, insecurity, and social isolation.8,9
Simultaneously, the world is experiencing a mental health crisis and the advent of a fourth industrial revolution driven by emerging technologies. Industry 4.0 generates a transformation from machine-dominant manufacturing to digital manufacturing.10,11 Cyber-physical systems (CPS), the Internet of Things (IoT), and cloud computing are key technologies driving Industry 4.0. In this context, Bavaresco et al. 12 mapped the use of IoT for occupational well-being in Industry 4.0, highlighting sensors, physiological measurements, psychological health, and human-centered approaches. These technologies generate vast amounts of data, making data science and data analytics crucial in this context. 13 These innovations generate a disruptive workplace process and can become a modern source of stress, 10 fostering an unconscious competition between humans and machines. 14
Mental disorders in the work environment can decrease productivity, cause operational errors, and even cause physiological concerns for the worker. 15 Recent studies also characterize work-related stress as a psychosocial condition that can manifest through psychosomatic symptoms, reduce productivity, and increase the likelihood of workplace accidents caused by stressful environments. 16 Similarly, Bavaresco et al. 17 proposed an ontology-based framework enabled by machine learning to support worker health and safety reasoning in industrial settings. Previous studies have highlighted the link between mental well-being, physical conditions, and workplace performance. Srivastava 18 connected workers’ mental health with their motivations and physical states, emphasizing the productivity losses associated with poor mental health. Zheng et al. 19 identified safety risks related to temperature, developing a stress evaluation index for high-temperature conditions. Recent efforts have focused on predicting mental states using various data sources to provide user feedback, as seen in the construction industry’s use of physiological signals 20 and the oil and gas sector’s stress and fatigue assessments. 21 Despite these advances, a gap remains regarding the utilization of personal and environmental data to identify workplace stressors and apply context histories22,23 to develop a stress index or predict stressful events. This research seeks to fill these gaps by exploring comprehensive methods to enhance mental health understanding and management in the workplace.
Numerous factors influence workplace stress, leading to physical and psychological harm for employees and financial losses for the industry. This work-related stress may be prone to interference from subjective variables, such as the type of activity performed, social relationships, environmental comfort, and individual physiological characteristics. Environmental comfort refers to the optimal conditions for a worker’s well-being. 24 Variations in sensory factors like temperature, noise, or light can impact mental health, contributing to stress, fatigue, or other disturbances. 25 A combination of personal data, such as physiological metrics and motion, can help identify changes in mental states. Additionally, analyzing historical information helps predict trends based on context. Understanding these contextual connections is essential for creating specific strategies to reduce workplace stress. 16 These considerations show the importance of observing work-related stress in an industrial environment. This study seeks to answer the following research question: ”How to apply context histories and machine learning to identify stressors in industrial settings?”.
This study consists of six sections. Section 2 addresses related works, comparing existing approaches with the proposed model. Section 3 describes the specification and architecture of the Kaire model, and exhibits an ontology designed for the domain. Next, Section 4 describes the machine learning approach and the model evaluation. Section 5 highlights the limitations, strengths, and weaknesses of this research. Finally, Section 6 presents the conclusions and directions for future studies.
Related works
The selection of related works was initially based on the systematic review of Goetz et al. 26 and was refreshed in June 2025 following the procedures proposed by Kitchenham et al. 27 The original review assessed 25,269 articles from 7 databases published up to November 2022, generating a final list of 34 articles. The updates from 2025 revealed the existence of 4 additional articles related to the research topic.
The strategy for selecting the articles encompasses employing a monitoring strategy in the study, even when not using a computational model for this specific purpose. In addition, two premises were defined for selecting studies that best align with the research focus. The first premise limits the studies based on stress being the main focus of the research. The second premise selects studies that use physiological and environmental data as the main data sources, aiming at non-intrusive extraction methods.
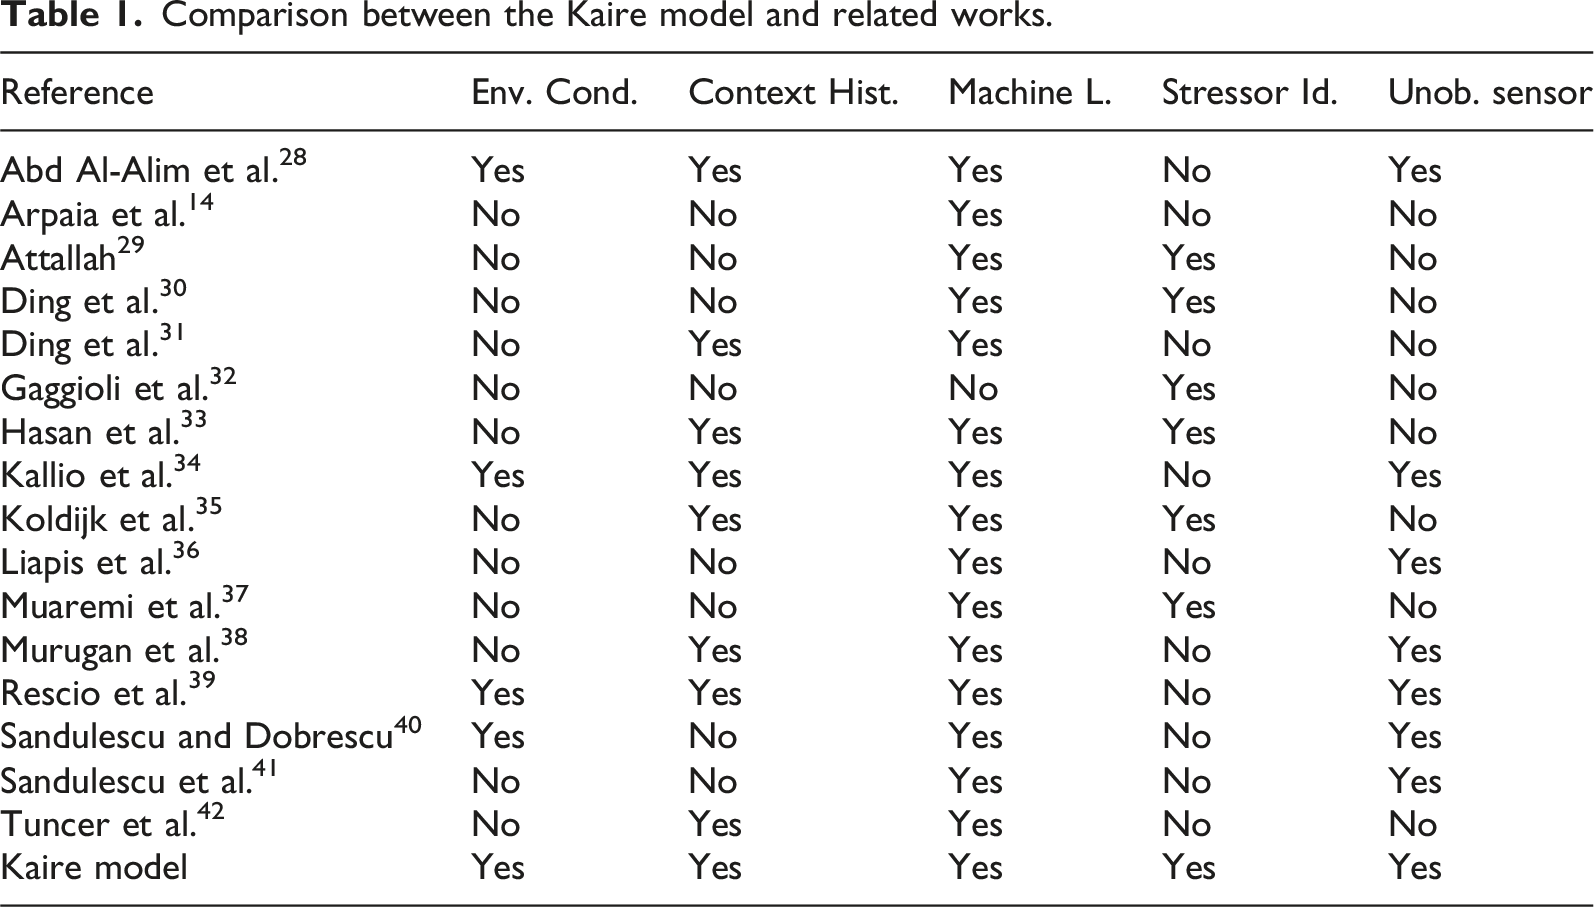
Comparison between the Kaire model and related works.
Abd Al-Alim et al. 28 proposed a machine learning approach for stress detection using non-intrusive wearable sensors in free-living environments. The study utilized the Stress in the Work Environment (SWEET) dataset and tested various models. Its relevance lies in the collection of data in uncontrolled environments and the nonintrusive nature of the sensors.
Rescio et al. 39 developed a deep learning platform for continuous stress detection in workers, employing minimally intrusive multisensory devices. The study focused on performance improvement via neural networks, with a One-Dimensional Convolutional Neural Network (1D-CNN) achieving high accuracy. Its relevance stems from the nonintrusive sensor approach and the application of deep learning in an occupational context, considering physiological and environmental signals.
Hasan et al. 33 explored occupational stress detection by combining machine learning and large language models (LLMs) with questionnaire data. The article identifies key indicators and stressors via Artificial Intelligence (AI). Although it does not use physiological sensors, its contribution lies in applying advanced models to identify stressors from behavioral and contextual data, broadening the discussion on stress detection approaches.
Kallio et al. 34 presented a comprehensive review of sensor-based techniques for continuous stress monitoring in knowledge work environments. The work highlights the potential of physiological, behavioral, and environmental data, emphasizing the importance of unobtrusive sensors for long-term monitoring. The article reinforces the relevance of multimodal and continuous approaches and the need to consider environmental and historical context for practical solutions.
The original systematic literature review revealed that work-related stress is a prevalent psychosocial concern within industrial settings and has been the focus of extensive exploration by the research community. Furthermore, machine learning has often been used in line with other technologies, such as biomarkers, smart wearables, and mobile devices, making Random Forest (RF) and Support Vector Machine (SVM) algorithms the most used in the analyzed papers. Also, the review pointed out that there is a specific scenario for each industry, with environmental variables that need to be considered for each case, such as weather conditions or human relationships.
Table 1 presents a comparative analysis between the proposed model and related works. The Reference column specifies the study being referenced. The Environmental Conditions column records the physical and situational context during data collection. Context History refers to the use of a temporal sequence of past events or conditions that influence current states, offering insights into recurring patterns. The Machine Learning column indicates whether machine learning algorithms were applied in the study. Stressor Identification focuses on the system’s capacity to classify potential stressors, such as workload or environmental factors. Finally, the Unobtrusive Sensor column denotes the use of sensors that collect data passively, allowing continuous monitoring without interfering with the user.
The table should be interpreted as a dimensional comparison rather than as an exclusion matrix. The selected studies were retained because each contributes to at least one dimension relevant to the Kaire model, such as stress detection, environmental conditions, context histories, machine learning, or unobtrusive sensing. Therefore, values marked as “No” indicate dimensions not addressed by a given study, rather than a lack of relevance to the comparison. This organization helps delimit the gap addressed by Kaire, which combines contextual information, stressor identification, group stress analysis, and the prediction of stressful events.
Compared with the related works, Kaire shares the use of machine learning and non-intrusive data collection strategies with several previous approaches. However, most related studies focus mainly on detecting or monitoring stress states, while Kaire extends this perspective by using contextual histories, shared time, location, and environmental information to identify possible stressors and calculate group-level stress.
Among the common aspects, machine learning algorithms stand out due to their wide use by the authors. Physiological data usually have high information complexity, which motivates the use of algorithms capable of handling large amounts of data. Kaire also considers non-intrusive sensors, aiming to support data collection during work tasks, as in several of the compared studies.
In Kaire, environment and location define context histories and support the identification of possible stressors in shared space and time. Within the compared set, no reviewed study simultaneously addresses stressor identification, group stress analysis, and stressful-event prediction.
Kaire Model
This section describes the structure and components of the Kaire model. The following subsections present an overview of the model, detailing the workflow and scenarios of the model acting and explaining the model architecture.
Model overview
Figure 1 depicts the model overview in Industry 4.0 settings. Data Gatherers collect workers and environmental data through sensors, wearables, and communication interfaces, sending them to the Communication Server. The server organizes requests to the K-Processor, while the Stress Classifier estimates stress levels from physiological data. Kaire model overview.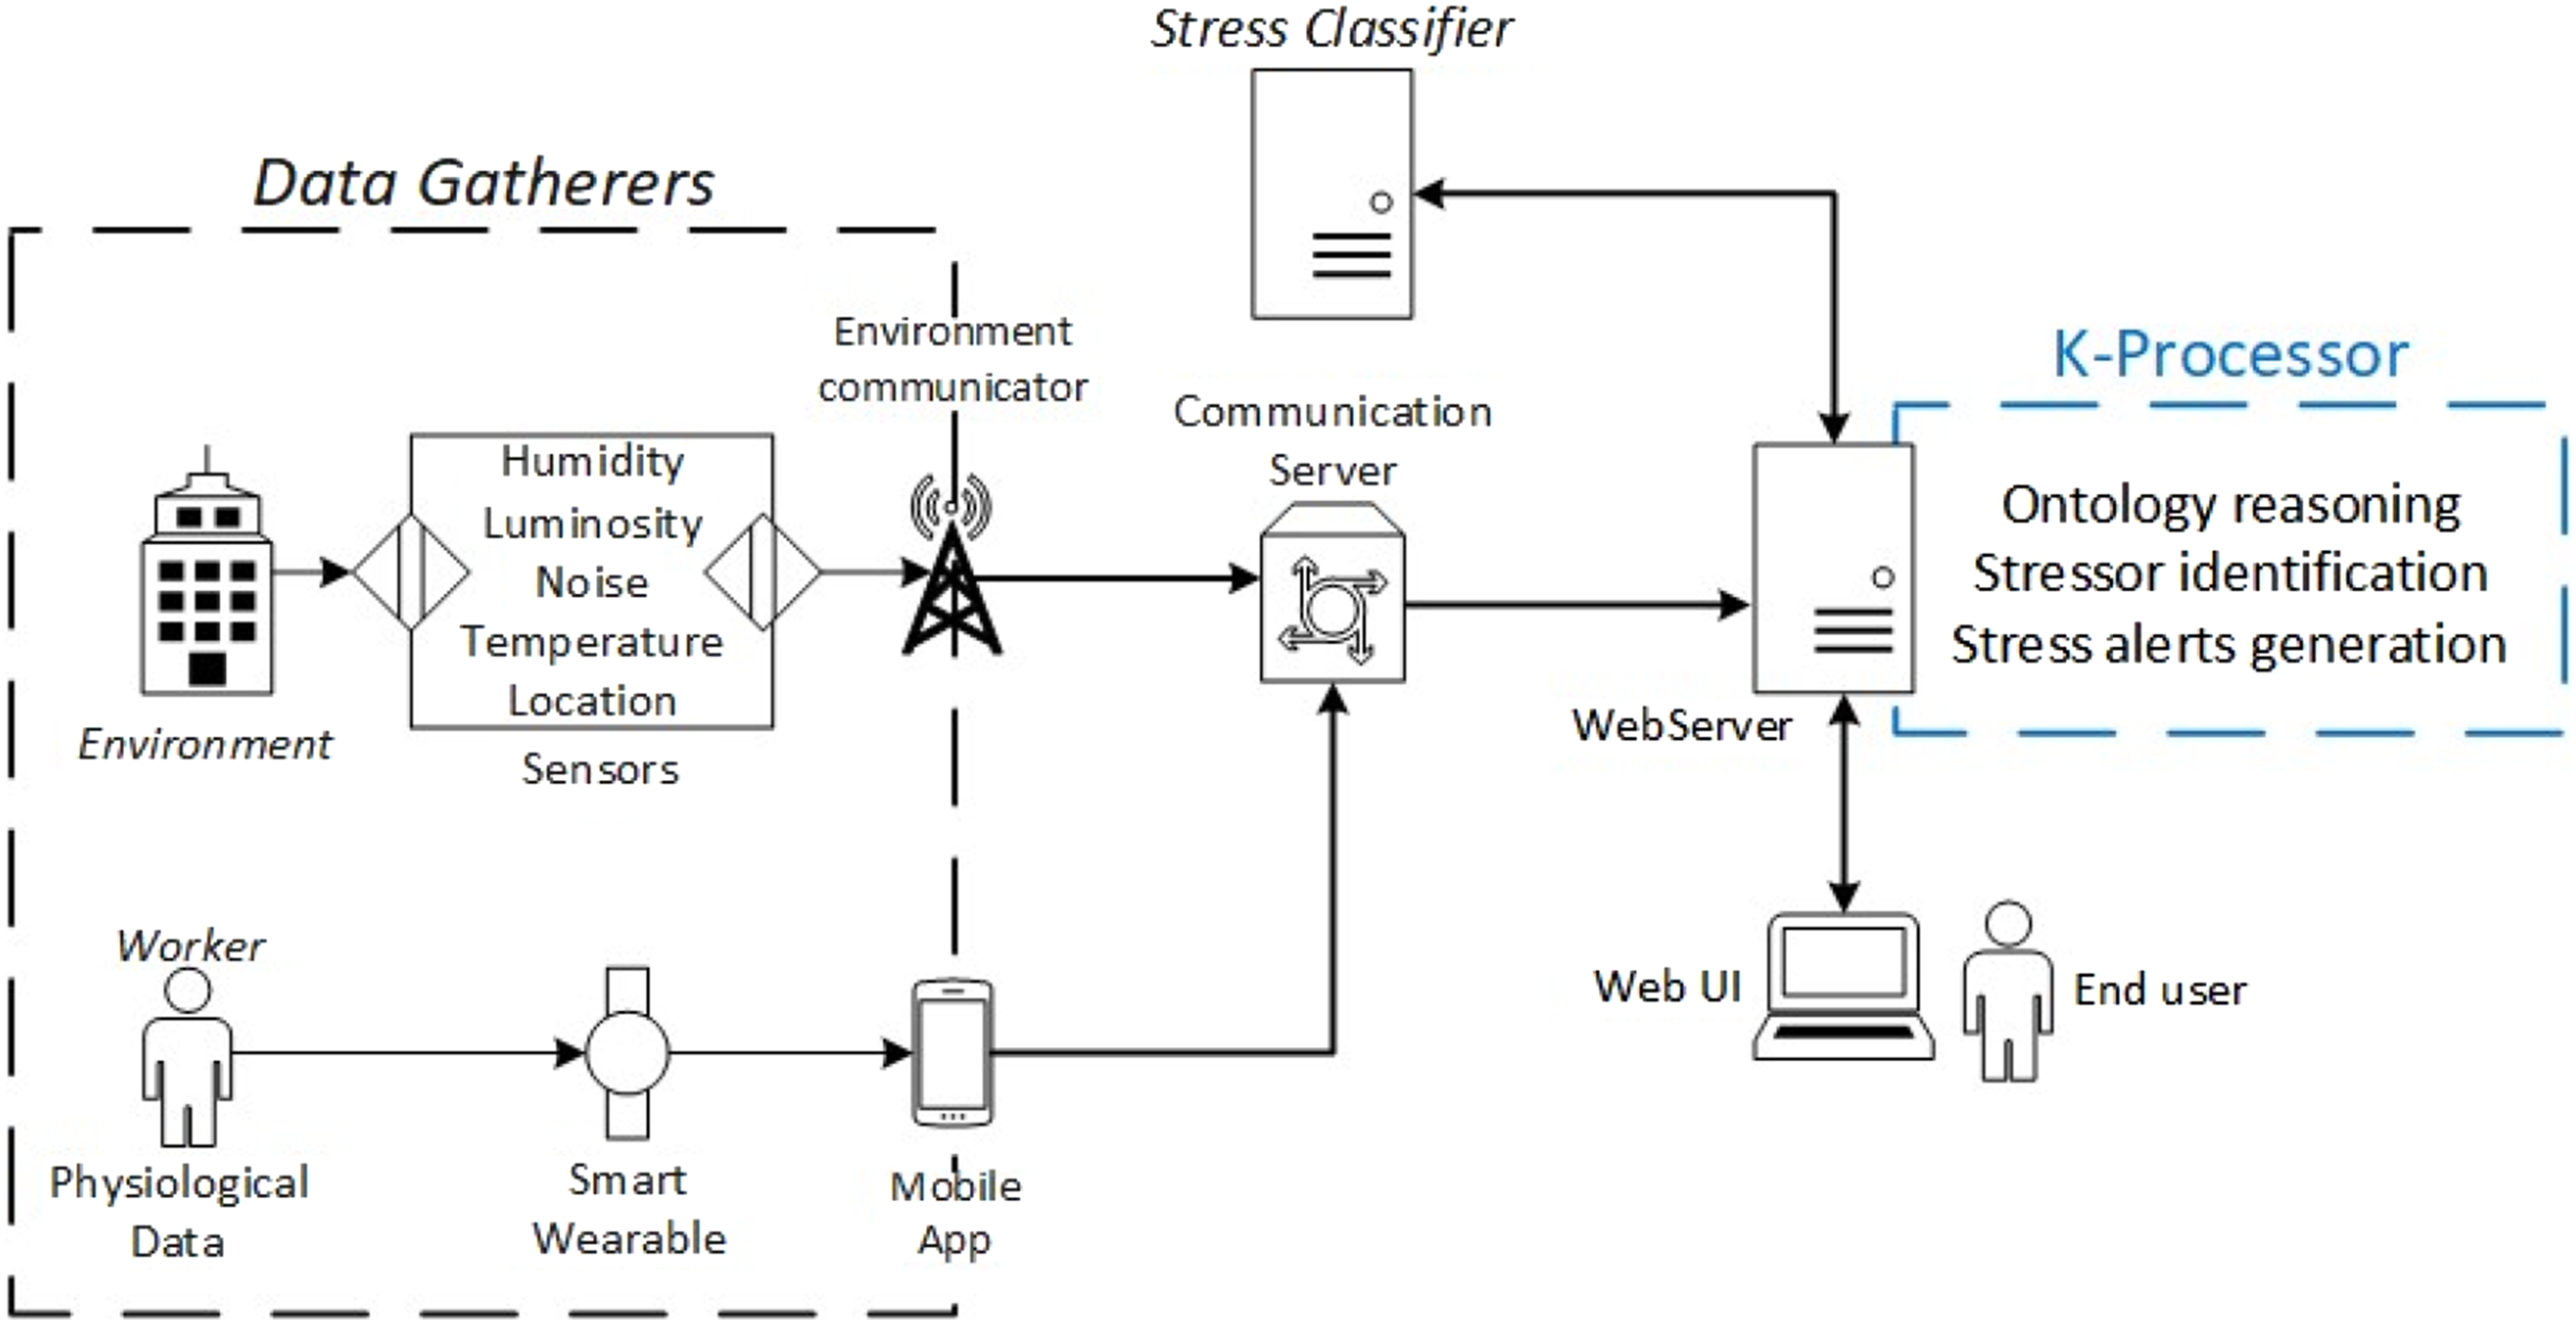
K-Processor is responsible for managing the functionality of the model. The ontology reasoning defines the data domain of the model and performs inferences about possible stressors, generating context histories. Worker data provides information to infer possible stressors, while data extracted from the environment make it possible to analyze human comfort conditions, for instance, humidity, luminosity, noise, and temperature, to investigate their influence on the mental well-being of workers. The identification of stressors uses the context history of the inferred information to achieve its purpose. Furthermore, K-Processor moves towards the identification of workgroup stressors and prediction of stressful events. This processed information allows the creation of alerts to inform the industry of stressful situations. Finally, K-Processor provides the information to a Web User Interface (UI) for human interpretation.
Architecture
Figure 2 depicts the Kaire architecture represented by the Technical Architecture Modeling (TAM) standard.
43
Data gatherers agents are dedicated to the measurement of activities. The agents first collect the environmental condition information relevant to the industry segment through sensors. The second activity is responsible for extracting personal information through a smart wearable or a smartphone. A heart strap can measure heart rate (HR) and heart rate variability (HRV), while a smart wristband can contain features for the blood volume pulse (BVP) and electrodermal activity (EDA) collection. A mobile application can connect to the device and extract this information for transmission. Both activities are responsible for sending the collected information for data processing through a Communication Server. The Communication Server operates as an event stream, collecting and storing real-time sensor data while managing, processing, and routing events. This enables a continuous and efficient flow of information to the processing server infrastructure. Stress Classifier is accessed whenever there is data transferred to the processing server with unclassified stress information. The expected response is the level of stress for the sent context named as Individual Stress Index (ISI). Kaire model’s architecture.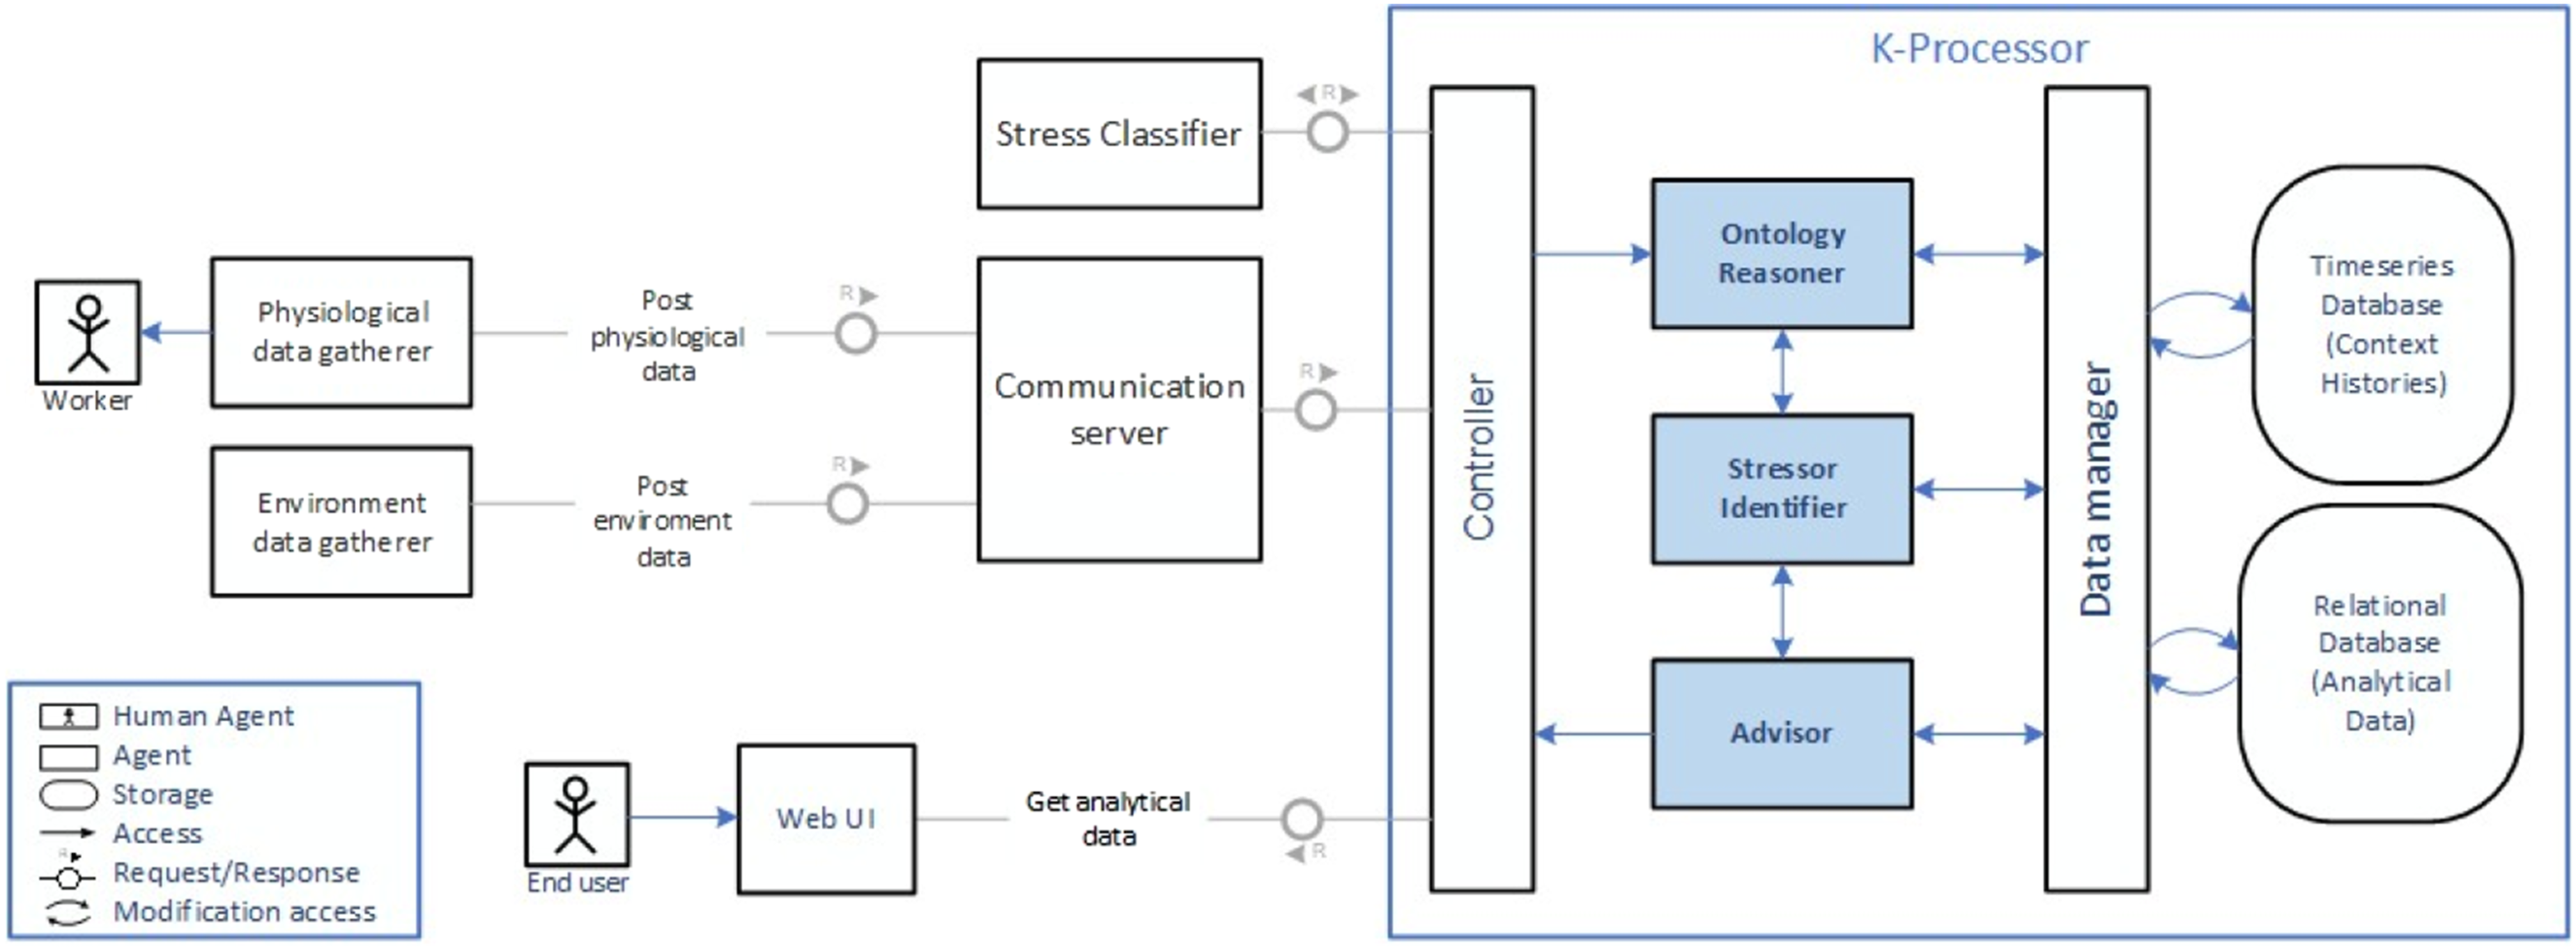
In the Kaire processing flow, hasStressIndex and ISI represent different processing stages. The ontology receives a five-level stress index through the hasStressIndex property. Values lower than 3 are interpreted as Normal, whereas values equal to or greater than 3 are interpreted as Stressed. After this semantic classification, the result is converted into the Individual Stress Index (ISI), represented as a binary value, where 0 indicates a non-stressed state and 1 indicates a stressed state. This binary ISI is then consumed by the Stressor Identifier and used as input for the Group Stress Index (GSI) calculation.
The K-Processor includes agents and storage responsible for all data processing of classification and prediction. The first agent is the Controller and it manages all requests and responses, forwarding the flow of information to the competent agent. The Data Manager performs all data manipulation and persistence in the databases, storing the information of Context History and Analytical Data. A Time Series Database (TSDB) stores context histories from workers, workgroups, and environment. These contexts contain the information collected by Data Gatherers. In addition, a Relational Database (RDB) organizes analytical data for structured information such as industry information, workers, and ontology parameters. Also, the Kaire model has three agents in this module that address the classification and prediction of stressors. First, Ontology Reasoner organizes the application domain, importing information from the designed ontology, and applying constraints and inferences through relationships and semantic rules. Next, Stressor Identifier consumes the information inferred from the previous agent to classify stressors, considering the context histories. Third, Advisor makes predictions of possible stressful events, generating recommendations and alerts.
Ontology Reasoner
Ontology Reasoner agent classifies the information through the knowledge domain. The agent can make inferences about the contexts through the interaction between the information extracted from the databases and the ontology designed for the model, named OntoKaire. OntoKaire is a Web Ontology Language (OWL) ontology comprising 54 classes, 23 object properties, and 12 data properties that integrate concepts of workers, activities, and environments to infer work-related stressors. Built in Protégé 5.5.0 (Protégé: https://protege.stanford.edu/), it extends the RevitalMe Ontology, 44 ensuring logical consistency with the Pellet reasoner. The ontology was validated on 90 synthetic workplace contexts derived from the Wearable Stress and Affect Detection (WESAD) dataset. 16 In this article, the ontology serves as the knowledge base for the Kaire reasoning module. The readers should refer to the original publication for the full class hierarchy, Semantic Web Rule Language (SWRL) rule set, and evaluation
Stressor Identifier
Figure 3 illustrates the Ontology Reasoner activity flow. The agent imports customizable parameters from the relational database (RDB), loads the Web Ontology Language (OWL) file, fetches time-series data to create contexts, and executes the reasoner. The results indicate possible stressors by time and place and classify environmental conditions as Standard or Irregular. Finally, the results are persisted for use by other agents and if raw data remains, the flow returns to individual creation. Ontology Reasoner activity flow.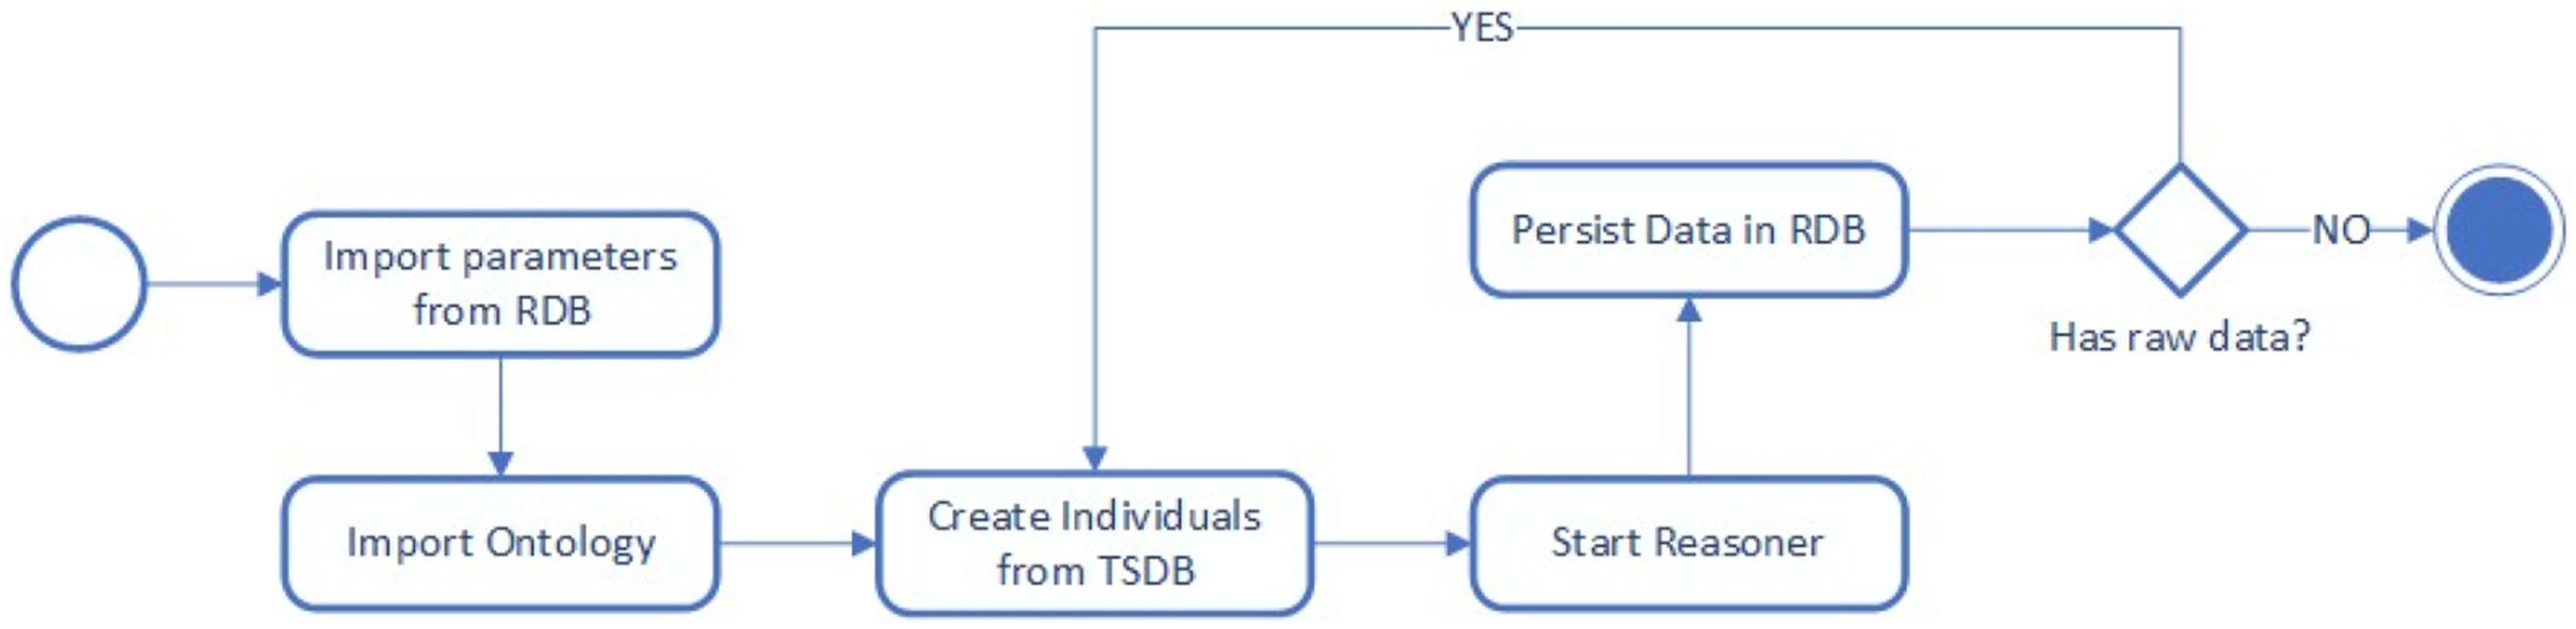
Figure 4 presents activities to Stressor Identifier agent. This agent identifies possible stressors of a given target and assigns an estimated probability of being a stressor for each case. The first step is to read the information inferred by the ontology saved in the RDB, with the possibility of two paths: worker analysis and group analysis. Stressor identifier activities.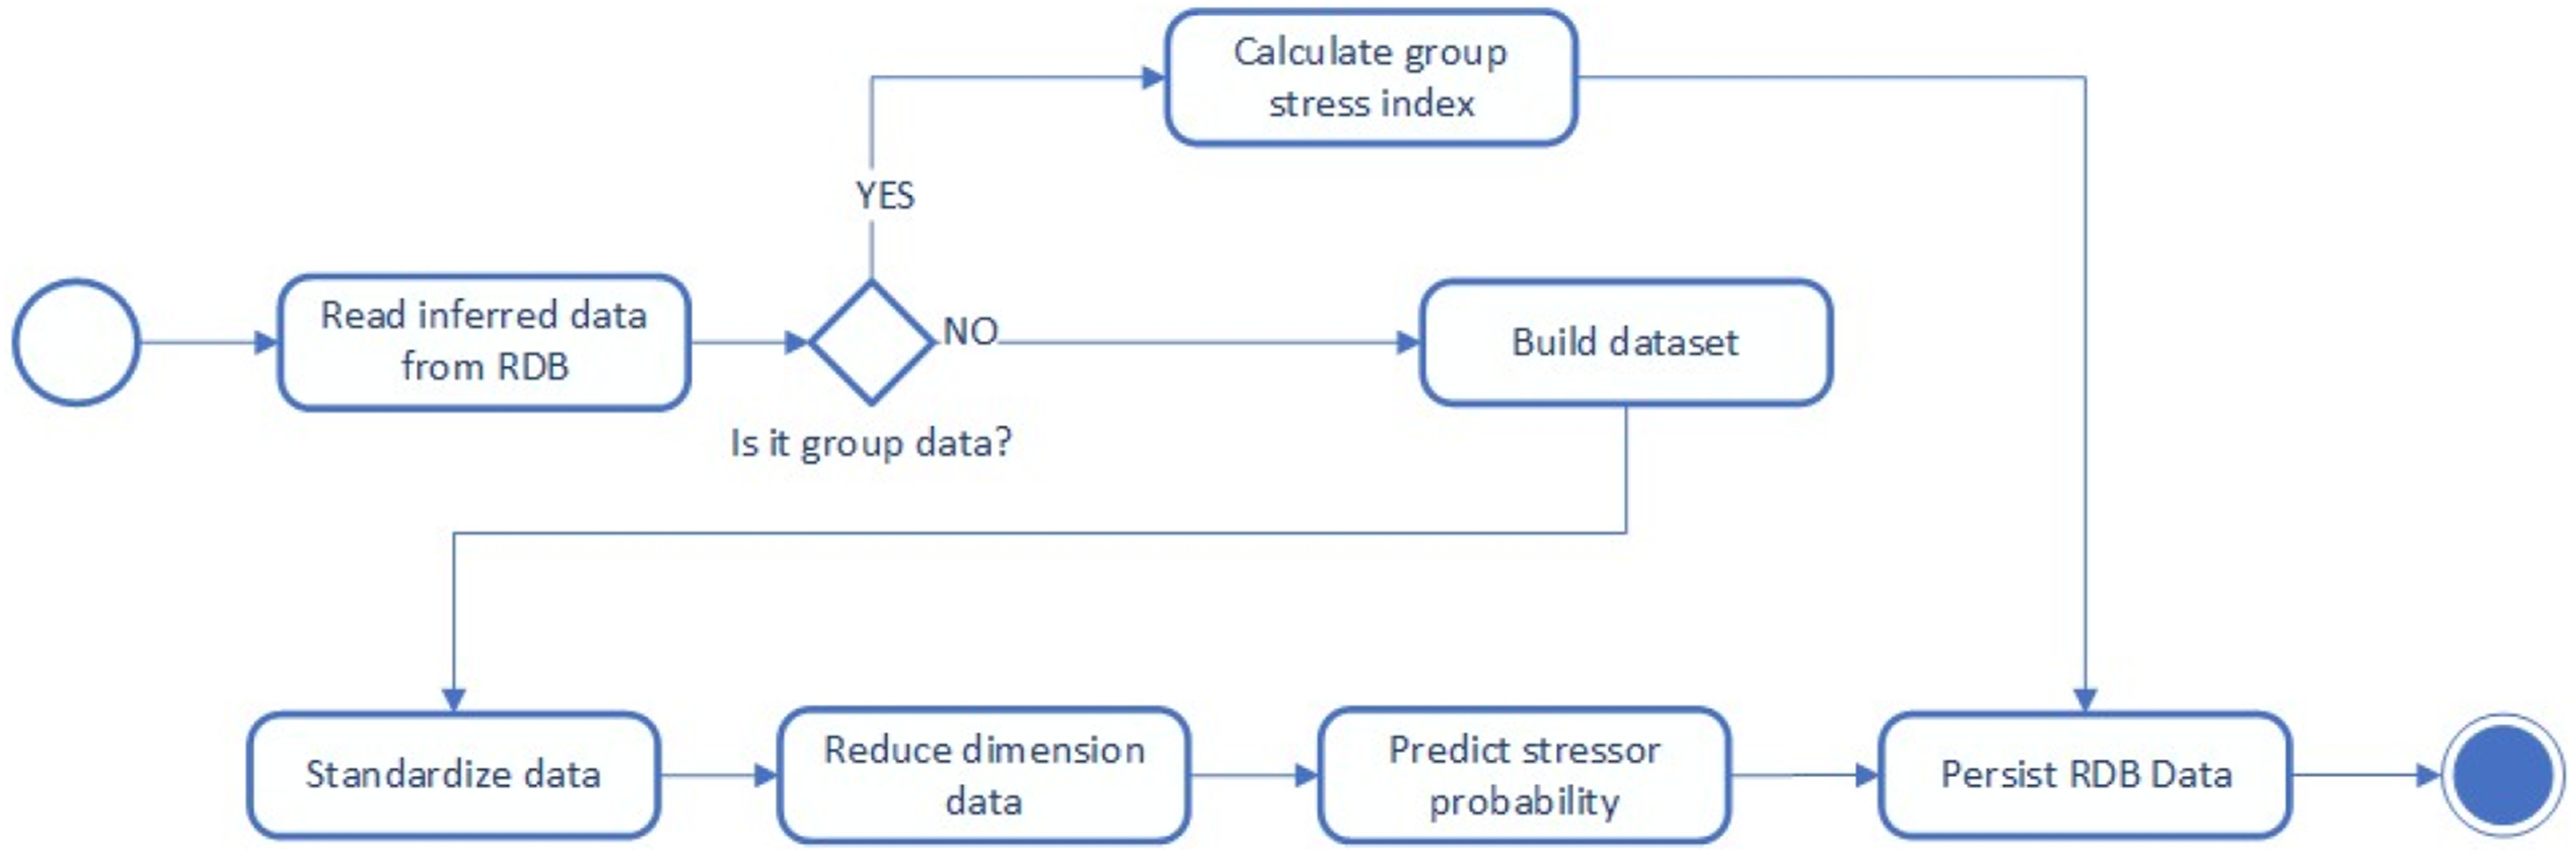
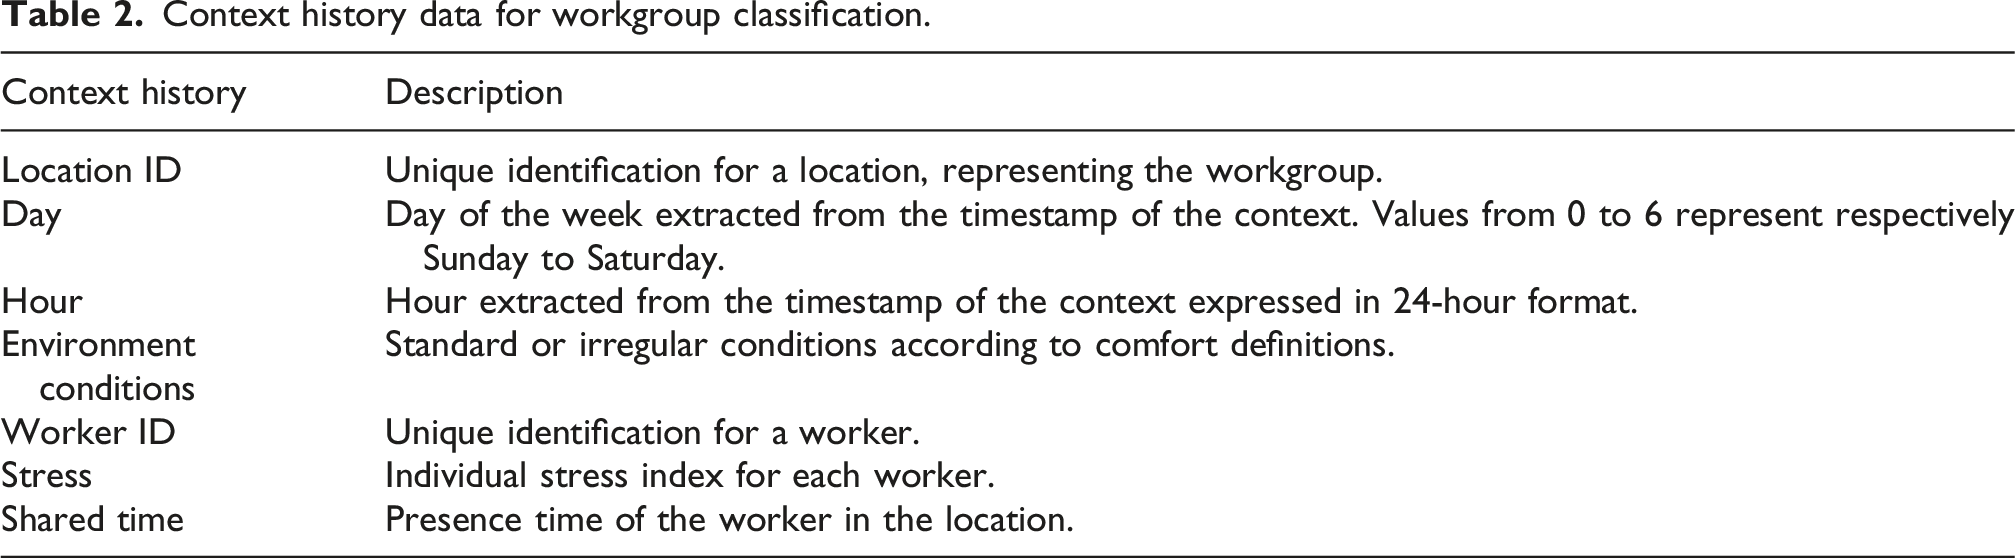
If the data are intended for group evaluation, the process will proceed to calculate the GSI. This index was elaborated as an average of normalized individual stress contributions. Table 2 presents data for context history used to measure GSI. Each worker’s contribution is weighted by the ratio between the worker’s shared time and the maximum shared time observed in the group. For instance, if one worker has 10 minutes of information at a specific location while another worker has only 1 minute in the same period, their weights would be 1 and 0.1, respectively. The GSI calculation is expressed by equation (1) as follows: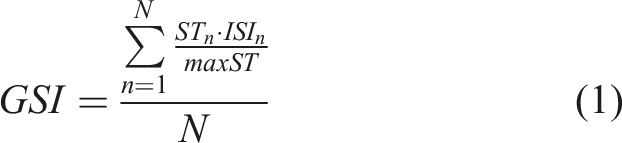
where:
GSI = Group Stress Index
N = number of workers in the group
ST n = shared time spent in the group
maxST = maximum shared time in the group
Context history data for workgroup classification.
The created dataset has variables with different scales, which complicates data analysis and introduces noise into the results. To address this, a standardization algorithm is applied to normalize the values across each dimension, as shown in equation (2):
where:
z = standard score
x = value of the sample
u = mean of the values
s = standard deviation
Also, datasets can be high-dimensional, which can impact the algorithm’s performance. 45 Therefore, a process of dimensionality reduction performs a Principal Component Analysis (PCA) to interpret data. Salem and Hussein 46 explained that PCA is an orthogonal transformation through mathematical methods to reduce the number of possibly correlated variables. The variables resulting from this process are called Principal Components (PC). The classification step applies the SVM and RF algorithms to estimate the probability of possible stressors in the transformed data. The reported probabilities correspond to classifier probability estimates and are interpreted as computational estimates of a context being a stressor, rather than clinically calibrated risk probabilities. SVM and RF are supervised algorithms that require training on a previously classified dataset. The classification target is the identification of a given context as a worker or workgroup stressor, and the final result is a percentage of probability that that context is a target stressor. The last activity performs the persistence of information in the database.
Advisor
The Advisor generates and forwards notifications to the Web UI. Figure 5 depicts agent activity flows. Advisor activities.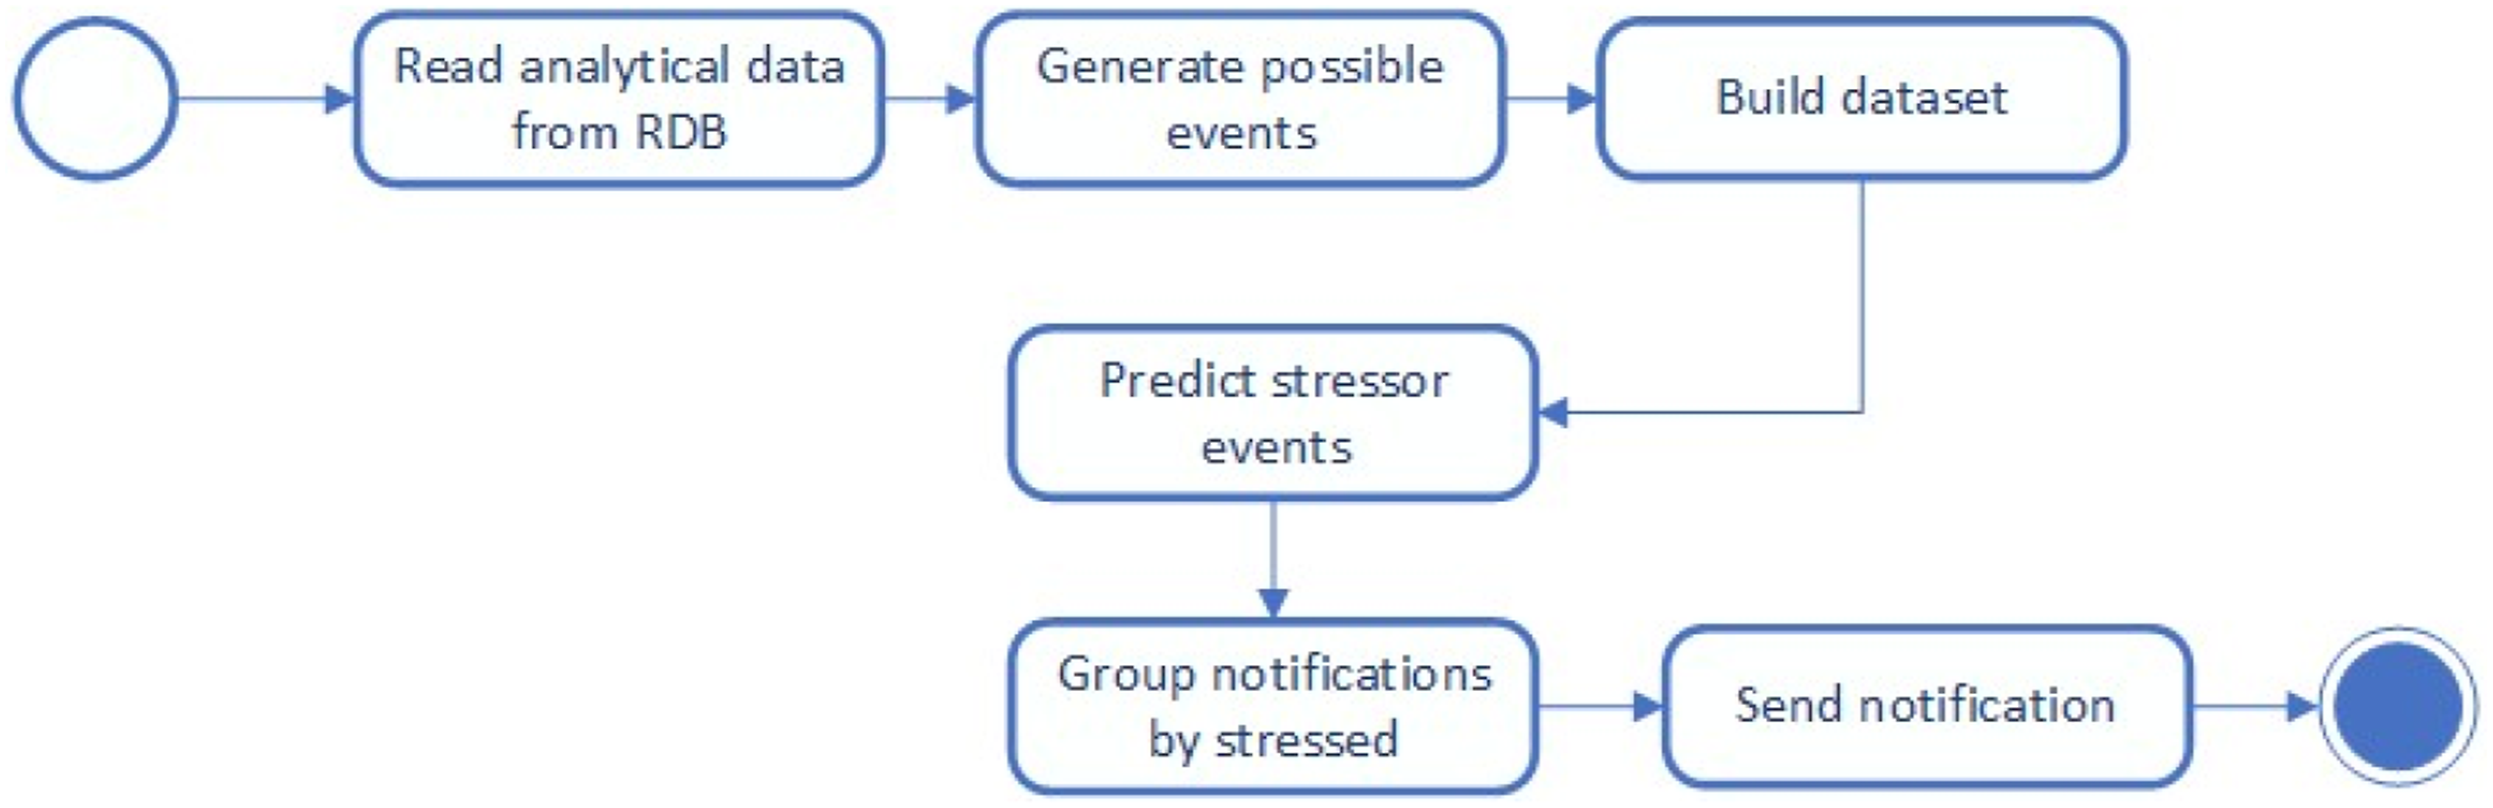
The Advisor agent retrieves the previously registered schedules for each worker in the database. In the sequence, possible new events are generated based on daily routines, such as tasks in the workplace or recurring meetings, and different environmental conditions for each one.
The prediction of stressor events assesses the probability of future situations generated by previous activities. The output result is the percentage of probability that the proposed event can be stressful. The next activity proceeds to a grouping of information according to the stressed target. Finally, the final information is sent to be presented to the end user through the Web UI.
Implementation and evaluation aspects
This section presents an overview of the implementation and evaluation of the Kaire model, covering the prototype development, the simulation process, the preparation and training of machine learning algorithms, as well as the experiments conducted and their results.
Prototype
The model implementation utilizes the Python programming language for development along with third-party libraries for specific purposes. The interaction with machine learning occurs through the scikit-learn library (scikit-learn Library: https://scikit-learn.org/). The simulation of an industrial scenario is built with the help of the SimPy (SimPy Library: https://simpy.readthedocs.io/) module. The environmental information is delivered by the industry’s application and synchronized with the communication agent. The model’s stored data uses two database patterns. In order to save context history information, InfluxDB (InfluxDB: https://www.influxdata.com/) is employed. The purpose of this database is to handle large data volumes and interact with real-time applications, IoT, and cloud services. Considering the large amount of information collected from workers and the environment, InfluxDB meets this demand for temporal information. However, structured and related information is also necessary within the organization of this model. The MySQL (MySQL Database: https://www.mysql.com/) relational database manages control data and synthetic analyses. The reasoning implementation is based on the ontology design, generating the application classes. The architectural pattern used in the implementation is hexagonal architecture. Figure 6 depicts the Kaire model organization pattern. Hexagonal architecture pattern applied for Kaire model.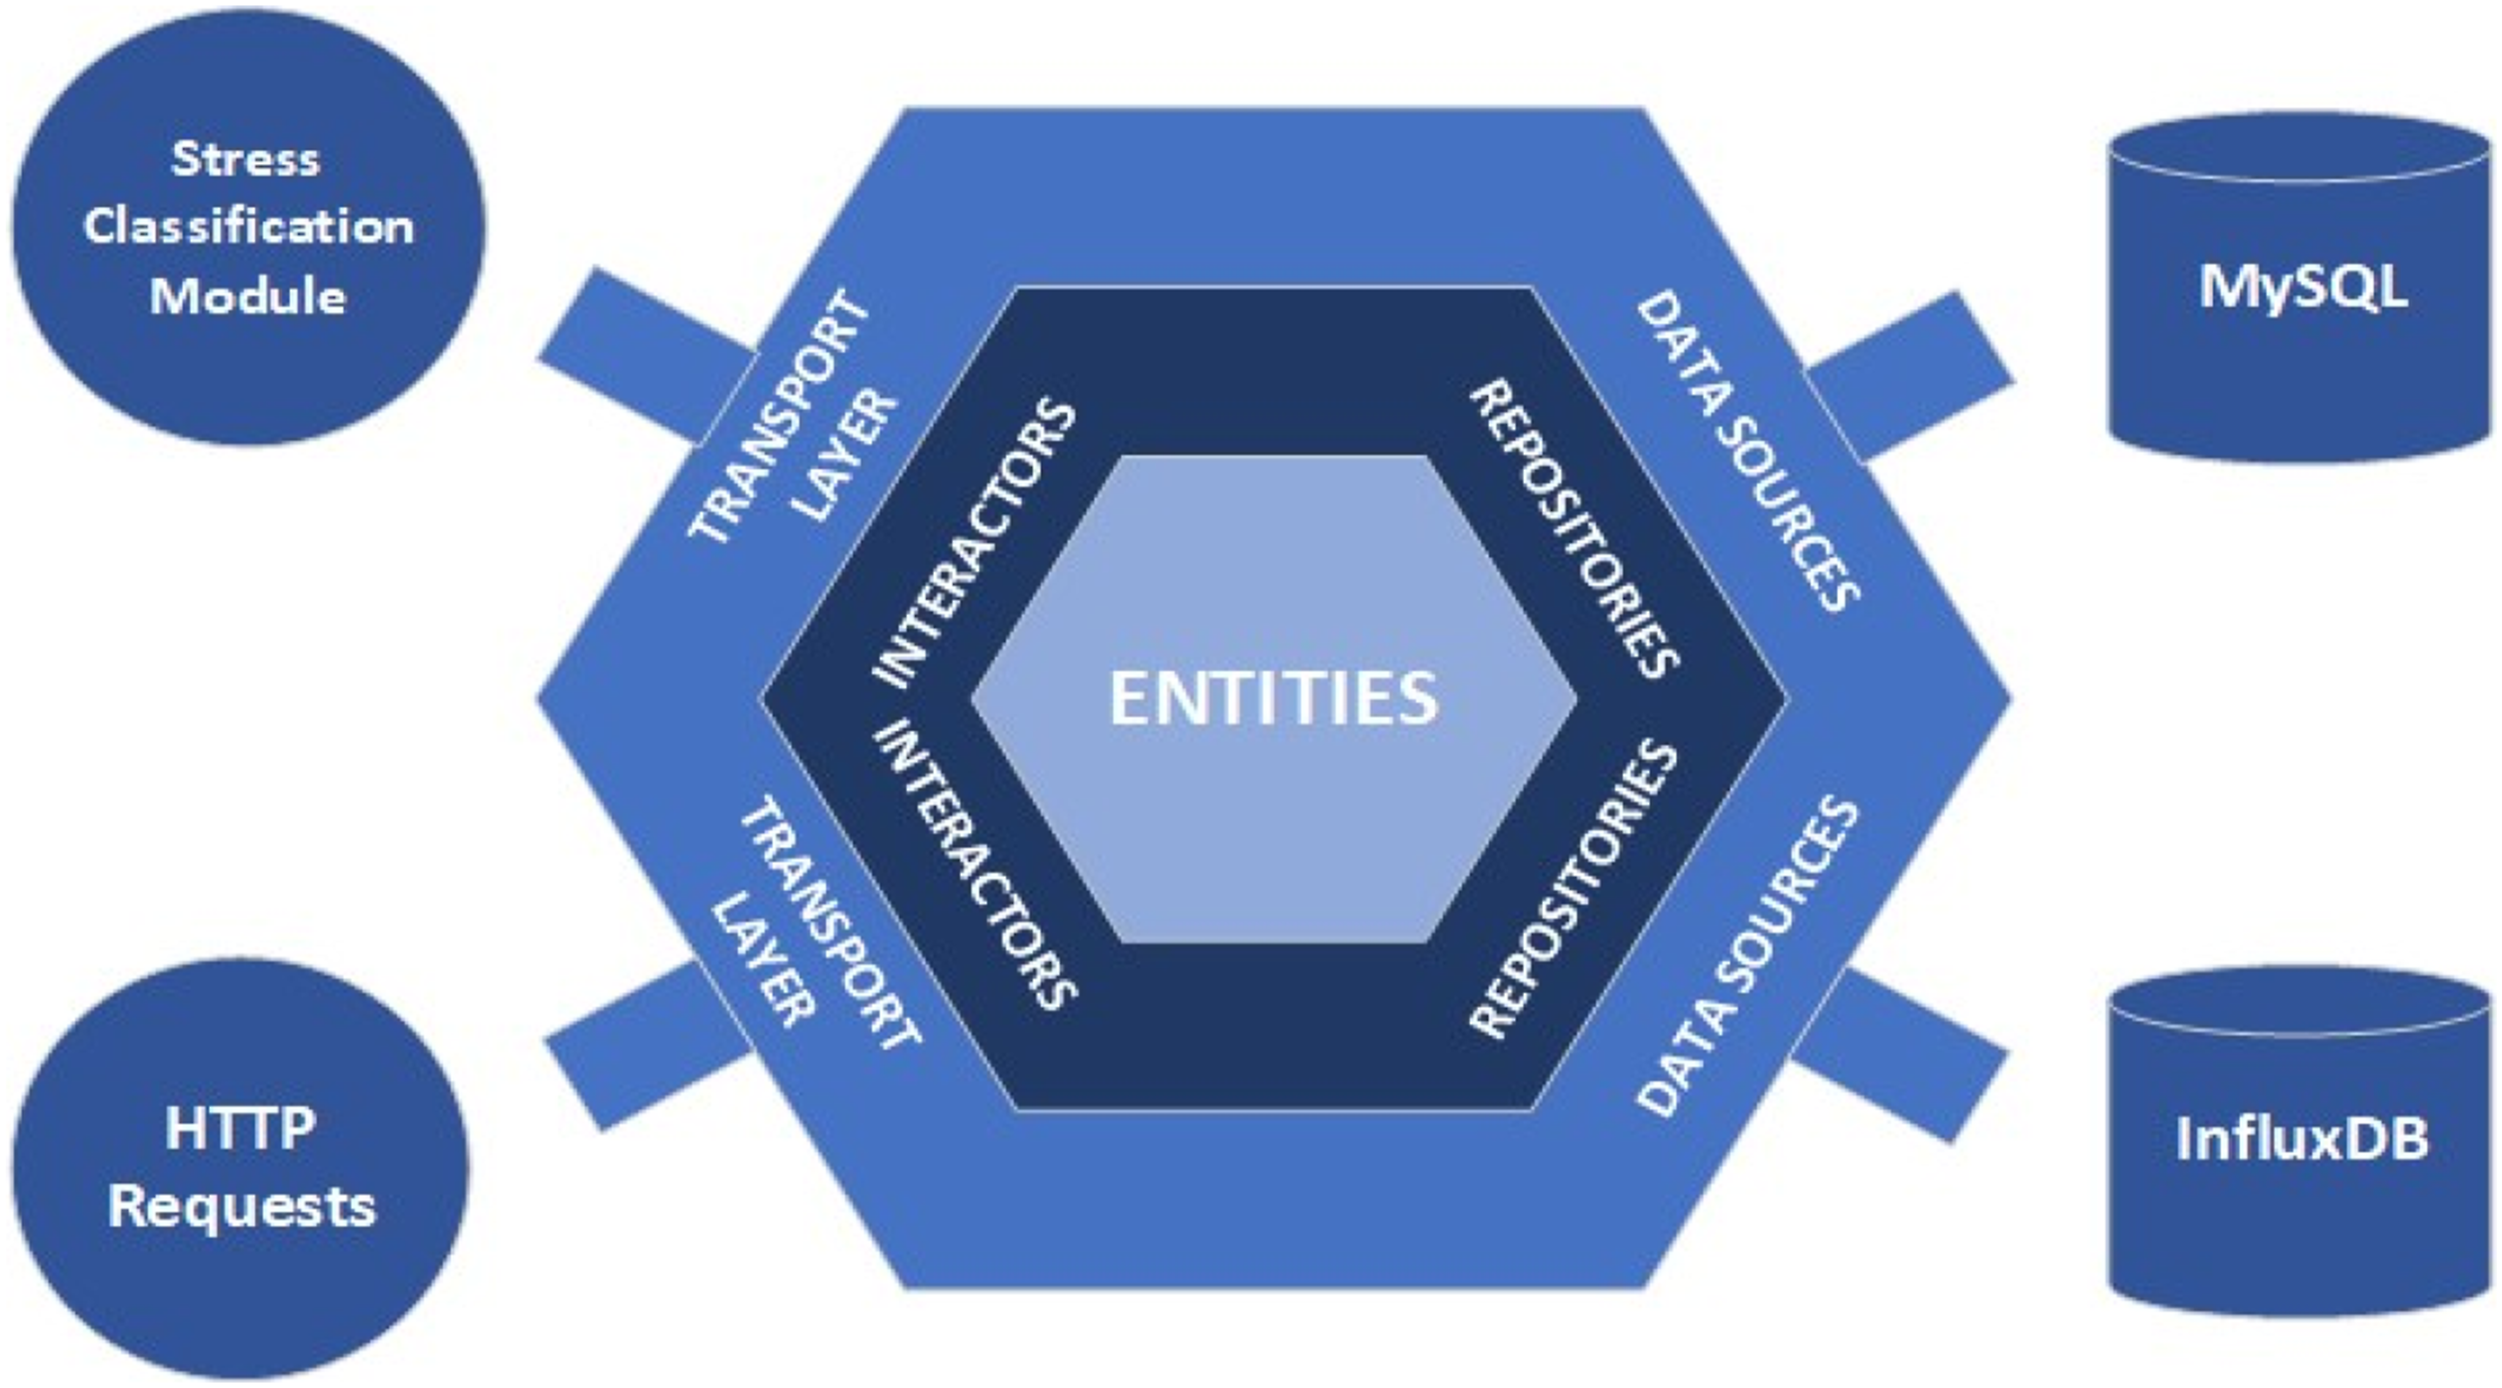
The Hexagonal Architecture design pattern is based on three layers: domain, application, and framework. Each layer is connected using Ports and Adapters, independent of each other. The key principle of the pattern is that the inner layers are not aware of their outer layers. This ensures that the application’s core business logic is not affected by any of the external services.
The source code of the Kaire prototype, including the ontology files, simulator, stressor identification, and prediction modules, is available in a GitHub repository (https://github.com/cgoetzf/kaire).
Simulation
Simulators enable initial observations and performance tests of developed models without posing physical or psychological risks to participants. However, the validity of these evaluations relies on the simulation’s consistency with the model’s objectives. To demonstrate the model’s functionality, the simulator was developed based on a basic manufacturing industry routine.
The simulator was developed from the ontology domain, considering its activities and measures. SimPy supports a multi-agent system with parallel, asynchronous events, reproducing industry activities virtually. The code includes a main class and two classes defining operator and environment behaviors.
The main class initializes the parameters and instantiates the SimPy, Operator, and Environment classes, creating the environment, workers, and the processes that will be executed. The SimPy framework allows all created processes to be executed in parallel, according to their parameters, making it possible to create a complex emulation environment.
The Operator class has worker attributes and functions responsible for collecting the person’s data, carrying out the displacement, and managing the HRV according to each event and environment. The displacement changes the location attribute and calculates the distance to be traveled and the time taken to reach the destination. The purpose of the simulator about the worker is to generate stress information in certain situations. Ramteke
47
showed that the HRV is an efficient way to identify stress because it is not a stationary signal. Sahroni
48
explained that one of the HRV analysis alternatives consists of the time domain method, identifying R peak over time. According to Salahuddin et al.,
49
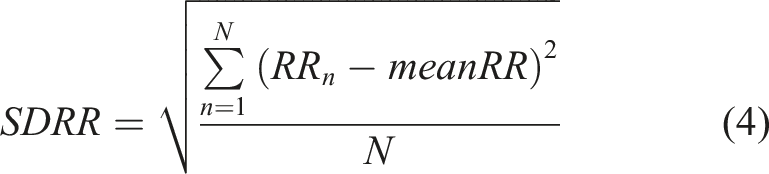
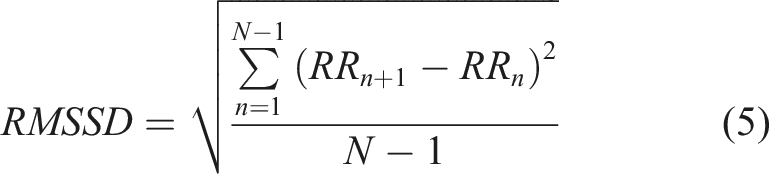
HRV can be calculated considering the measurement of R-R (RR) intervals for long term (24 h) or short term (5 min), the shortest being the most suitable for the Kaire model. Thus, the simulator registers the RR interval every second and calculates the Root Mean Square of Successive Differences between normal RR intervals (RMSSD) and the Standard Deviation of all the RR intervals (SDRR) every 5 min by applying the equations as follows: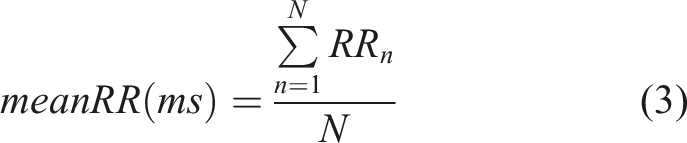
The Environment class contains the attributes of the industry, being: temperature and noise of the different environments, capacities of each stock, and initial amount of raw material. Also, in the construction of the class, the processes run periodically to collect data from the environment. This class also defines the quality assessment methods performed at the end of each manufacturing process.
A manufacturing industry was the basis of processes for the simulator. Figure 7 shows the blueprint on which the algorithm logic was built. The industry is divided into 6 major areas: (1) raw materials warehouse, (2) component 1 sector, (3) component 2 sector, (4) assembly sector, (5) final product stock, and (6) supervisor room. Each area presented has a specific dimension used as a basis for calculations of other functions of the algorithm. Blueprint used for simulating work activities and displacement.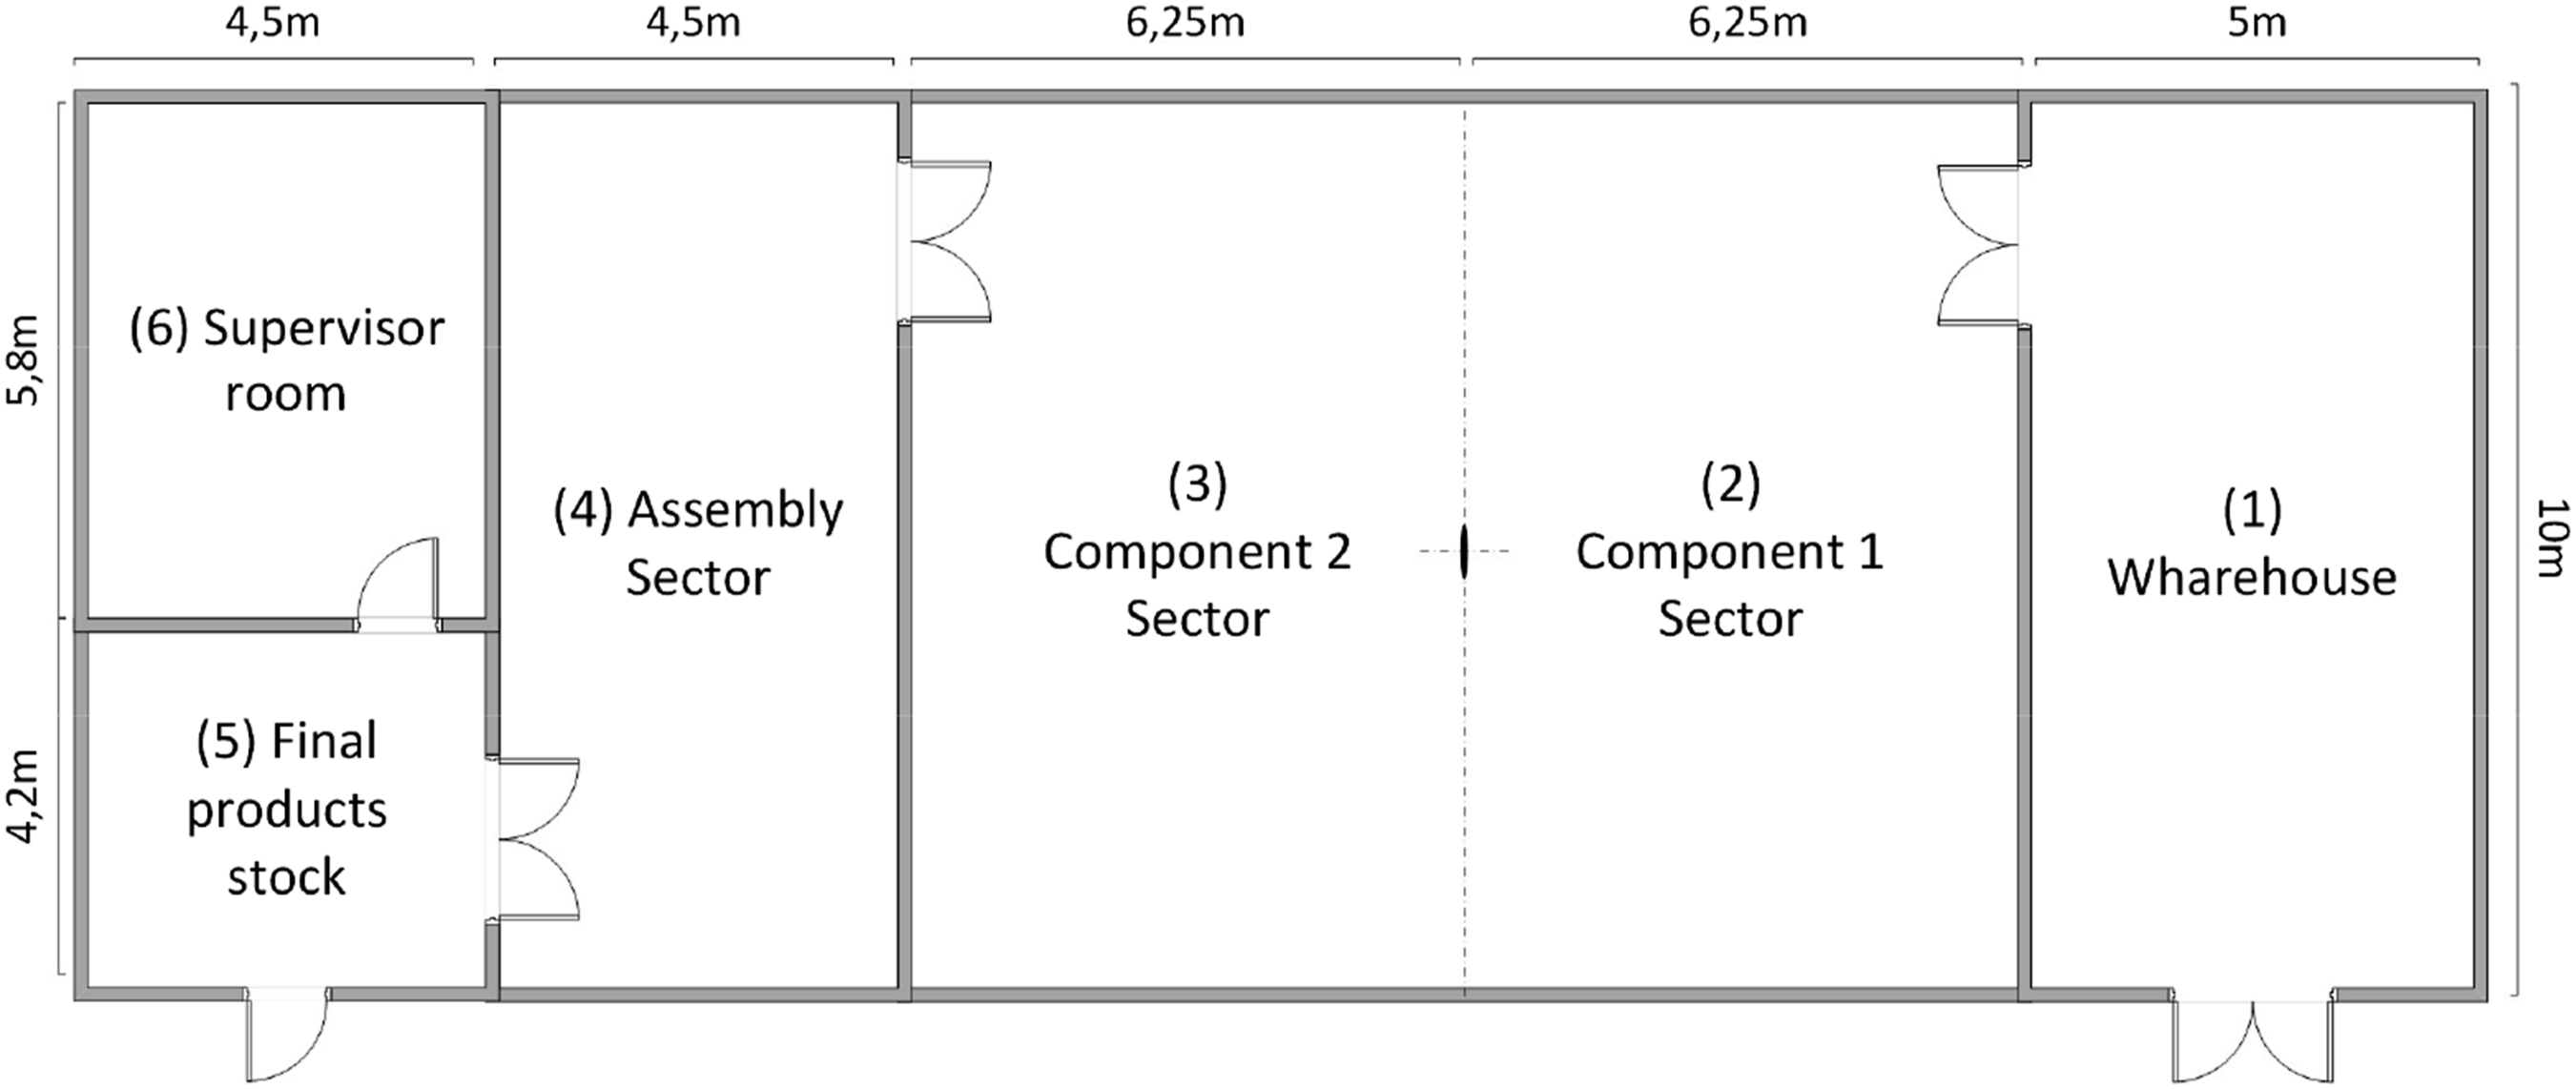
Figure 8 demonstrates the process flow executed in the simulator. The order backlog has only one type of product that goes through all stages of production, from the raw material warehouse to the final product stock. Each operational phase of the product’s manufacture is submitted to a quality assessment process, in which the operator is prone to a stress variation based on a coefficient. Also, every activity, overtime, and meetings have a stress coefficient assigned. Workflow applied in simulator.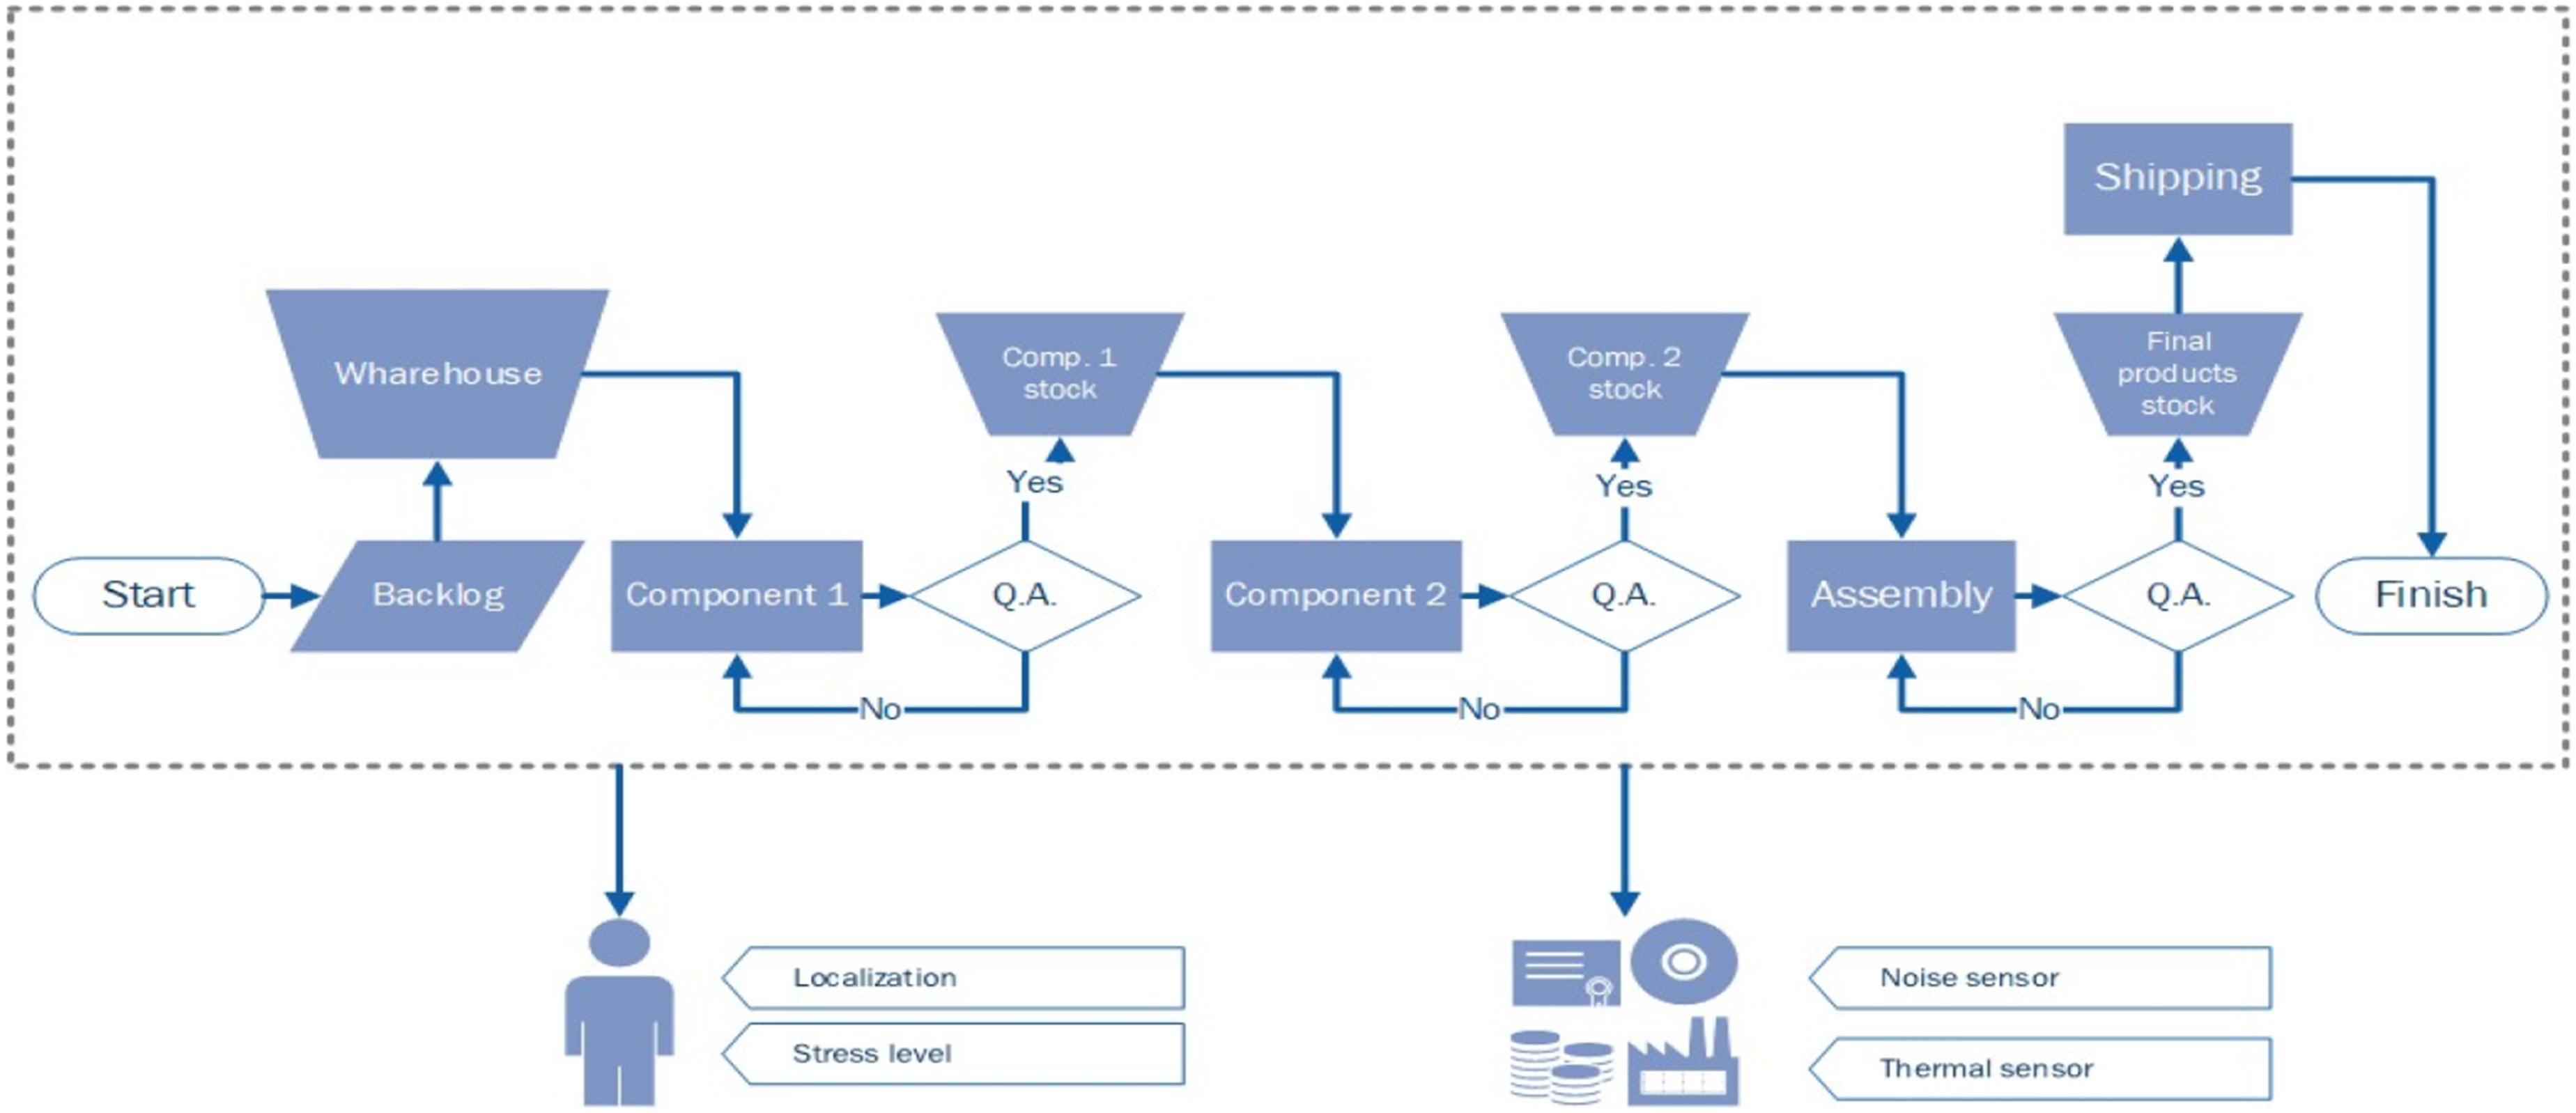
Guidelines for simulator behavior settings.
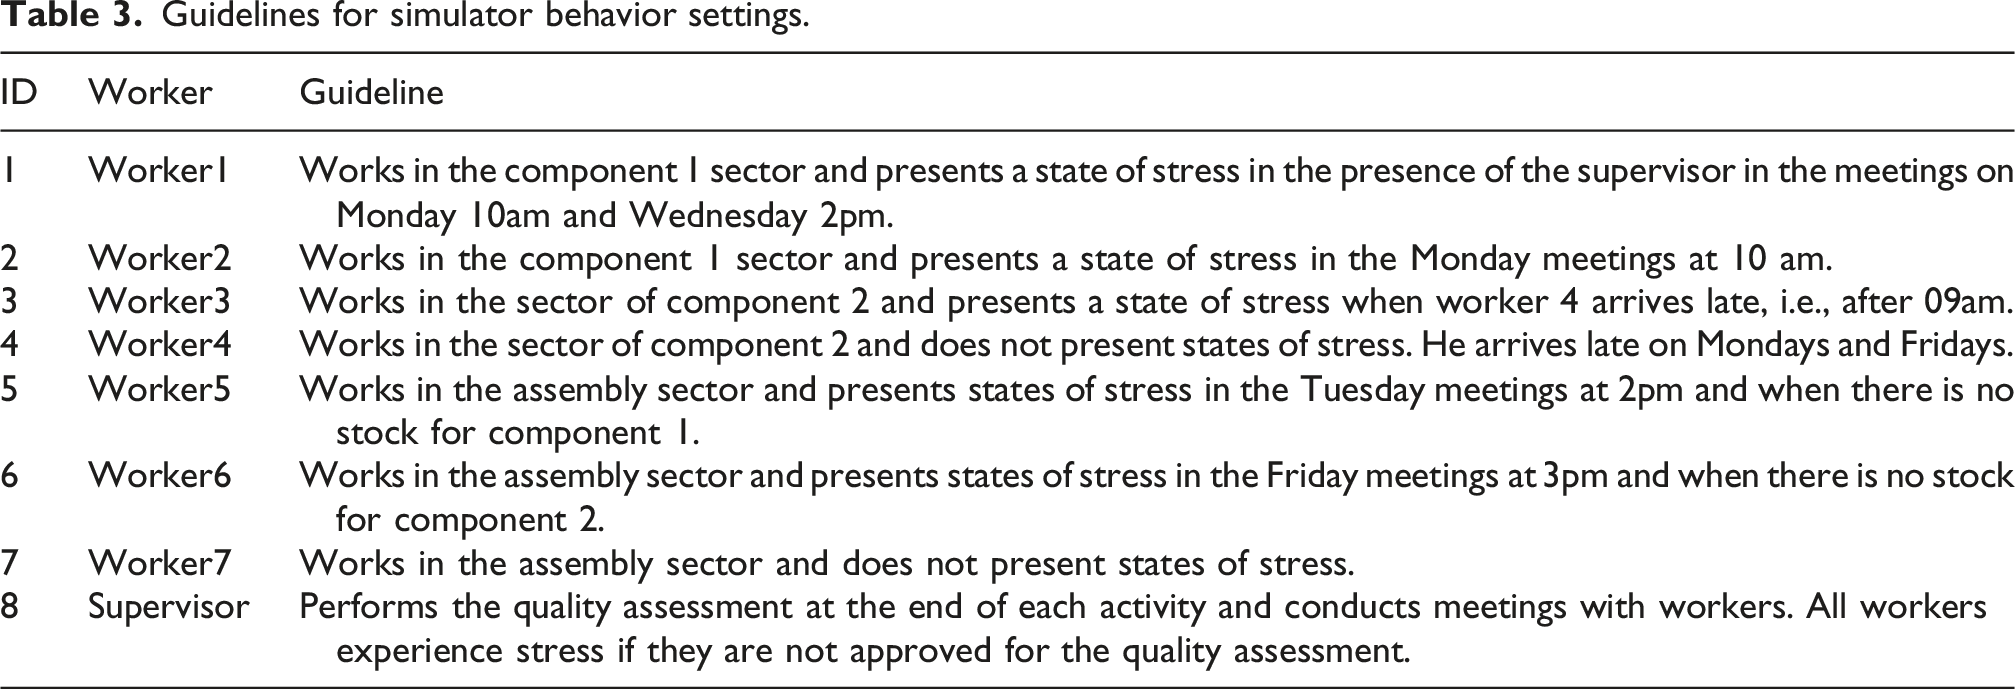
The stressor and non-stressor labels used to train the supervised algorithms were generated from the simulator presets. The predefined behaviors in Table 3 define the situations in which each worker should present stress. When a simulated context matched one of these predefined situations and activated the worker’s stress state, the context was labeled as a stressor. Contexts outside these conditions, or contexts in which the worker remained non-stressed, were labeled as non-stressors. The stress coefficients associated with quality assessment, activities, overtime, and meetings were treated as internal simulator parameters. Therefore, the simulation provided a controlled initial evaluation with known labels, although it does not replace future validation with real industrial data.
Training
This section covers the preparation and implementation of the Kaire Model. SVM and RF are supervised algorithms that require training to classify incoming data. The training also allows inferring the quality of the classification through metrics applied to the result. This process consists of using a dataset composed of inputs and desired labeled outputs, defining the behavior for new data. 50
The simulator starts the process by generating the dataset used for Ontology Reasoner agent considering 30 days, given a full cycle of information necessary for the classification that contemplates all days of the week, all hours of the day, and all weekly meetings. So, the ontology provides the context histories for Stressor Identifier agent through the results of SPARQL Protocol and RDF Query Language (SPARQL) queries.
The next step is to conduct standardization. The dataset contains different magnitudes for each feature, for example, duration in seconds and HRV in milliseconds. Some machine learning algorithms are sensitive to feature scaling, while others are practically invariant to it. 50 Distance algorithms such as SVM are more affected by the variety of features. In this case, similarity is determined by the distances between data points and can cause errors in the result if greater weight is assigned to features of greater magnitude. 29 In addition, this difference impacts the algorithm’s performance. On the other hand, RF is a tree-based algorithm, being little affected by resource scale. A decision tree splits a node based on a single feature, not influencing other features.
Dimension reduction is performed after standardization, using the PCA technique. Subsequently, the transformed data are divided into training and test sets using a 70/30 split. The training set is used to teach how the algorithm should behave, while the test set is used to evaluate successes and errors through classification metrics. Accuracy, precision, recall, and F1 score are the metrics used for this purpose, considering True Positive (TP), False Positive (FP), True Negative (TN), and False Negative (FN). Each metric is defined by equations as follows:



Accuracy (6) is represented by the simple ratio between correct predictions and the total predictions performed. A high precision (7) expresses few false positives, and a high recall (8) implies few false negatives. The F1-score (9) is considered a harmonic mean of precision and recall.
Results
For the analysis, the information generated by the simulator for 30 days was used. The data generated comprised 21,120 records for workers and 15,860 records for the environment. This simulation data was sent to the Ontology Reasoner to be processed according to the established domain. Figure 9 shows a fragment from the data output of SPARQL queries. Fragment of the SPARQL query result with simulated data.
Stressor Identifier receives the ontology result and performs standardization and dimension reduction to prepare the data for classification. Figure 10 presents the result of standardization, depicting in the first image a graph of duration, shared time, RMSSD, and SDRR, where the information has different magnitudes, hence RMSSD and SDRR do not stand out in the image, while the second image presents a standardized graph with equalized magnitudes and all data emphasized. Comparison of data before standardization, first image, and after standardization, second image.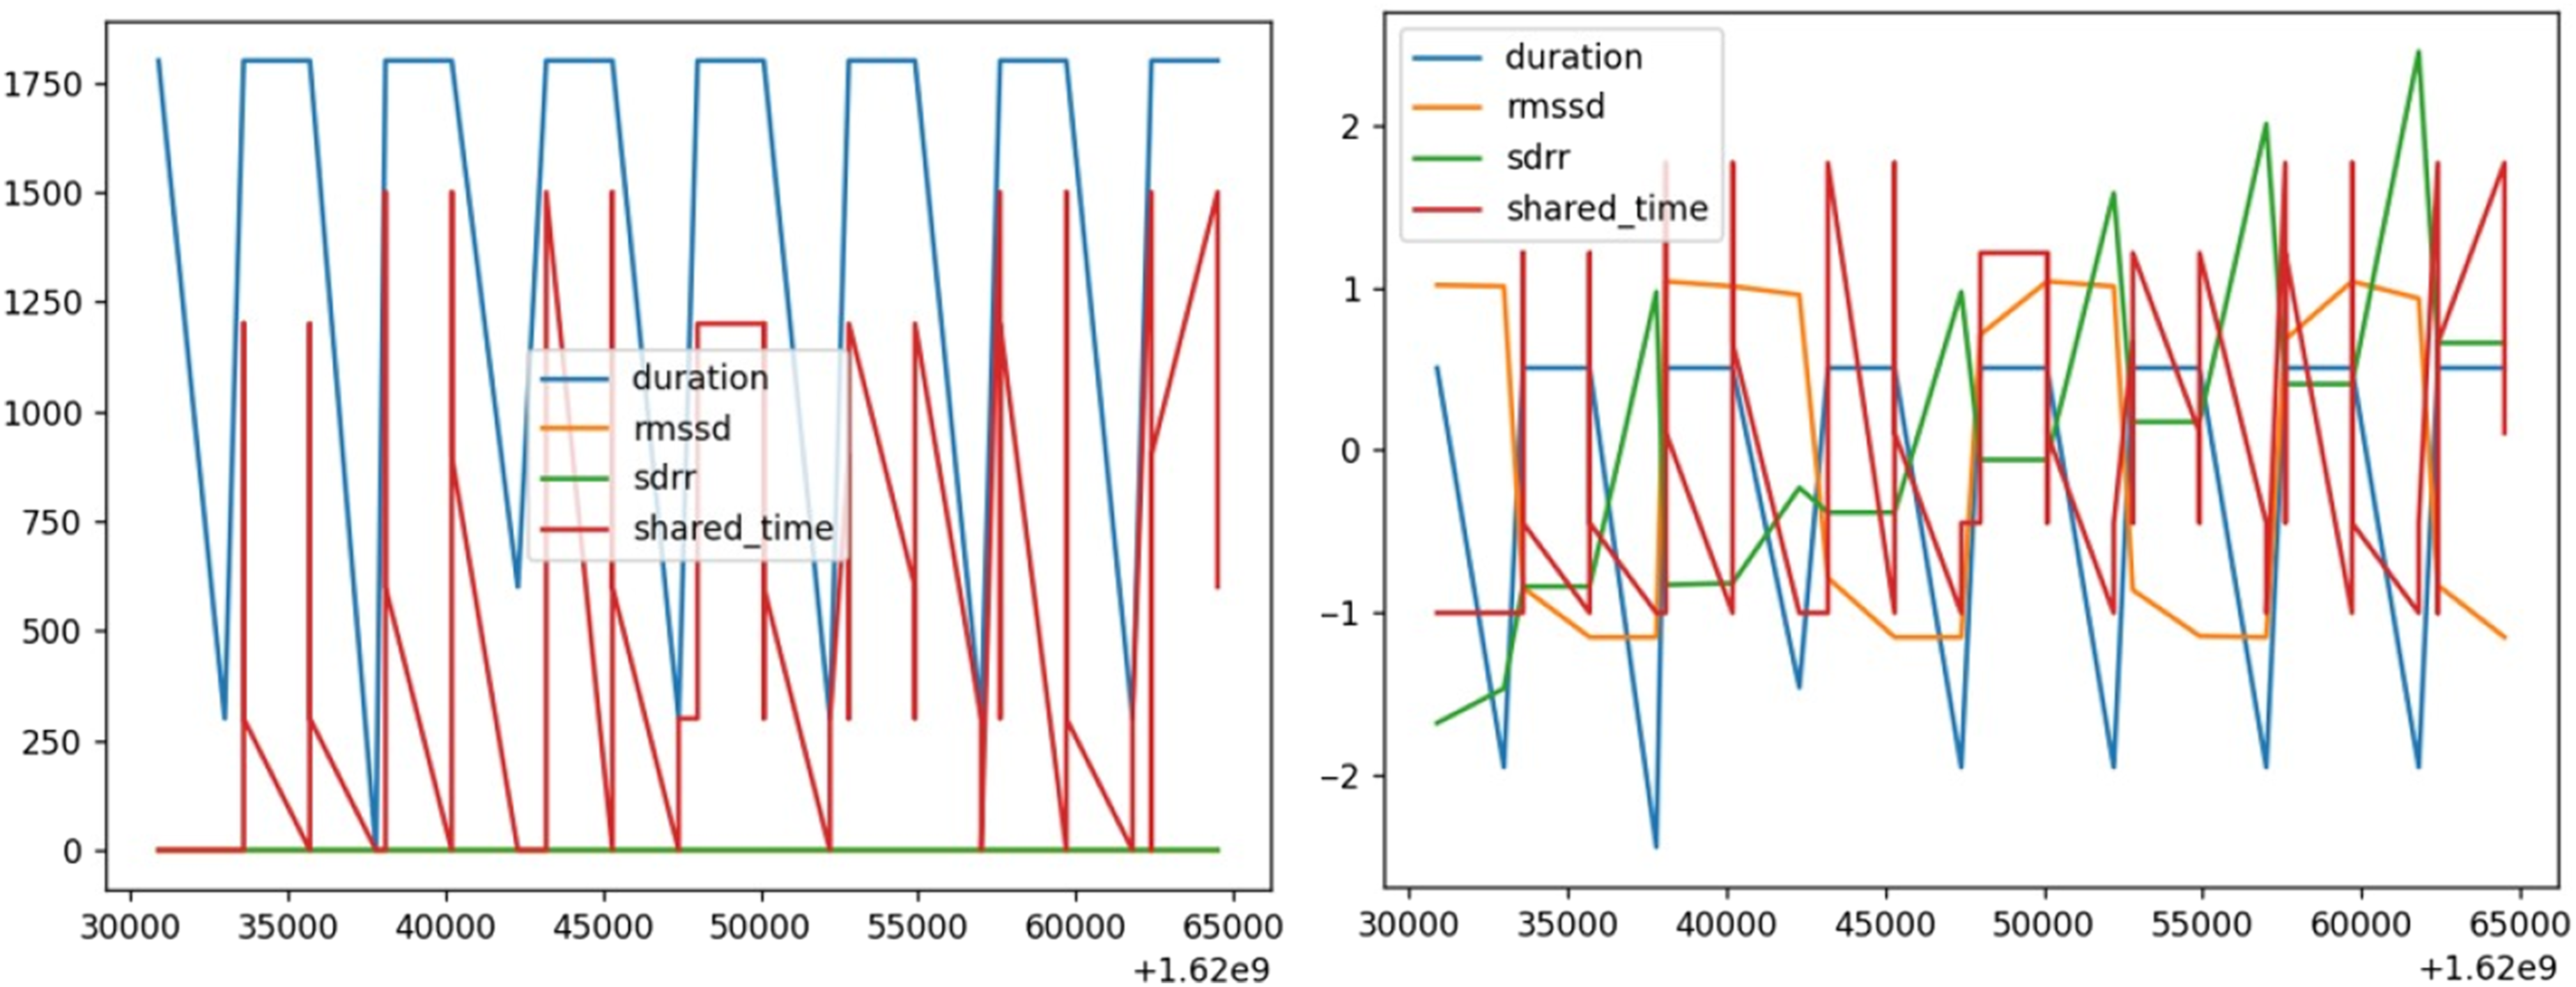
Next, the identification of stressors is performed using the SVM and RF algorithms over the data with dimensions reduced. Figure 11 shows the scatter plot of the classification performed before and after standardization. Green dots represent possible stressors and red dots mean they are not stressors. The first image illustrates classification without standardization and scattered data, while the second depicts grouped data and a more segmented view after standardization. Standardized data allow for a better identification of the group of data that represents the stressors. Scatter plot of stressors’ classification before and after standardization.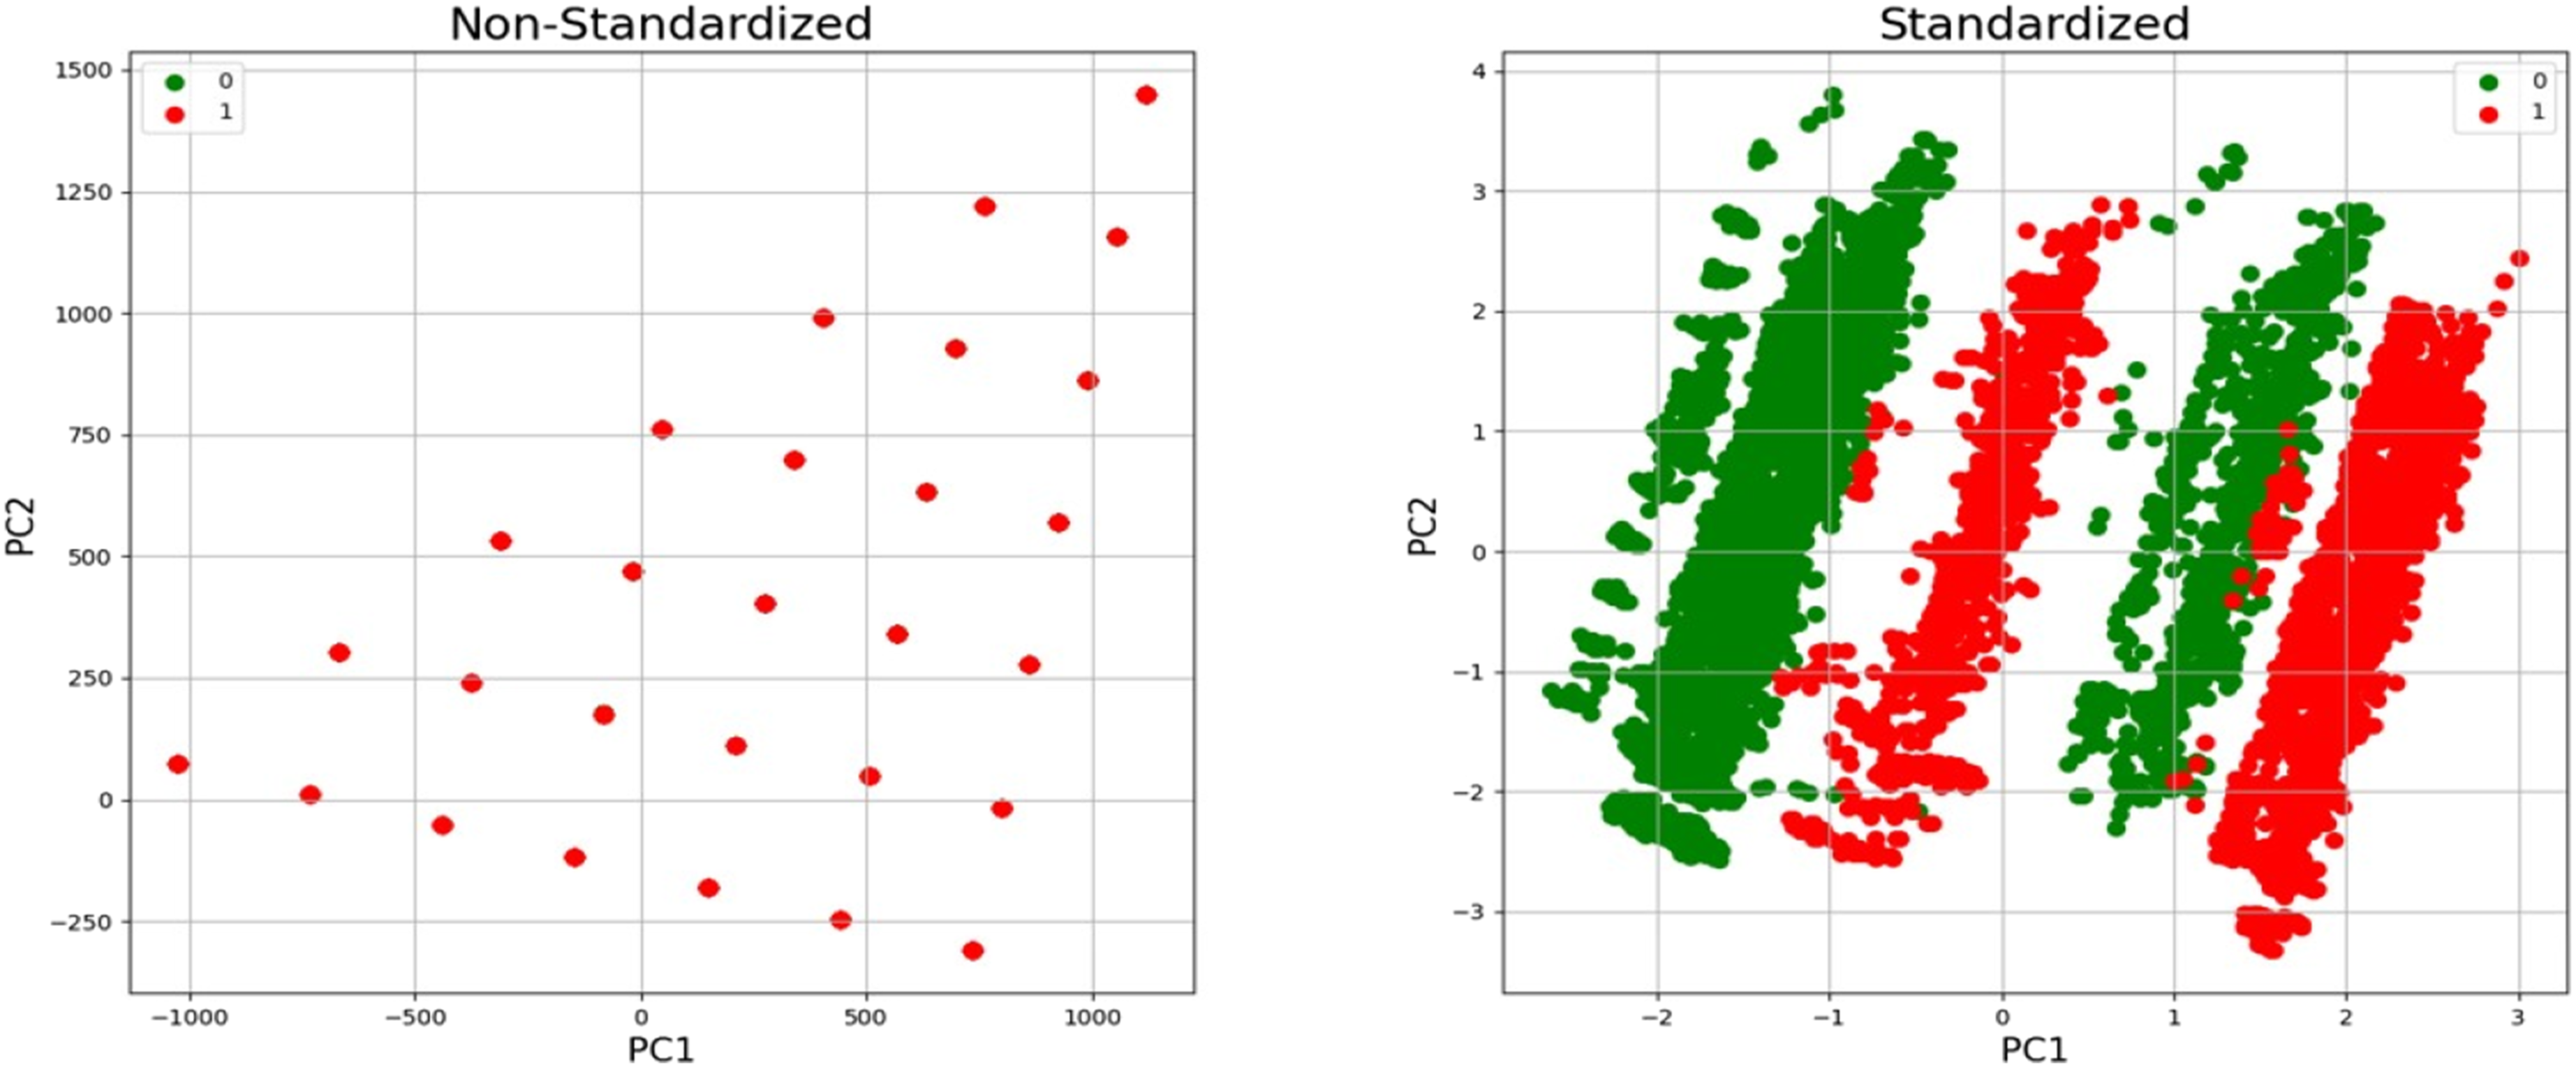
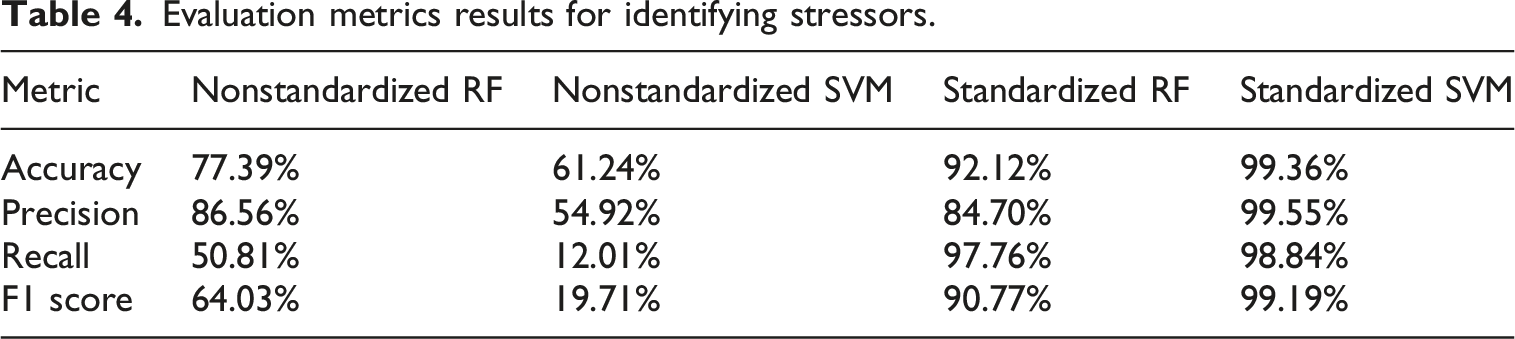
Evaluation metrics results for identifying stressors.
Moreover, Figure 12 shows a confusion matrix allowing visualization of the algorithm’s performance. Following the order of the upper and then lower quadrants, the values represent the number of True Negatives, False Positives, False Negatives, and True Positives, respectively. A good performance is evidenced by high True Positive and True Negative counts and low False Positive and False Negative counts. Confusion matrix.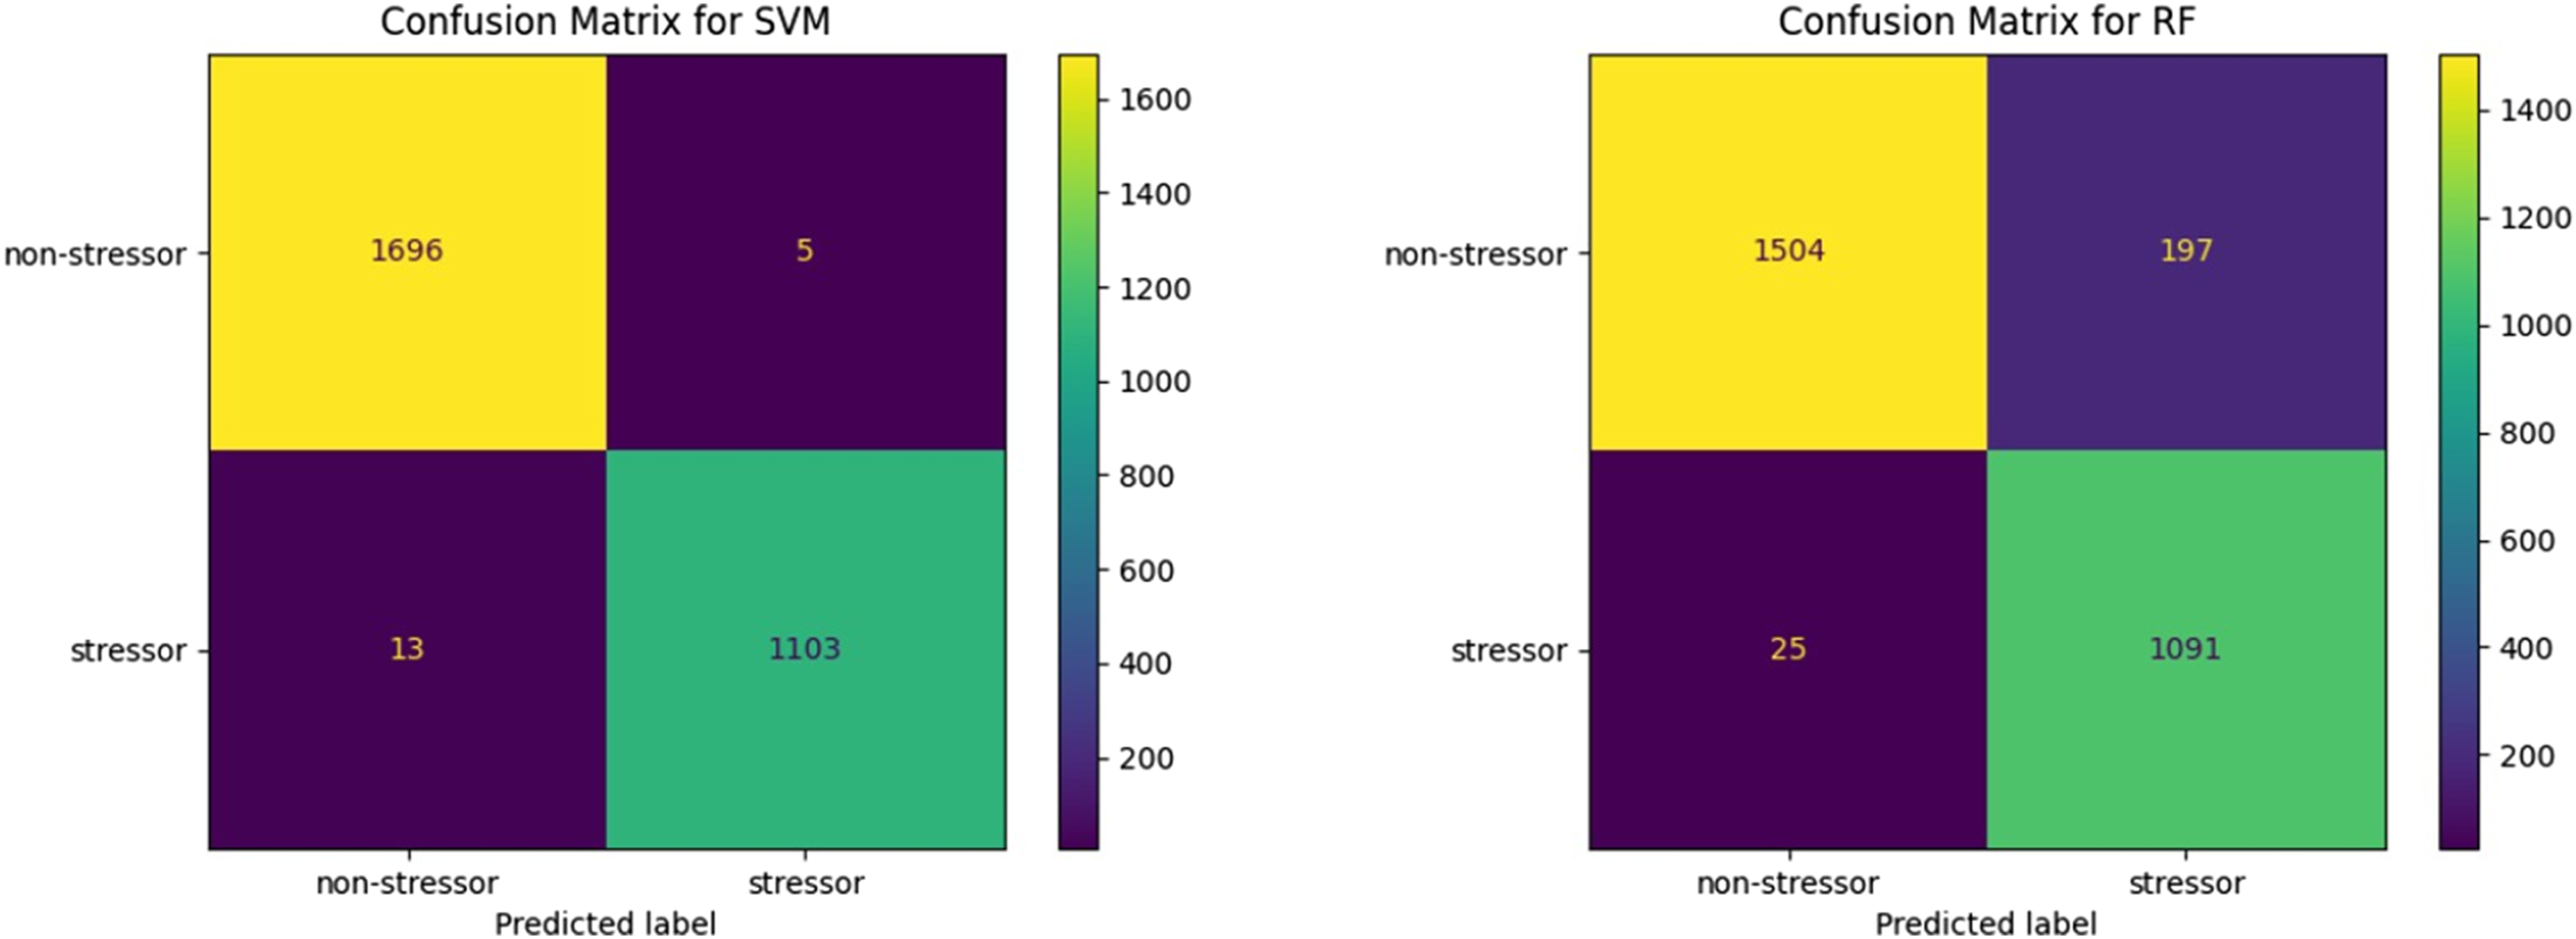
Figure 13 displays the output with raw data from the classifier, and then, the information is converted into a human-interpretable notification. Other predefined behaviors in the simulator were also compared in the results and presented the expected outputs. Presentation of the classification results in tabular form and the composite notification.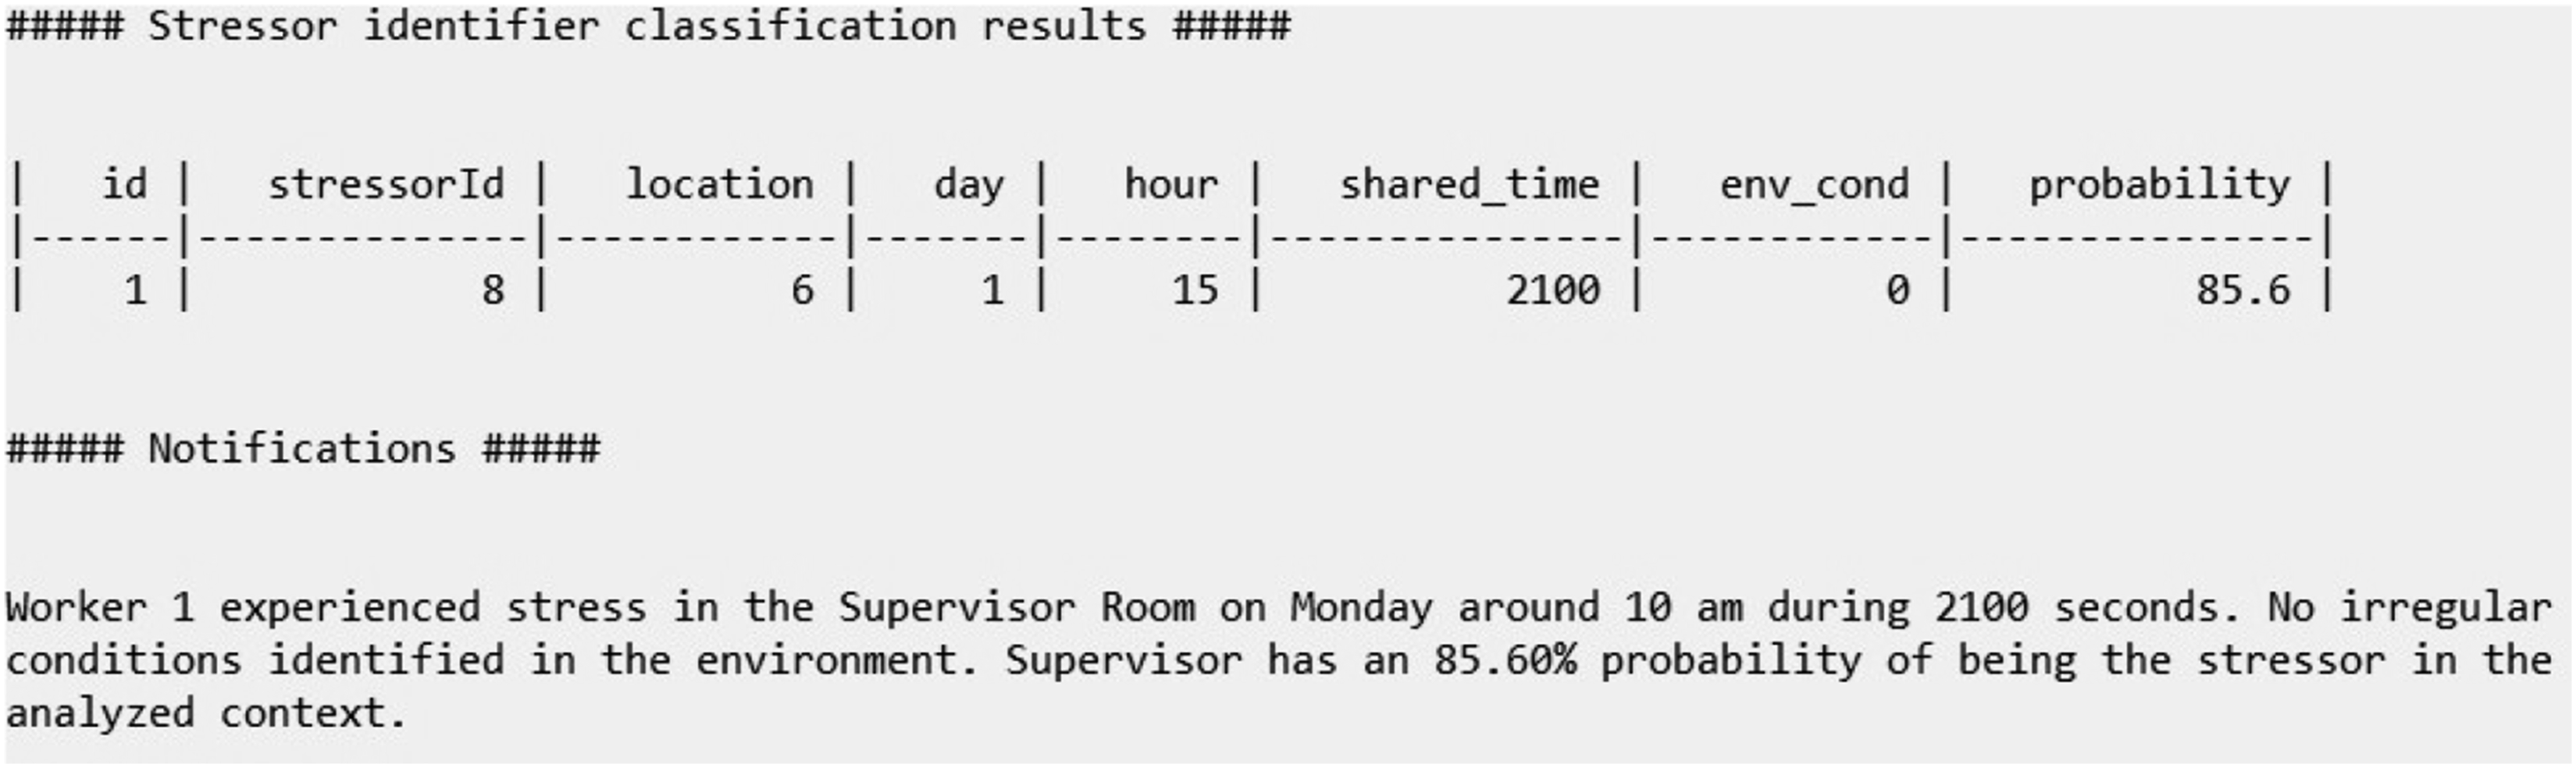
Also on the Stressor Identifier, the flow of activities proceeds to calculate the GSI using the context output of the ontology specific for this purpose. The evaluation of the index considers the similarity analysis between the vector of calculation results compared to the vector of simulator presets for each situation reaching 88.39% of similarity. Figure 14 lists the result of GSI performed for workgroups in each location on Monday at 10 am. The elevated GSI value in the Supervisor Room (locationId = 6) corresponds to the Component 1 sector supervisory meeting, in which two workers have predefined behavior settings associated with stress. Presentation of the outputs for GSI results.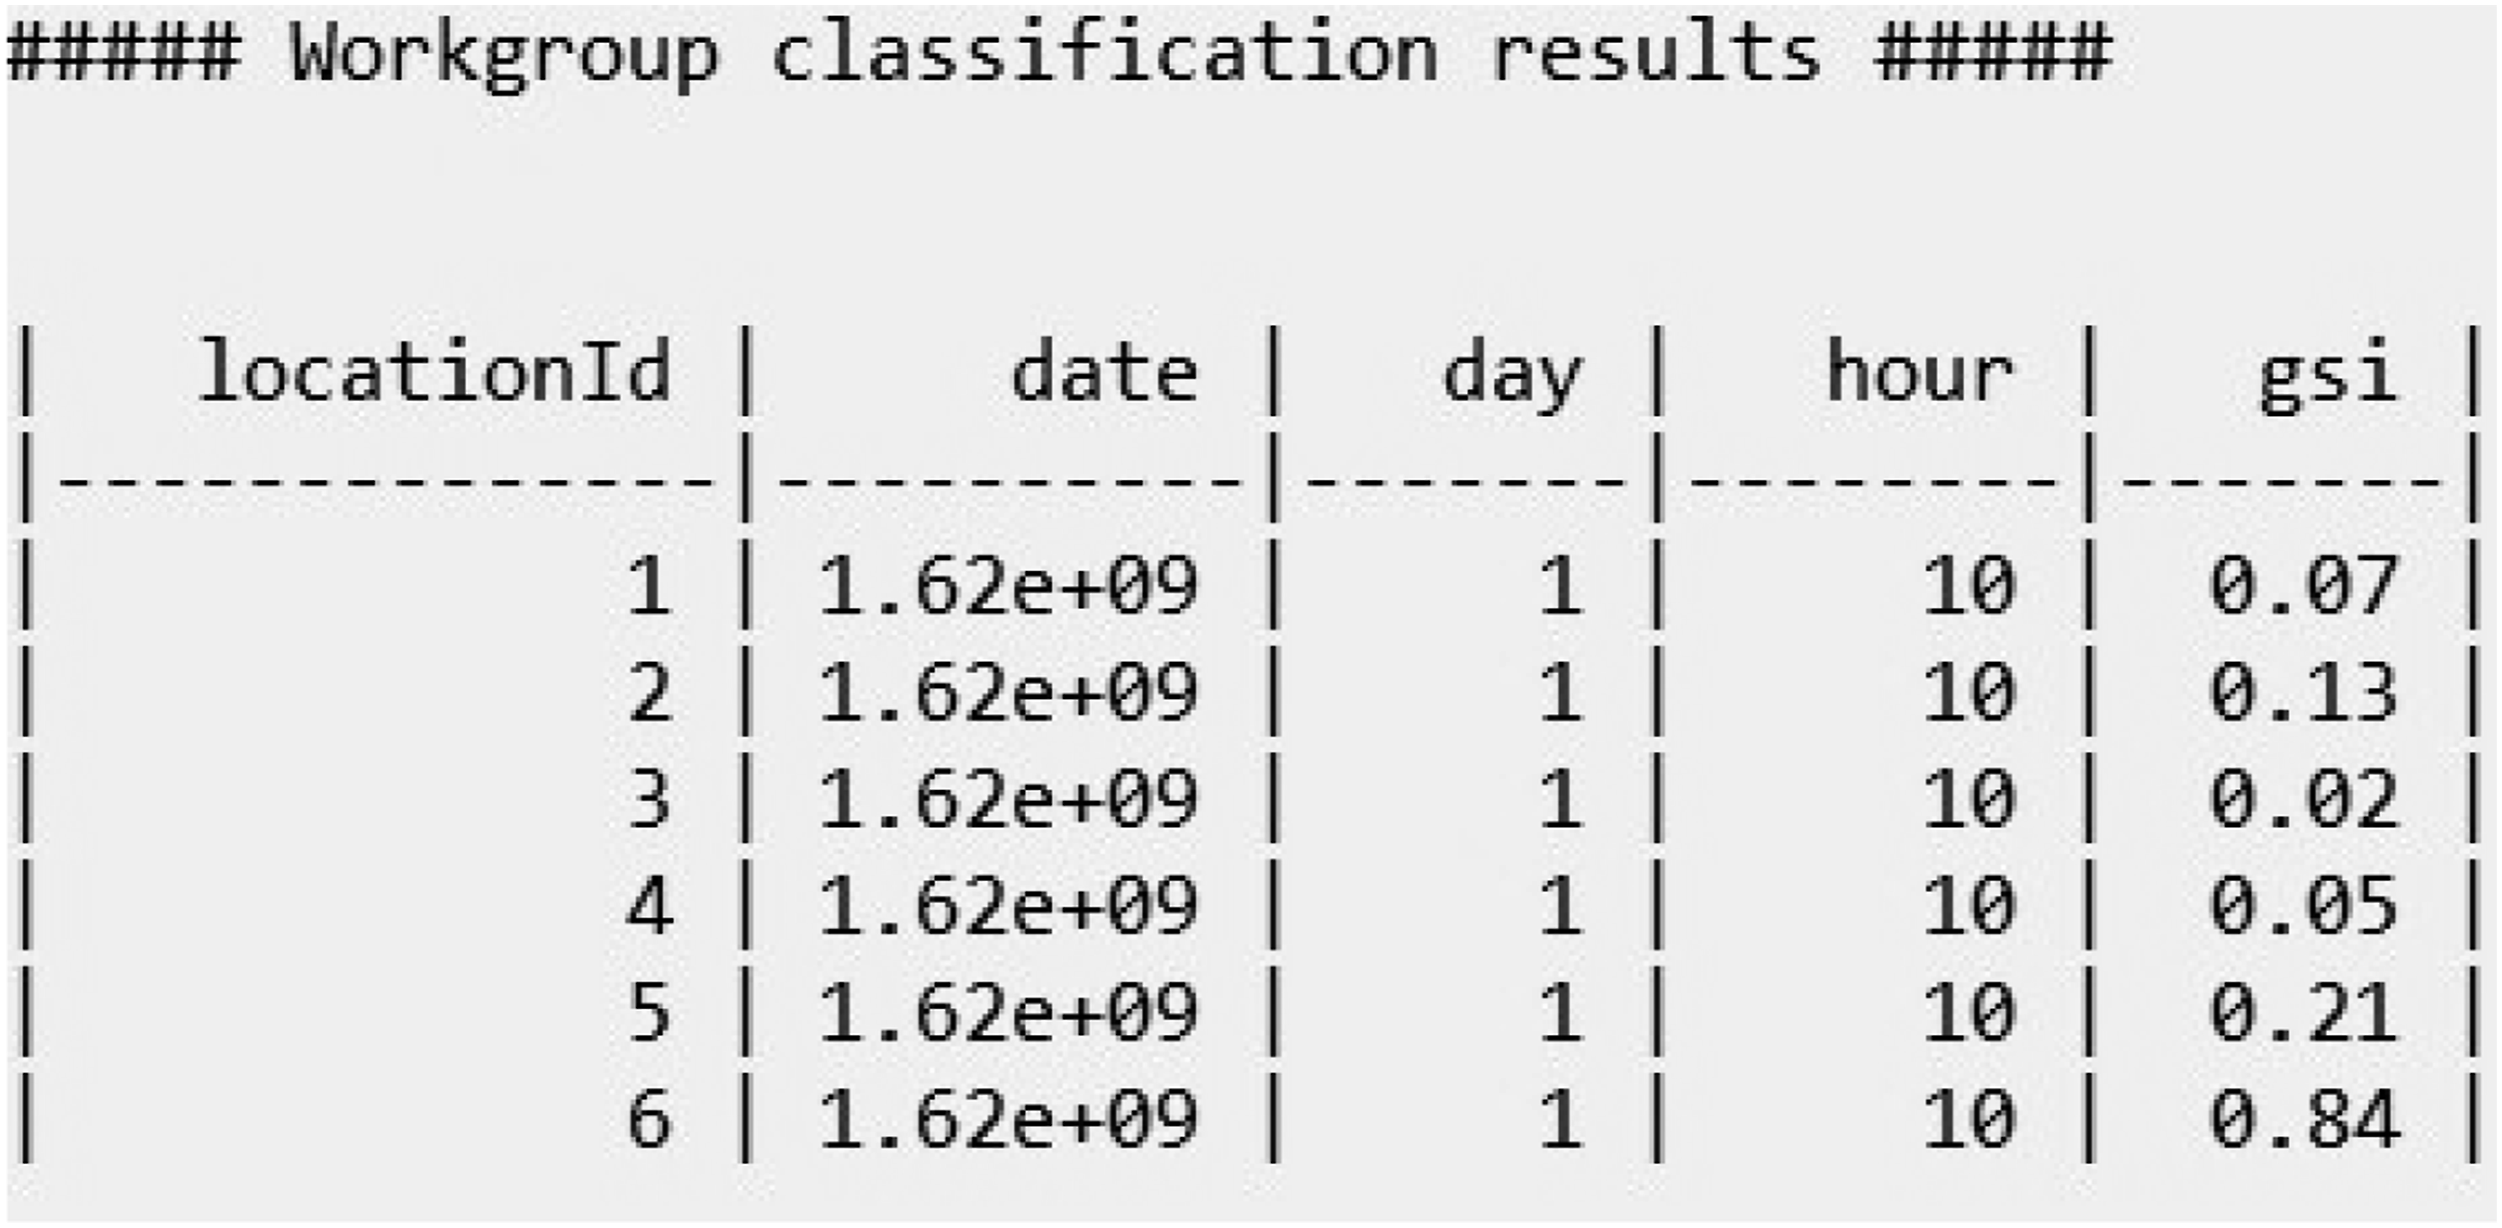
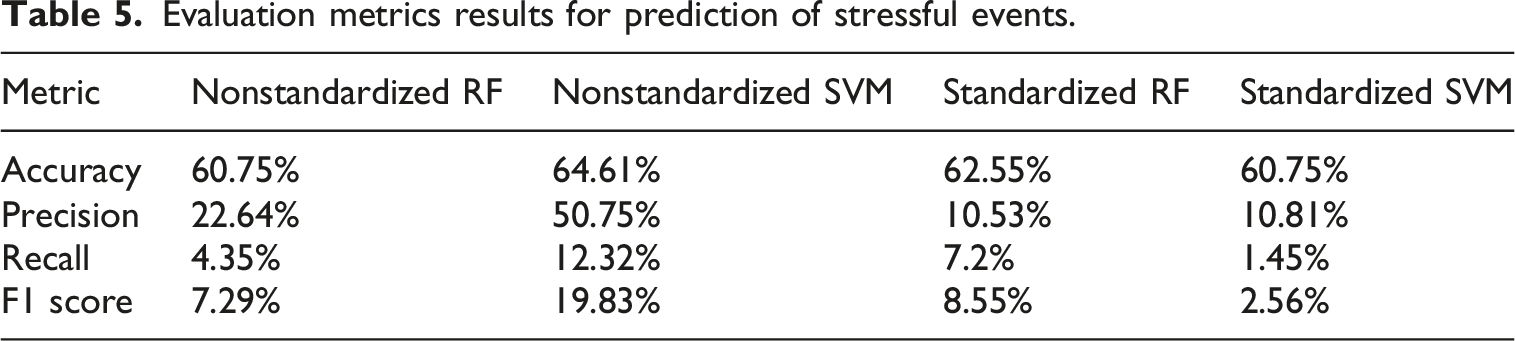
Evaluation metrics results for prediction of stressful events.
Compared with the related works in Table 1, Kaire shares the use of machine learning and non-intrusive data collection but differs by combining context histories, shared time, location, and environmental information for stressor identification and group stress analysis.
Overall, the classifiers were evaluated using accuracy, precision, recall, and F1 score, considering both non-standardized and standardized data. For stressor identification, standardization improved the results, especially for SVM, whose F1 score increased from 19.71% to 99.19%. RF also improved from 64.03% to 90.77% F1 score after standardization. The highest metric values for stressor identification were obtained with standardized SVM, reaching 99.36% accuracy, 99.55% precision, 98.84% recall, and 99.19% F1 score. The GSI evaluation showed 88.39% similarity between the calculated index and the simulator presets. In contrast, stressful event prediction presented lower performance across the evaluated configurations, with low recall and F1 score values, indicating that the proposed data representation was suitable for identifying stressors and measuring group stress in the simulated scenario, but still insufficient for reliable event prediction.
The stressor identification results suggest that ontology-based reasoning with standardized machine learning can support contextual stressor patterns in controlled industrial scenarios. Lower event-prediction performance indicates that forecasting future stressors requires richer temporal features and further validation, especially compared with traditional stress-detection tasks.
Therefore, within the controlled simulated scenario, the model met the evaluation objectives for stressor identification and group stress measurement, but not for reliable event prediction. Applying Kaire to real-world data may introduce additional challenges, including subjective workplace variability and data loss during collection.
Limitations
Recognizing the limitations of a model is crucial for understanding its applicability and potential shortcomings. Applying a model in unspecified situations can lead to incorrect or unexpected outcomes. The first limitation of the Kaire model is the requirement for an environment where workers, surroundings, objects, and events can be accurately mapped. Without this mapping, analyzing stressors within the proposed model is not feasible.
The second limitation pertains to the model’s effectiveness. The results generated by the model are heavily dependent on the accuracy of a coupled stress classifier and the parameterization of environmental variables. If the stress classifier makes incorrect inferences, the Kaire model can produce inconsistent results. Similarly, if environmental variables are not well-defined, the model may fail to identify stressors.
For example, an unregistered computer known to cause stress due to its slowness will not be recognized by the model.
Additionally, using a simulator to generate data presents a limitation, as simulators cannot replicate all subjective aspects of a real work environment. Consequently, data collected from simulations may differ significantly from actual conditions. Finally, the application of machine learning within the model necessitates a training dataset tailored to each specific industrial environment. The quality and relevance of these training data are critical in determining the model’s accuracy and reliability.
Conclusion
This study presented the Kaire model. The model aims to identify and predict stressors in the workplace and measure collective stress. This study described the model’s architecture and the three agents’ operation. The first agent, the Ontology Reasoner, organizes knowledge within a semantic domain and produces context histories for the subsequent agents. The second agent, the Stressor Identifier, classifies potential stressors using machine learning algorithms and calculates the GSI. The third agent, the Advisor, simulates future events and predicts stressors to notify potential mental health risks.
A simulator was developed to generate the data necessary for evaluating the model. A simple routine of a manufacturing industry was designed to provide the model with relevant information inputs, encompassing a two-component fabrication flow, assembly of the final product, and evaluation and supervision routines. The simulation includes predefined parameters to generate stress events according to each worker’s routine.
The Kaire model was evaluated using the data generated by the simulator. For stressor identification, SVM yielded the highest metric values, achieving metrics of 99.36% accuracy, 99.55% precision, 98.84% recall, and 99.19% F1 Score. The evaluation of the GSI involved a similarity analysis between the calculation results and the predefined outputs of the simulator, resulting in 88.39% of similarity. However, event prediction scored lower across the evaluated configurations, indicating that the proposed data model still requires improvement for reliable predictive tasks.
In conclusion, within the simulated scenario, the Kaire model addressed the evaluation objectives by identifying stressors and measuring group stress. Nevertheless, event prediction requires further study to improve predictive performance. Future work should focus on data collection in real environments to more comprehensively assess the model’s effectiveness.
Footnotes
Acknowledgments
The authors would like to thank the University of Vale do Rio dos Sinos (Unisinos), the Applied Computing Graduate Program (PPGCA), the National Development Council Scientific and Technological—Brazil (CNPq), and the Coordination for the Improvement of Higher Education Personnel—Brazil (CAPES)—Finance Code 001.
ORCID iDs

Ethical considerations
This study did not involve human participants, human data, or human biological material. Therefore, ethical approval and informed consent were not required.
Author contributions
Funding
The authors received no financial support for the research, authorship, and/or publication of this article.
Declaration of conflicting interests
The authors declare no conflicts of interest regarding this manuscript.