
Abstract
Delivering quality and excellent service delivery has become a winning strategy for service organisations like public libraries in a world where services account for large percentages of gross domestic product (GDP). Excellence sustains a customer’s confidence in an organization, results in more new customers and ensures profitability and sustainability. The purpose of this study was to measure the extent of the quality of service using the five conventionally recognised dimensions of service quality, determine the order of relative importance of the five dimensions, and propose solutions to the quality gaps identified in the study. Anchored on the Gaps Model of Service Quality (GMSQ), the study employed a stratified random sampling technique, wherein the researchers targeted to collect primary quantitative data from 455 registered users. With the help of staff within the three selected public libraries, the subjects were categorised as either youth or adults. A standardised, six-point Likert scale SERVQUAL instrument, derived from the pioneering works of Parasuraman et al. was administered, and 254 users responded, yielding a 55.8% response rate. The findings revealed that for the five dimensions under investigation, a collective average service quality gap score of −1.2, was realised, indicating that the perceived quality of service delivered by the three libraries fell below customers’ expectations. This suggests the need for the concerned libraries to strategise appropriately for quality control. From the findings, the study offers some recommendations for improvements. This study also contributes to the existing studies assessing service quality and library user input in evaluating information services.
Keywords
Background Information
Services are developed and developing countries’ largest and fastest-growing sector (Yap et al., 2007). In the 1990s, services accounted for developed nations’ gross domestic product (GDP): 69% of the United States of America’s (US or America); 67% of France’s; 62% of the United Kingdom’s; 60% of Germany’s, 56% of Japan’s (Ghobadian, 1994) and 56% of Australia’s overall economy (Yap et al., 2007). Research indicates that delivering superior service quality is critical to any firm’s quest for profitability, growth and market share (Griffin & Hauser, 1993; Shava, 2021); it is a winning strategy, as it ensures high customer satisfaction (Yap et al., 2007); quality sustains customer confidence and sustainability (Parasuraman et al., 1994) (PZB), and enhances customer retention and repurchase behavioural intentions (Venetis & Ghauri, 2004).
Parasuraman et al. (1988) conceptualised service quality as a function of the discrepancy between a customer’s pre-service expectations, and their perceptions of the service after it is received, along a set of physical and non-physical attributes of service rendition. In 1990, they found that these service expectations are informed by personal needs, interpersonal communication and previous experiences with a service provider. Clark and Schmidt (1995) have also argued that the service environment includes all tangible elements associated with the process of discharging service. Bitner et al. (2010) and Lee (2011) also asserted that customers normally respond to an organisation’s physical environmental factors cognitively, emotionally and physiologically. Further, Zeithaml et al. (2013) concurred that through the physical appearance of its structure, a firm’s facility promises its users excellent service and this may influence their evaluations. It can therefore be concluded, as was noted by Ariffin and Aziz (2012), that the atmosphere created by the physical environment provides emotional dimensions to the service experience. In equal measure, service quality is further a function of a customer’s experiences with the non-physical aspects of an organisation. Parasuraman et al. (1988, 1990, 1994) further conceptualised that a service must have a human element. The research team identified these human attributes of service as reliability, responsiveness, empathy and assurance.
Although service quality was initially a field of the retail sector, it applies to libraries in equal measure, because they are service entities. They provide service, insofar as they aid individuals during their research work and education, by providing the resources, and ushering to users, an enabling environment that fosters intellectual, emotional and social development (Bamigboye, 2007). They link society with information, thereby helping to break the cycle of poverty and supporting sustainable economic development (IFLA, 2018). Libraries also facilitate human growth and prosperity (Sharma, 2010); they stimulate academic and research activities (Hossain & Islam, 2012), and are centres of innovation and cultural stewards, enhancing citizens’ lifelong learning (Miao & Bassham, 2007). Studying factors influencing the quality of library services, Hernon et al. (2002) established that waiting time, accurate location of data, presence of materials sought, library buildings and facilities, the firm’s environment, and the courtesy of personnel, were among those that shaped users’ information services experiences. It is therefore important that the quality of the services provided, be studied, and through the customers themselves (Griffin & Hauser, 1993; Lakos, 2007; Singhal & Kumar, 2023). For libraries to provide quality service to customers, however, librarians must first have a comprehensive understanding of customers’ expectations and perceptions of both tangible and intangible aspects of the service environment (Kumar & Mamta, 2023). Kumar and Mamta (2023) have argued that from time to time, librarians must assess the extent to which their customers’ expectations have been met, or how a service encounter has delighted a customer. Meeting these expectations results in the formation of their perceptions of the library’s performance.
In the face of stiff competition, heralded by technology and the Internet, it is the survival imperative that is at the fore for public libraries. To survive, they need repeat, satisfied customers (Paul et al., 2016), those who are willing to pay any price (Becker et al., 2017). However, library users remain loyal only if they are completely satisfied with the quality of the service a library offers (Hernon et al., 1999; Hernon et al., 1999, 1999). Therefore, librarians who value the importance of customer satisfaction, through delivering superior quality information services, put in motion processes that monitor customers’ expectations and perceptions. They also seek to identify causes of service quality shortfalls and taking appropriate action to improve their offerings. After all, Zygiaris et al. (2023) reminded us that service quality and customer satisfaction measure an entity’s actual delivery in conformity with customers’ expectations, an assertion corroborated by Griffin and Hauser (1993), Ahmed and Shoeb (2009), and Laughlin and Wilson (2020). These have argued that library users must be involved in the evaluation process, should libraries want to obtain favourable word-of-mouth communications.
In the context of Botswana, library and information services date from 1967 with the establishment of the Botswana National Library Services (BNLS) by an Act of Parliament. Public libraries, operating under the aegis of the BNLS, provide information and knowledge free of charge across 33 branches countrywide since 1968 (Ditebo & Oladokun, 2023). Since these libraries strive to meet the knowledge and information needs of all categories of people, the drive to achieve sustainable customer satisfaction compels them to be more responsive to their clients’ needs. This involves adopting measures that sponsor users’ revisit and patronage behavioural intentions (Ditebo & Oladokun, 2023). One such measure is providing service at quality levels that meet, or exceed customers’ expectations. Quality sustains a user’s confidence, attracts more new customers and few lost ones (Parasuraman et al., 1994), yields customer loyalty, initiates responsiveness to customer demands, and raises productivity levels (Petridou et al., 2007).
Based on the arguments advanced, one can surmise that for public libraries within the BNLS system to appeal to their clients, they must recognise and meet, or exceed, their customers’ expectations. This will be achieved through concentrating on the quality of both the physical and non-physical aspects of their service rendition. It is therefore imperative that in the realisation of good quality service, the BNLS branch libraries incorporate high standards of customer service, which may enable them to delight their clients through delivering positive library and information experiences as espoused by the literature.
Statement of the Problem
It is a regular practice for service firms in the twenty-first century, to conduct surveys of value-related surveys in their services, and in customer satisfaction, so as to understand customers’ points of view. Libraries have not been spared this. The quality of services delivered is thought to be the single-most important factor in a library’s operations, with users being the focal point (Miao & Bassham, 2007; Shava, 2021). To satisfy these users, it is necessary to establish a dialogue with them, for they are better placed to, through their experiences, assess quality (Pedramnia et al., 2012; Udem et al., 2020). As for librarians, knowledge of customers’ perceptions of the services rendered is important to their delivery strategy (Musaba et al., 2014). Feedback from customers on the level of service is essential for future planning and allocation of staff and, serves as a guideline for integrated library development and enrichment of existing collections (Becker et al., 2017).
Quality also gives a library a sustainable competitive advantage, in today’s unpredictable information environment (Ali et al., 2021). An assessment of the quality of performances is intended to serve as a management tool, purposely applied to determine how effectively and efficiently the library is serving the needs and expectations of the customer base (Das & Handique, 2020) and help a library compete effectively in the information terrain. Yap et al. (2007) and Pedramnia et al. (2012) have opined that positive library service quality experiences are a function of the availability of information sources, services rendered, currency and relevance of sources, their proper arrangements on the shelves, facilities utilisation, the ability and cooperation of the staff and their attitude when delivering service. Research indicates that traditionally, library quality has been measured in terms of sizes of collections, numbers and qualifications of staff employed, money allocated annually or circulation statistics (Hernon, 2002; Hernon et al., 1999; Rehman & El-Hadi, 2012; Rehman et al., 2012; Somaratna & Peiris, 2011). These measures are no longer relevant as they say nothing meaningful about the users’ experiences with the quality of service performed.
The Botswana National Library Service (BNLS) provides information services across thirty-three branch libraries. Despite the abundance of service-quality literature, and the public library system dating more than five decades, however, very little attention has been paid to the quality of the service offered by the BNLS from the point of view of the customers. Existing research in information services in Botswana, only shows that public libraries face general challenges that threaten to erode the retention of the customer base (Mutshewa et al., 2010). These include a lack of provision of community information services, limited opening hours, a lack of implementation of recommendations from research efforts (White, 2009), unattractive infrastructure, crowded reading halls and engagement of untrained, unqualified personnel (Maswabi et al., 2011; Segodi, 2009). Quality assessment in the context of a national information service in Botswana, in terms of both the physical and non-physical or human attributes, through the customer voice, is largely unresearched. There is, consequently, a dearth of scholarship assessing customer perceptions of library service quality within Botswana’s public library system. This research attempts to rectify this situation, by reporting the insights from an extensive investigation on library users’ overall service perceptions in three selected public libraries in Botswana, using a modified SERVQUAL methodology adopted from Parasuraman et al. (1985, 1990).
Objectives of the Study
The study assessed the customer-perceived service quality in selected public libraries in Botswana. Specifically, the study sought to: (a) determine the extent to which the physical aspects of the public library system contributed to the realisation of good quality service; (b) assess the extent to which non-physical attributes found at the various centres attract positive user assessments of service quality; and (c) propose solutions to the Public Library Division of the BNLS on the quality gaps identified.
Review of Related Literature
Customer Perceived Service Quality
The definition of service quality lacks agreement, and is therefore considered an elusive construct (Gupta et al., 2006; Yap et al., 2007) since its initial conceptualisation. It has been defined as: the difference between customer expectations of service and perceived service (Shahin & Samea, 2010), the extent to which a service meets the customer’s needs or expectations (Lewis & Mitchel, 1990). Other researchers agree that the user is the best judge to assess the quality of services (Parasuraman et al., 1990). In terms of how users actually assess the service quality of a library, Berry et al. (1985) concluded that user perceptions of service quality result from comparing expectations prior to receiving the service, and their actual experience of the service. If the user’s expectations are met, service quality is perceived to be satisfactory; if they are not met, it is perceived to be less than satisfactory; if they are exceeded, it is perceived to be more than satisfactory. This has evolved into the Perceptions minus Expectations (SQ = P - E) conceptualisation for service quality, referred to as the ‘Gap Theory’ in the literature. Cronin and Taylor (1992) concluded this formula by saying that the difference between consumers’ expectations about the performance of a general class of service providers and their assessment of the actual performance of a specific firm within that class drives the perception of service quality. Service quality therefore demands that customers are listened to and are allowed to judge the quality of the services they use. Essentially, delivering quality service means conforming to customer expectations consistently. Research has indicated that the traditional modes of assessment are obsolete (Huysmans & Oomes, 2013; Kiran, 2010; Nitecki, 1996; Rehman et al., 2012) because their assessment is hinged on what a library has, rather than on what it does. Libraries must meet users’ expectations on a consistent basis, even against the backdrop of three inherent characteristics unique to services: intangibility (Ladhari, 2009; Schneider & White, 2004; Zeithaml et al., 2013), production-consumption
Dimensions of Service Quality
Extant literature suggests that library users employ a variety of criteria by which they subjectively evaluate their interactions with an organisation’s service system during the moments of truth. Parasuraman et al. (1985; 1988; 1990) have called these factors, the dimensions of service quality, identifying five, namely: tangibles, responsiveness, reliability, assurance and empathy: (a) Tangibles: Appearance of physical facilities, equipment, physical appearance of service personnel, or communication materials; (b) Reliability: Ability to perform the promised service dependably and accurately – right the first time philosophy (c) Responsiveness: Staff’s willingness to help customers and provide prompt service (d) Assurance: Knowledge and courtesy of employees and their ability to convey trust and confidence (e) Empathy: The caring, individualised attention provided to the library’s customers.
Measuring Service Quality: The SERVQUAL Model
To assess quality, Parasuraman, Zeithmal and Berry (1985, 1988) developed SERVQUAL, a psychometric instrument that operationalises, across the five dimensions mentioned earlier, service quality as a function of the difference between Expectations and Perceptions. It comprises 22 statements ascertaining customer’s expectations on each service feature assessed, and a corresponding set of 22 statements measuring their perceptions of the same service features, calculating service quality by the formula: SQ = P – E, where SQ is service quality P is perceptions, and E is expectations. The difference between expectations and perception ratings constitutes a measure of service quality. A final positive average score suggests that a library’s performance exceeded a customer’s expectations, while a negative score represents that a customer’s expectations exceeded the library’s performance (Phiri & Mcwabe, 2013). Despite heavy criticism by researchers and practitioners, SERVQUAL has enjoyed wide application across a variety of industries, including retailing (Al-alak & El-Refae, 2012; Phiri & Mcwabe, 2013), online platforms and mobile networks (Agyapong, 2011; Ali et al., 2021; Shava, 2021), banking (Islam et al., 2014; Meybodi, 2012; Okeke & Okoye, 2021; Rehman, 2012), and healthcare services (Ramez, 2012; Zygiaris et al., 2023). The SERVQUAL methodology has also been the answer to many a library’s service delivery challenges (Ahmad et al., 2022; Chavda, 2020; Das & Handique, 2020; Gyau, Liu & Kwakye, 2021; Hossain & Islam, 2012; Sofiya & Devi, 2018; Somaratna & Peiris, 2011; Zakaria, 2011). A modified version of this protocol was applied by Thapisa and Gamini (1999) at the University of Botswana Library, and by Mabuza, who assessed customers’ perceptions of the quality of service at the Manzini Public Library in Eswatini in 2012.
The SERVQUAL methodology was found attractive to guide this investigation, given its wide application across a consortia of industries as noted already, as well as its diagnostic ability in quantitatively and succinctly measuring a library’s effectiveness in delivering value to its customers. Further, it was found most appealing on the basis of its effectiveness in highlighting those elements that shape customer expectations. It is also a flexible protocol, which can be modified to suit the needs of a specific service industry.
Methodology
Population, Sampling and Response Efficiency
Study Population, Sample Size, and Response Rates

Source: Field data.
Calculation of Cronbach’s Alpha Coefficient by Dimension
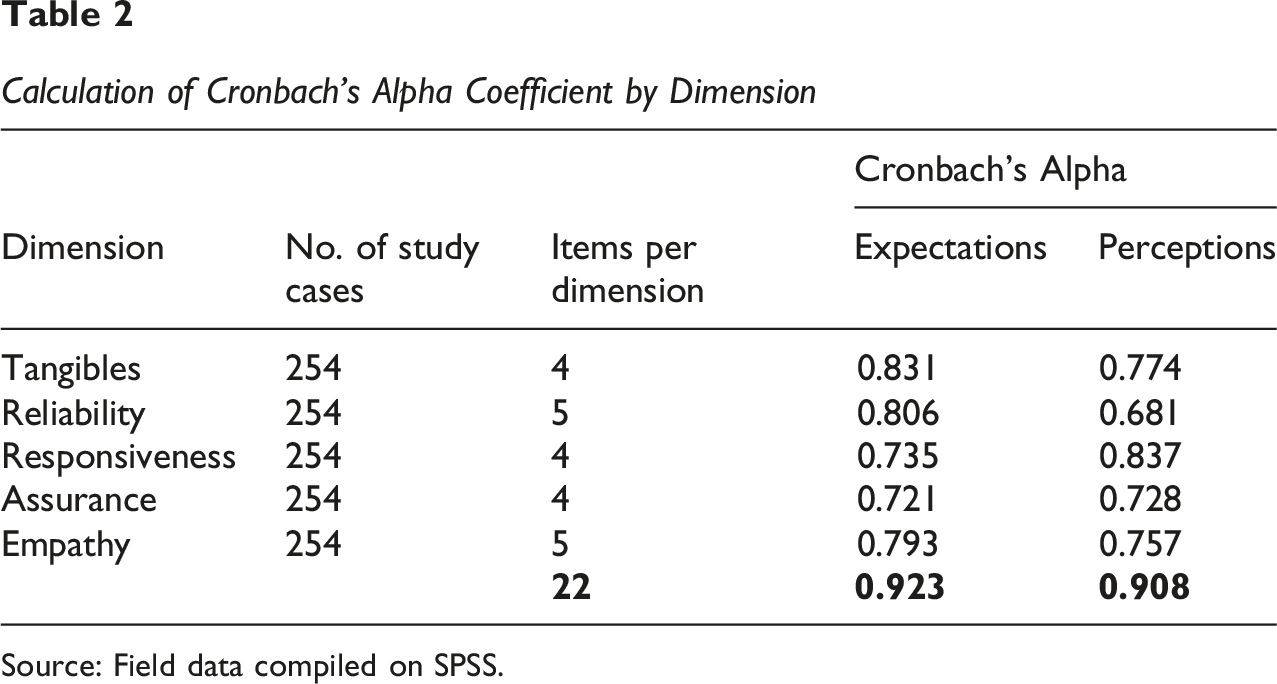
Source: Field data compiled on SPSS.
From a population of 4,550 registered users of the library, a sample of 455 participants was drawn through a stratified random sampling technique, from whom quantitative data were collected. From the 455 copies of questionnaire distributed to elicit users’ expectations and perceptions about services rendered, a total of 254 were returned, representing a 55.8% return rate.
The Survey Instrument: The SERVQUAL Method
This study investigated the overall level of library service quality within three of the Botswana National Library Service (BNLS) branches, using a modified SERVQUAL protocol, whose design was informed by Parasuraman, Zeithmal and Berry’s (1985) pioneering Gaps Theory. Users’ subjective assessments of their expectations and experiences with the physical and non-physical attributes were collected. The SERVQUAL protocol comprised 22 service statements spread across five broad dimensions soliciting users’ service ratings ‘Expectations’ and ‘Perceptions’ on a 6-point Likert scale was modified and administered to 455 registered library users. Internal consistency of the SERVQUAL items was determined by computation of Cronbach’s Alpha Coefficient at 0.924 for Expectations items and 0.908 for Perceptions items, indicating good reliability of the questionnaire items as shown on Table 2. The table indicates that the aggregate Expectations and Perceptions values are greater than the permissible value of 0.70 proposed by Nunnally and Bernstein (1994) for theory testing.
Findings
The Respondents’ Demographics
The targeted subjects for this investigation comprised 455 registered library customers who were targeted for the SERVQUAL questionnaire. As shown in Table 2, a return rate of 254 users, representing 55.8%, was achieved. Of these, 42.5% (n = 108) were female while 57.5% (n = 146) were male. The majority of the user community were aged 15–35 years, representing 84.3% (n = 214) while those who aged above 35 years, categorised as elder, accounted for 15.7% (n = 40).
Respondents Across the Three Participating Libraries
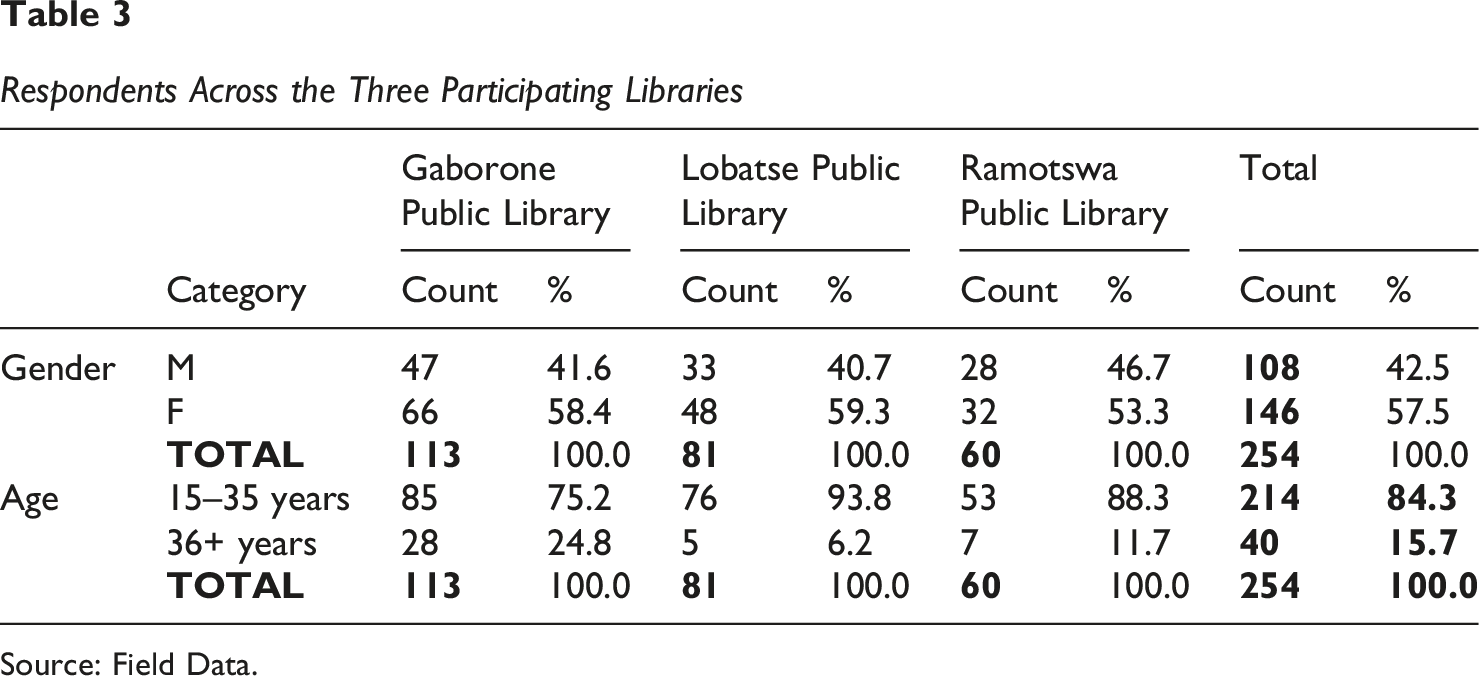
Source: Field Data.
Use of the Public Library (Frequency and Length)
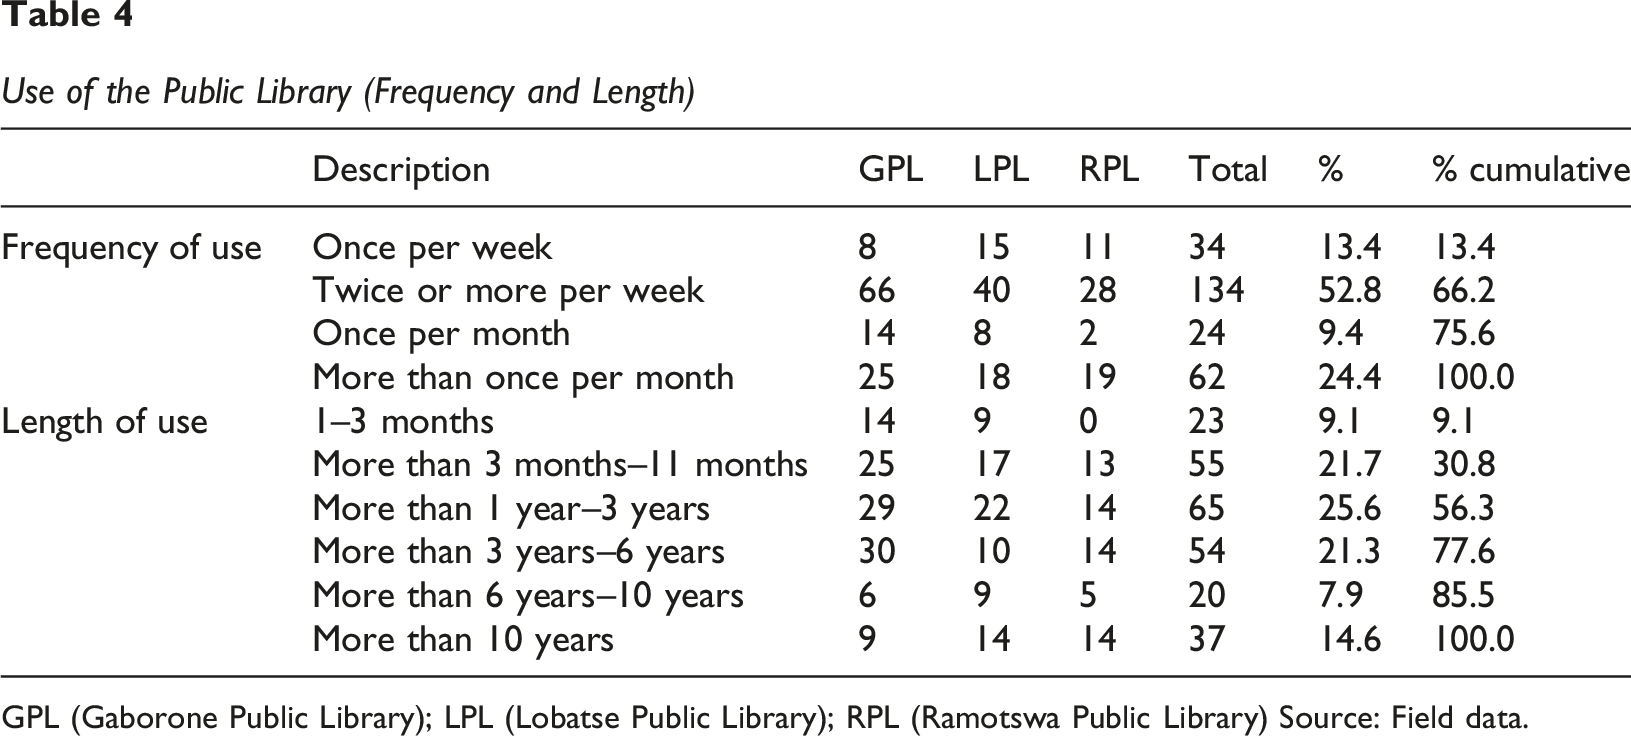
GPL (Gaborone Public Library); LPL (Lobatse Public Library); RPL (Ramotswa Public Library) Source: Field data.
Service Quality Findings
Library Customers’ Overall Service Quality Scores (P-E) for Individual Library
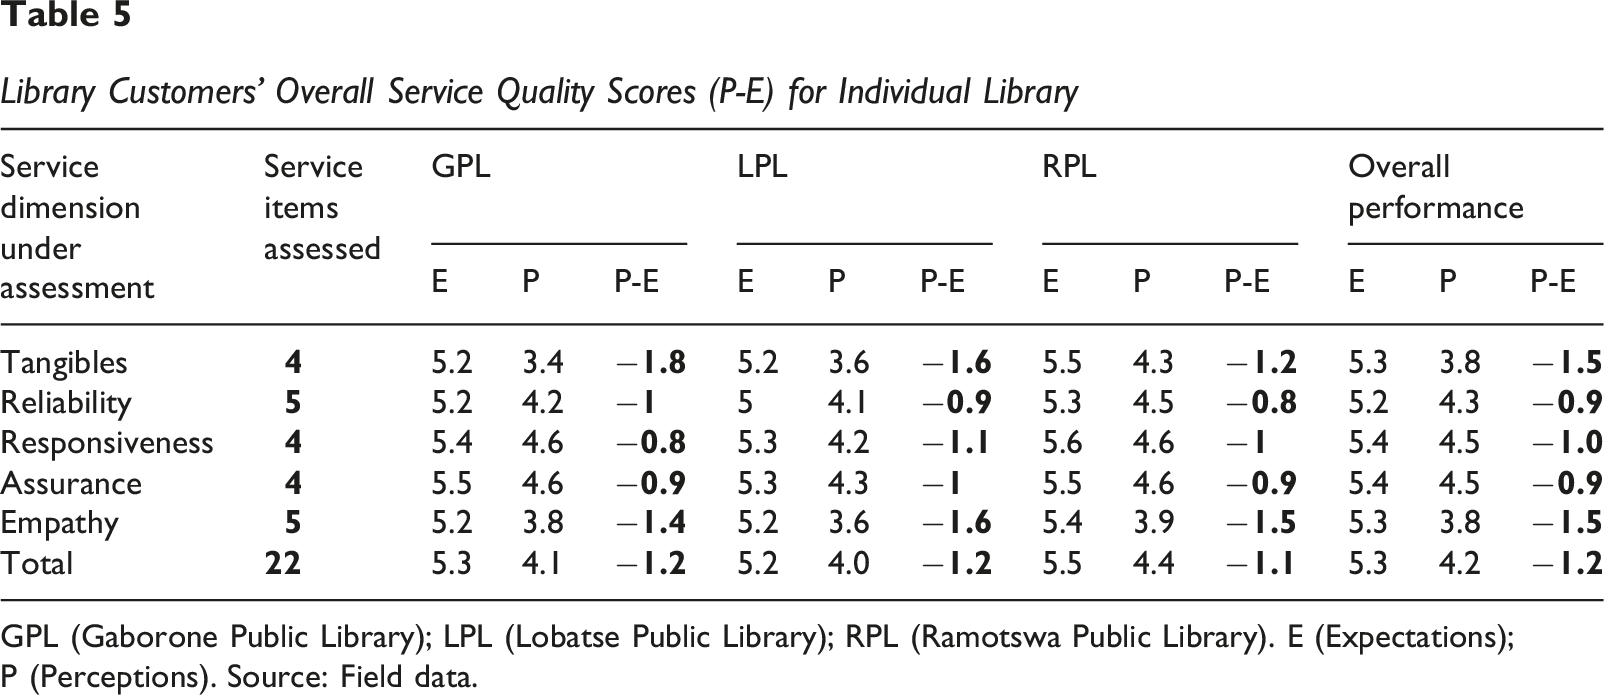
GPL (Gaborone Public Library); LPL (Lobatse Public Library); RPL (Ramotswa Public Library). E (Expectations); P (Perceptions). Source: Field data.
The service quality gap score of
Tangibles
For the tangible features of the service, the findings reveal an overall service quality Gap Score of
Reliability
Concerning the Reliability dimension, the ability to perform as promised, with speed and consistency (Phiri & Mcwabe, 2013; Zeithaml et al., 2013), a set of five (5) questions was designed around the understanding that services that are not dependable or reliable may lead customers to develop switching behaviours. In respect of this dimension, the facilities performed thus: Gaborone Public Library posted −1.0, the Lobatse Public Library posted −0.9, whilst Ramotswa Public Library registered −0.8. Users gave this dimension an overall average quality score of
Responsiveness
With regards to the Responsiveness dimension, a set of four questions were designed around the understanding that to attract a positive word-of-mouth communication, a service needs to be responsive to users’ needs. Responsiveness means the service personnel’s disposition in dispensing service: how prompt, how willing, how never too busy to assist their customer, or how quick they are to inform them if a service is not available. Users rated this responsive service negatively. A SERVQUAL service delivery score of
Assurance
Assurance is one of the most important aspects of library service. This is due to the fact that customers want to deal with people they can trust. Assurance has been defined as concerned with employees’ display of knowledge and courteous behaviour during service encounters, and their ability to convey trust and confidence. An overall gap score for the three libraries generated is
Empathy
Also showing quality shortfall was another dimension, normally considered a pivotal quality attribute in library users’ assessment of the quality of a service – Empathy. This attribute examines the extent of the caring and individualised attention that library employees should give to customers. An overall gap score of The Overall Service Performance of the Three Libraries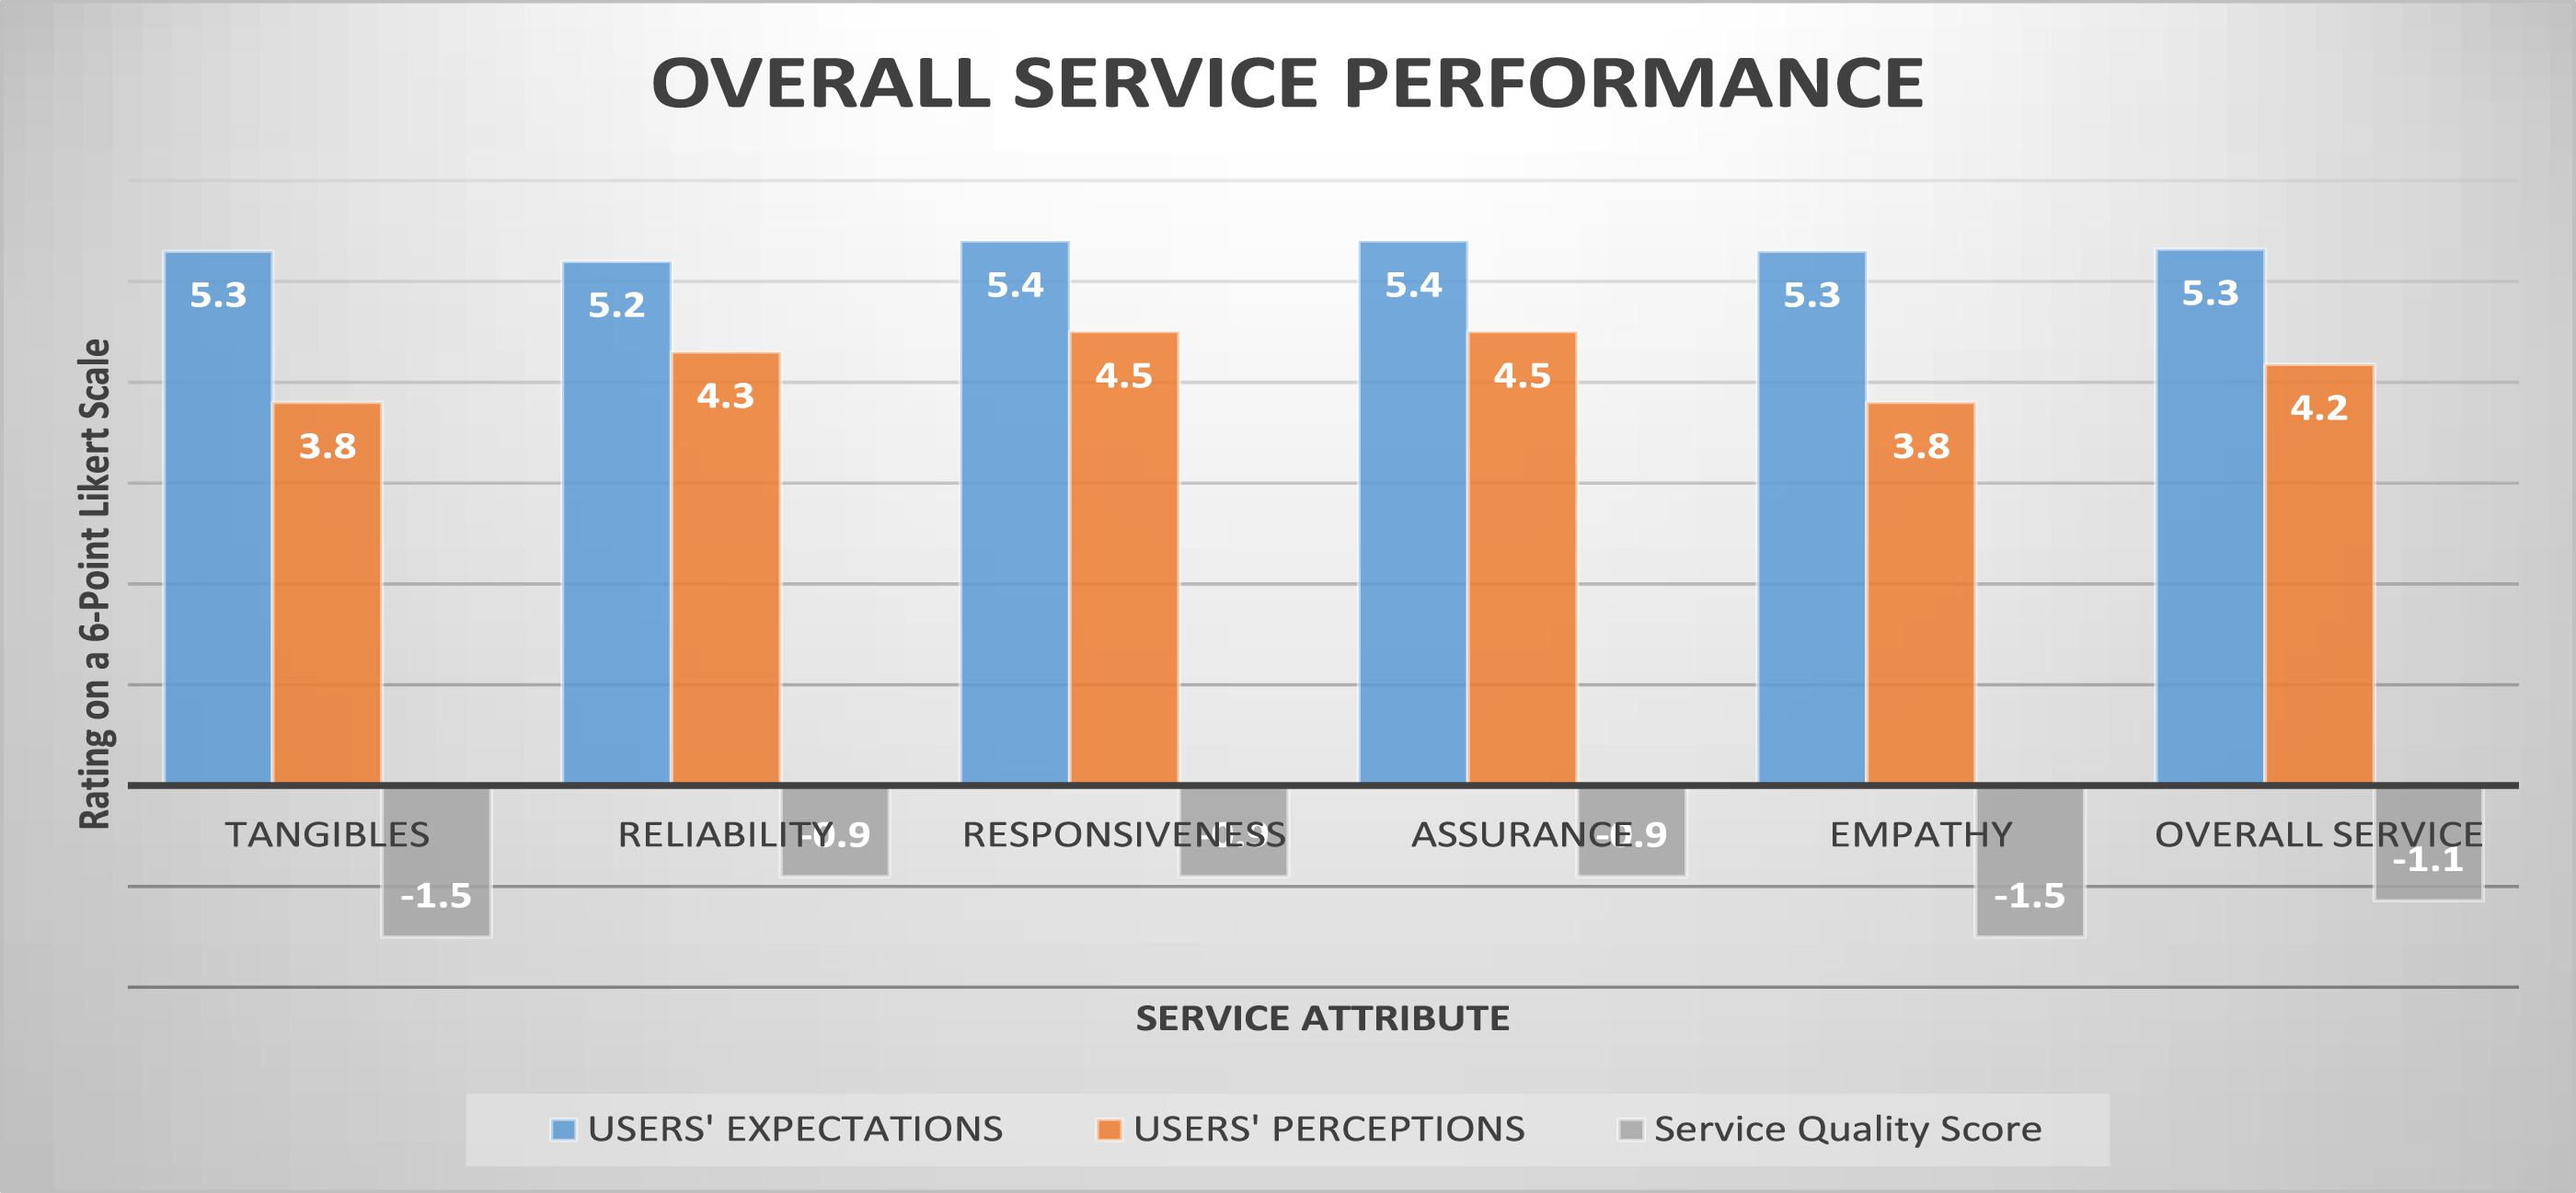
So far, this study has quantitatively measured the Customer Gap and presented a set of universally recognised criteria that underlie customer perceptions of quality. An overall service performance gap score (P minus E) of
Discussion
The main objective of this study was to evaluate the extent to which the three selected branches of the Botswana National Library Service provided quality service to their user community. Service quality was thus operationalised as a customer’s subjective evaluation of a library’s service performance, compared to his expectations of service prior to consumption. A modified SERVQUAL instrument administered to 254 respondents across the three participating libraries: Gaborone, Lobatse and Ramotswa comprised 22 statements soliciting users’ responses regarding their expectations of service and 22 similar statements soliciting their responses with respect to their perceptions of the service rendered.
Data collected revealed that for all the service features assessed for the tangibles dimension, a collective score of
With regards the reliability and dependability of the services offered, an (Expectations minus Experience (Perceptions) overall score of −1.0 was recorded at the Gaborone Public Library where staff did not insist on error-free records. This implies that user expectations exceeded their experiences. At the Lobatse Public Library, the situation was as dire. A quality score of −0.9 was recorded for staff dependability, signalling that user expectations were higher than perceptions for a library whose employees keep their promises. For the Ramotswa Public Library, an average figure of −0.8 indicated that service is not dependable. This is in contrast to Bitner’s et al. (2010) and Cho (2004) assertions when they warned that customers who are satisfied complain less, and are more likely to re-visit the library; those that are dissatisfied tend to be less committed and ultimately develop loyalty ‘myopia’ towards the service and its provider. The overall figures shown for the three libraries are in contrast to Yavas et al.’s (2004) study findings which showed that timeliness aspects of service delivery were closely related to customer satisfaction and their consequent complaint and defection behaviour intentions.
The third dimension of quality under investigation was responsiveness – how helpful to their customers, employees are, as in: giving users prompt service; always willing to help users; never too busy to help users and inform them when a service is unavailable at the time of request may be performed. In essence, the greater the responsiveness of service employees, the greater the users’ perceptions of service quality. As shown, Gaborone Public Library posited an average service quality gap score of
The fourth quality aspect under investigation sought to evaluate the level to which knowledge and courtesy of the employees influence users’ perceptions of service quality – Assurance. Assurance is an assessment of the employees’ ability to show knowledge and courtesy regarding users’ information-related problems as well as their ability to convey trust and confidence. The specific items comprising this dimension essentially centre on employees’ courteous behaviour that may heighten users’ positive evaluation of the service, willingness to recommend the service to friends and willingness to return to use the service again (Zabava, 1995).
The fifth aspect to signal quality in Botswana’s library and information services sought to investigate the extent of the caring and individualised attention given to customers –
The SERVQUAL dimensions scores discussed above generated an overall Service Quality Gap score of
Conclusion
From the findings of this investigation, it can conclude that library users’ expectations of quality service have been higher than their actual experiences in the Botswana public library system. The overall SERVQUAL score indicates that users have higher expectations of service which, if not met, will result in customer dissatisfaction. The tangible aspects of the service were the most affected, with a score of
Recommendations
For the public libraries in Botswana to effectively respond to the satisfaction of the reader community, and thereby contribute meaningfully to a sustainable, knowledge-based economy as envisaged in the country’s Vision 2036 development strategy, it is recommended that: (a) The Public Libraries Division (Division) must employ evidence-based library management approaches, including establishing: responsive and efficient complaints-handling systems; customer expectations-perceptions studies and critical incident techniques. These will provide data to help narrow the service gaps in the physical attributes of service that customers assess when talking about quality. (b) The Division must communicate quality through its physical facilities. The buildings and other physical aspects such as shelves and study chairs must be adequate and attractive aesthetically. The reading halls must be spacious, be appropriately-partitioned and be well-furnished. (c) The system must manage its non-physical aspects prudently, especially the human resources. Employees should always be prepared to deliver service dependably and reliably, as promised; they must be willing to provide service promptly; they must be knowledgeable in their product, and be courteous. Library users want personalised assistance.
Supplemental Material
Supplemental Material - Customer-Perceived Service Quality in Selected Public Libraries in Botswana
Supplemental Material for Customer-Perceived Service Quality in Selected Public Libraries in Botswana by Bogale Keorapetse Ditebo, Olugbade Oladokun in Education for Information
Footnotes
Funding
The authors received no financial support for the research, authorship, and/or publication of this article.
Declaration of Conflicting Interests
The authors declared no potential conflicts of interest with respect to the research, authorship, and/or publication of this article.
Supplemental Material
Supplemental material for this article is available online.
References
Supplementary Material
Please find the following supplemental material available below.
For Open Access articles published under a Creative Commons License, all supplemental material carries the same license as the article it is associated with.
For non-Open Access articles published, all supplemental material carries a non-exclusive license, and permission requests for re-use of supplemental material or any part of supplemental material shall be sent directly to the copyright owner as specified in the copyright notice associated with the article.