
Abstract
Although previous studies have examined the economic costs of care in terms of reduced earnings and increased direct expenses, less is known about how caregiving responsibilities shape household budget allocation. Drawing on the feminist care-economy framework and the household budget literature, this study uses compositional data analysis and multivariate general linear models to examine nationally representative data from the 2021–2022 Family Budget Survey (EPF) in Chile. Results show that the care burden significantly reshapes spending composition: households with care responsibilities allocate more to basic goods and services and less to postponable or discretionary items, including a marked reduction in recreation, with implications for emotional and social well-being. Education expenditure proves particularly sensitive to the care burden, reflecting both the presence of children and the high costs in Chile’s marketised system. These findings highlight the need for policies combining expanded public provision with targeted financial support to reduce care-related economic pressures.
Introduction
Over the past decades, Latin American societies have undergone profound demographic, social, and economic transformations that have reshaped the conditions under which care is organised. The steady increase in female labour-force participation – from 35.3% in 1980 to 54.2% in 2025 (United Nations, 2024) – has reduced the availability of women to undertake tasks traditionally assigned to them. Added to this is an accelerated process of population ageing: between 1950 and 2015, the proportion of people aged over 64 in the region doubled, and projections indicate that by 2050 it will surpass the child population (Amarante et al., 2021). At the same time, declining fertility rates have reduced average household size – particularly among female-headed households – further limiting the number of individuals available to provide care (Becca et al., 2025). Together, these processes have intensified the care burden within households, which now extends beyond childcare to increasingly include the care of older persons and those with dependency needs.
Although care demands are intensifying – driven by population ageing, shrinking household sizes, and rising female labour-force participation – most Latin American countries continue to respond with fragmented and narrowly targeted policies that focus almost exclusively on early childhood. This approach reflects a form of social maternalism aimed at freeing mothers’ time for paid work while leaving the sexual division of labour largely intact (Arteaga & Obiol, 2025; Molyneux, 2007; Ramm & Gideon, 2020; Staab, 2012). Such a sector-based model disperses isolated programmes across different ministries, relies on subsidies or vouchers that transfer costs to families and the market, and generates uneven coverage by age, territory and ability to pay, thereby reinforcing class and gender inequalities (Batthyány et al., 2022). Even when public expenditure increases, provision typically depends on public-private partnerships or under-funded, female-dominated family networks, which raises access costs and penalises caregivers’ incomes and social protection (Batthyány, 2020). In the face of this ‘assisted marketisation’, the region still lacks a comprehensive, universal care system that recognises care as a right, redistributes responsibilities among the state, the market and households, and guarantees decent working conditions for those who provide it (Jimenez Brito, 2024).
In this context, the costs associated with the so-called ‘care crisis’ (Fraser, 2016) fall primarily on families and, within them, disproportionately on women. A substantial portion of these costs is economic in nature and is reflected both in constraints on income generation – by limiting labour-force participation, particularly among women – and in the direct expenses associated with the purchase of care-related goods and services in the market. Feminist economics has made significant contributions by measuring the value of unpaid care work and showing how it negatively affects women’s earnings and job opportunities (Carrasco Bengoa, 2013; Esquivel, 2011; Hirway, 2015). Additionally, research on ageing, health, and childcare has shown the direct costs of care, including expenses related to chronic illness, dependency, long-term support (Esteban et al., 2020), and childcare-related spending on education, food, healthcare, and caregiving services (Gautham & Folbre, 2024; Kornrich & Furstenberg, 2013). However, much less attention has been given to how caregiving responsibilities affect the way households organise their spending – that is, how they adjust their budgets and redistribute expenses in response to care demands. Understanding these dynamics is crucial to grasp how the rising care burden shapes household economies and contributes to the reproduction of class and gender inequalities.
This article seeks to address that gap by analysing how the composition of household expenditure varies according to the intensity of care burden in Chilean households. To do so, it draws on nationally representative data from the Household Budget Survey (Encuesta de Presupuestos Familiares, EPF), conducted by the National Institute of Statistics between 2021 and 2022. Quantitative methods are employed, including compositional data analysis techniques and multivariate general linear models. This approach makes it possible to identify differentiated patterns of expenditure allocation, providing evidence on the specific mechanisms through which care responsibilities reshape household budgets. The findings offer valuable insights for the design of public policies that recognise the economic costs of care and promote a more equitable distribution of care responsibilities.
Literature Review
Care Burden and its Effects on Household Expenditure
Available evidence shows that the burden of care affects both household income and expenditure. In terms of income, in contexts marked by weak public provision of care, when families are unable to afford private services – such as nurseries, residential care, specialised caregivers, or paid domestic work – they are forced to reorganise their time and resources internally. This reorganisation often entails withdrawing from paid employment, reducing working hours, or adopting flexible work arrangements (Chung, 2022; DeRigne & Porterfield, 2017; Esquivel, 2011). Care responsibilities, in particular, constrain women’s participation in the labour market, limit their access to better-paid and higher-quality jobs, and reinforce fragmented and precarious employment trajectories (Casarico et al., 2023; Jiménez Figueroa & Gómez Urrutia, 2015; Riquelme & Abarca, 2015; Rodríguez Enríquez, 2007; Van Houtven et al., 2013). Evidence also indicates that women working part-time while providing extensive family care face a markedly lower probability of increasing their hours to full-time employment during the period of caregiving (Ehrlich et al., 2019). This situation is further exacerbated among low-income households, where women are more likely to leave the labour force. According to Rico and Robles (2016), in 2013, 53% of women in the poorest quintile in Latin America were outside the paid labour force primarily due to domestic responsibilities, compared to 17% in the richest quintile.
Beyond its impact on income, the burden of care also generates a wide range of direct expenses that place constant pressure on household budgets, commonly referred to in the literature as out-of-pocket (OOP) spending – that is, payments made directly by households at the point of service which are not reimbursed or covered by insurance or public provision. These costs vary according to the type of care required. For individuals with chronic illnesses, they often include food, medical care (such as medications, nursing services, wheelchairs and specialised beds), transport, communication and other complementary goods and services (Esteban et al., 2020). For older people requiring continuous care, families may need to pay for caregivers, assisted care services or residential facilities (Friedman et al., 2023; Lai, 2012). Childcare involves regular spending on clothing, education and care services, food, healthcare and transport, among other items (Gautham & Folbre, 2024). Over time, education and care services have become central categories in parental spending, while other goods such as clothing and toys have declined in relative importance (Kornrich & Furstenberg, 2013). Recent evidence also shows that these financial pressures are shaped not only by the type of care, but by geography itself: in vulnerable regions, long travel distances and repeated journeys to access health and care facilities substantially increase out-of-pocket expenditures (Bhattacharjee & Mohanty, 2024).
Aside from the direct costs outlined above, the economic burden of care also reshapes household economies by significantly altering the composition of household expenditure. Tumini and Wilkis (2022) argue that care responsibilities increase overall household spending, placing financial pressure by reducing disposable income for other essential expenses. Xu et al. (2022) show that increasing dependency due to population ageing substantially raises household health expenditure, forcing families to redistribute resources and reduce spending in other areas. This redistribution has also been observed in Korean households, where rising health costs have led to significant cutbacks in areas such as education and basic goods (Kim & Yang, 2011). Similarly, Lai (2012) and Russell (1996) find that households with a high care burden face severe constraints in spending on food and education, with negative impacts on overall well-being.
In addition to the care burden, household expenditure is shaped by other structural determinants, notably income level and household composition.
Income is a key factor that conditions both the amount and diversity of household spending. In lower-income households, spending is concentrated on essential goods, particularly food, limiting the scope for consumption diversification (Engel’s Law). As income increases, the proportion allocated to food decreases, and spending on non-food goods rises, producing more heterogeneous consumption patterns. Chai et al. (2015) identify three consistent trends: low diversity in expenditure at low-income levels; growing diversity as the relative weight of food expenditure declines; and a more balanced distribution of spending across categories in higher-income households.
Household composition also directly influences the structure of spending. Single-parent households tend to prioritise essential needs – such as food – while two-parent households display a greater marginal propensity to spend on discretionary items such as recreation and clothing (Abdel-Ghany & Schwenk, 1993). Moreover, childcare accounts for a higher proportion of the budget in single-parent households (Gautham & Folbre, 2024). This type of household structure is systematically associated with higher levels of poverty (Barahona, 2006; Muñoz, 2004).
In the Latin American context – characterised by weak social protection systems and a high proportion of female-headed households (Palma, 2018; Palma & Scott, 2020) – these dynamics are even more pronounced. Women face the dual pressure of being economic providers while also assuming the practical responsibilities of care in settings where public institutions offer limited support (Pérez-Roa & Cuadra, 2024). In this context, recent studies warn that basic care-related expenses – such as food, medication, and transport – are often financed through debt, giving rise to what has been termed ‘care debts’ (Wilkis, 2021). In Chile, although there is no specific data on care-related debt, the Household Financial Survey (Banco Central de Chile, 2021) reports high levels of indebtedness: 57% of households report having some form of debt, with consumption being the most prevalent category. These pressures are intensified in low-income households, where limited institutional support often forces families to rely on debt or to reallocate spending from other areas of the household budget (Palma & Araos, 2021; Pérez-Roa & Cuadra, 2024). In addition, qualitative evidence indicates that caregivers – mostly women from the most vulnerable 40% of the population – experience significant economic strain linked to spending on healthcare, therapies, medication, and related supplies (Arteaga et al., 2024).
Hypotheses: Based on the above literature, the following hypothesis is proposed: • The composition of total household expenditure differs significantly between households with and without a care burden, with the former allocating a higher proportion of their budget to care-related categories – such as health, education, transport, and personal care – and a lower proportion to postponable items – such as recreation, clothing, restaurants, and durable goods – controlled for other socioeconomic and demographic factors.
The Chilean Case
Chile, like many other Latin American countries, is undergoing a rapid process of demographic transformation that has intensified the demand for care within households. This phenomenon is unfolding in a context marked by limited public provision of care services and persistent gender inequalities in the distribution of care responsibilities. Understanding this scenario is essential for analysing how the care burden affects the composition of household expenditure.
The country is currently in an advanced stage of demographic ageing, characterised by low fertility rates and increasing life expectancy. According to data from the National Institute of Statistics (INE), in 2023 the total fertility rate stood at 1.16 children per woman – well below the replacement level. The same projections indicate that by 2025 the ageing index will reach 78.4 persons aged 65 and over for every 100 individuals under the age of 15 (INE, 2025). This demographic shift is accompanied by an increase in the population living with disability and dependency. The National Survey on Disability and Dependency 2022 (Ministerio de Desarrollo Social y Familia, 2023) reports that 17.6% of the adult population presents some degree of disability, and 9.8% is in a situation of dependency, amounting to approximately 1.5 million people. Of these, 2.7% are classified as severely dependent. Among those requiring care, 32.4% have a primary caregiver within the household – most often women – who report experiencing high levels of strain.
Chile’s care system is characterised by a strongly familist model (Daly & Lewis, 2000), in which care responsibilities are primarily assumed by families and, within them, disproportionately by women. According to the Second National Time Use Survey, on an average day, women dedicate 2 hours and 5 minutes more than men to unpaid work (INE, 2023). This care burden restricts their access to formal, quality employment, and many women opt for informal jobs that allow them to reconcile paid work with caregiving responsibilities (Duval-Hernández, 2022; Flores-Arenas & Inostroza-Correa, 2025). In economic terms, the value of unpaid care and domestic work was equivalent to 25.6% of Chile’s GDP in 2020, underscoring its crucial role in social reproduction (Fernández et al., 2023).
Although Chile has made significant progress in the development of care-related policies over the past two decades, these reforms have been uneven and remain insufficient to respond to the growing demand for care. A key milestone was the launch of the Chile Crece Contigo (Chile Grows with You) programme in 2006, which marked the beginning of a more explicit state concern with early childhood care and the expansion of public childcare provision (Palma & Scott, 2020). More recent measures include the extension of paid parental leave to 6 months (Law No. 20.545, 2011), the legal protection of breastfeeding at work (Law No. 21.155, 2019), the ongoing proposal for universal childcare (under discussion since 2019), and the reduction of the statutory working week to 40 hours (Law No. 21.561, 2023) as a means of facilitating work–family balance. In addition, the Work–Family Balance Law (Law No. 21.645, 2023) seeks to promote women’s participation in the labour market by recognising the rights of workers who undertake caregiving responsibilities. In 2025, the first legislative stage of the National System for Support and Care was approved by the Chamber of Deputies. However, as in much of Latin America, care policies continue to be fragmented and largely assistentialist, with a strong reliance on families as the main providers of care (Batthyány, 2015), which limits the potential for a structural shift towards shared responsibility.
These dynamics unfold in the broader context of persistent structural inequality in Chile, which continues to constrain opportunities for overcoming poverty. Although income poverty has declined, multidimensional poverty still affects 16.9% of the population (Ministerio de Desarrollo Social y Familia, 2022; 2024). It disproportionately affects rural populations and female-headed households, which have increased in number and continue to experience higher levels of vulnerability (Valderrama Díaz & Herrera Durán, 2024). The rising cost of living further exacerbates this situation, reducing households’ capacity to meet the economic demands associated with care.
Against this backdrop – marked by population ageing, the feminisation of care, informal employment, and enduring inequality – it becomes crucial to examine how the care burden reshapes the allocation of resources within households. The following sections offer an empirical analysis of how these structural conditions influence the composition of household expenditure in Chile, with particular attention to inequalities related to gender, income, and household type.
Methods
To analyse the effect of care responsibilities on the composition of household expenditure, we employed a quantitative methodology using data from the IX Encuesta de Presupuestos Familiares (IX Household Budget Survey, EPF) of Chile. Throughout this article, we refer to it as the EPF Survey.
Data
The EPF Survey is a nationally representative, cross-sectional household survey conducted by Chile’s National Institute of Statistics (INE), aimed at collecting information on household income and expenditure (INE, 2023). It is conducted approximately every 5 years and provides unique insights into consumption patterns and living conditions across urban households in regional capitals and their metropolitan areas. The most recent edition was conducted between October 2021 and September 2022.
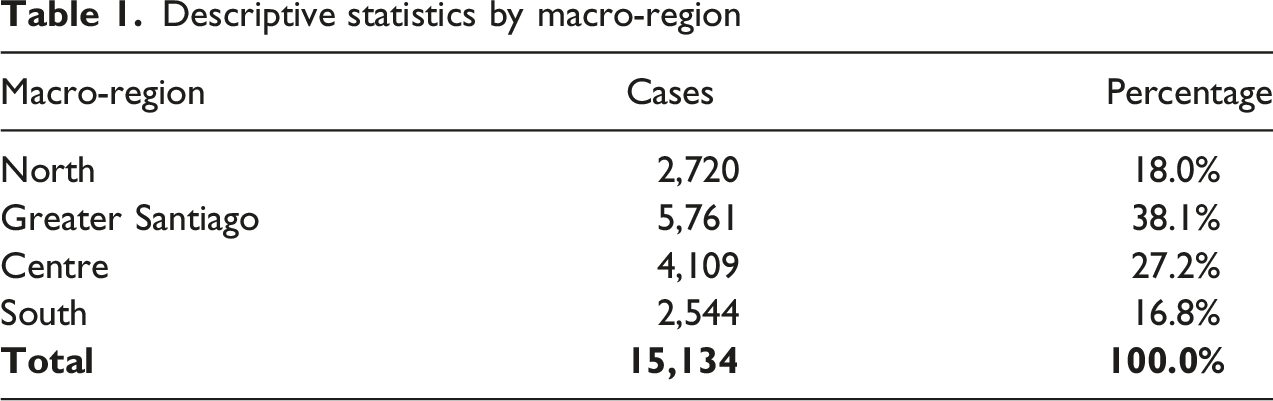
Descriptive statistics by macro-region
Measures
The dependent variable is the composition of household expenditure, measured across 13 categories. Each is represented by a variable indicating the proportion of total household expenditure allocated to that category. The sum of these proportions equals 100%.
The categories are as follows: (1) Food and non-alcoholic beverages (2) Alcoholic beverages, tobacco and controlled substances (3) Clothing and footwear (4) Housing, water, electricity, gas and other fuels (5) Furniture, household equipment and routine household maintenance (6) Health (7) Transport (8) Information and communication (9) Recreation, sport and culture (10) Education services (11) Restaurants and hotel services (12) Insurance and financial services (13) Personal care, social assistance and miscellaneous goods and services
Our main predictor is a categorical variable that captures the potential demand for unpaid care, used as a proxy for household care burden. We use the Índice de Intensidad de la Demanda Potencial de Cuidados (IDPC, or Potential Care Demand Intensity Index), an adapted scale based on a methodology developed by ECLAC using time-use surveys in Latin America (Tumini & Wilkis, 2022). The index estimates the number of hours of unpaid domestic and care work required within a household, based on the age composition of its members. It is calculated by summing the estimated care time assigned to each age group.
Households are categorised into four care demand intensity levels: • No demand (0 hours/day) • Low intensity (up to 2 hours/day) • Medium intensity (2–4 hours/day) • High intensity (more than 4 hours/day)
Estimated unpaid care time by age group
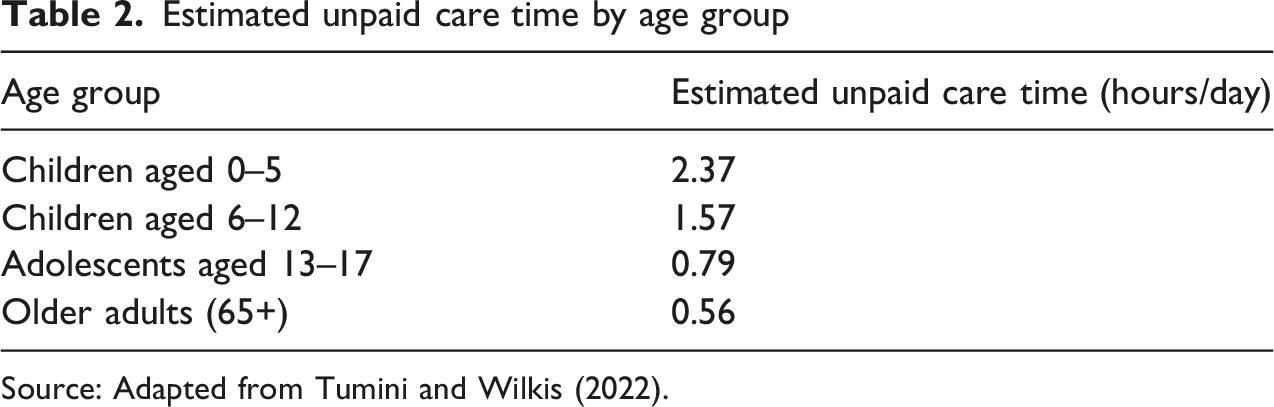
Source: Adapted from Tumini and Wilkis (2022).
The IDPC is computed by summing the estimated care hours for all household members across age groups. This allows assessment of the total care burden and its relationship with the composition of household expenditure.
The main limitation of the EPF in this context is the absence of information on disability or dependency status, which restricts more precise identification of care needs.
Control variables in the models include socioeconomic status, household size and geographic area, along with the sex, age, nationality and ethnicity of the household’s primary earner.
Data Analysis
Given that the dependent variable – the composition of household expenditure – is defined as a vector of proportions summing to one, compositional data analysis (CoDA) techniques were applied to avoid biases inherent to proportional data (Aitchison, 1994; Greenacre, 2021). We used the centred log-ratio (CLR) transformation to convert each proportion into coordinates summing to zero, thereby removing mutual dependence between components and enabling the use of linear models without distortion.
A Multivariate General Linear Model (GLM) was then estimated using the CLR-transformed data, with the IDPC as the main explanatory factor, and demographic and socioeconomic covariates included. This approach ensures statistical robustness and provides a precise understanding of how the composition of household expenditure varies with household care burden.
The General Linear Model (GLM) is a flexible framework that integrates regression and ANOVA methods to model one or more continuous dependent variables using categorical (factors) and continuous (covariates) predictors (Field, 2024). It assumes that the expected value of each outcome is a linear function of the predictors and their interactions, with a normally distributed error term. The multivariate extension of the GLM permits the simultaneous modelling of multiple dependent variables, enabling the estimation of both global and univariate effects (Haase, 2011).
Results
Descriptive Findings
The descriptive analysis of the average composition of household expenditure in Chile reveals a clear prioritisation of basic needs. The largest share of spending corresponds to food and non-alcoholic beverages, accounting for 25.5% of total household expenditure, followed by housing and basic utilities at 19.4%. Transport (11.7%), information and communication (7.9%), and health (7.2%) also represent significant portions of household budgets, highlighting their centrality in everyday life. In contrast, spending on alcoholic beverages, tobacco and controlled substances is the lowest (1.5%), followed by education (2.6%) and recreation, sports and culture (3.8%). Other categories such as restaurants and hotel services (5.1%), furniture and home maintenance (5.4%), and financial services and personal care (each at 3.5%) fall within intermediate levels. Overall, nearly 45% of household expenditure is allocated to food and housing, reflecting a strong focus on essential consumption and basic well-being, with relatively lower spending on recreational or discretionary items (Figure 1). Structure of average monthly household expenditure in Chile (EPF Survey)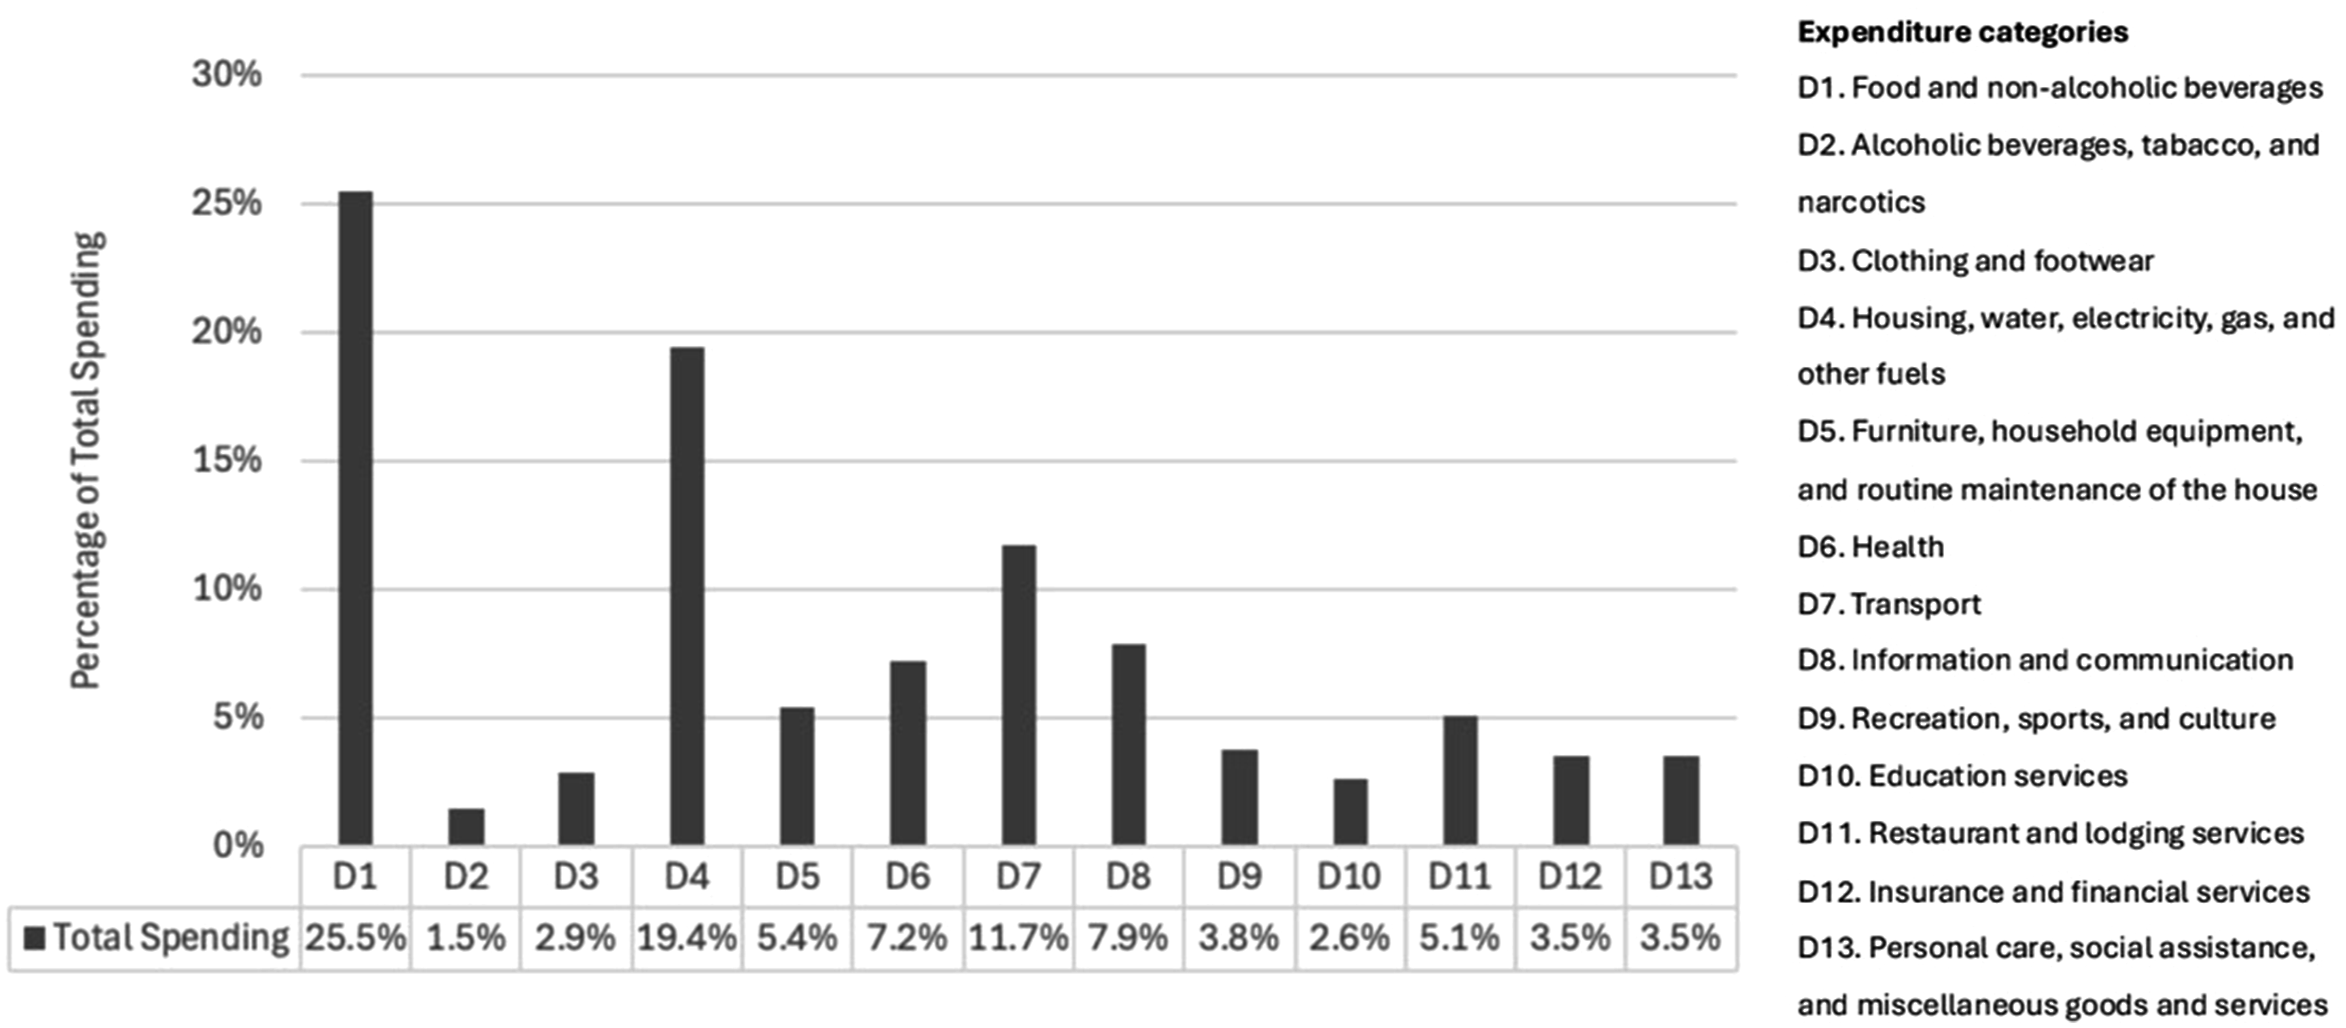
Analysis of household expenditure by care burden, as measured by the Potential Care Demand Intensity Index (IDPC), reveals some differences between households with no care demand and those with low, medium, or high levels. A one-way ANOVA confirms that these differences are statistically significant (p < 0.001). Compared to households without potential care demand, those with medium or high levels allocate a greater share of their budgets to food and non-alcoholic beverages, reflecting a focus on essential goods and basic needs. In contrast, households without care demand spend more on housing, water, electricity, gas and other fuels; recreation, sport and culture; restaurants and hotel accommodation services; and insurance and financial services, suggesting a greater capacity for discretionary consumption and financial planning. Overall, the findings offer some evidence that households with care responsibilities reorient their spending towards priority needs, whereas those without such responsibilities exhibit more diversified expenditure patterns (Figure 2). Structure of average monthly household expenditure by IDPC level (EPF Survey)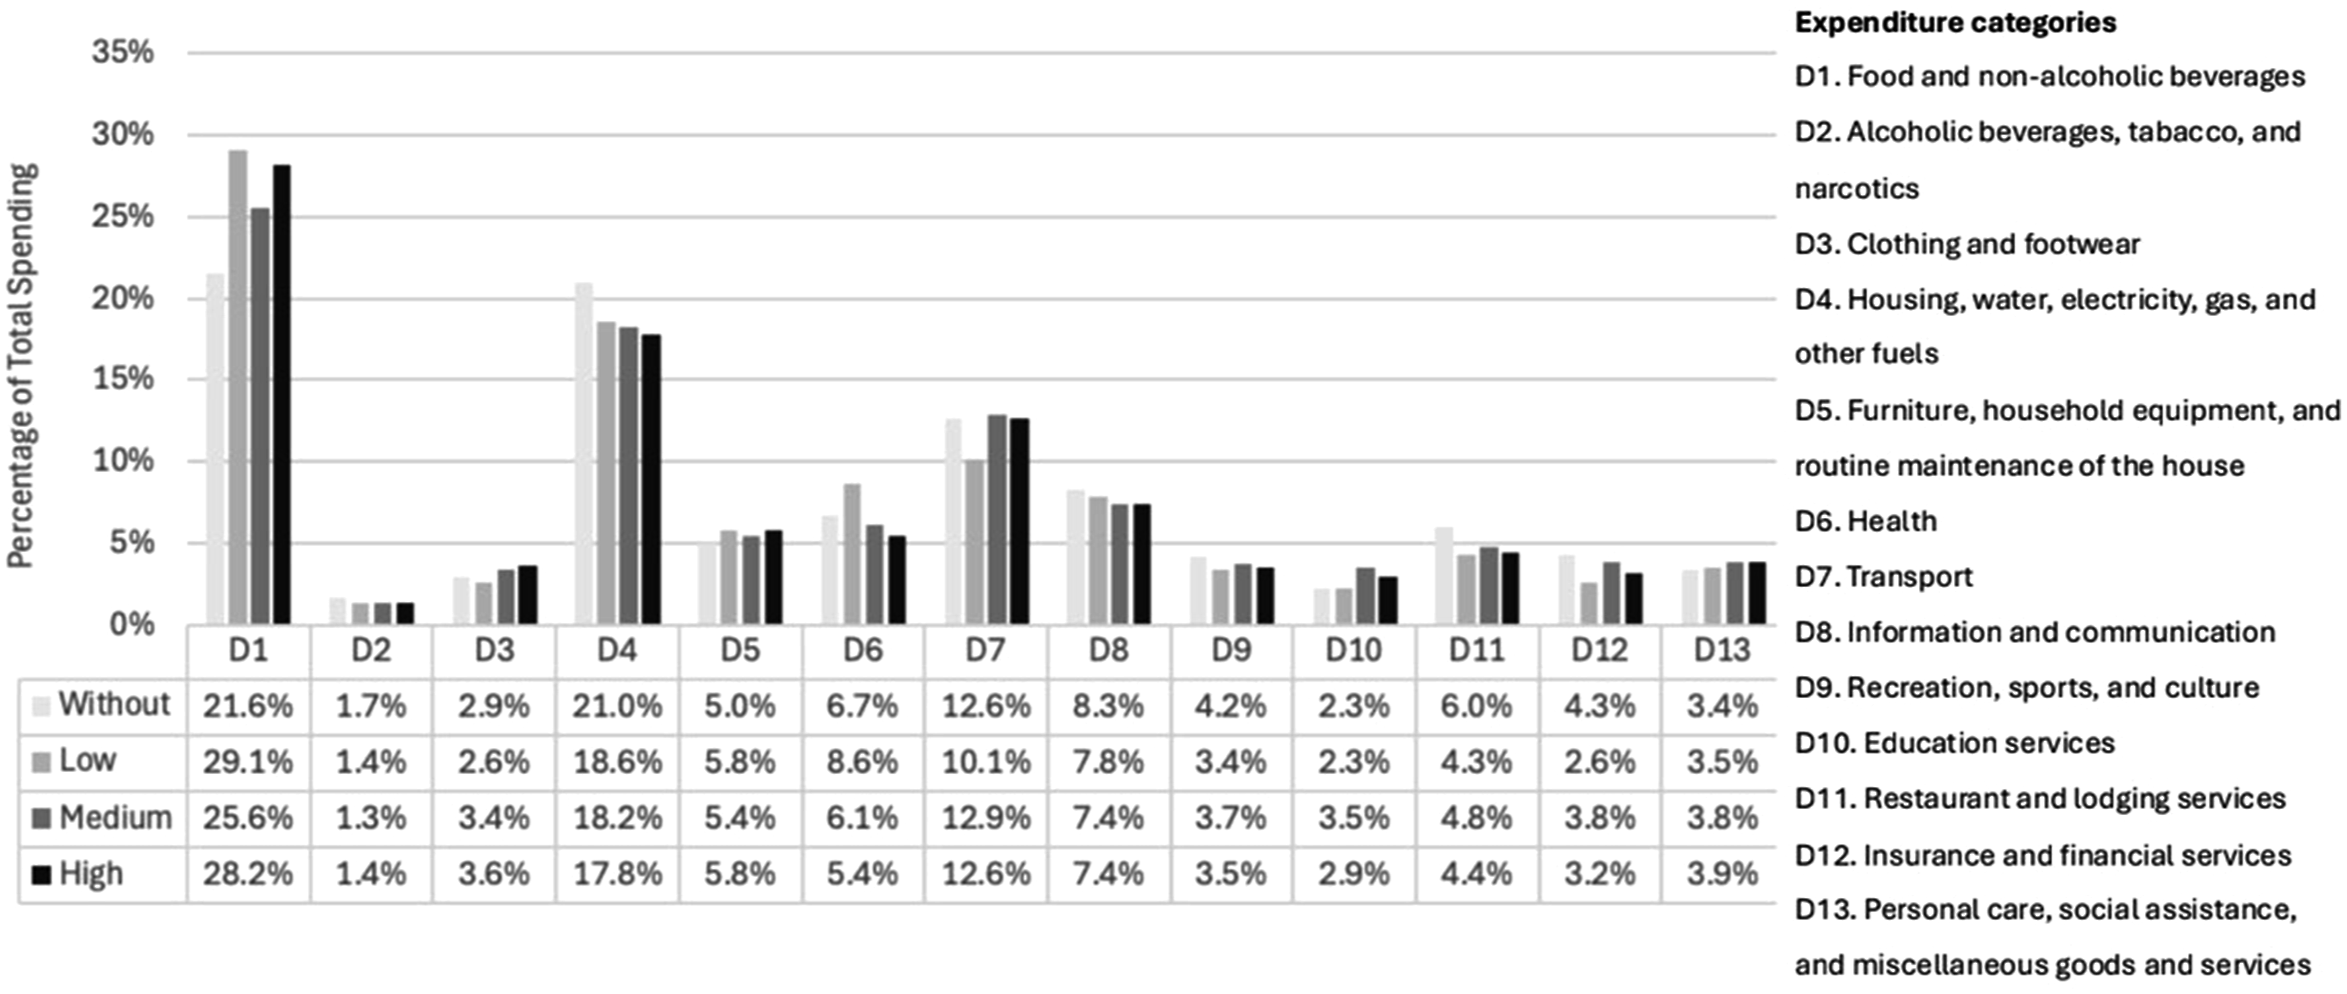
A Multivariate General Linear Analysis of the Effects of Household Care Burden on the Composition of Household Expenditure
Results of multivariate tests (GLM) on the composition of household expenditure by household characteristics
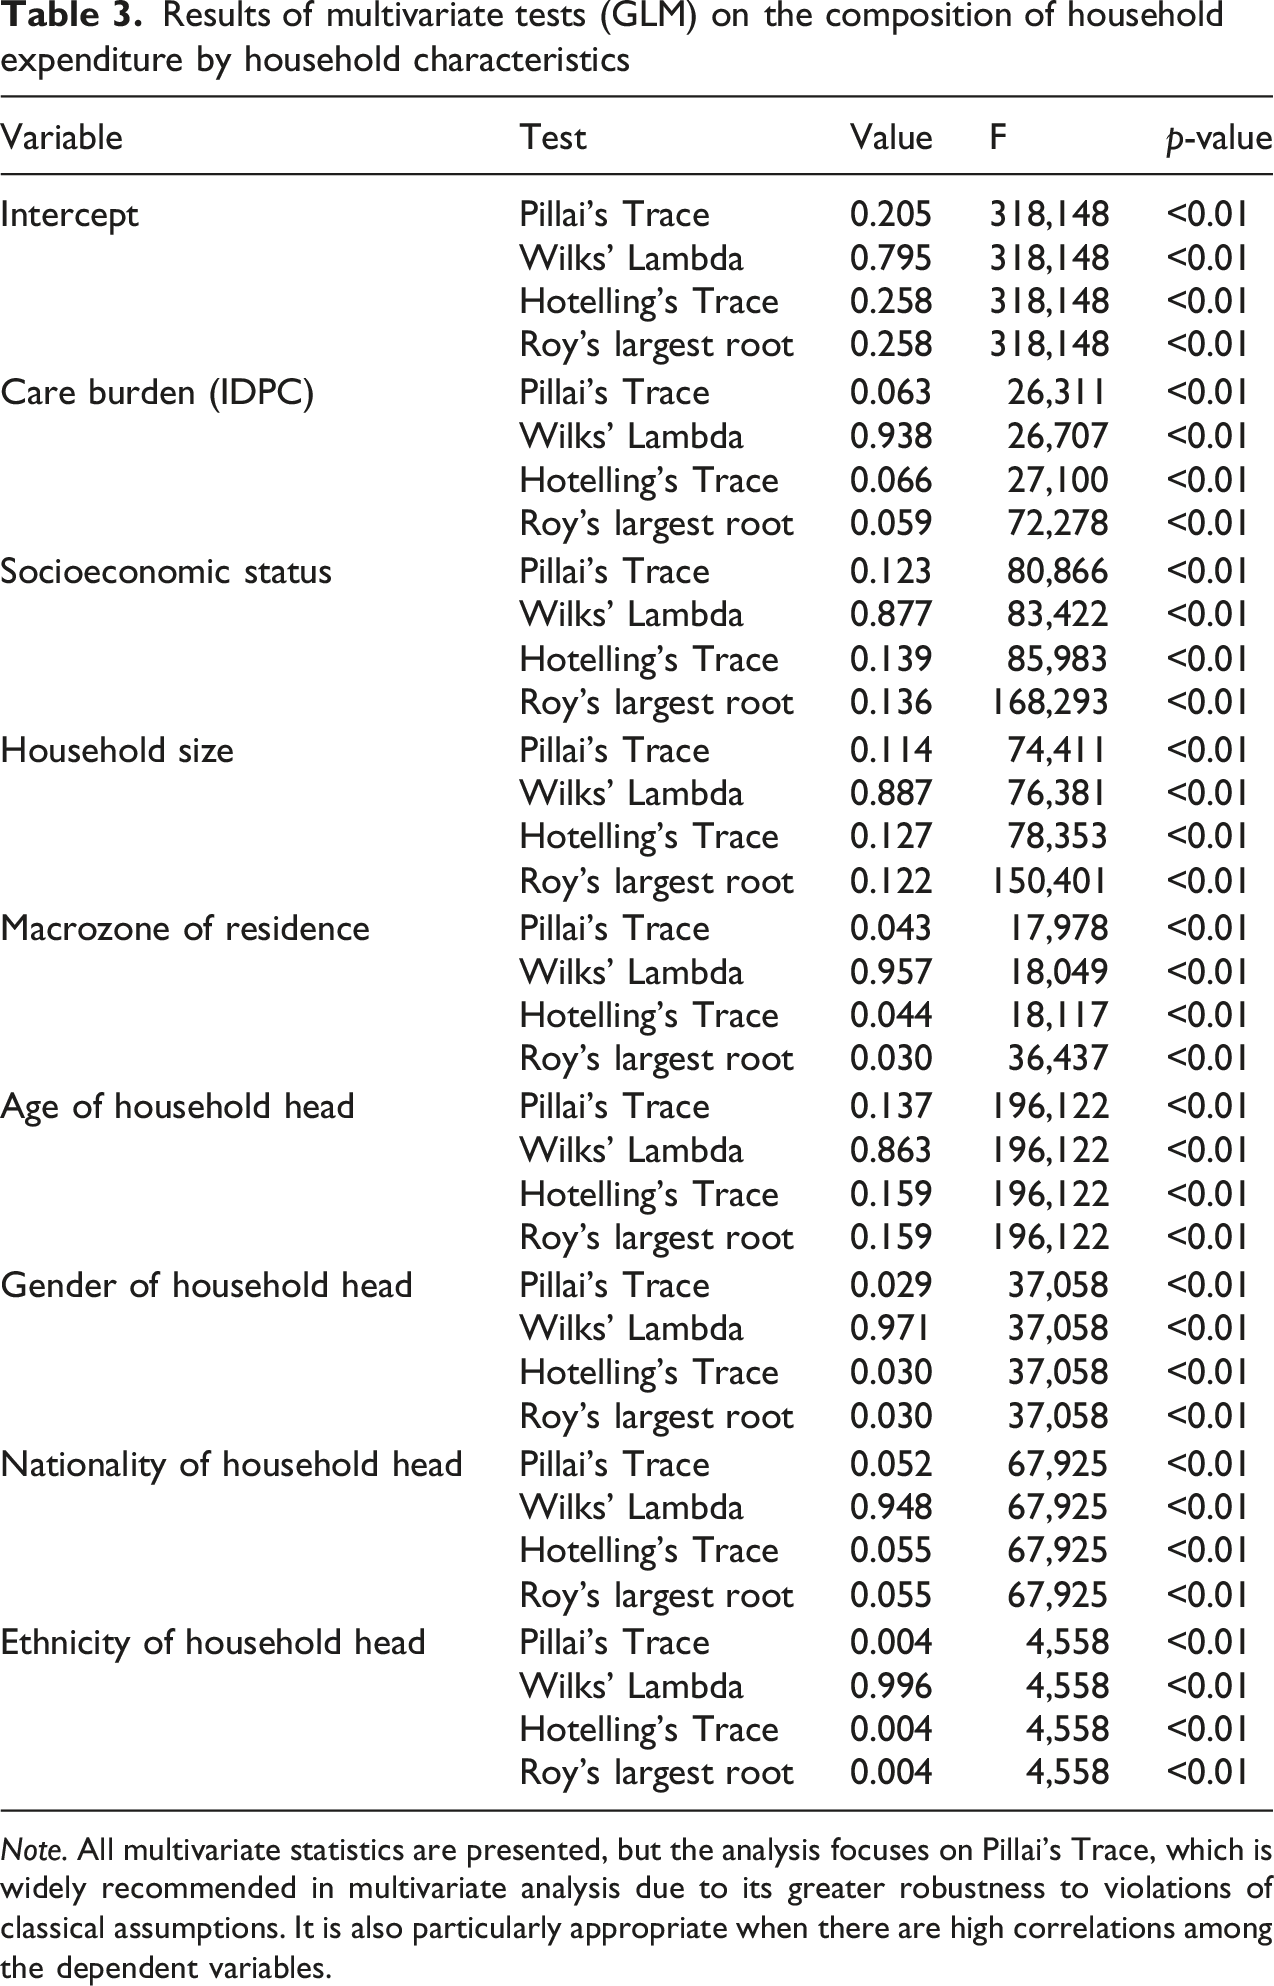
Note. All multivariate statistics are presented, but the analysis focuses on Pillai’s Trace, which is widely recommended in multivariate analysis due to its greater robustness to violations of classical assumptions. It is also particularly appropriate when there are high correlations among the dependent variables.
In addition, other sociodemographic and economic characteristics of the household also show statistically significant overall effects on expenditure composition. In particular, socioeconomic status (Pillai’s Trace = 0.123; F = 80.866; p < 0.001), household size (Pillai’s Trace = 0.114; F = 74.411; p < 0.001), and the age of the household head (Pillai’s Trace = 0.137; F = 196.122; p < 0.001) explain a substantial proportion of the joint variation in spending patterns. Although the effects are of smaller magnitude, statistically significant associations are also observed for macro-regional location, as well as the gender and nationality of the household head.
Univariate results for household expenditure categories by level of care burden
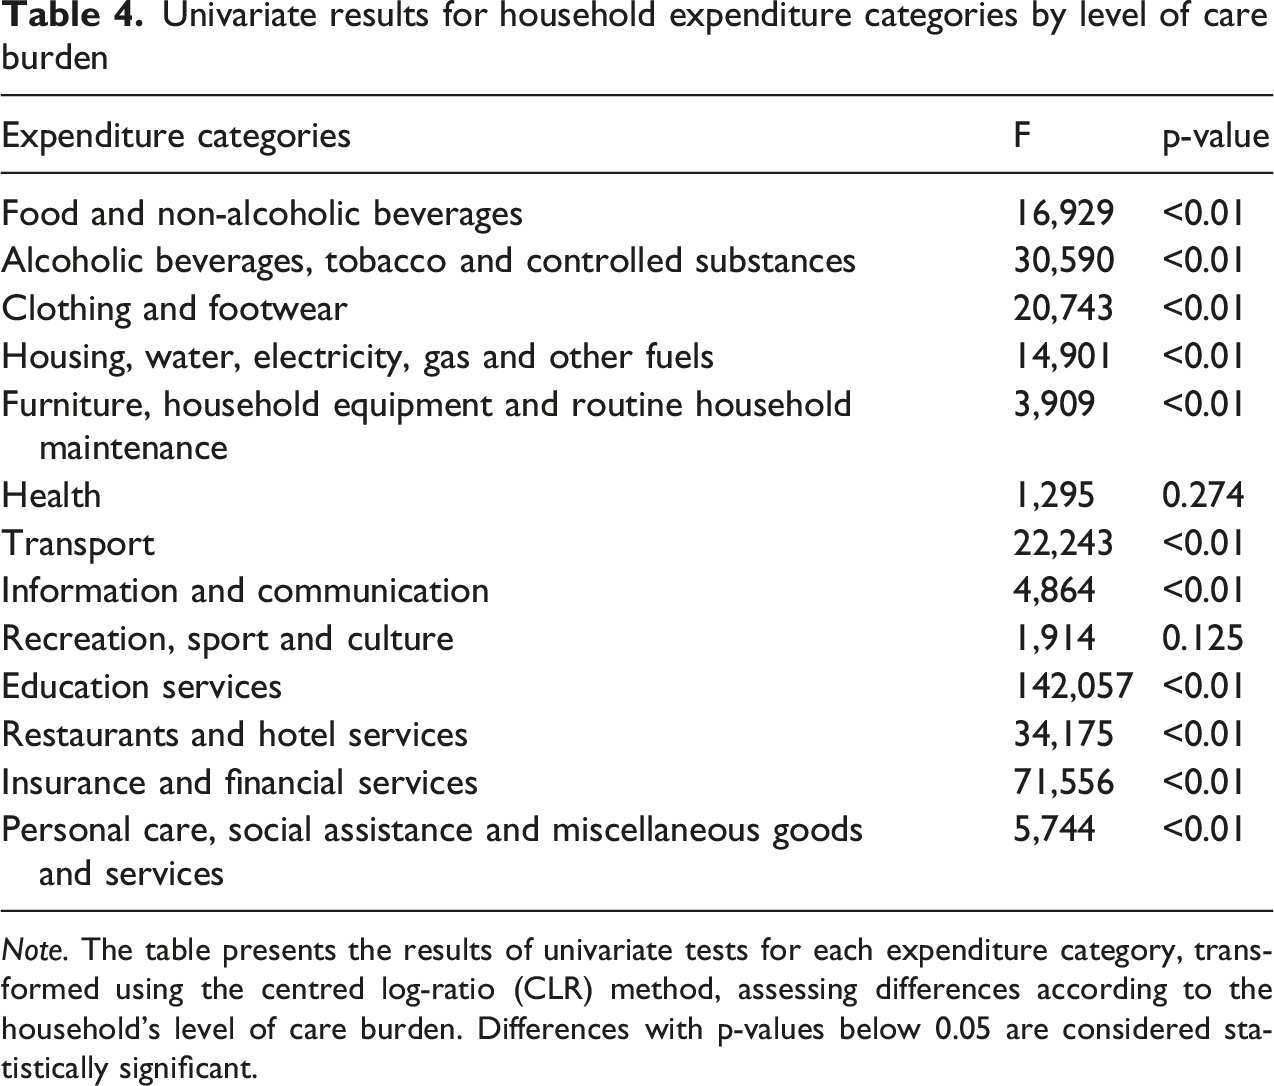
Note. The table presents the results of univariate tests for each expenditure category, transformed using the centred log-ratio (CLR) method, assessing differences according to the household’s level of care burden. Differences with p-values below 0.05 are considered statistically significant.
The most sensitive expenditure categories include education services (F = 142.057), insurance and financial services (F = 71.556), and restaurant and hotel services (F = 34.175). Significant differences are also observed in items such as food, alcoholic beverages and tobacco, housing and basic services, clothing, household furniture and maintenance, transport, information and communication, and personal care and social assistance. In contrast, health; and recreation, sports and culture do not exhibit significant differences (p > 0.05), suggesting that these types of expenditures tend to remain stable regardless of the household’s care burden.
These results provide partial support for our hypothesis. There is clear evidence that care burden is associated with significant differences in the composition of expenditure in most categories; however, two key categories for this hypothesis (health and recreation) show no differences. This implies that the hypothesis is confirmed in general terms (there is a differentiated pattern of spending), but with important exceptions.
Figure 3 presents the estimated coefficients from the multivariate GLM for each of the 13 expenditure categories, expressed in CLR coordinates (see Table 5 in annexes for full report). The model compares different levels of the Potential Care Demand Index (IDPC) to the reference category: households without a care burden. As in Table 4, only the results for our main predictor of interest – household care burden – are reported, while interpretation focuses on coefficients that are statistically significant (p < 0.05). Estimated coefficients from the GLM for expenditure categories by level of care burden, controlling for covariates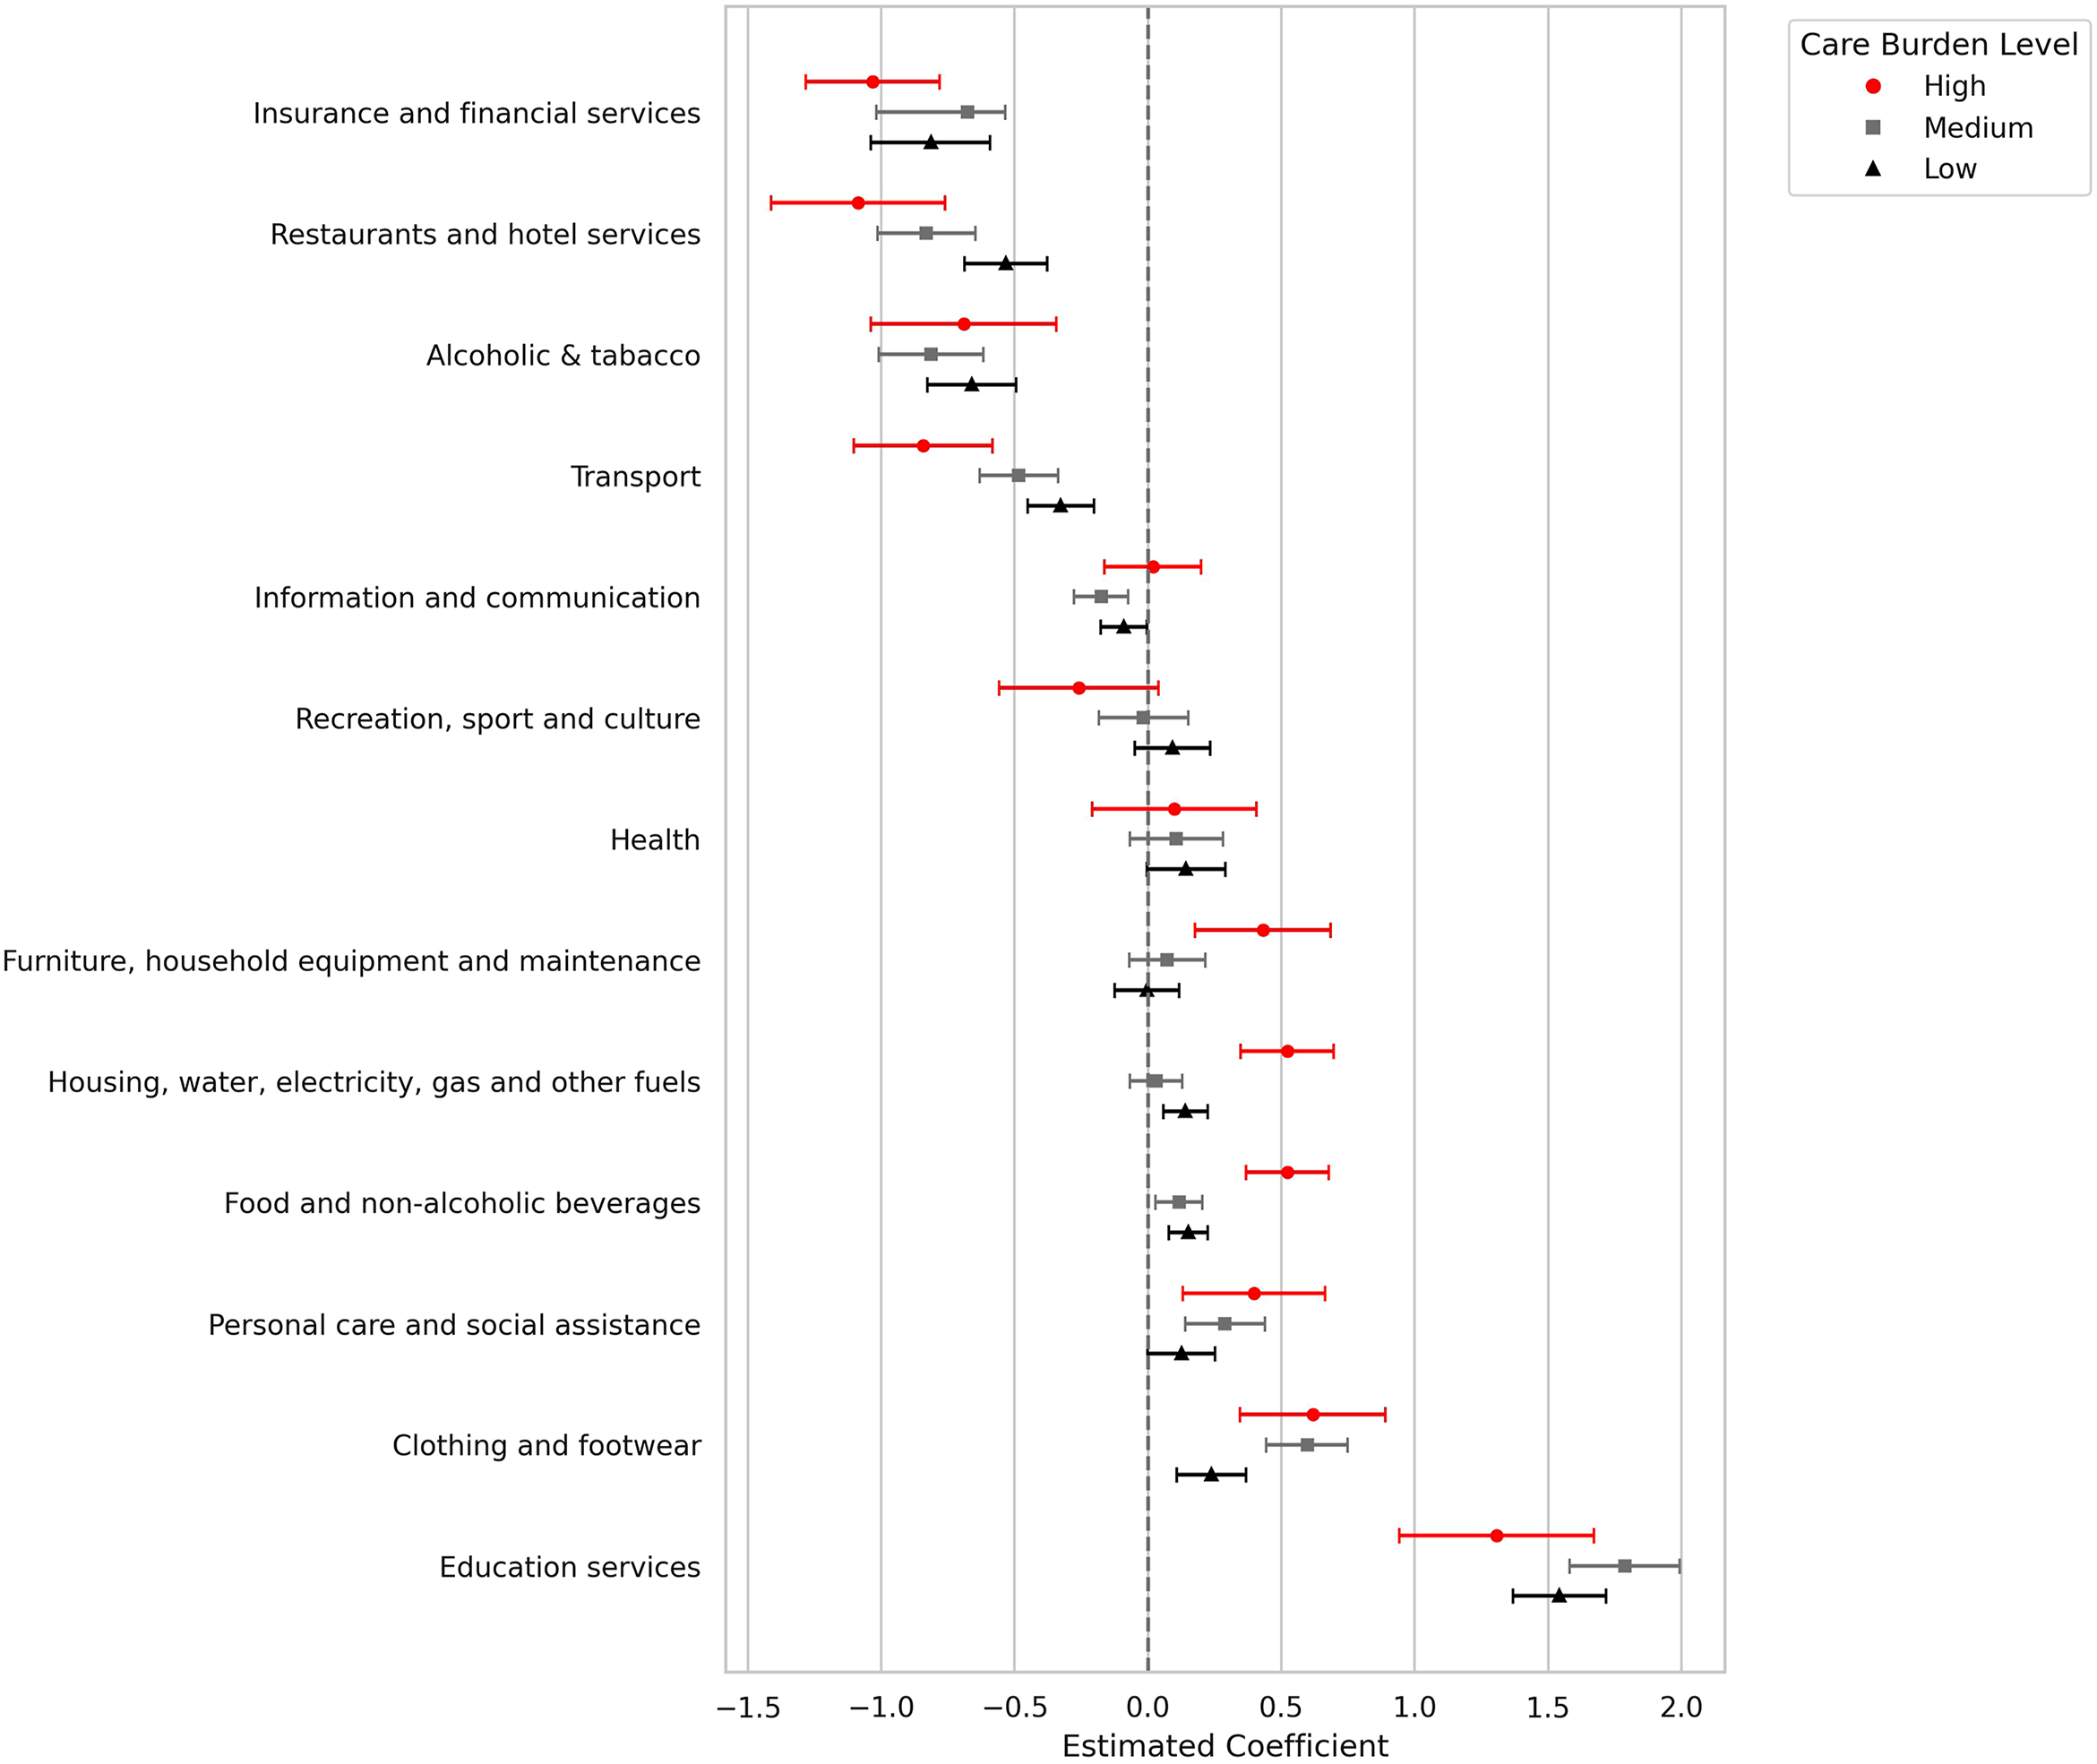
Households with a high care burden are found to spend proportionally more than those without care responsibilities on items such as food and non-alcoholic beverages, clothing and footwear, housing and basic utilities, household furniture and equipment, education services, and personal care. At the same time, these households allocate proportionally less to alcoholic beverages and tobacco, transport, restaurant and hotel services, and financial and insurance items. This suggests that households facing a high care burden adopt a spending structure more oriented towards social reproduction and day-to-day sustenance, reducing consumption related to individual well-being, leisure, or long-term financial planning. These results are consistent with our hypothesis, as they indicate a reallocation of household expenditure towards basic and care-related needs and away from discretionary items in the presence of a heavy care burden.
Households with a medium level of care burden exhibit a spending pattern that partially mirrors that of households with a high care burden, though with notable differences in scope and intensity. Similar to the high-burden group, these households allocate a significantly larger share of their budget to food and non-alcoholic beverages, education services, clothing and footwear, and personal care. In some cases, such as education, the effect is even stronger in the medium-burden group than in the high-burden group. This may reflect that, while education is closely linked to the presence of children, households with very high care demands might need to deprioritise it in favour of more immediate needs. In contrast, categories such as housing, water, electricity, gas and other fuels and furniture, household equipment and routine household maintenance show significant increases only in households with a high care burden, but not in those with a medium burden. This may suggest that greater care demands lead to increased spending on domestic infrastructure and basic services, potentially to accommodate the needs of household members with disabilities or reduced mobility. Finally, as with households facing a high care burden, those with a medium care burden reduce spending on discretionary items such as alcoholic beverages, transport, restaurants, and financial services, although the effect sizes are generally smaller. These findings point to a gradient in the impact of care responsibilities on household expenditure, with medium-burden households showing a more limited but still discernible shift in spending priorities.
Households with a low care burden also show statistically significant differences in spending patterns when compared to those without care responsibilities, although the magnitude and breadth of these effects are more limited. These households allocate a larger proportion of their expenditure to basic and care-related categories such as food and non-alcoholic beverages, clothing and footwear, housing and utilities, education services, and personal care. The increase in education spending is particularly strong, which is consistent with the inclusion of children in the care burden index. At the same time, households with a low care burden reduce their relative spending on several discretionary or postponable items, including alcoholic beverages and tobacco, transport, information and communication, restaurant and hotel services, and financial and insurance services. While the direction of these changes mirrors those observed in medium and high-burden households, the effect sizes are generally smaller, and fewer categories reach statistical significance. These results reinforce the existence of a care-related gradient in household spending patterns, suggesting that even a relatively low level of care responsibility is sufficient to trigger a reallocation of resources away from flexible consumption and towards essential goods and services, in line with the expectations formulated in our hypothesis.
Discussion and Conclusion
The aim of this study was to examine how the intensity of the care burden – measured through the Potential Care Demand Index (IDPC) – reshapes the composition of household expenditure in Chile, using data from the 2021–2022 Household Expenditure Survey (Encuesta de Presupuestos Familiares – EPF). Drawing on the feminist care-economy framework and the household budget literature, we hypothesised that the composition of total household spending differs significantly between households with and without care responsibilities, with the former allocating a greater proportion of their budget to basic needs and care-related categories and a lower proportion to postponable goods and services, controlling for socioeconomic and demographic factors.
Our findings confirm this hypothesis. The care burden significantly influences household spending patterns, both overall and across most of the 13 expenditure categories examined. In general, households with care responsibilities – regardless of intensity – devote a larger share of their budget to goods and services linked to daily social reproduction, such as food and non-alcoholic beverages, basic clothing, housing and utilities, education, and personal care, while reducing expenditure on postponable or discretionary items, including transport, restaurants, recreation, and financial services. Notably, the reduction extends to areas such as recreation, which, while not essential for material subsistence, play a significant role in emotional and social well-being. This complements existing time-use research, which shows that individuals and families with heavy care responsibilities experience time poverty (Harvey & Mukhopadhyay, 2007; Warren, 2003); our results indicate that they also allocate fewer financial resources to leisure and recreational activities. Overall, this pattern is consistent with the substitution effect described in previous studies (Kim & Yang, 2011; Tumini & Wilkis, 2022), whereby rising care demands compel households to reallocate resources away from flexible or deferrable consumption towards goods and services necessary for daily functioning and social reproduction.
When considering different levels of care burden, a clear gradient emerges. Households with a high burden display the most extensive and marked reallocation of spending, including significant increases in housing and utilities, as well as furniture and household equipment – potentially reflecting adaptations to accommodate members with disabilities or reduced mobility. Medium-burden households partially mirror this pattern, though with a narrower scope. In this group, the increase in education spending is even greater than in high-burden households, suggesting that when care responsibilities are substantial but not extreme, education retains a stronger budgetary priority. By contrast, the increases in housing, utilities, and household equipment observed in the high-burden group are not significant among those with a medium burden, indicating that such investments may be more closely linked to the demands of intensive care. Low-burden households, although showing smaller effect sizes, still exhibit a significant shift towards basic needs, indicating that even moderate care responsibilities reshape spending composition.
A particularly relevant finding is the high sensitivity of education expenditure to the care burden. This is largely explained by the fact that a substantial part of the care demand stems from the presence of children in the household. However, it also reflects the significant financial weight of education in a highly marketised system such as Chile’s (Alarcón & Falabella, 2021). In this context, households with very high care demands may be forced to sacrifice part of their education spending to meet more immediate needs, while those with a slightly lower burden – such as medium-burden households – are able to maintain or even increase this investment.
Taken together, the IDPC accounts for 6.3% of the joint variance across the 13 expenditure categories, a magnitude comparable to that of other key variables in the models, such as socioeconomic status, household size, and the age of the household head. This suggests that, while the care burden is an independent driver of expenditure allocation, class position and stage in the family life cycle also play a central role, shaping how resources are distributed across different needs and potentially reinforcing pre-existing inequalities in access to goods and services essential to present and future well-being.
Despite these important findings, our study is constrained by limitations inherent to the data used. In particular, the high level of aggregation in the expenditure categories and the difficulty of isolating items directly linked to care restrict the precision of our analysis. While it is clear that households with high care burdens spend more on basic goods and services, we cannot determine how much of this corresponds to direct care expenses, or to what the literature describes as out-of-pocket spending – that is, payments made directly by households at the point of service which are not reimbursed or covered by insurance or public provision. Likewise, the available data do not allow us to examine how different types of care burdens – such as those related to children, older adults, or people with severe dependency or other special needs – affect spending patterns differently, despite evidence that the associated costs and budgetary implications can vary substantially (Anderson et al., 2007; Barnard-Brak et al., 2014). Nor do we know how households finance these costs, which, according to existing evidence, may involve debt or asset depletion, with potential consequences for long-term economic security (Palma & Araos, 2021;Pérez-Roa & Cuadra, 2024). Developing more specific and fine-grained measurement instruments would make it possible to estimate more accurately the share of household expenditure devoted to such items, the mechanisms used to cover them, and how this affects the allocation of resources to other goods and services necessary for both material and emotional well-being.
Overall, these results are consistent with the literature on familistic welfare regimes (Molyneux, 2007; Staab, 2012), which underscores the need for care policies that move beyond ad hoc programmes centred on early childhood and instead recognise care as a social right throughout the life course. Effective policy design should combine the expansion of publicly accessible care services with direct monetary transfers to compensate households for the additional costs associated with heavy care responsibilities. Strengthening public provision could ease pressure on family budgets, enabling resources to be redirected to other essential dimensions of well-being. This is particularly important given the substantial economic impact of care responsibilities on education spending in Chile, where greater public investment could reduce financial strain and help close gaps in access and quality. Framing care policies in this way positions them not only as instruments for advancing gender equality and work–family reconciliation, but also as key strategies for bolstering households’ economic security and overall well-being.
Footnotes
Ethical Considerations
This study is based on secondary analysis of anonymised public-use data from the 2021–2022 Chilean Household Budget Survey (Encuesta de Presupuestos Familiares, EPF) conducted by the National Institute of Statistics (INE). As such, no additional ethical approval or informed consent was required.
Funding
The authors disclosed receipt of the following financial support for the research, authorship, and/or publication of this article: This research was supported by the Ministry of Social Development and Family Affairs, through the Undersecretary of Social Services, based on the study Expenditure structure in households with caregivers and persons with dependency or disability identified in the Social Household Registry. It also received support from the Chilean National Agency for Research and Development (ANID) through two projects: the Millennium Nucleus on Labor Policy and Family and Community Life (LABOFAM) – Millennium Science Initiative Program – Grant Code: NCS2024_019, and the FONDECYT Regular Project N° 1220039.
Declaration of Conflicting Interests
The authors declared no potential conflicts of interest with respect to the research, authorship, and/or publication of this article.
Data Availability Statement
Appendix
Estimated coefficients from the GLM for expenditure categories by level of care burden, controlling for covariates Note.The estimated coefficients correspond to comparisons against the reference group, composed of households without a care burden (IDPC = 4). Therefore, the values indicate the average change in CLR coordinates of expenditure for each category relative to households without care responsibilities. Negative coefficients imply a lower proportional expenditure on that item compared to the reference group; positive coefficients indicate a higher proportional expenditure.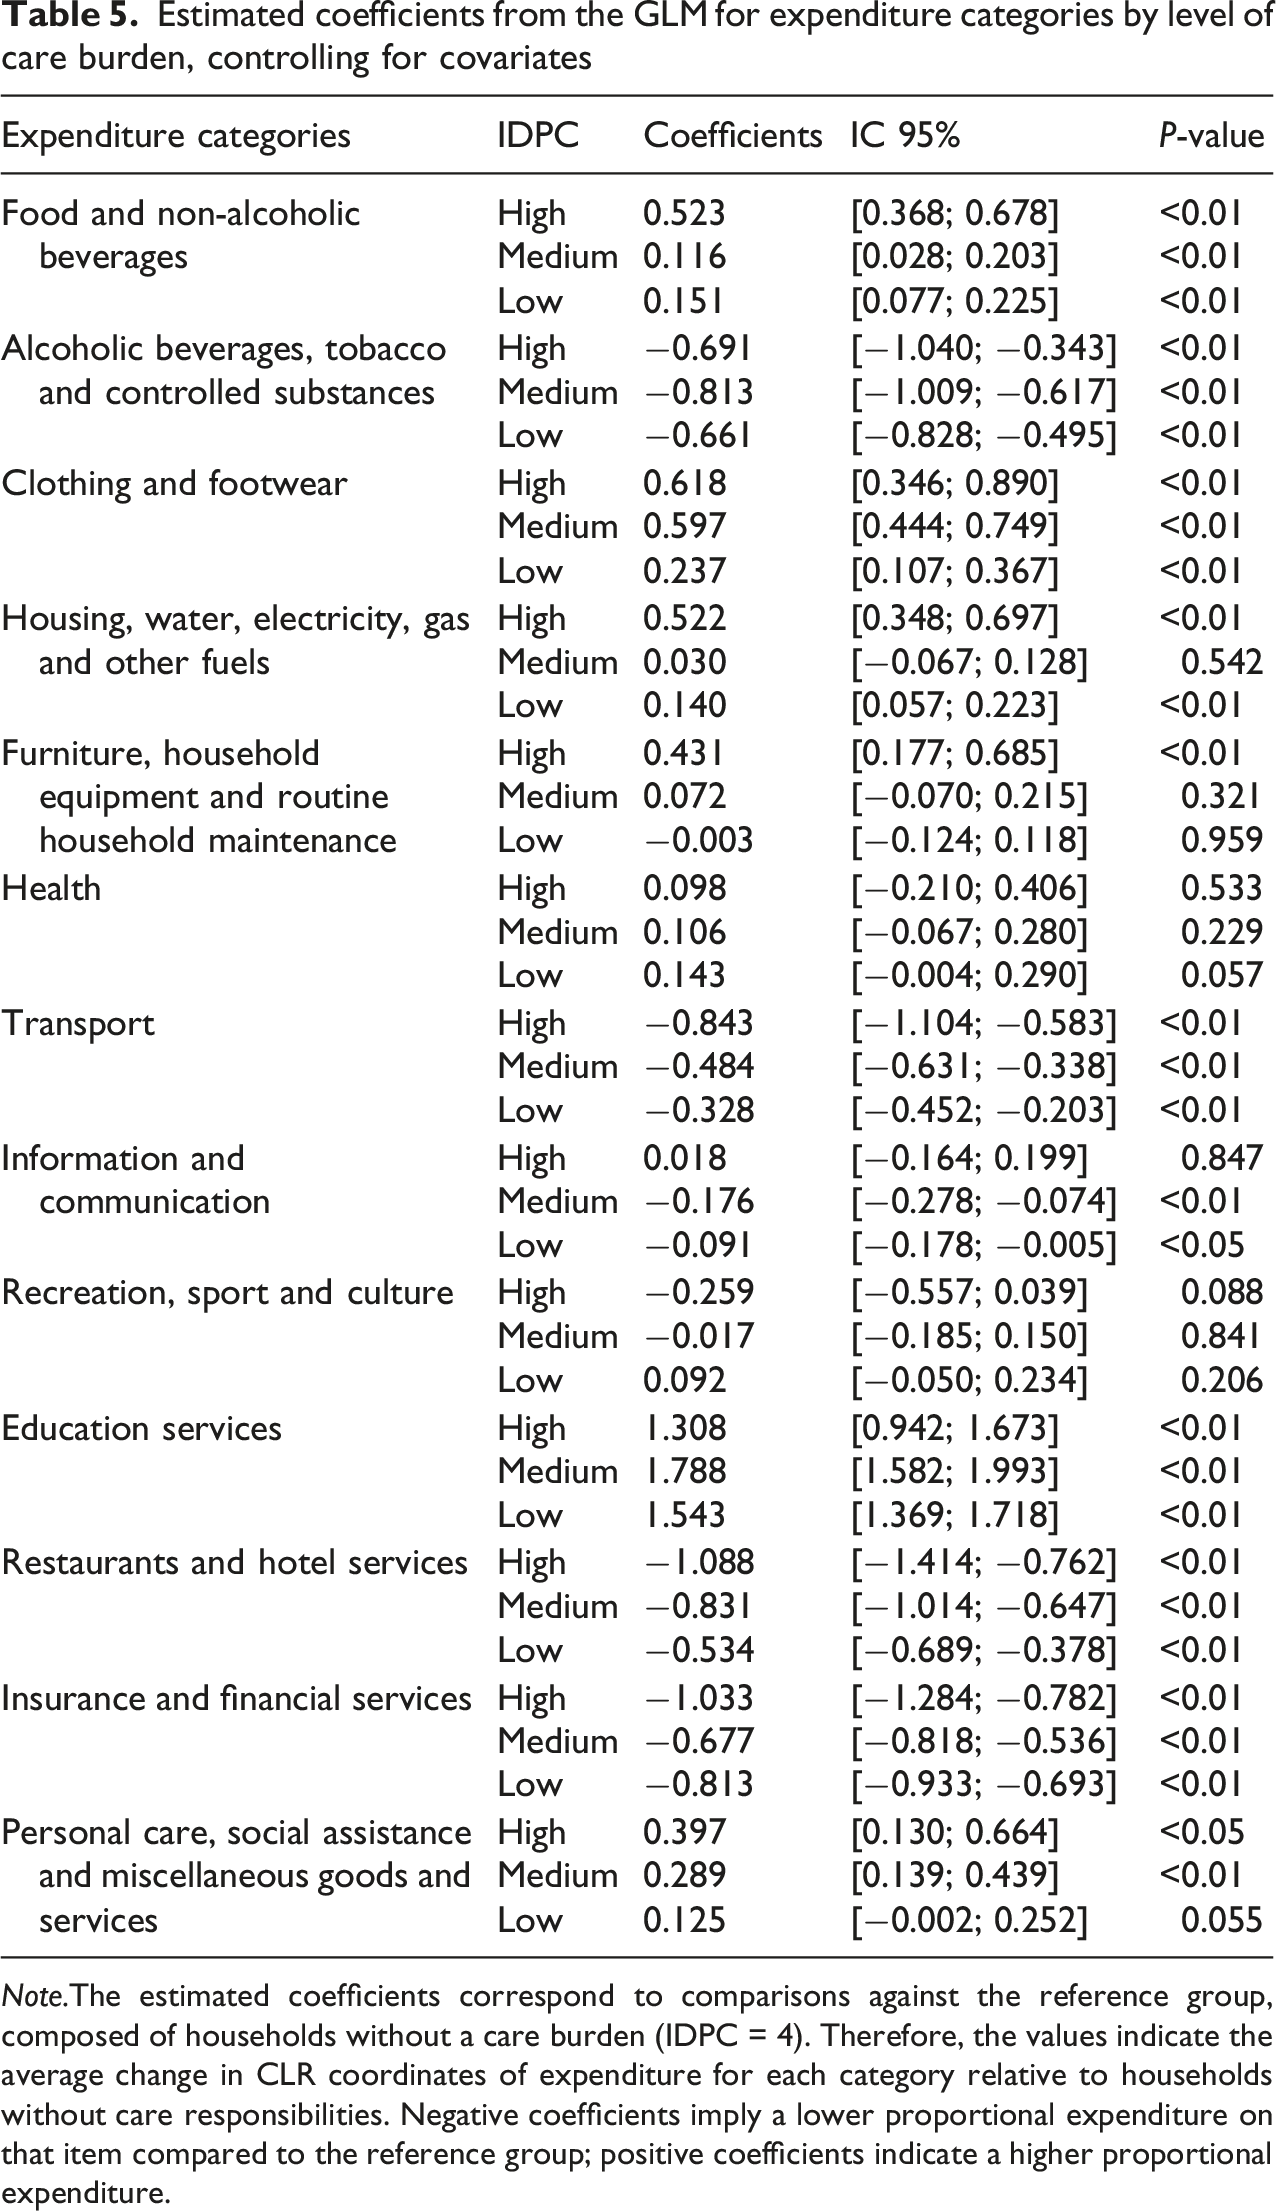
Expenditure categories
IDPC
Coefficients
IC 95%
P-value
Food and non-alcoholic beverages
High
0.523
[0.368; 0.678]
<0.01
Medium
0.116
[0.028; 0.203]
<0.01
Low
0.151
[0.077; 0.225]
<0.01
Alcoholic beverages, tobacco and controlled substances
High
−0.691
[−1.040; −0.343]
<0.01
Medium
−0.813
[−1.009; −0.617]
<0.01
Low
−0.661
[−0.828; −0.495]
<0.01
Clothing and footwear
High
0.618
[0.346; 0.890]
<0.01
Medium
0.597
[0.444; 0.749]
<0.01
Low
0.237
[0.107; 0.367]
<0.01
Housing, water, electricity, gas and other fuels
High
0.522
[0.348; 0.697]
<0.01
Medium
0.030
[−0.067; 0.128]
0.542
Low
0.140
[0.057; 0.223]
<0.01
Furniture, household equipment and routine household maintenance
High
0.431
[0.177; 0.685]
<0.01
Medium
0.072
[−0.070; 0.215]
0.321
Low
−0.003
[−0.124; 0.118]
0.959
Health
High
0.098
[−0.210; 0.406]
0.533
Medium
0.106
[−0.067; 0.280]
0.229
Low
0.143
[−0.004; 0.290]
0.057
Transport
High
−0.843
[−1.104; −0.583]
<0.01
Medium
−0.484
[−0.631; −0.338]
<0.01
Low
−0.328
[−0.452; −0.203]
<0.01
Information and communication
High
0.018
[−0.164; 0.199]
0.847
Medium
−0.176
[−0.278; −0.074]
<0.01
Low
−0.091
[−0.178; −0.005]
<0.05
Recreation, sport and culture
High
−0.259
[−0.557; 0.039]
0.088
Medium
−0.017
[−0.185; 0.150]
0.841
Low
0.092
[−0.050; 0.234]
0.206
Education services
High
1.308
[0.942; 1.673]
<0.01
Medium
1.788
[1.582; 1.993]
<0.01
Low
1.543
[1.369; 1.718]
<0.01
Restaurants and hotel services
High
−1.088
[−1.414; −0.762]
<0.01
Medium
−0.831
[−1.014; −0.647]
<0.01
Low
−0.534
[−0.689; −0.378]
<0.01
Insurance and financial services
High
−1.033
[−1.284; −0.782]
<0.01
Medium
−0.677
[−0.818; −0.536]
<0.01
Low
−0.813
[−0.933; −0.693]
<0.01
Personal care, social assistance and miscellaneous goods and services
High
0.397
[0.130; 0.664]
<0.05
Medium
0.289
[0.139; 0.439]
<0.01
Low
0.125
[−0.002; 0.252]
0.055