
Abstract
Histopathologic evaluation plays a crucial role in assessing morphological tissue alterations in disease models and toxicology studies. Identifying small quantitative shifts in specific substructures of organs can be challenging due to the subjective nature of visual assessment and the pathologist’s reliance on categorical measurements rather than continuous ones. The emergence of digital pathology and artificial intelligence (AI) provides the ability to quantify different organ substructures using automated methods. Here, we employed a deep learning method to integrate normal pancreatic substructures into an algorithm. We also included areas of abnormal pancreas in the deep learning model. Once the image analysis pipeline was developed, we tested its effectiveness on a disease model and a toxicity study. The quantitative measurements clearly differentiated between control animals and those in the disease model or treated with a test article. In the toxicity study, we observed a distinct dose-dependent change. This approach could be applied to other organs and different species.
In disease model and toxicology studies, tissue samples are collected for microscopic pathology evaluation. The tissues are evaluated by pathologists to assess disease progression, treatment effect, and/or toxicity. 1 The pathology grading assessment is subjective and thus subject to intra/inter individual variability. For subtle quantitative changes, the detection of minor shifts in the ratios of different structures may be time-consuming and difficult to grade consistently, for example, changes in acinar secretory content or ratio of endocrine/exocrine areas in the pancreas. With the advent of digital pathology and artificial intelligence (AI), it is possible to quantify tissue substructures and, using an automated method, increase the sensitivity and specificity of the evaluation. This evaluation is expected to supplement the pathologist’s evaluation with quantitative data, thus improving efficiency and accuracy. Such automated methods can be continuously refined and expanded to multiple tissues.
The pancreas is a physiologically important organ with exocrine and endocrine functions associated with distinguishable anatomical structures. Most of the tissue section area is composed of exocrine acinar cells, which produce digestive enzymes secreted in the intestine. The exocrine acinar cells are organized in clusters (acini) with the basophilic nuclei located near the base of the cells and the brightly eosinophilic zymogen granules at the cellular apex, near the acinar lumen. The acini are the basic functional units of the exocrine pancreas. The endocrine cells are clustered in well-defined, irregular and variably sized structures known as the islets of Langerhans. The islets are unevenly distributed throughout the pancreas and can be concentrated in certain lobes depending on the species. Consistency in the sampling method is therefore important for quantitative measurements. There are five characterized cell types that make up the islets and they are indistinguishable on conventional H&E-stained sections by light microscopy. Beta cells are the most abundant, producing insulin. The other main cell types are alpha cells that produce glucagon, delta cells that produce somatostatin, pancreatic polypeptide cells that produce a polypeptide, and epsilon cells that produce ghrelin. 6
The pancreatic tissue is susceptible to local and systemic disease, spontaneous and/or drug-induced effects, many of which result in complex morphologic alterations.
Due to the complexity of these morphologic changes in the pancreas, the training of the model was limited to the identification and quantification of the different components of normal structures to detect simple, but subtle shifts in proportions. Thus, the focus was on training on normal structures and discriminating from extra pancreatic tissues (lymph node, adipose tissue) that are commonly encountered in sections of pancreas. To quantify the area and ratios of normal pancreatic structures and then detect shifts in surface area of these structures, a multi-task deep neural network was trained to segment pancreatic substructures within and adjacent to the pancreas, for example, acinus, islet, vessel/duct, connective tissue, nerve, adipose tissue, lymph node. The next step was to segment the zymogen granules within acinar cells. Once the structure segmentation was performing accurately and consistently, the area ratio of different substructures was calculated. The quantitative measurements were gathered from two studies and compared with the pathologist’s assessment. In a study evaluating rat strain-specific disease progression (diabetes), the area ratio of islet to acinar tissue was significantly lower in SDT (Spontaneously Diabetic Torii) rats compared with control rats (Sprague-Dawley). In a toxicology study, a dose-dependent decrease in ratio of zymogen content to total acinus was observed in both male and female rats.
In previous work, a linear support vector machine (SVM) was employed to segment pancreatic islets. 2 Ternes et al used a deep neural network to segment normal acinar structures, the ductal phenotype of acinar-to-ductal metaplasia (ADM), and dysplasia where a separate model was trained for each annotated ductal tissue type. 8 In our work, a single model was trained to segment acinus, islet, vessel/duct, connective tissue, nerve, adipose tissue, and lymph node simultaneously.
Data Preparation
To generate training data for structure segmentation of the pancreas, pancreatic tissue from a control rat was embedded in paraffin and 10 consecutive 4-µm-thick sections were generated, mounted on glass slides, stained with hematoxylin and eosin (H&E) and scanned to digital images using an Aperio AT2 scanner (Leica Biosystems, Vista, California) at 20× (0.5 μm/pixel). All tissue samples were collected in accordance with regulations and established guidelines for humane treatment of research animals and protocols were reviewed and approved by an Institutional Animal Care and Use Committee.
Approximately 10% of the first and last sections were annotated using Visiopharm software to identify the following structures: acinus, islet, blood vessel, duct, connective tissue, and nerve. Figure 1 shows an example of a region of interest (ROI) with annotations (Inset).
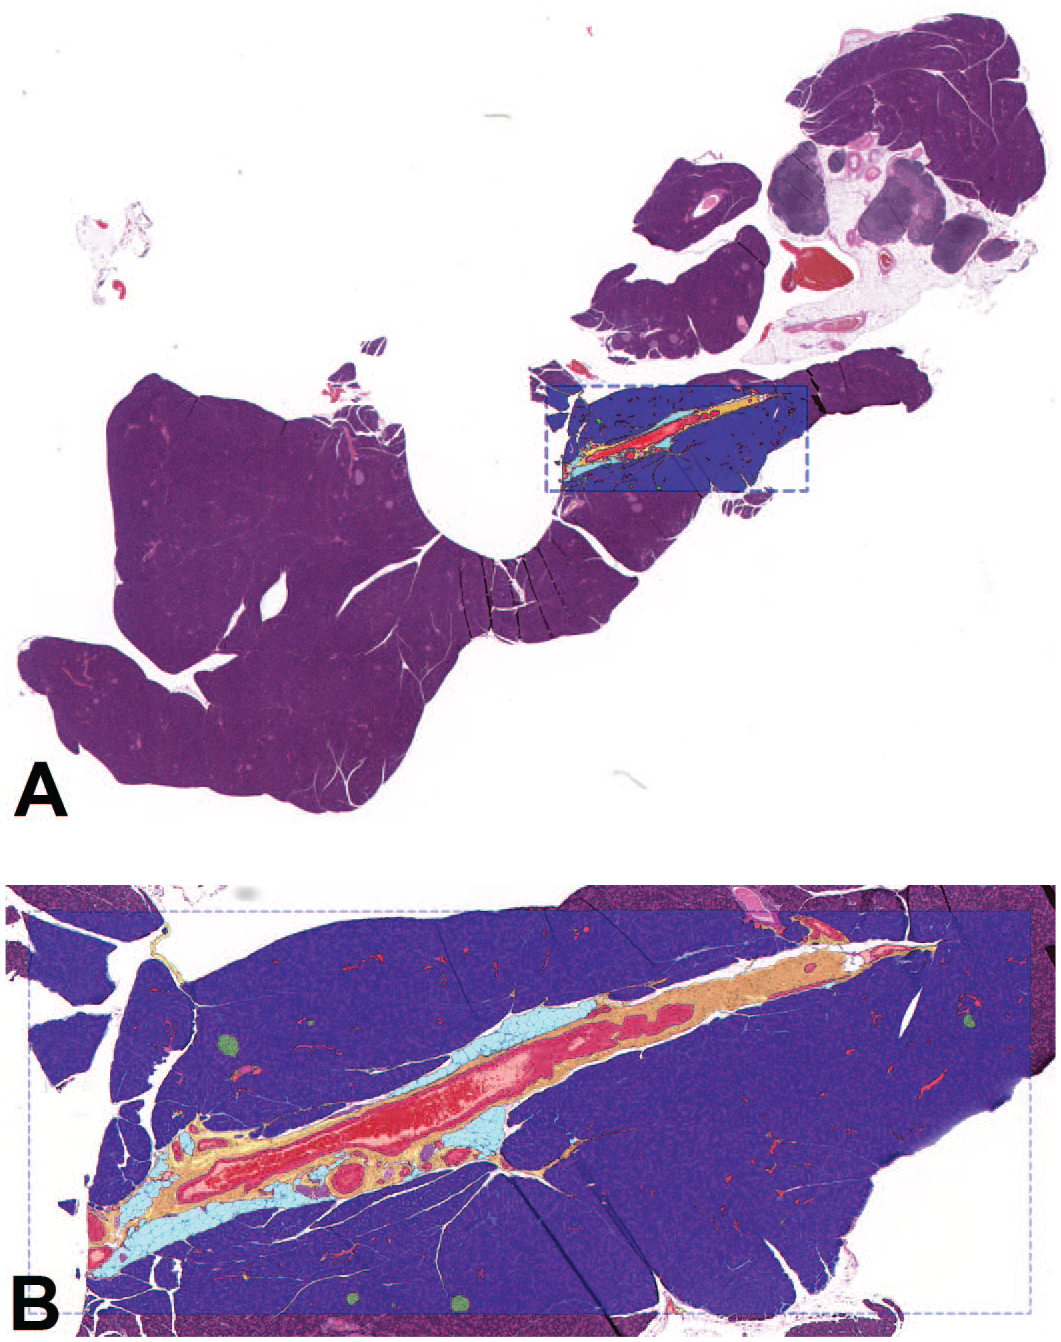
Example of pancreas annotations (Inset) inside a region of interest on an H&E-stained section of pancreas using Visiopharm software shown at low magnification (A) and high magnification (B). Annotated structures include acini (dark blue), islets (green), blood vessels (red), connective tissue (yellow), ducts (pink), adipose tissue (light blue), and nerve (purple).
The annotations were mapped to the images in the serial sections between the first and last sections to generate more training data. The nonlinear transformation between adjacent slides was calculated by maximizing the similarities between the first and last images. 3 In this study, B-spline transformation was used to account for the nonlinear distortions between the two sections or in other words, align the serial sections. Mean squared difference was used to measure the similarity between these images. Limited-memory BFGS Bound optimizer was used to find optimal parameters of transformation. Pathologist annotation is performed manually and can be imprecise. Precision is improved using pixels near the boundaries of an annotated structure and reclassifying using the k-means method to improve the quality of annotation. Figure 2 shows an example of segmentation outline following iterative training of the computer model.
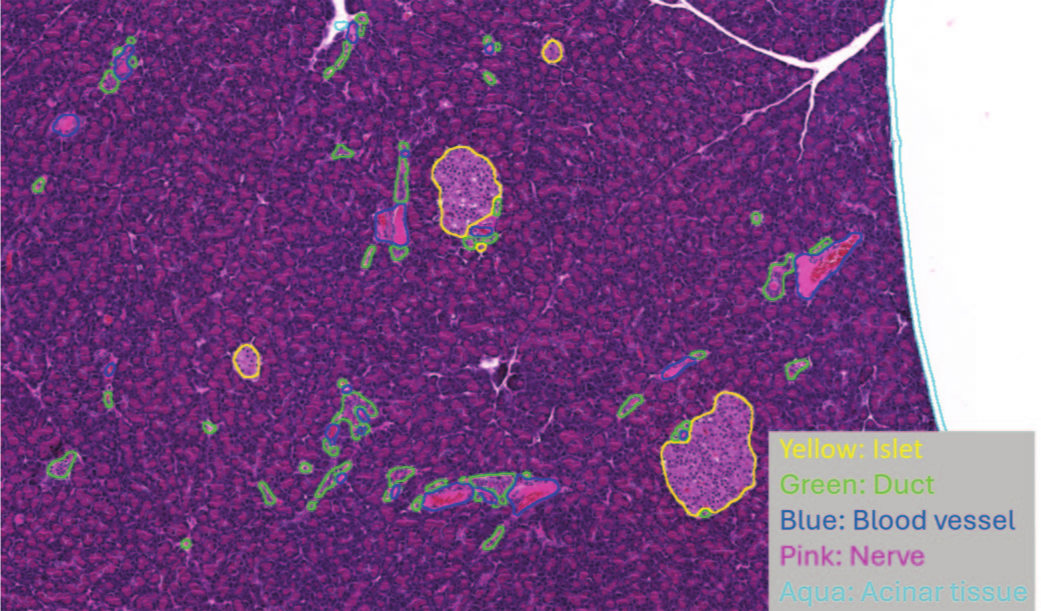
Segmentation outline of pancreatic structures following iterative training of the computer model.
Zymogen granules in acinar cells, lymph node, and adipose tissues were segmented on the cropped images using an internally developed tool based on pixel clustering and morphological image processing. Additional annotations within ROIs specifically chosen to represent areas of zymogen granules in acinar cells, lymph node, and white adipose tissues were performed on two specific slides to provide iterative training to the algorithm. Automatic segmentation and manual annotation were combined to train the deep neural network.
To make the training data suitable for the convolutional neural network, the images and annotations inside ROIs were broken into small images (patches). Each patch was composed of 512 × 512 pixels at the full resolution (0.5 μm/pixel). Training patches were also extracted from horizontally and vertically flipped ROI images with shifted origins to create more training data.
Neural Network and Iterative Training
The architecture of U-Net was used to model the segmentation. 5 Since this is a multi-class segmentation problem, the output of the U-Net is a multi-channel image. The number of channels is equal to the number of classes of structures. Weighted cross entropy was used to account for the imbalance of training data for different structures.
The first U-Net model was trained from the initial training sets based on patches of 10 serial sections of the same tissue. To create diversified training data, whole slide images were retrieved from studies where the tissue was stained in different laboratories and at different times. The first trained model was applied to these images to generate segmentation of the substructures. If the result was not satisfactory, stain normalization was applied to the image using the Macenko method. 4 The normalized images were segmented using the first trained model. Figure 3 illustrates one example of an original whole slide image (Fig. 3A) and the image after stain normalization (Fig 3C), as well as substructure segmentation of the image before (Fig. 3B) and after stain normalization (Fig 3D). Before normalization, the model struggled to distinguish major structures such as acinus and islet but performed better after normalization. The segmentation results together with the original image were added to the training data to retrain the model. In this way, the re-trained model learned to handle stain variations without the need for stain normalization on each image. Figure 4 is an example of zymogen segmentation from the improved segmentation with the re-trained U-Net model (Fig 4A unsegmented; Fig 4B showing segmentation).
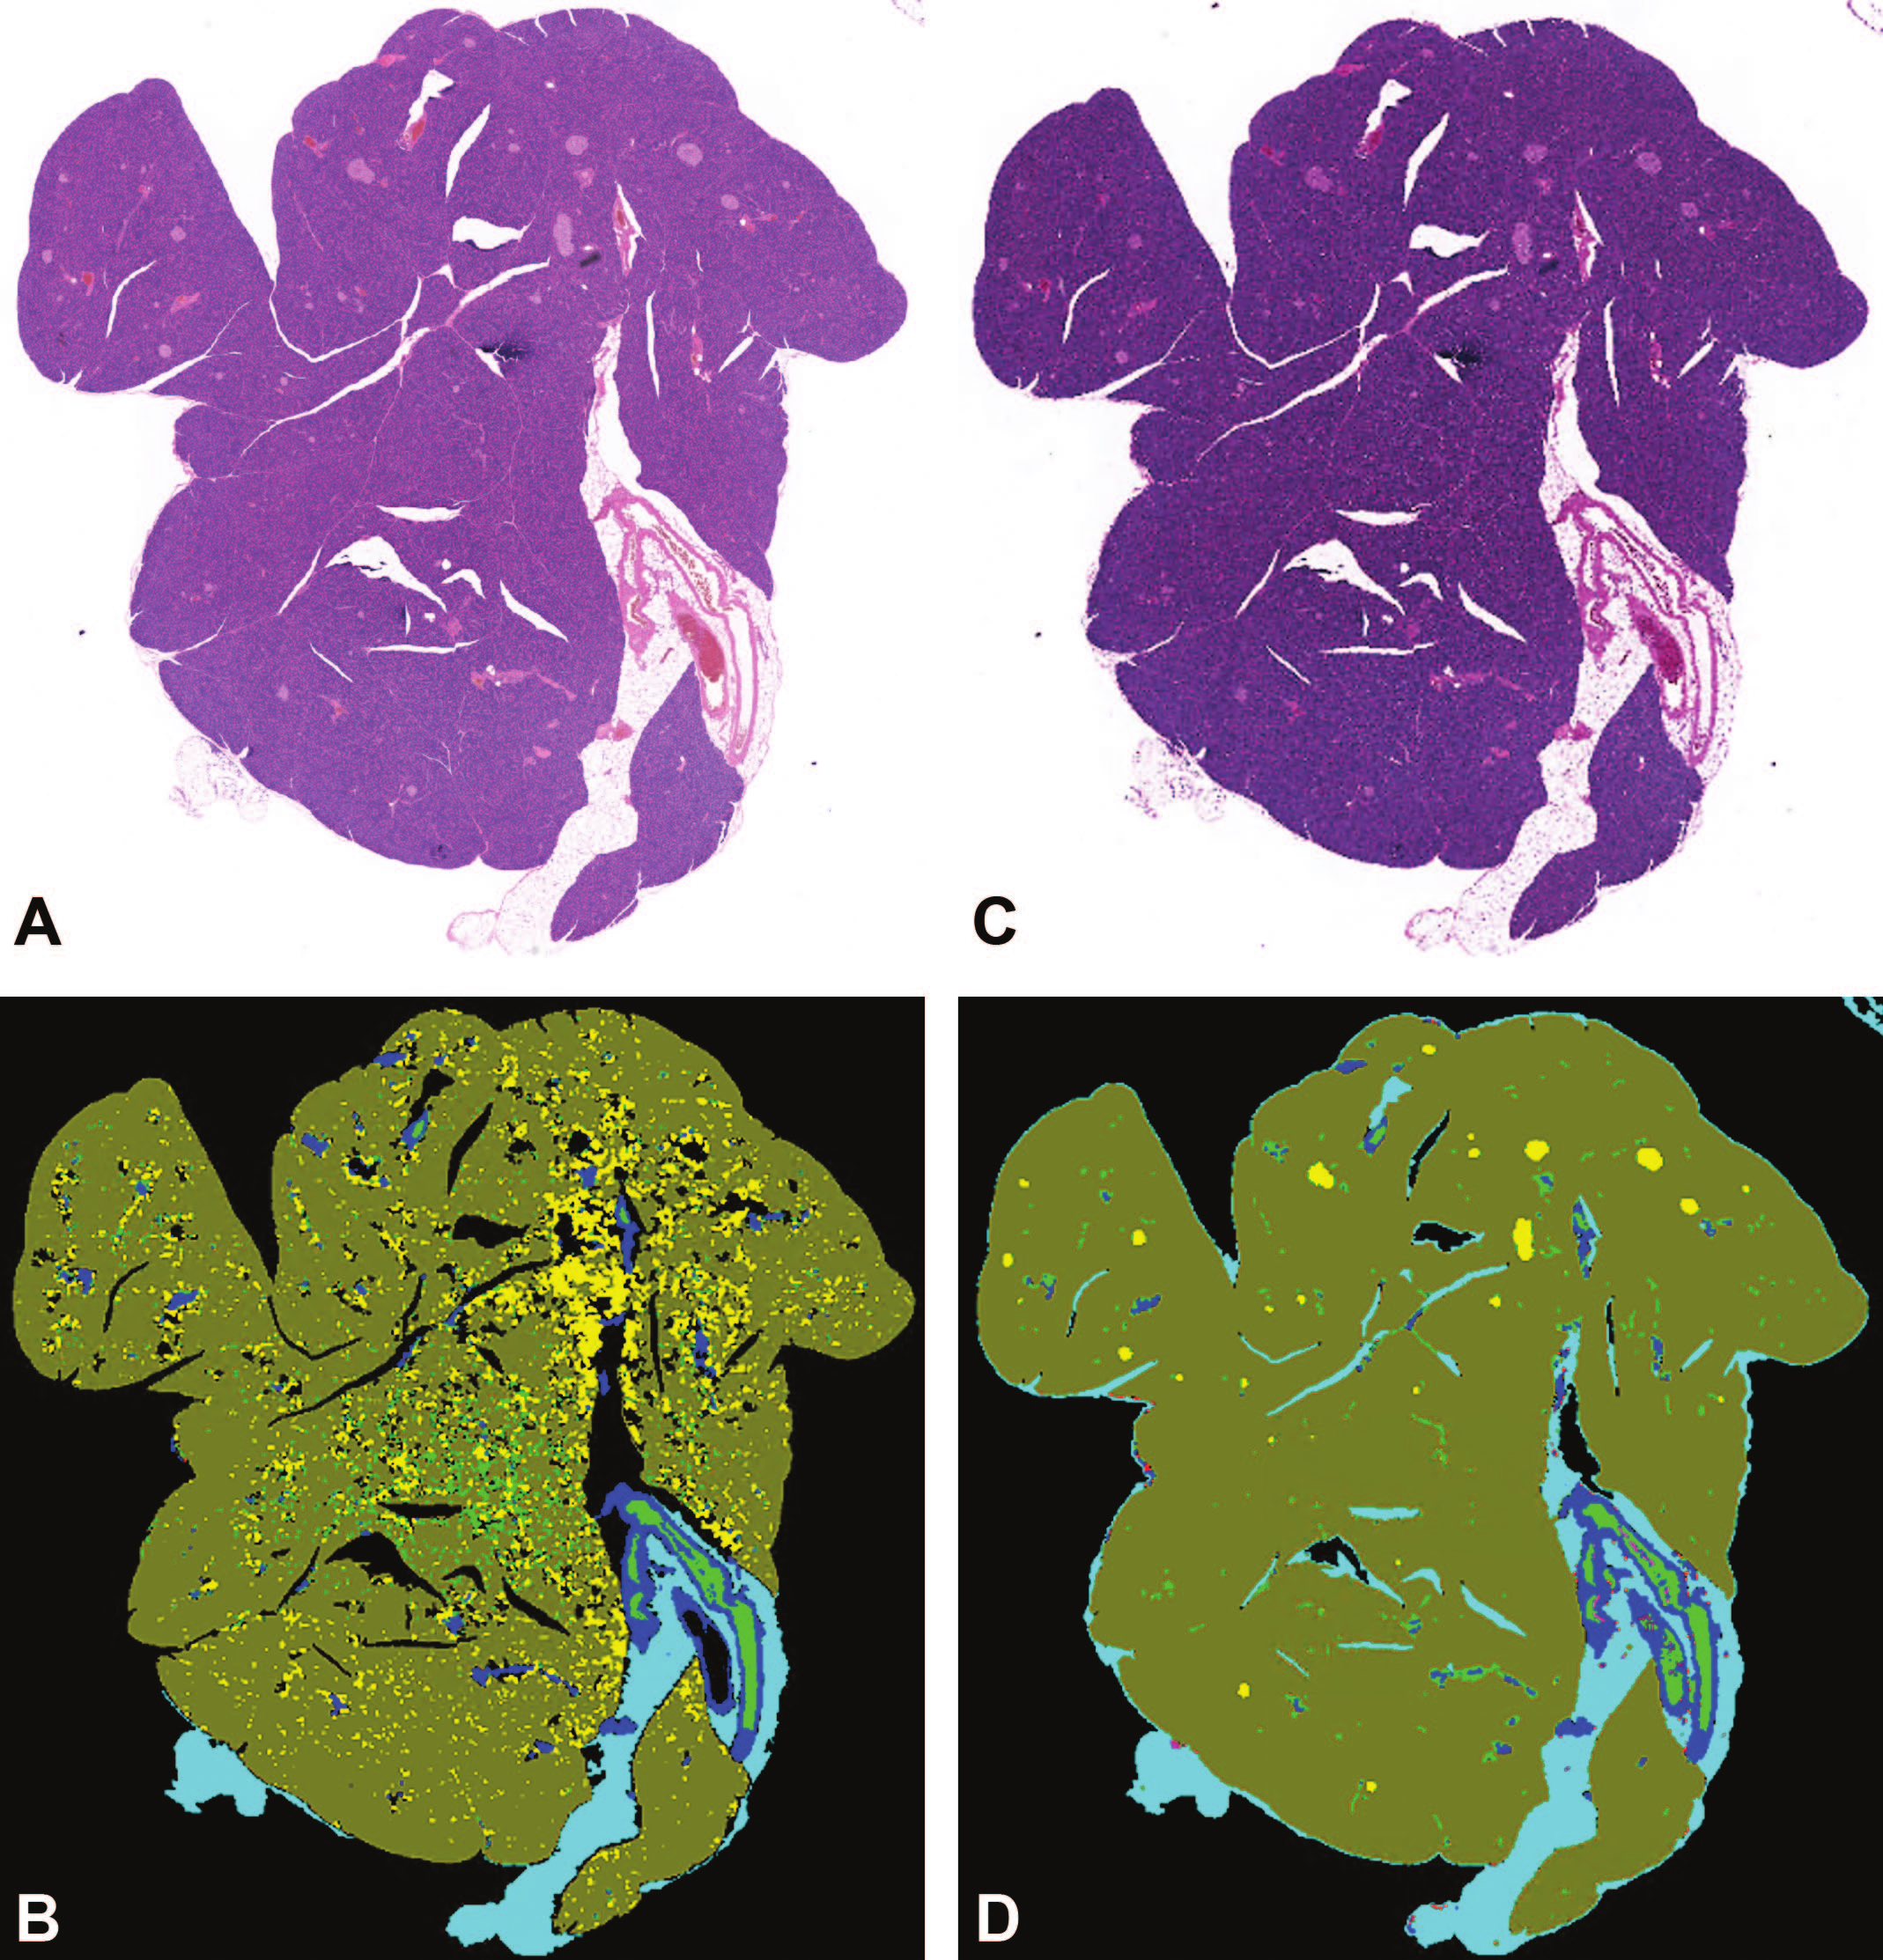
Pancreas image and segmentation results before and after stain normalization. A. Original image. B. Segmentation on original image. C. Image after stain normalization. D. Segmentation on stain normalized image. Prior to color normalization, there is substantial misidentification of acini (olive green) as islet (yellow) and blood (bright green).
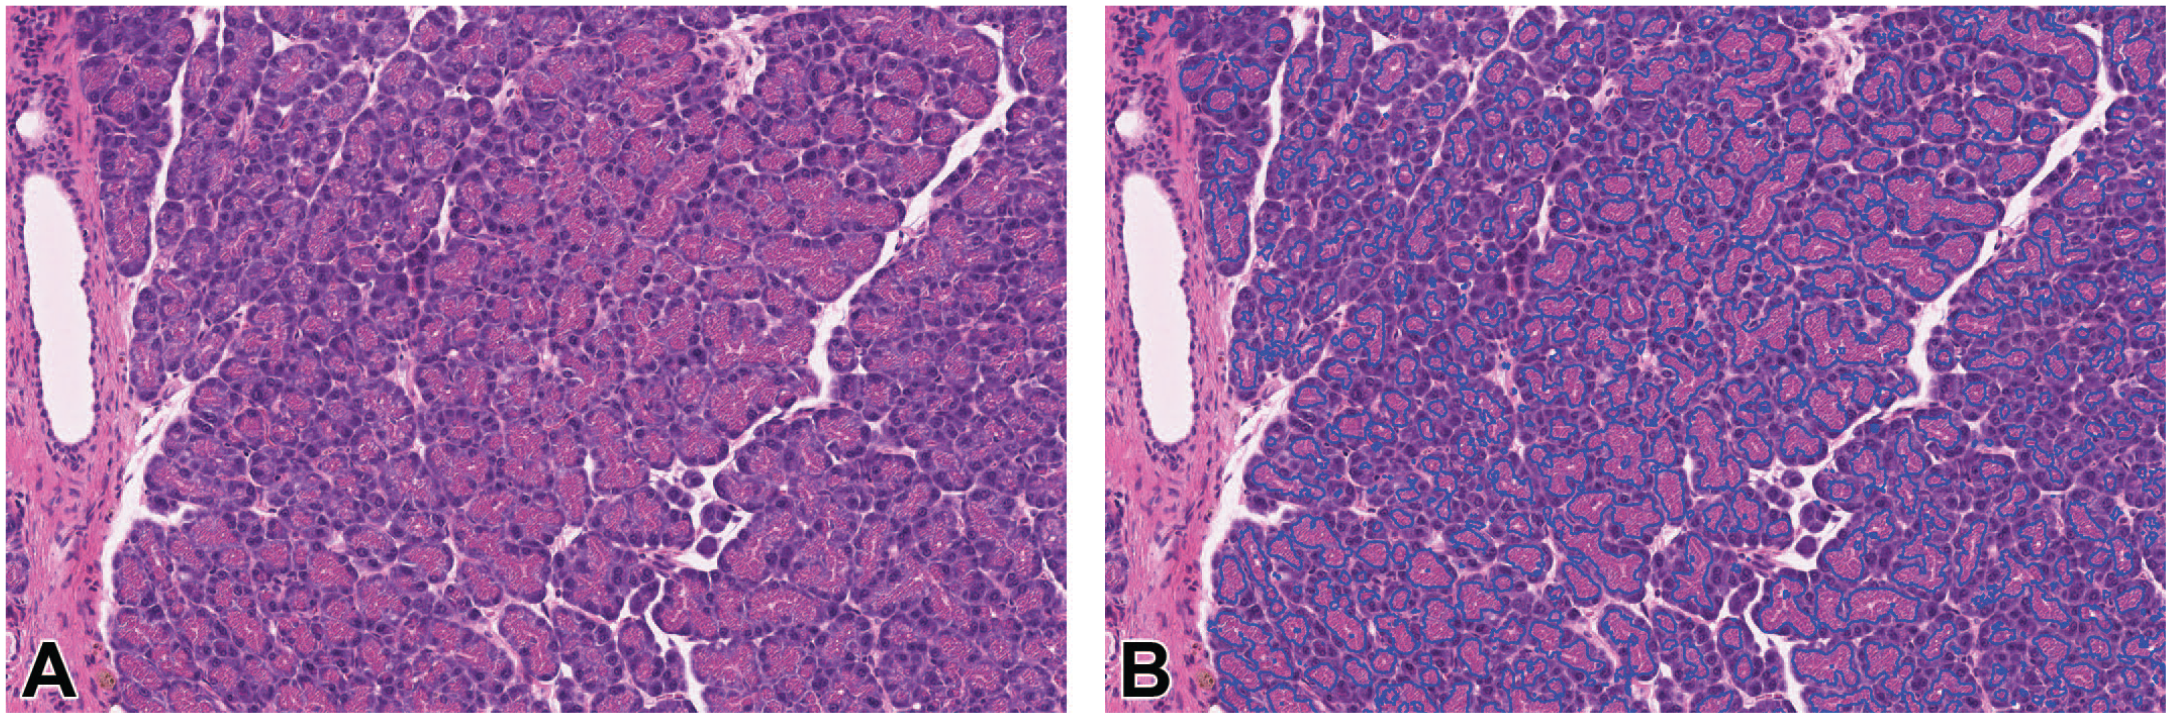
Zymogen segmentation. A. H&E section of pancreas. B. Same section with blue outline by the algorithm identification of zymogen granules.
If the segmentation results were not satisfactory following stain normalization, additional manual annotation of a selected ROI was used to add iterative training to correct the segmentation in the model. Every time additional annotation was required, the results were added to the training data to strengthen the model. The final training data included 15,986 patches after data augmentation (10,903 for training, 5083 for testing) from 28 ROIs on 7 representative slides from different animals. Among the 28 ROIs, 8 were manually annotated. Twenty were labeled based on the segmentation after stain normalization.
The U-Net model was implemented based on Pytorch and was trained on two NVIDIA GeForce RTX 4090 GPU. Learning rate was defined as 1e-4 with ReduceLROnPlateau scheduler. The training process was stopped if the performance was not improved in three epochs.
In Vivo Studies in Rats
Study 1 (disease model). SDT 7 rats were compared with Sprague-Dawley (Crl:CD[SD]) rats for islet area quantification at 8 months of age to identify strain differences (males; n = 25/group).
Study 2 (toxicity study). Male and female 9-week old Wistar Han (Crl:[HAN]) rats were evaluated for zymogen quantification (WH) following oral administration of an undisclosed test article at 0, 50, 150, or 500 mg/kg/day for two weeks in 5/sex/group, n=40.
Pancreas was collected (entire left lobe for Study 1 and entire right lobe for Study 2), preserved and processed to glass slides, stained with hematoxylin & eosin for microscopic evaluation. The slides were scanned to whole slide images with an AT2 scanner at 20X magnification. Spearman’s rank correlation coefficient was calculated using GraphPad Prism software version 10.4.1 (GraphPad, San Diego, California). In these studies, rats were provided standard housing, diet, and appropriate enrichment. Both studies were conducted in accordance with the National Research Council Guide for the Care and Use of Laboratory Animals, 2011) and approved by the Institutional Animal Care and Use Committee.
For Study 1, the model was applied to determine the segmentation of different structures in one section of pancreas for each animal in the study. The mean values of each structure were used to calculate the islet to acinus area ratio (Figure 5). SDT rats had significantly lower islet to acinus ratios than SD rats. The quantitative results are consistent with the expected physiology of this animal model and consistent with the pathologist’s observation of decreased cellularity of the islets.
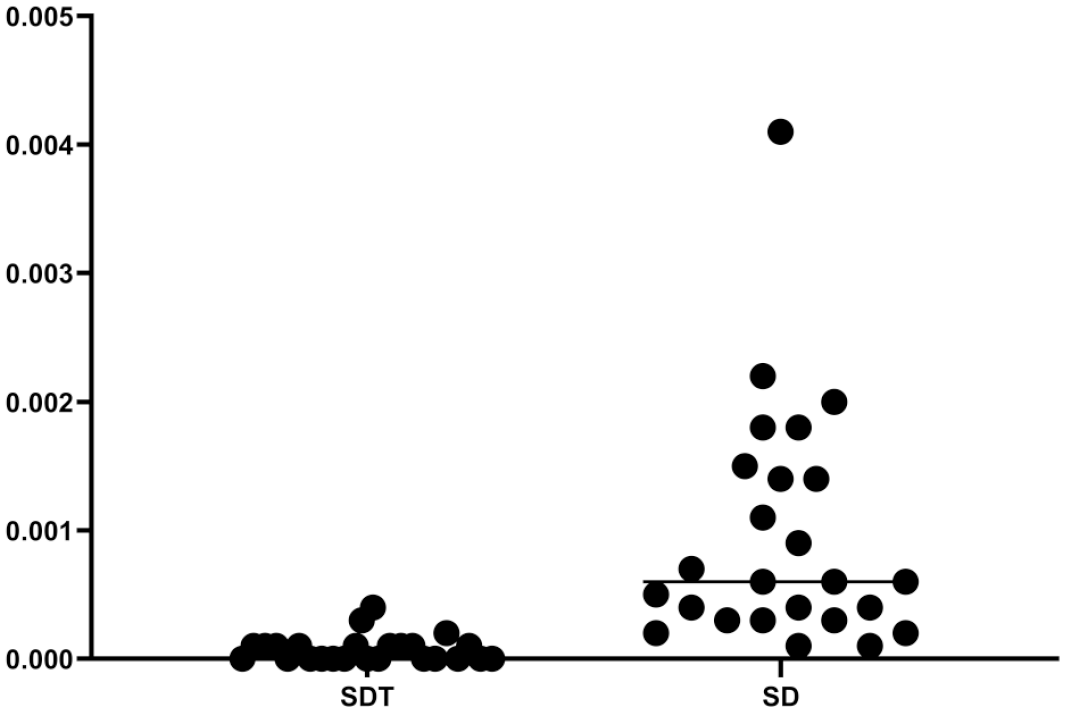
Relative islet area (islet to acinus ratio) for Spontaneously Diabetic Torii (SDT) and Sprague-Dawley (SD) rats. Decreased relative area of islets was observed in SDT rats compared with SD rats. Spearman’s rho correlating histopathology score for “decreased islets” with islet to acinus ratio was −0.80 (P < .0001).
Pancreas from Study 2 was used to test whether the quantitative method could evaluate a dose-responsive change in zymogen content. A dose-dependent decrease of zymogen to acinus area ratio was observed in both males and females (Figure 6), consistent with the pathologist’s observation of a dose-dependent decrease in zymogen content in acinar cells. A flow chart describing the methods from data preparation to model deployment onto real studies is presented in Figure 7.
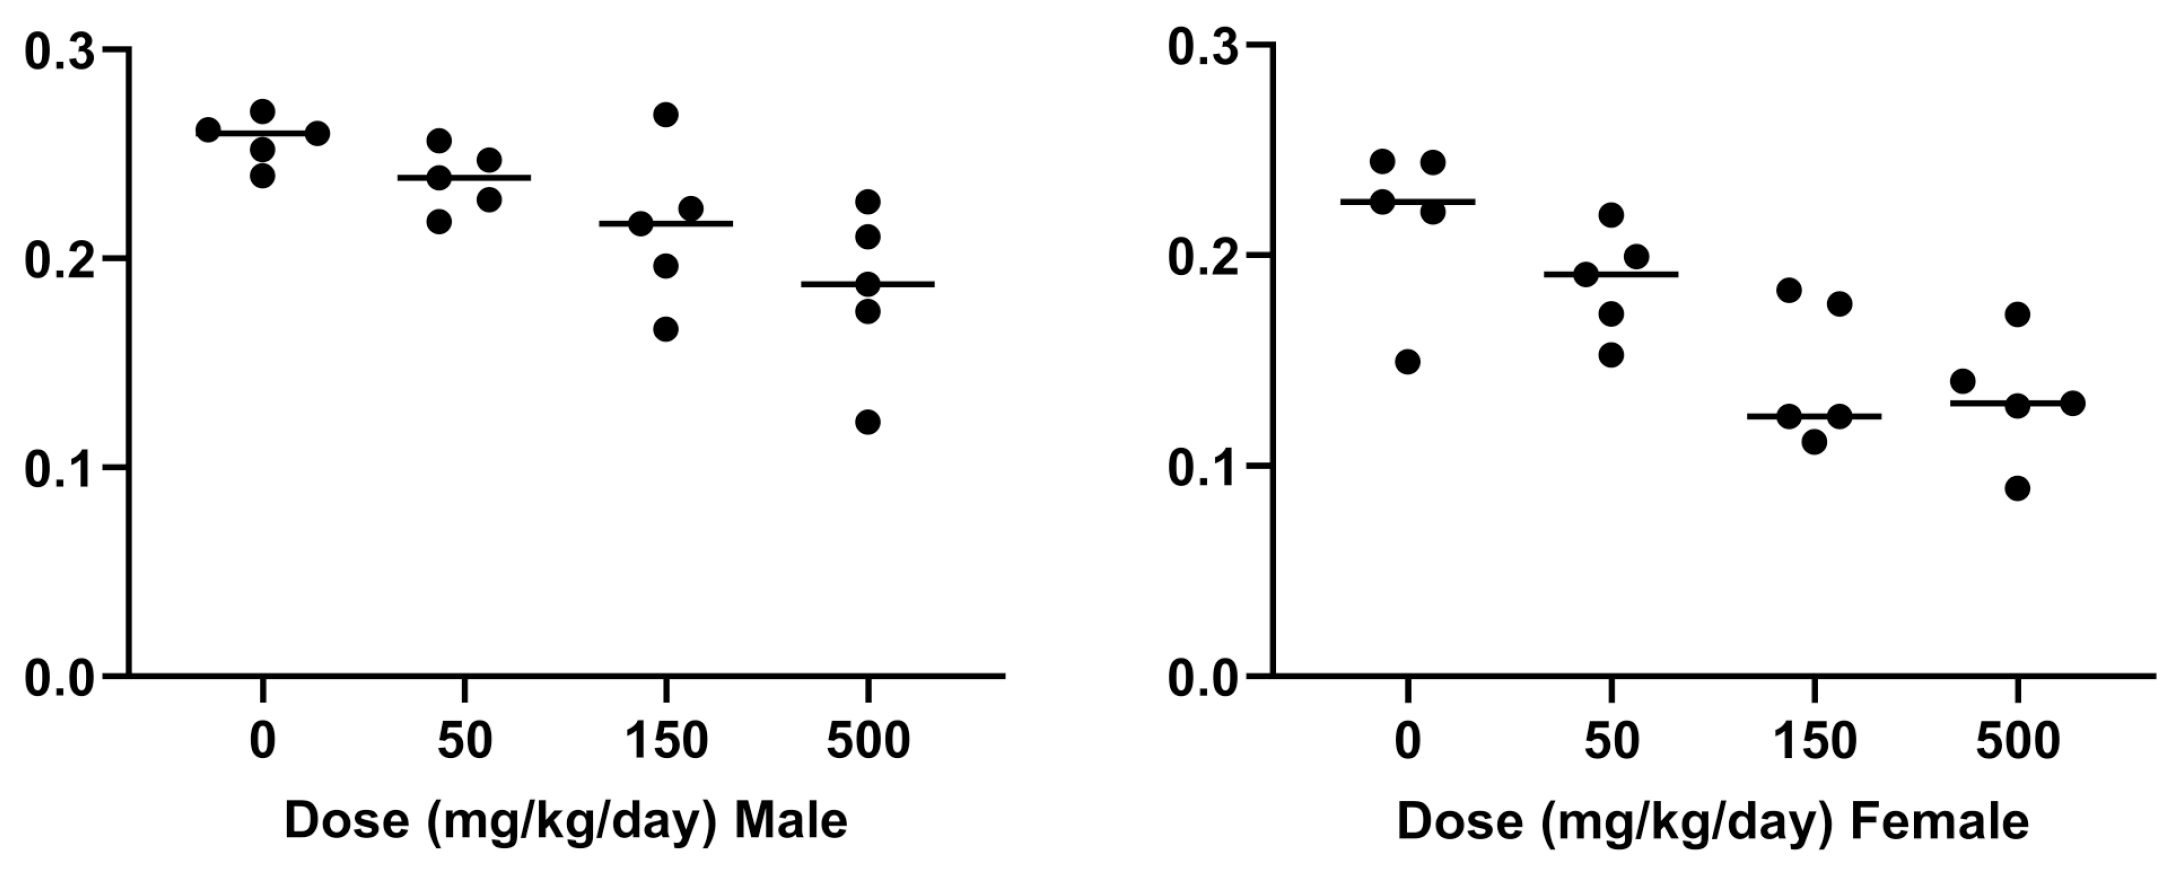
Zymogen quantification in a rat toxicology study. A dose-dependent decrease of zymogen to acinus area ratio was observed in both males and females. Spearman’s rho correlating histopathology score for “decreased zymogen content” with zymogen to acinus ratio was −0.46 (P = .003).
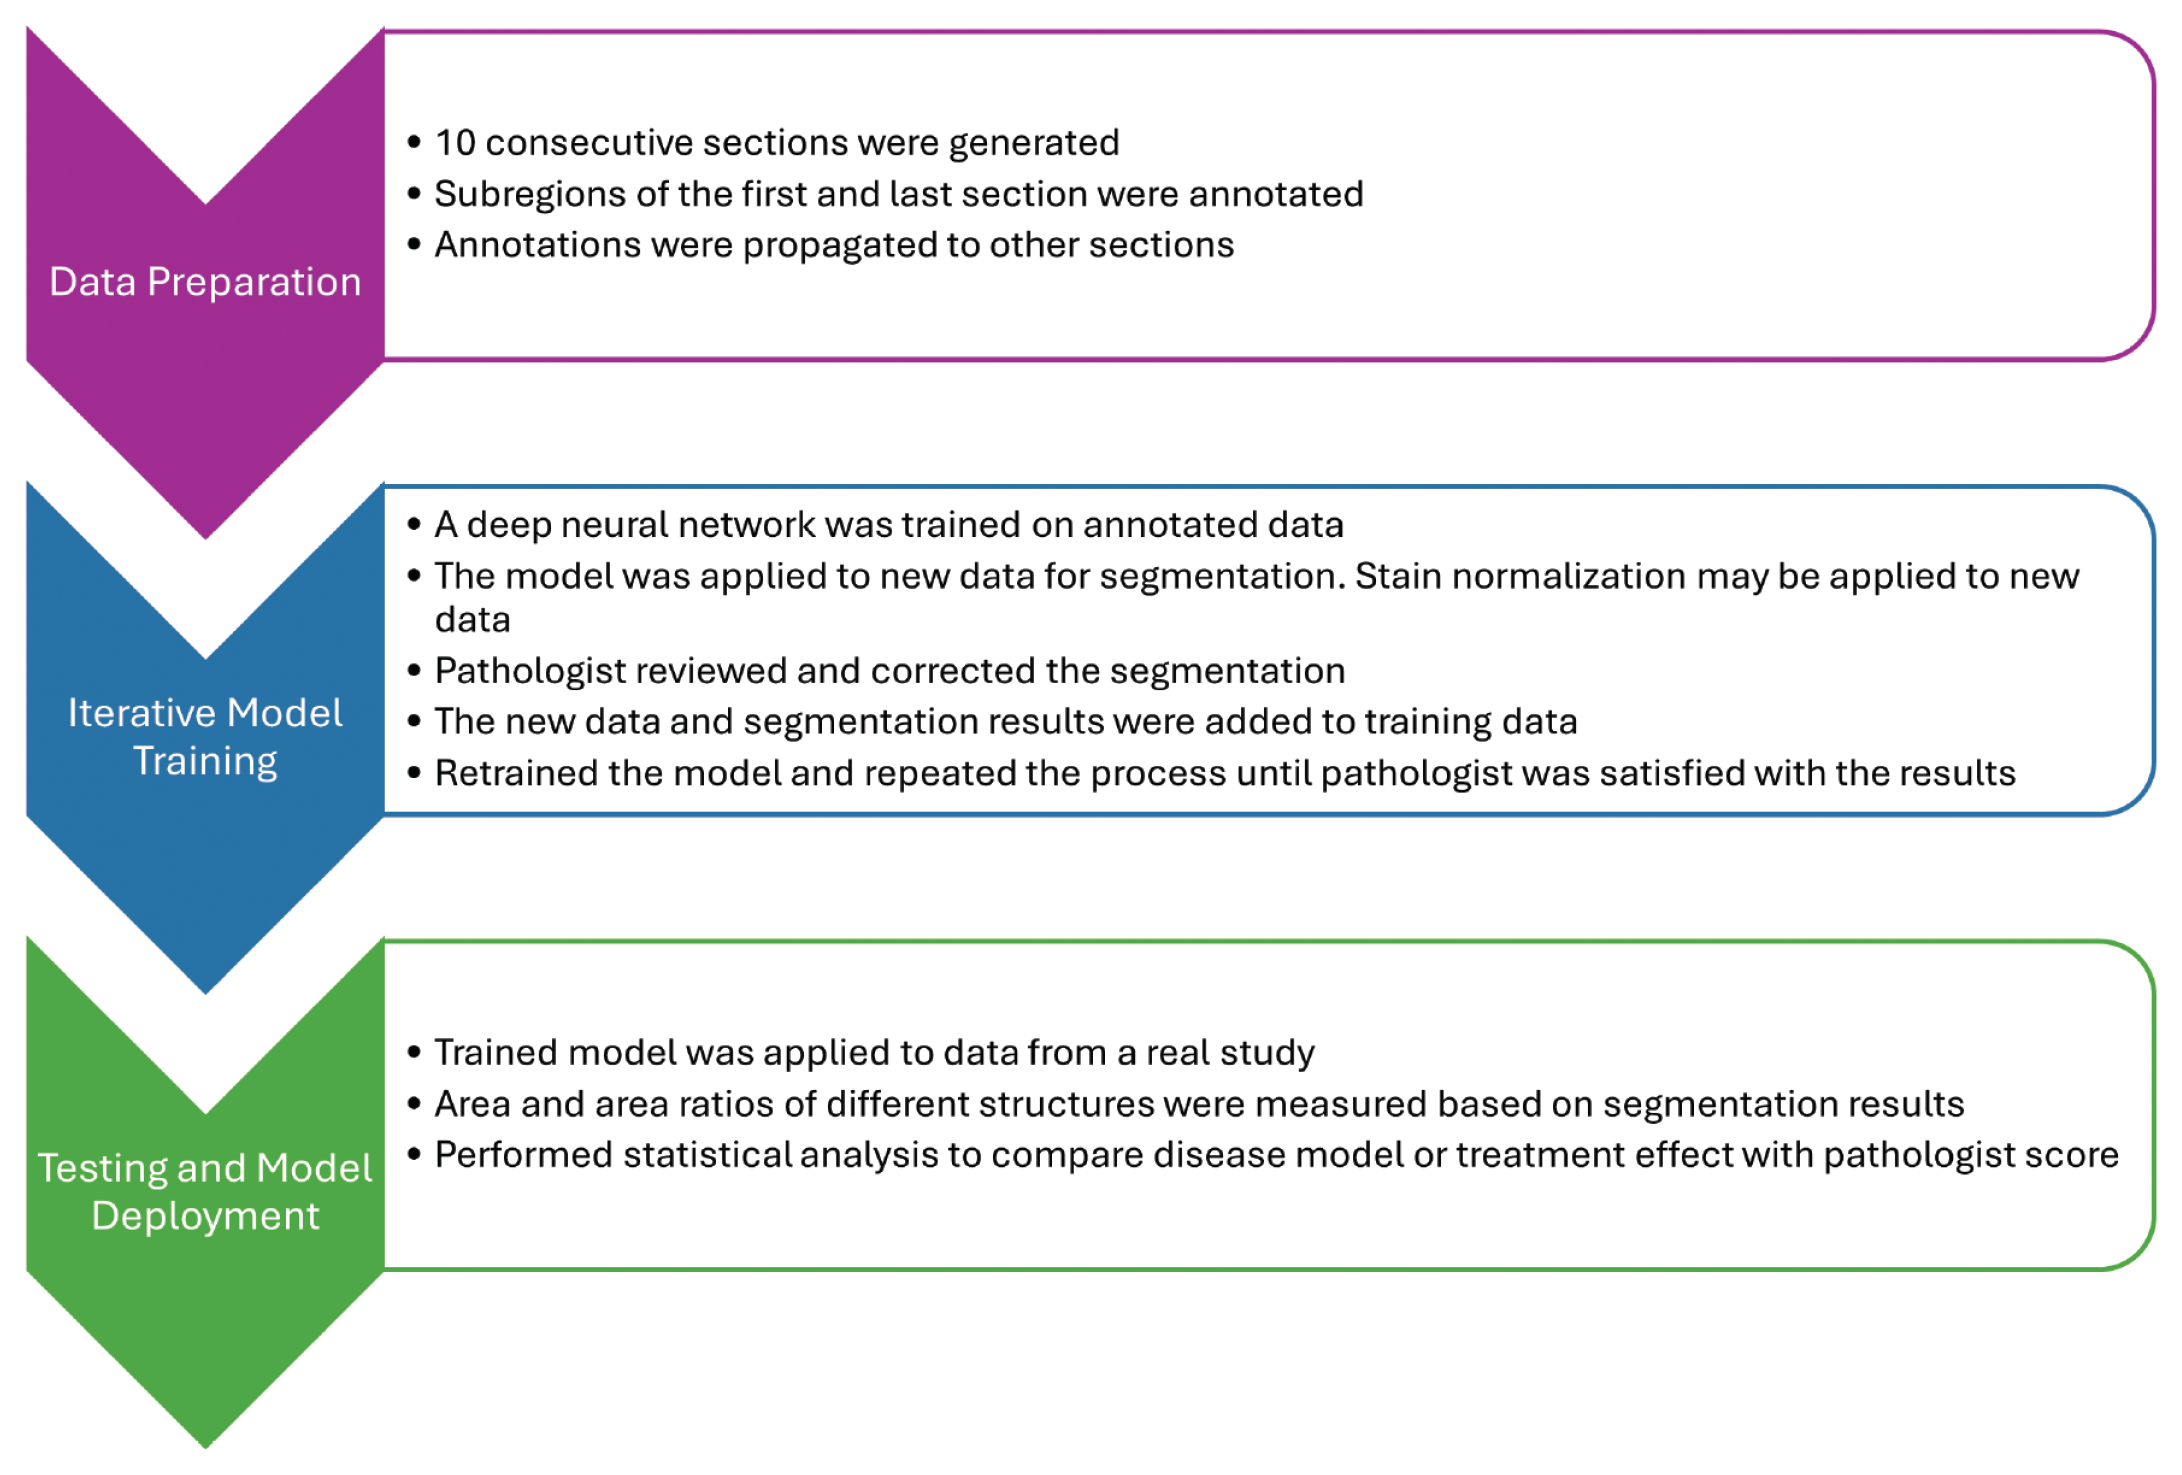
Flow chart describing the methods from data preparation to model deployment onto real studies.
With the deep learning method developed, substructures of the pancreas were segmented using the algorithm and checked for accuracy by an independent pathologist. With the accurate segmentation of normal structures, the area ratio of individual substructures to either the amount of pancreas on the slide (for islet and acinus) or the total amount of exocrine acini (for zymogen granules) was calculated and used to assist pathologists by providing quantitative data to support their interpretations.
The ratio information can provide pathologists with valuable information when there are subtle shifts in the relative presence of normal structures on the slides. While this method worked well to distinguish quantitative variations in the ratios of normal structures, the next challenge is to accurately distinguish normal from abnormal tissue. In addition, further work is needed to separate vascular structures from ducts, particularly in the smaller branches of the vascular or ductular network. These additional enhancements, which may require further exploration of the shape and texture features of substructures in the pancreas, would provide additional utility for quantitative support in evaluation of the pancreas. Many of the computational tools utilized in this effort to overcome challenges of quantification in the pancreas, such as color normalization and substructure evaluation, can be leveraged during the development of new algorithms, and applied to other organs in rats and more broadly to other species.
Footnotes
Acknowledgements
The authors would like to acknowledge the support of Pfizer colleagues in the review of the manuscript and quality control of the results, including Sripad Ram and Lauren Martin.
Declaration of Conflicting Interests
The author(s) declared no potential conflicts of interest with respect to the research, authorship, and/or publication of this article.
Funding
The author(s) received no financial support for the research, authorship, and/or publication of this article.