






Abstract
The impact of non-fasting on clinical pathology parameters in pharmacologic safety assessment has been incompletely characterized. The aim of this study was to characterize changes in hematology, coagulation, and clinical chemistry parameters between healthy fasted and fed rats and macaques. Adult Sprague-Dawley rats (41 males, 40 females) and cynomolgus macaques (10 per sex) were sampled after free access to food and after 8 hours of fasting. Fed rats demonstrated lower reticulocyte and neutrophil counts in males only. Higher alanine aminotransferase, aspartate aminotransferase, and alkaline phosphatase activities and higher glucose, triglyceride, cholesterol, and globulin concentrations were observed with lower urea nitrogen, albumin, and phosphorus concentrations in fed compared with fasted rats of both sexes. Fed macaques of both sexes demonstrated higher triglyceride concentrations and lower phosphorus and total bilirubin concentrations. All changes in fed compared with fasted rats and macaques were considered minor. Non-fasting did not impact coagulation parameters in rats and macaques or hematology parameters in macaques. This study supports that non-fasting has a minimal impact on standard clinical pathology parameters in Sprague-Dawley rats and cynomolgus macaques; however, fasting is still recommended when there are anticipated effects on glucose and lipid metabolism or on endocrine systems related to energy metabolism.
Keywords
Introduction
The fasting of laboratory animals prior to blood sampling has become a common standard for preclinical testing in pharmacologic safety assessment. 45 With benefits including the normalization of clinical chemistry parameters and the prevention of lipemia, this practice has been traditionally thought to be superior to unrestricted food consumption. 34 However, the requirement for fasting and its effects on animal welfare continue to be debated. 12 The utilization of non-fasting necessitates a thorough understanding of its impact on routinely tested clinical pathology parameters, as well as recommendations for when fasting should and should not be considered necessary.
Glucose, triglyceride, and cholesterol concentration changes are the most frequently discussed endpoints in the literature in comparisons of fasted and fed animals, with most reports pertaining to either rodents or humans. However, the reports conflict regarding the degree to which these parameters are impacted by fasting, and the fasting duration after which significant changes are observed. One group of authors described no impact of fasting on serum cholesterol levels in rats despite an effect on rate-limiting enzymes in cholesterol biosynthesis, 38 which agreed with an earlier study demonstrating no changes in serum cholesterol in rats after 8, 16, 25, or 48 hours of food deprivation. 44 However, another report demonstrated a marked suppression of hepatic sterol synthesis in fasted rats after 48 hours, although serum or plasma cholesterol concentration was not measured in this instance. 9 Alternatively, a fourth report described sex differences in cholesterol concentration changes, with decreases seen after 16 hours in fasted female rats but not in males. 19 Reports regarding the impact of fasting on serum triglycerides tend to be more consistent: one report observed a 30% incidence rate of lipemia in non-fasted rat sera, 44 two described decreases in serum fatty acids after 16-hour fasting in rats,38,19 and one showed concurrent measurable transcriptomic effects leading to increased usage of fatty acids. 19 The impact of fasting on glucose has the most fidelity between reports, with multiple authors describing decreases of varying severities based on length of fasting in rats.19,35,44
Other changes in clinical pathology parameters are less commonly discussed in the literature and consist of limited and occasionally conflicting reports on the impact of fasting in rodents on proteins and serum enzyme activities.3,19,20,38,39 Reports on the impact of short-term fasting on erythrocyte and leukocyte parameters are even fewer, and most evaluate changes at or after 24 hours of fasting in humans.5,30,37 Variably comprehensive reports of the effects of fasting on complete blood count parameters after 16 hours of fasting in rats have been published but describe conflicting results.19,38
In addition to the presence of conflicting reports with varied fasting timeframes, complete discussions of the potential mechanisms underlying the observed changes beyond those pertaining to lipids and glucose are overall lacking. When mechanistic discussions are included, the implications of these changes in the context of data interpretation are generally not addressed. Furthermore, consistent and complete descriptions of changes in complete blood count and serum chemistry are markedly limited. 47 There is also an overall paucity of data available for changes in plasma chemistry parameters, which are used exclusively by many laboratories, while most reports are focused on serum. Consequently, the aim of this article is to further characterize the observed changes in hematology, coagulation, and both serum and plasma clinical chemistry parameters between healthy fasted and fed rats and cynomolgus macaques.
Materials and Methods
Forty-one male and forty nulliparous female naïve purpose-bred Sprague-Dawley rats (21 fed males, 20 fasted males, and 20 per group for fasted and fed females) from an in-house colony (Charles River Laboratories, Inc., Reno, Nevada) were used in this study with an age range of 24 to 32 weeks. Animals were randomly assigned to the fed and fasted groups. A sample size of ≥20 was chosen for statistical power to detect small changes and was also dependent on the population of available colony animals. Animals were housed in pairs in polycarbonate cages under controlled environmental conditions with a light/dark cycle of 12/12 hours and fed, when non-fasted, a commercial diet (PMI Nutrition International Certified Rodent Chow No. 5CR4). For fasted samples, food was removed for at least 8 hours and no more than 18 hours in accordance with common fasting practices at contract research organizations, and rats were placed in separate metabolism caging with unrestricted water access provided via an automated water system. Samples from both groups were collected in the early afternoon from the caudal vena cava at necropsy following isoflurane anesthesia.
Ten male and 10 nulliparous female purpose-bred adult macaques (Macaca fascicularis) from an in-house colony (Charles River Laboratories, Inc.) of Chinese origin were utilized in this study with an age range of 6 to 13 years. Sample size was dependent on the population of available colony animals. The study was conducted over two days, with animals divided into 5/sex/group for fasted and fed groups on the first day. The groups were then reversed on the second day in a two-period crossover design. This design reduces the influence of confounding covariates because each crossover subject serves as their own control and requires fewer subjects as a result of the statistical efficiency. 17 Animals were randomly assigned to each group. Macaques were socially housed when fasted for a duration of approximately 8 hours (and no more than 18 hours) with unrestricted water access provided via an automated water system. For non-fasted samples, animals were housed individually, fed a morning food ration to ensure equal food access to a commercial primate diet (PMI Nutrition International, Inc., Richmond, Indiana), and blood samples were taken approximately 4 hours after feeding. Samples were collected from the femoral vein while macaques were restrained in their cages. Environmental conditions were controlled throughout the housing facility to maintain temperature between 17°C and 29°C, humidity between 30% and 70%, and fluorescent lighting was provided via an automatic timer for approximately 12 hours per day.
Whole blood samples were collected into potassium-ethylenediaminetetraacetic acid (EDTA) anticoagulated tubes and assessed using an ADVIA 2120 hematology analyzer (Siemens Healthcare Diagnostics) within 24 hours of collection. The following parameters were evaluated: total white blood cell count, absolute neutrophil, lymphocyte, monocyte, eosinophil, basophil, and large unstained cell (LUC) counts, red blood cell (RBC) count, hemoglobin concentration, hematocrit, absolute reticulocyte count, mean corpuscular hemoglobin (MCH), mean corpuscular hemoglobin concentration (MCHC), mean corpuscular volume (MCV), red blood cell distribution width (RDW), and platelet count. Blood smears from rats and macaques were evaluated for platelet clumps and resulted in the exclusion of the automated platelet counts of one male rat from the fasted tabulations and 2 female rats from the fed tabulations. One sample from a fed male rat was clotted upon receipt by the laboratory and was consequently not processed.
For clinical chemistry, whole blood samples were collected into serum separator tubes, allowed to clot at room temperature for least 30 minutes, and centrifuged for 10 to 15 minutes between 1500 and 2200 RCF at 2°C to 8°C. Serum was assessed using a COBAS 6000 clinical chemistry analyzer (Roche Diagnostics, Mannheim, Germany). Heparinized plasma samples from each animal were concurrently assessed with the same analyzer. Parameters assessed included the following: aspartate aminotransferase (AST), alanine aminotransferase (ALT), alkaline phosphatase (ALP), gamma-glutamyltransferase (GGT), and creatine kinase (CK) activities, total bilirubin, urea nitrogen, creatinine, glucose, total cholesterol, triglycerides, total protein, albumin, globulin, total calcium, phosphorus, sodium, potassium, and chloride concentrations and albumin/globulin ratio. Lipemia was graded visually by trained medical technicians using the following criteria: 1+ (mild; cloudy), 2+ (moderate; turbid), and 3+ (marked; opaque). Likewise, hemolysis was measured visually using the following criteria: 1+ (mild; pale/light red), 2+ (moderate (red), and 3+ (marked; dark red). Plasma from one fasted male rat and serum from one fed male rat were not analyzed due to insufficient sample volumes.
Blood was also collected into sodium citrate anticoagulated tubes and assessed using a STA Compact MAX coagulation analyzer (Stago, Asnières sur Seine, France) using Stago reagents. Evaluated parameters included activated partial thromboplastin time, prothrombin time, and fibrinogen concentration. Samples from one fasted male rat, one fed male rat, and one fed female rat were excluded from analysis due to clotting. Hematology, coagulation, and clinical chemistry results were recorded in a computerized database (Provantis 10, Instem, Philadelphia, Pennsylvania).
All study procedures were conducted in accordance with protocols that were in compliance with applicable animal welfare regulations and were approved by the Institutional Animal Care and Use Committee. Charles River Laboratories, Nevada, is accredited by the Association for Assessment and Accreditation of Laboratory Animal Care.
Data were summarized using descriptive statistics. Means, standard deviations, and percent coefficients of variation (%CV) were calculated for all parameters. Fold changes are presented for fed animals and were calculated using values from fasted animals as the reference. A two one-sided 90% equivalence interval on the ratio of geometric means was calculated for each fold change estimate. 41 Equivalence boundaries of 0.6667 and 1.5(= 1/0.6667) were chosen to cover a range of endpoints generally considered to be within normal variation.
Results
Rats
In fed rats, 4 of 40 (10%, 3 males and 1 female) had lipemic serum samples (1+ to 2+) and 10 of 40 (25%, 7 males and 3 females) had lipemic plasma samples (1+ to 3+). Generally, higher lipemic index grades correlated with higher triglyceride concentrations in those individual animals. The fasted rats did not have any lipemic samples regardless of matrix (Table 1).
Incidence of lipemia in Sprague Dawley rats.
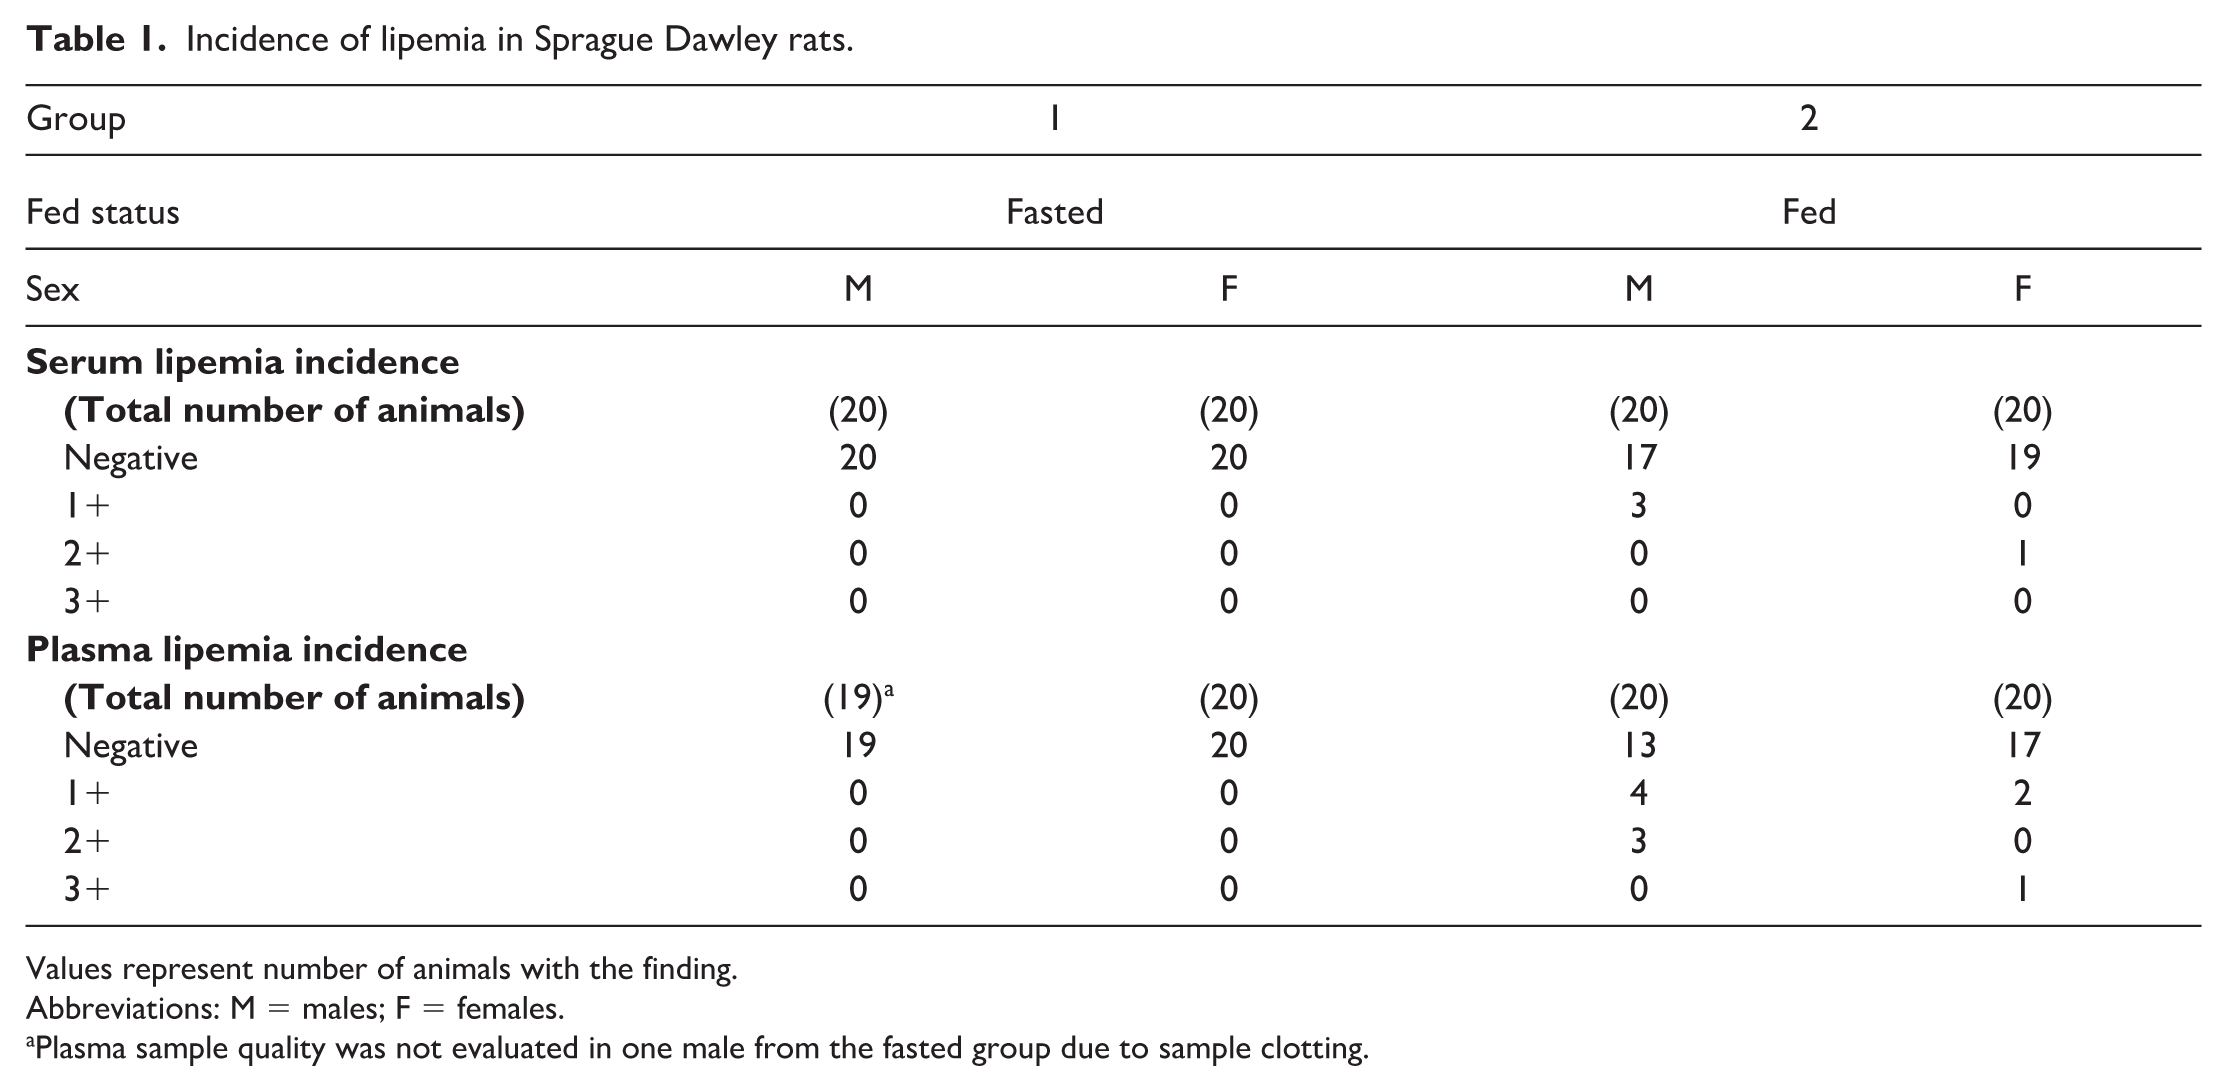
Values represent number of animals with the finding.
Abbreviations: M = males; F = females.
Plasma sample quality was not evaluated in one male from the fasted group due to sample clotting.
When fed, 6 of 40 (15%, 3 males and 3 females) rats had hemolyzed serum samples (1+ to 2+) and 3 of 40 (7.5%, 2 males and 1 female) had hemolyzed plasma samples (1+). Fasted rats only had an incidence of 1 of 40 (2.5%, 1 male) hemolyzed serum samples (1+), and no hemolyzed plasma samples (Table 2).
Incidence of hemolysis in Sprague Dawley rats.
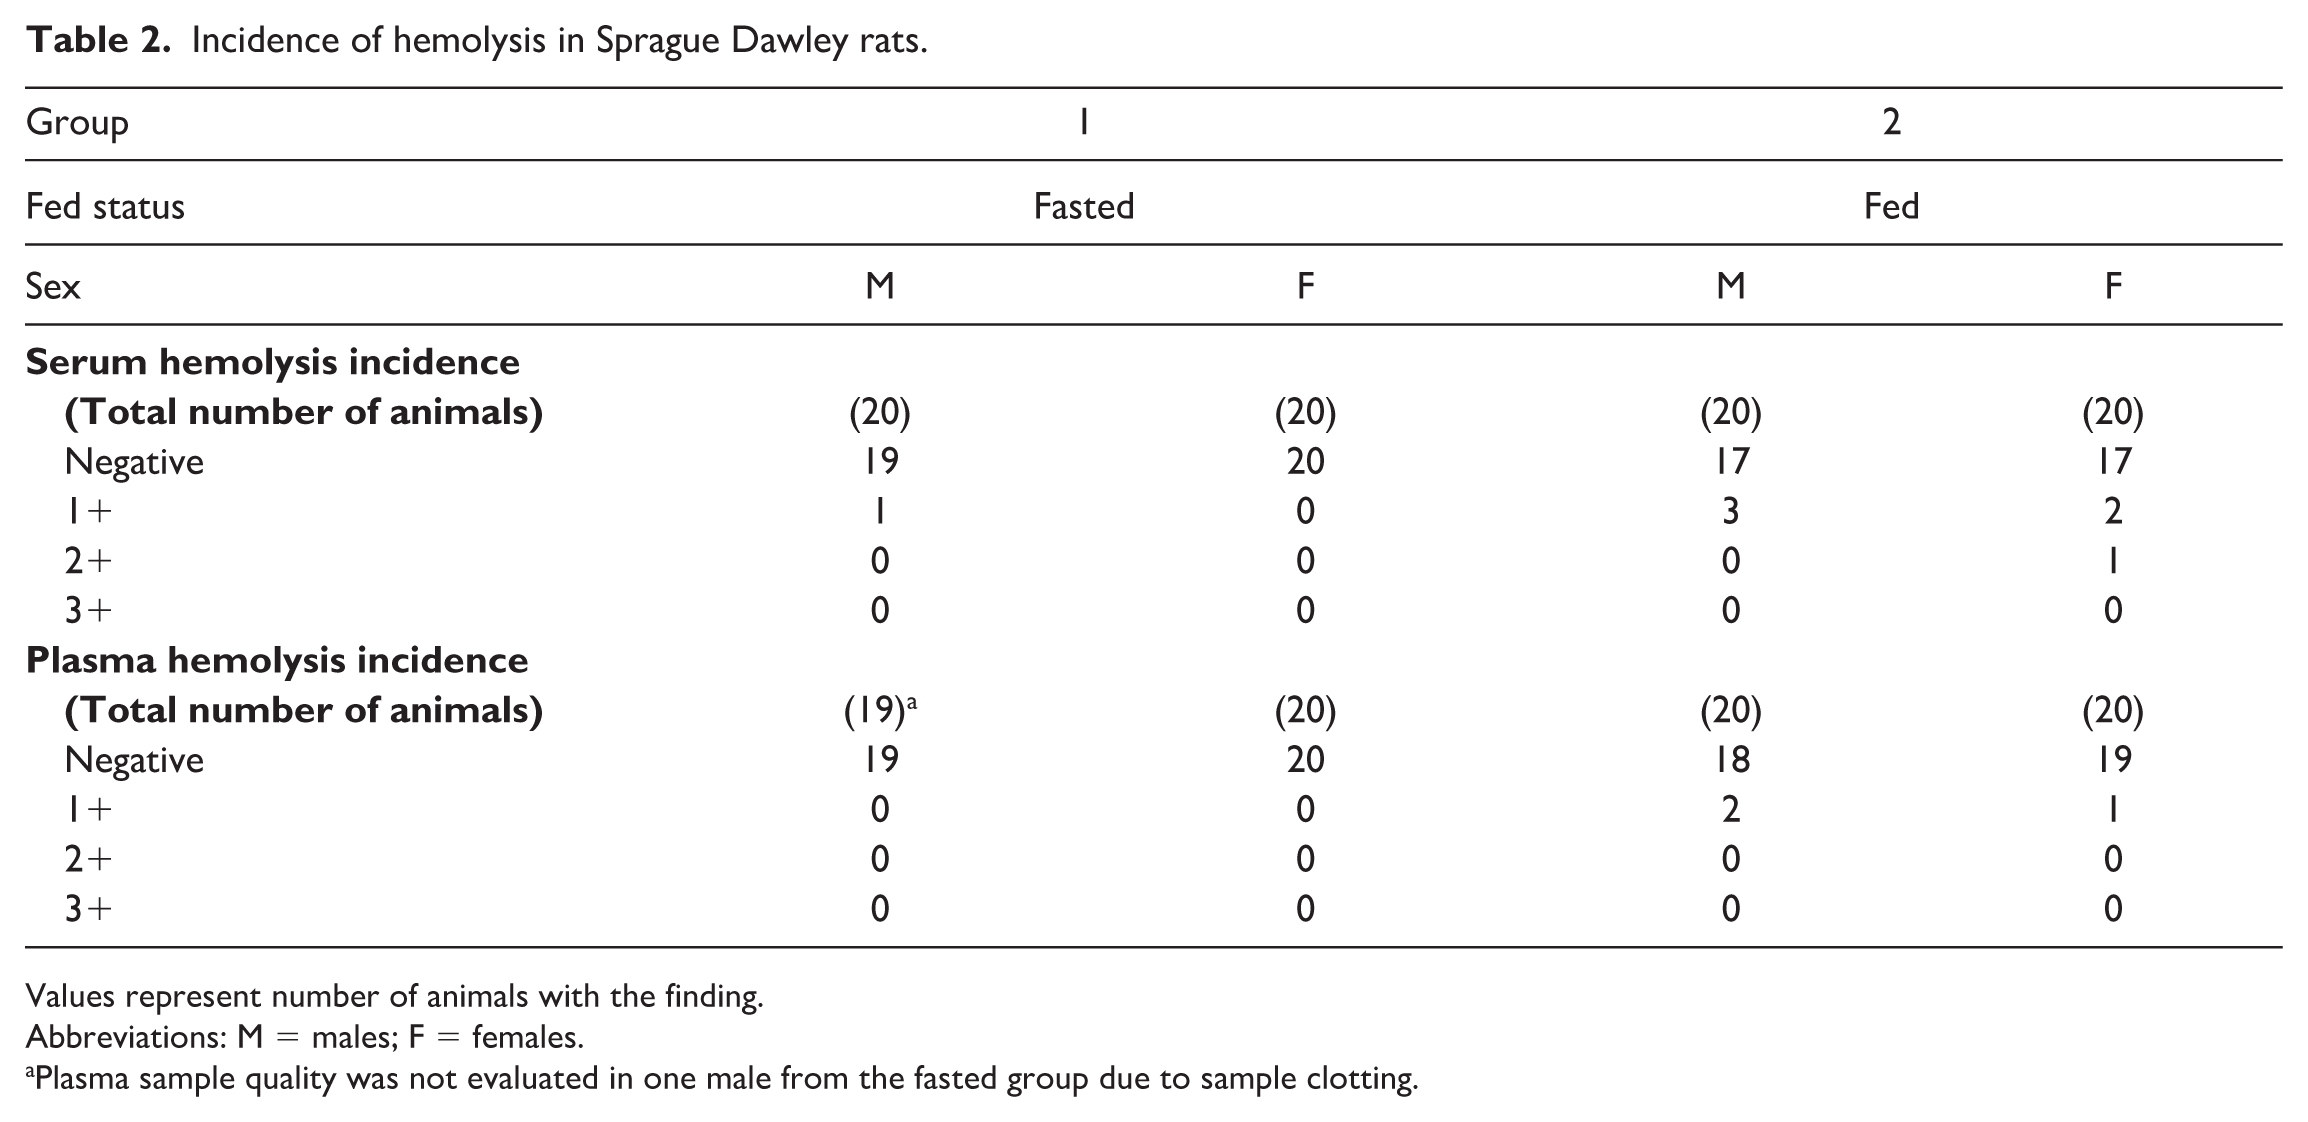
Values represent number of animals with the finding.
Abbreviations: M = males; F = females.
Plasma sample quality was not evaluated in one male from the fasted group due to sample clotting.
Noteworthy hematologic changes in fed rats were minor and consisted of lower neutrophil (0.61×) and reticulocyte (0.89×) counts in males only (Tables 3 and 4). Noteworthy serum (Tables 5 and 6) and/or plasma (Tables 7 and 8) chemistry changes in fed males and females consisted of higher glucose (serum: 1.19× and 1.09×; plasma: 1.19× and 1.08×, males and females, respectively), triglyceride (serum: 2.42× and 2.55×; plasma: 2.35× and 2.42×), cholesterol (serum: 1.17× and 1.14×; plasma: 1.15× and 1.11×), and globulin (serum: 1.10× and 1.17×; no changes noted in plasma) concentrations, and ALT (serum: 1.80× and 1.24×; plasma: 1.57× and 1.18×), AST (serum: 1.26× and 1.14×; plasma: 1.14× and 1.15×), and ALP (serum: 1.56× and 2.46×; plasma: 1.53× and 2.38×) activities with lower phosphorus (serum: 0.93× and 0.90×; plasma: 0.89× and 0.85×), albumin (serum: 0.95× and 0.96×; plasma: 0.94× and 0.95×), and urea nitrogen (serum: 0.91× and 0.88×; plasma: 0.87× and 0.83×) concentrations. For many of these clinical chemistry parameters (glucose, triglyceride, cholesterol, ALP, and albumin in both sexes, ALT and AST in males, and globulin and urea nitrogen in females), the standard deviation was higher in the fed group. The %CV was notably higher in the fed group for ALP and albumin in both sexes; glucose, ALT, AST (plasma only) in males; and triglyceride, globulin, and urea nitrogen in females, supporting that non-fasting increases variability in these parameters. However, the fold change between fed and fasted groups was notably above the %CV of the fasted group only for triglyceride and ALP in both sexes and AST in males, indicating that these changes in the fed group are greater than what would be expected with biological variation alone. Fasting status had no impact on coagulation parameters in rats (Online Supplemental Table 1).
Effects of non-fasting on hematology parameters in Sprague Dawley rats: WBC count-hematocrit.
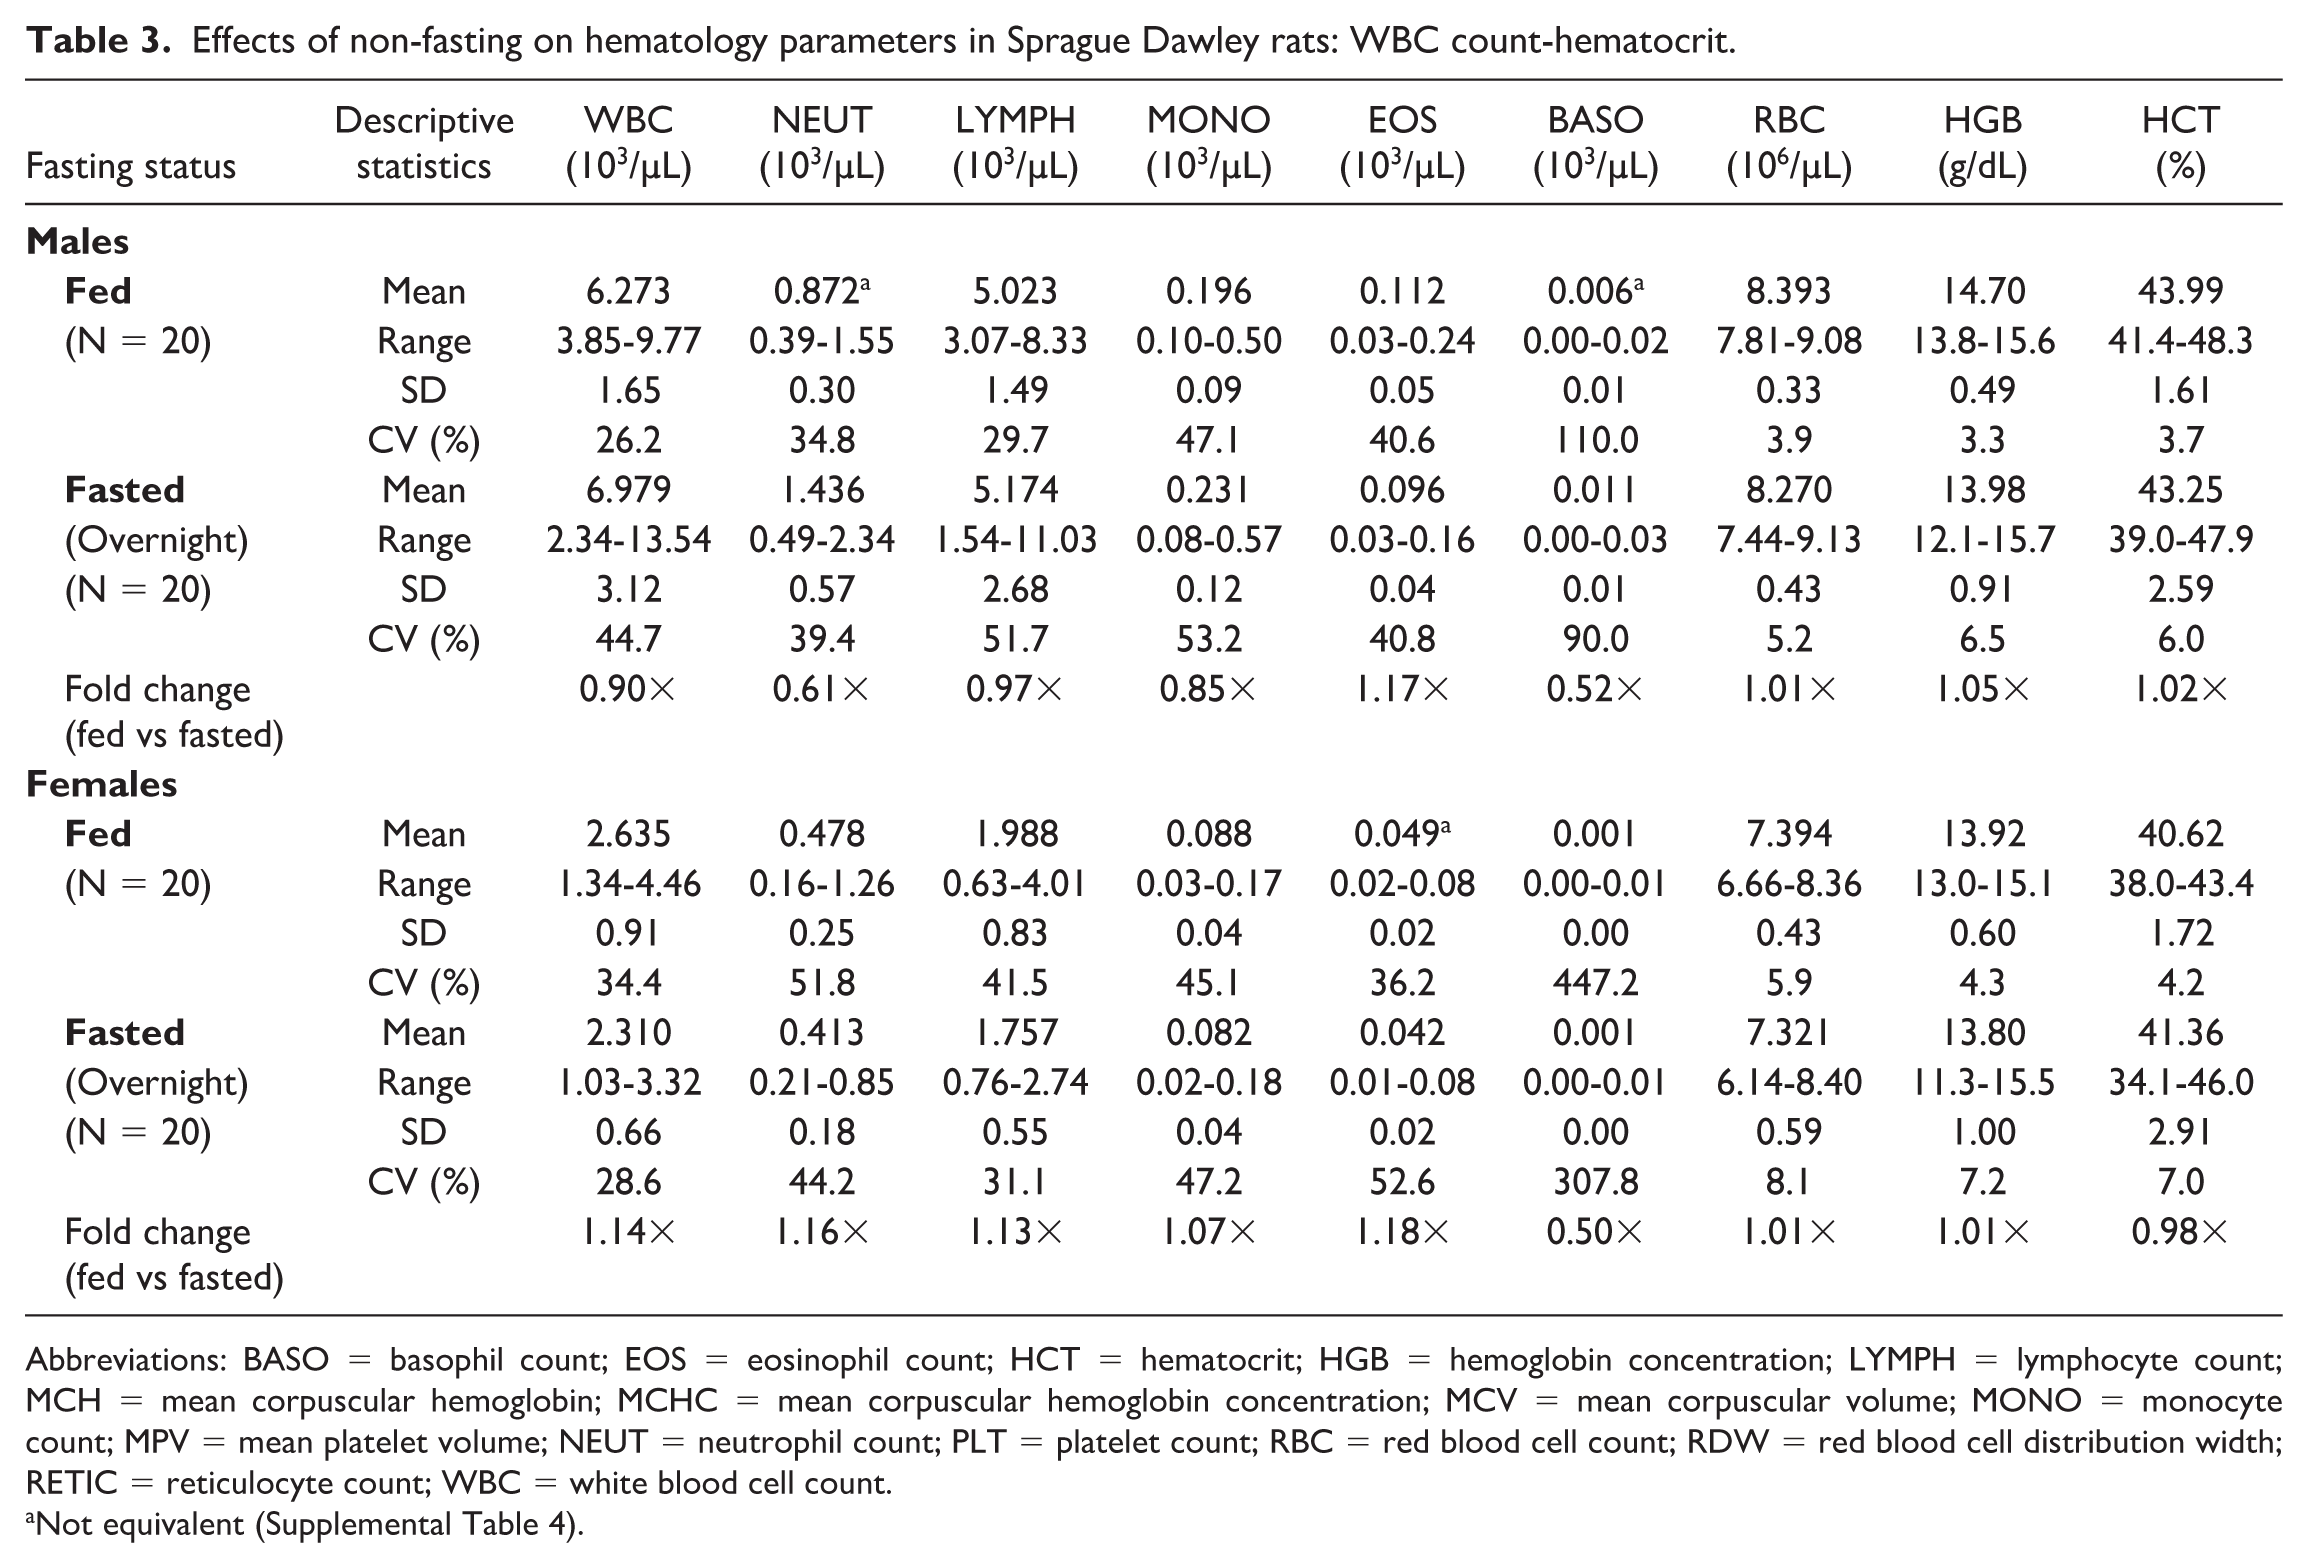
Abbreviations: BASO = basophil count; EOS = eosinophil count; HCT = hematocrit; HGB = hemoglobin concentration; LYMPH = lymphocyte count; MCH = mean corpuscular hemoglobin; MCHC = mean corpuscular hemoglobin concentration; MCV = mean corpuscular volume; MONO = monocyte count; MPV = mean platelet volume; NEUT = neutrophil count; PLT = platelet count; RBC = red blood cell count; RDW = red blood cell distribution width; RETIC = reticulocyte count; WBC = white blood cell count.
Not equivalent (Supplemental Table 4).
Effects of non-fasting on hematology parameters in Sprague Dawley rats: MCV-reticulocytes.
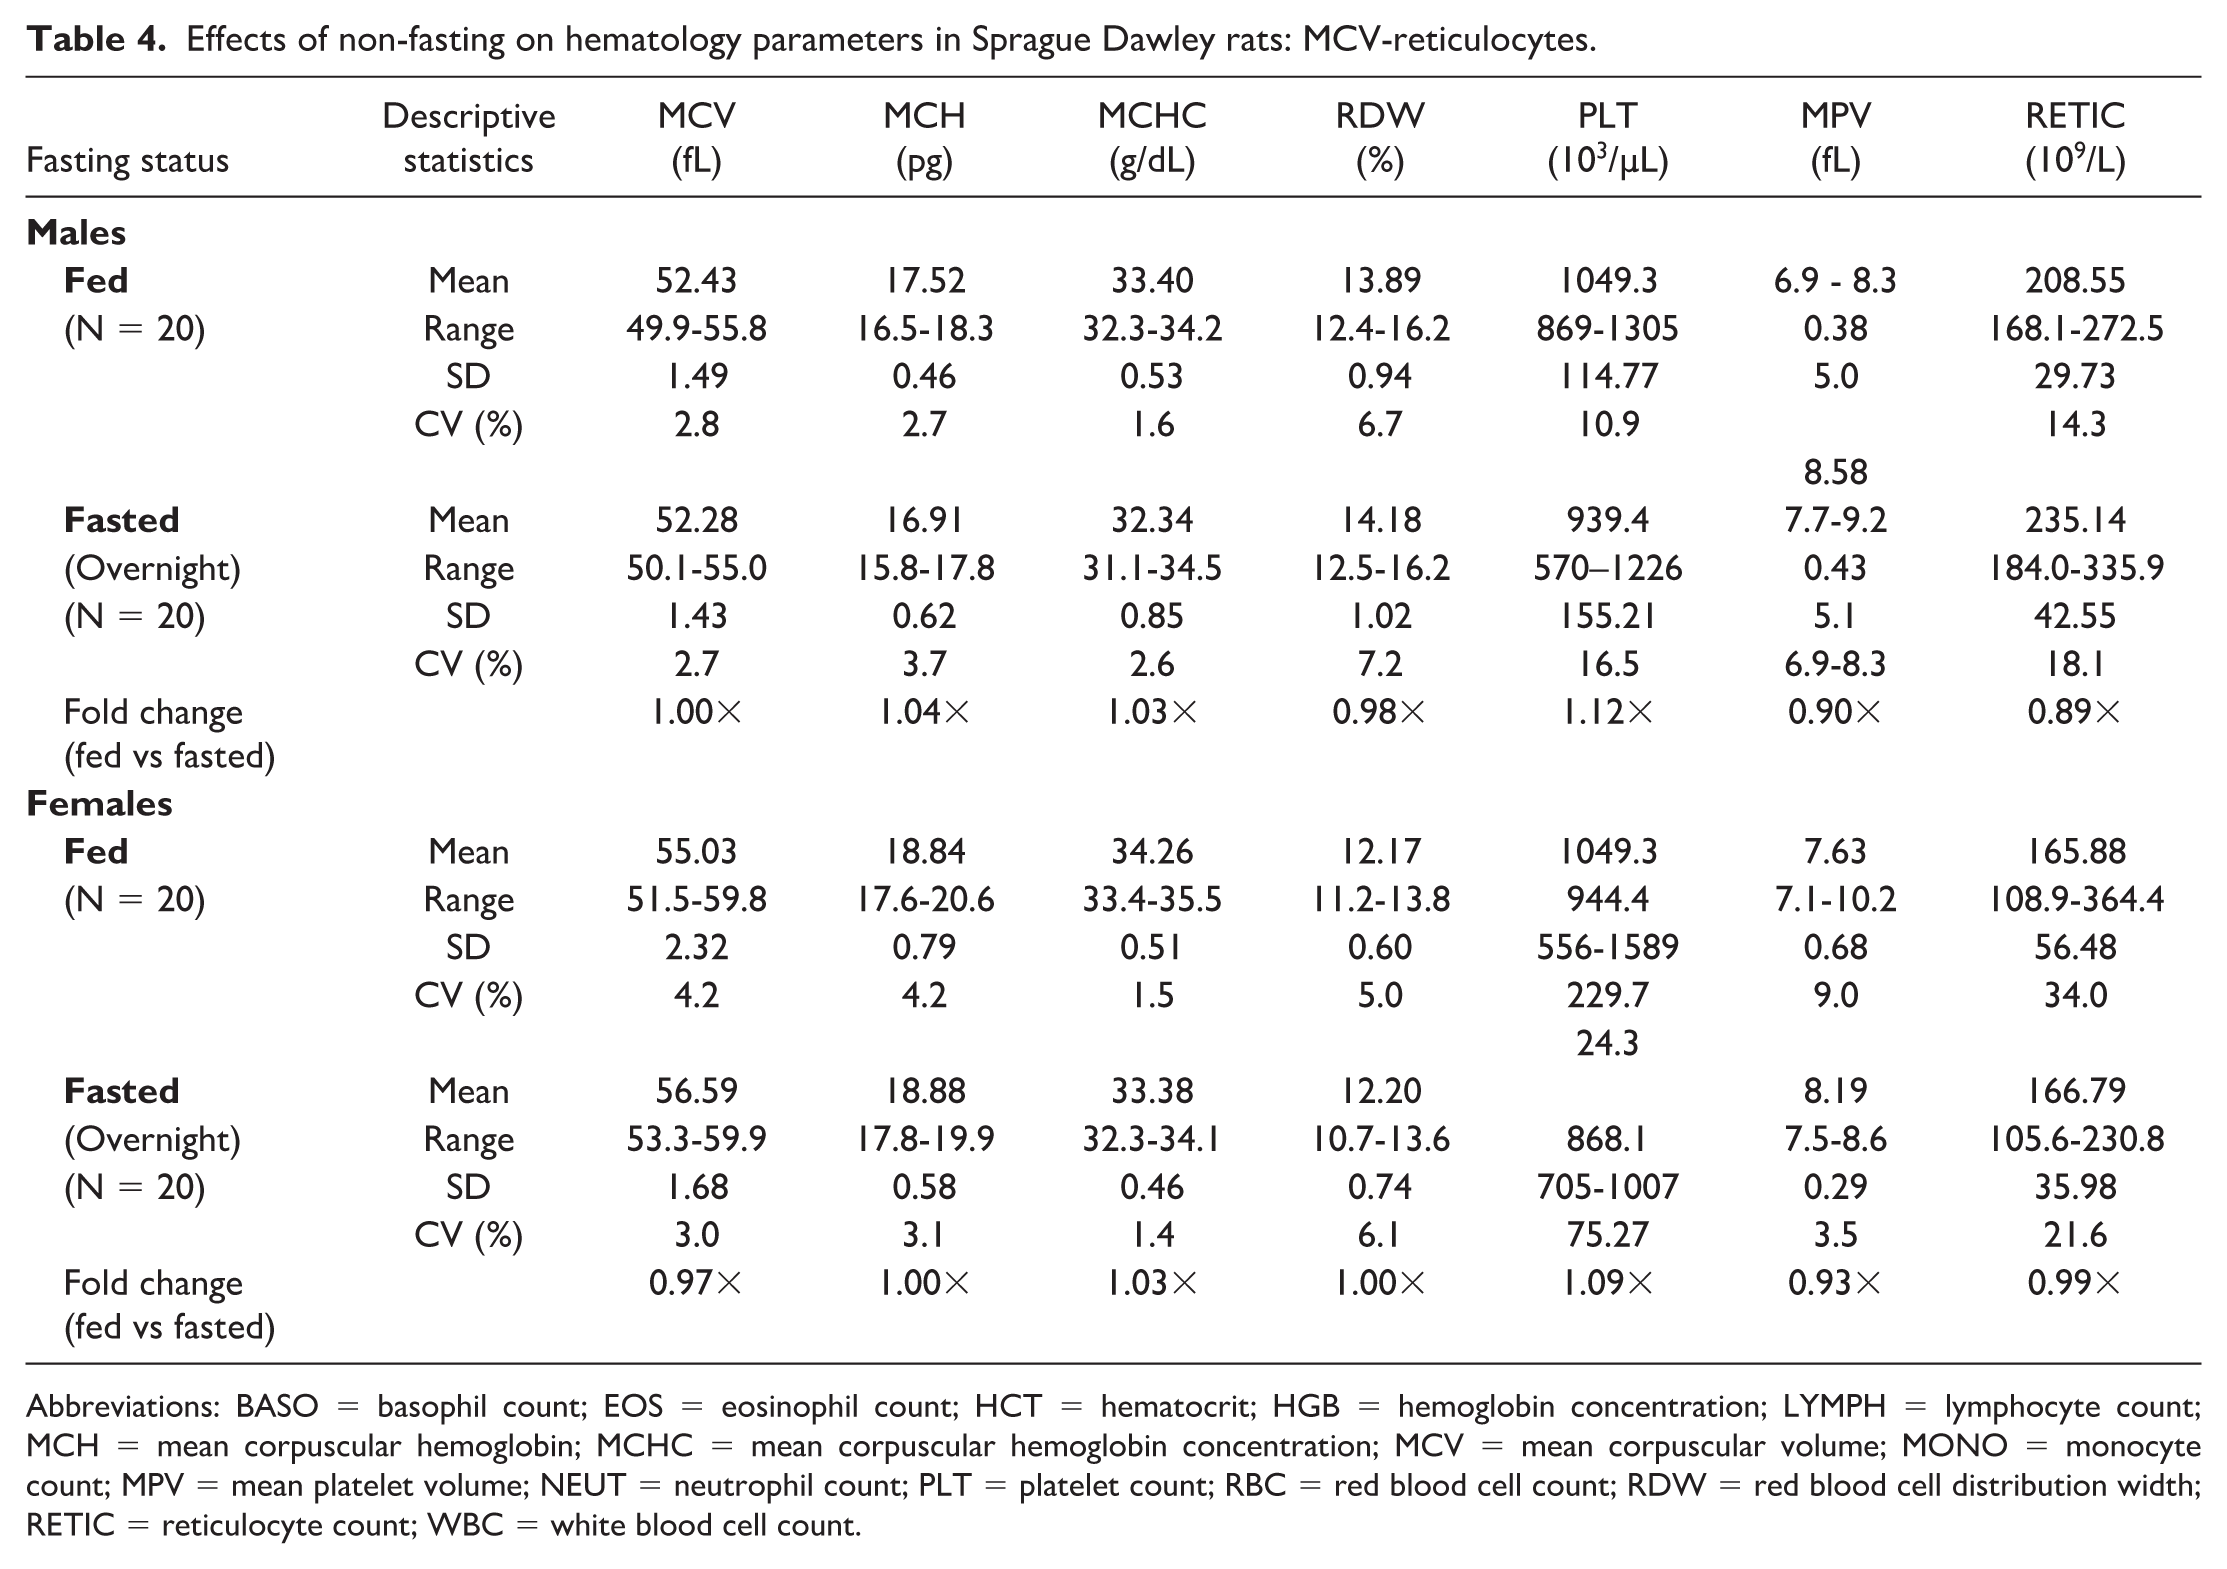
Abbreviations: BASO = basophil count; EOS = eosinophil count; HCT = hematocrit; HGB = hemoglobin concentration; LYMPH = lymphocyte count; MCH = mean corpuscular hemoglobin; MCHC = mean corpuscular hemoglobin concentration; MCV = mean corpuscular volume; MONO = monocyte count; MPV = mean platelet volume; NEUT = neutrophil count; PLT = platelet count; RBC = red blood cell count; RDW = red blood cell distribution width; RETIC = reticulocyte count; WBC = white blood cell count.
Effects of non-fasting on serum chemistry parameters in Sprague Dawley rats: AST-cholesterol.
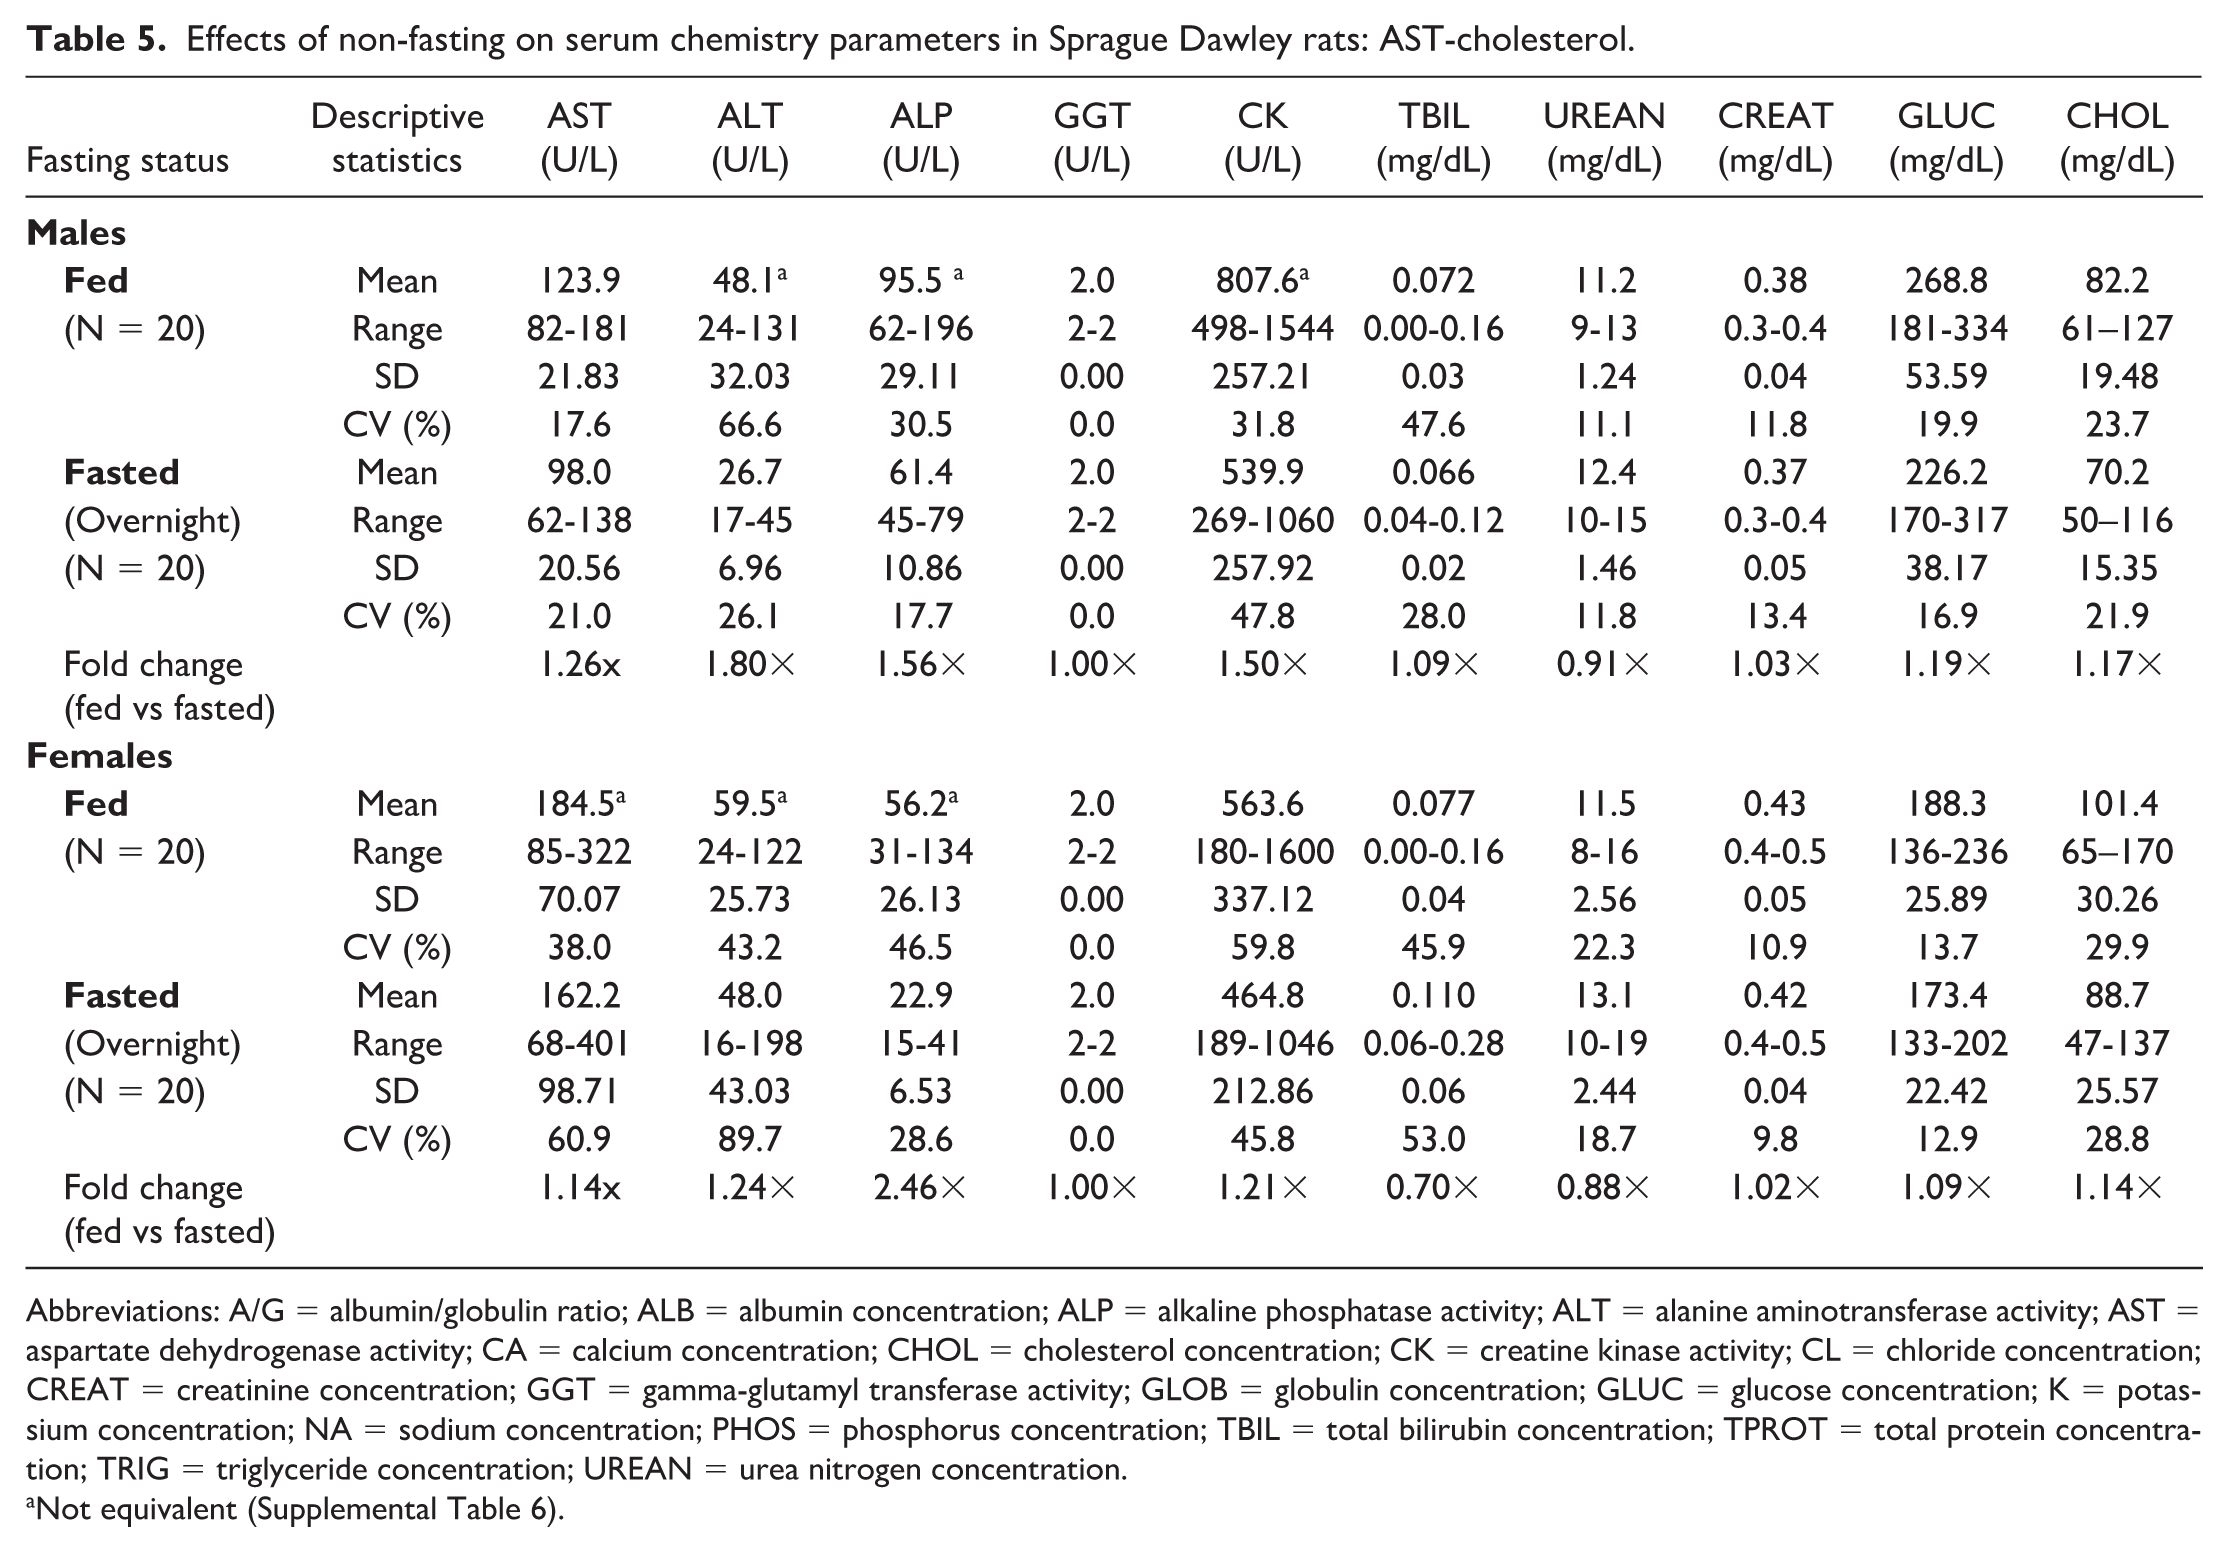
Abbreviations: A/G = albumin/globulin ratio; ALB = albumin concentration; ALP = alkaline phosphatase activity; ALT = alanine aminotransferase activity; AST = aspartate dehydrogenase activity; CA = calcium concentration; CHOL = cholesterol concentration; CK = creatine kinase activity; CL = chloride concentration; CREAT = creatinine concentration; GGT = gamma-glutamyl transferase activity; GLOB = globulin concentration; GLUC = glucose concentration; K = potassium concentration; NA = sodium concentration; PHOS = phosphorus concentration; TBIL = total bilirubin concentration; TPROT = total protein concentration; TRIG = triglyceride concentration; UREAN = urea nitrogen concentration.
Not equivalent (Supplemental Table 6).
Effects of non-fasting on serum chemistry parameters in Sprague Dawley rats: triglyceride-chloride.
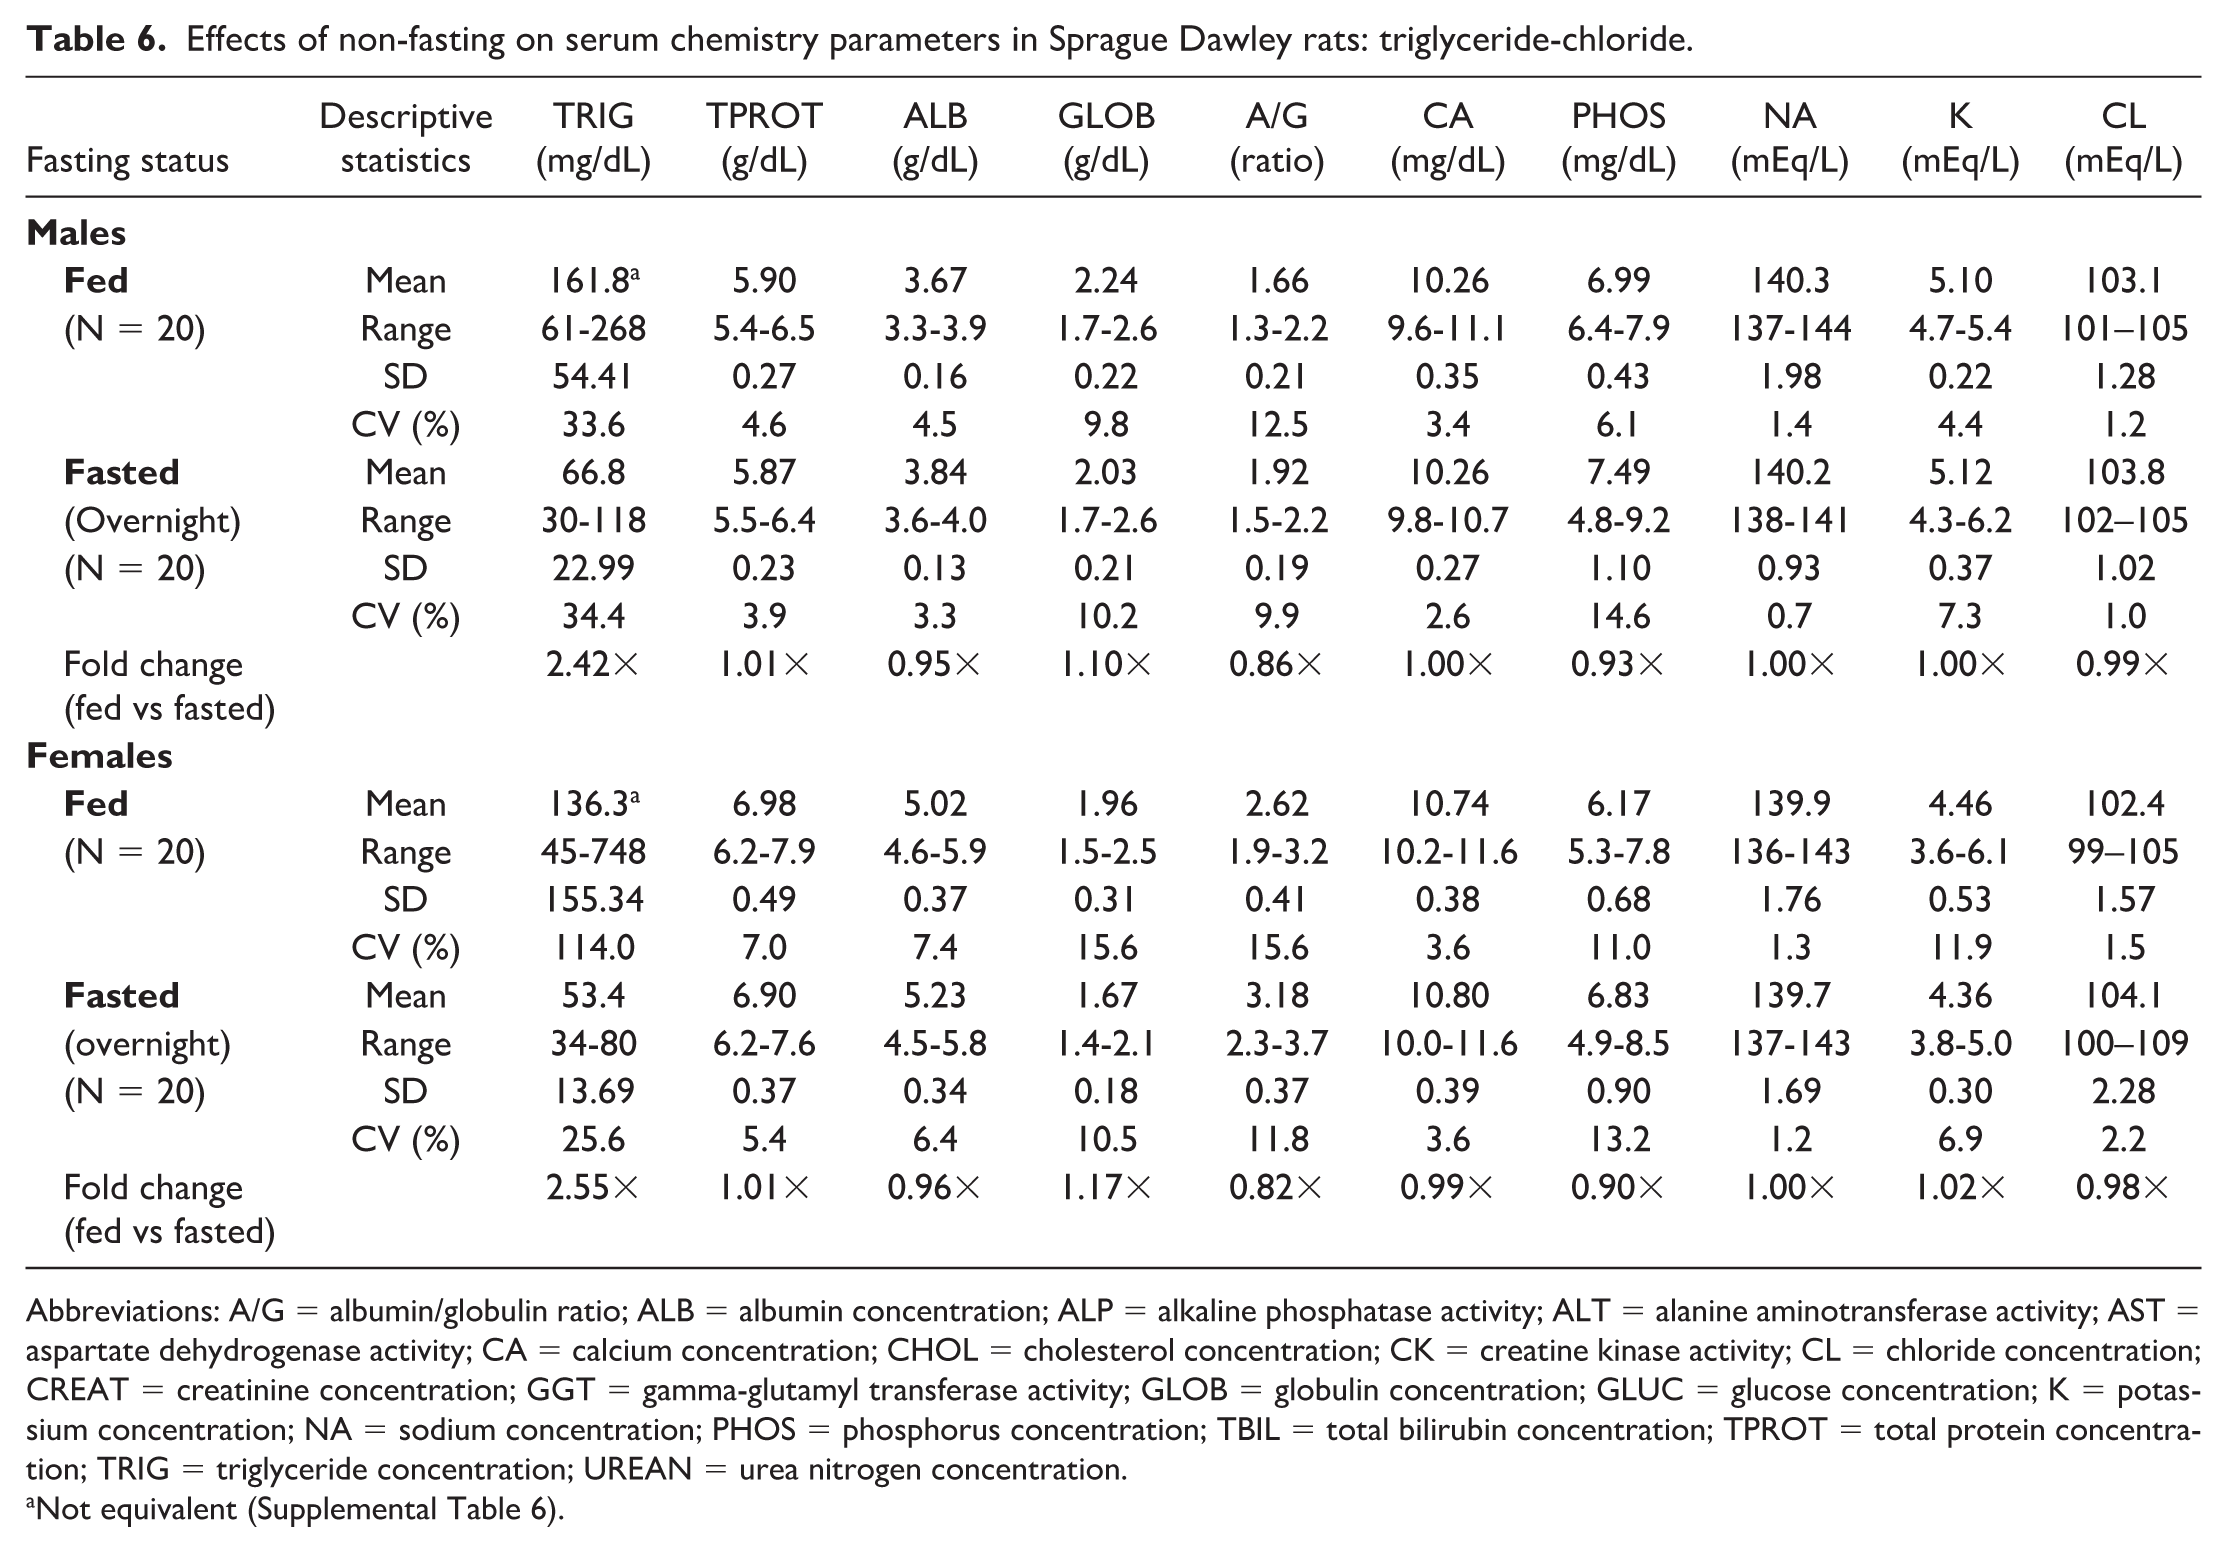
Abbreviations: A/G = albumin/globulin ratio; ALB = albumin concentration; ALP = alkaline phosphatase activity; ALT = alanine aminotransferase activity; AST = aspartate dehydrogenase activity; CA = calcium concentration; CHOL = cholesterol concentration; CK = creatine kinase activity; CL = chloride concentration; CREAT = creatinine concentration; GGT = gamma-glutamyl transferase activity; GLOB = globulin concentration; GLUC = glucose concentration; K = potassium concentration; NA = sodium concentration; PHOS = phosphorus concentration; TBIL = total bilirubin concentration; TPROT = total protein concentration; TRIG = triglyceride concentration; UREAN = urea nitrogen concentration.
Not equivalent (Supplemental Table 6).
Effects of non-fasting on plasma chemistry parameters in Sprague Dawley rats: AST-cholesterol.
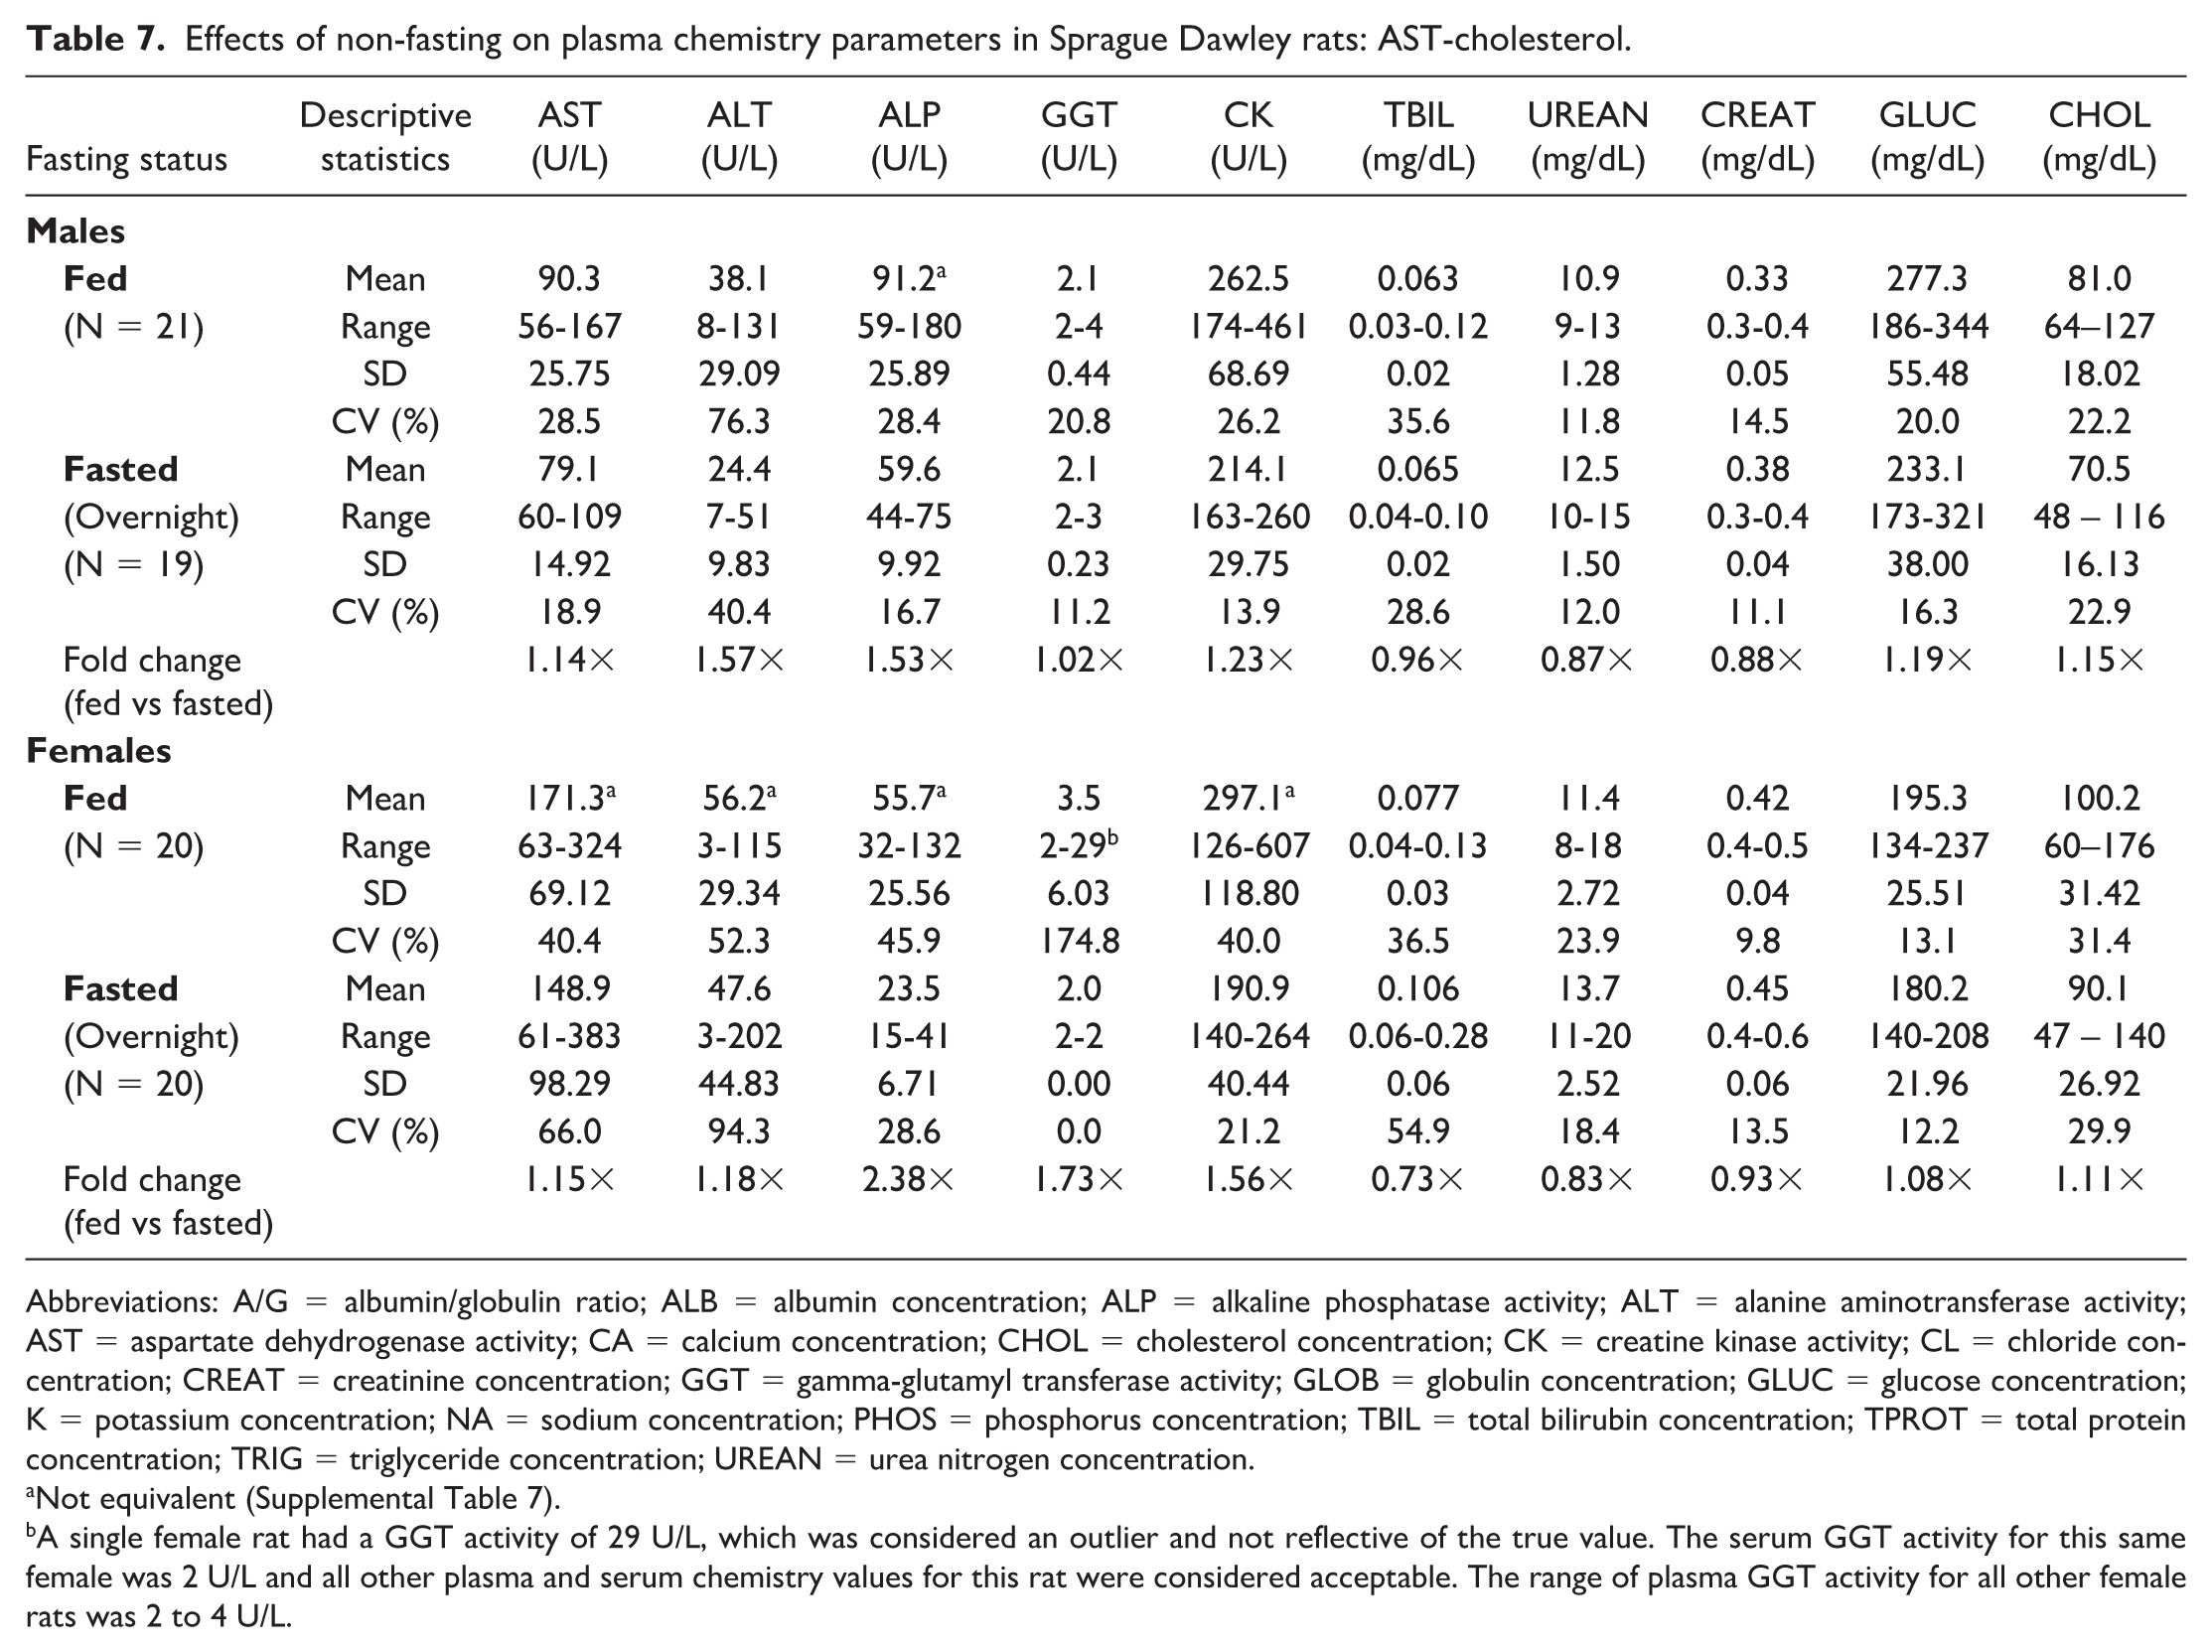
Abbreviations: A/G = albumin/globulin ratio; ALB = albumin concentration; ALP = alkaline phosphatase activity; ALT = alanine aminotransferase activity; AST = aspartate dehydrogenase activity; CA = calcium concentration; CHOL = cholesterol concentration; CK = creatine kinase activity; CL = chloride concentration; CREAT = creatinine concentration; GGT = gamma-glutamyl transferase activity; GLOB = globulin concentration; GLUC = glucose concentration; K = potassium concentration; NA = sodium concentration; PHOS = phosphorus concentration; TBIL = total bilirubin concentration; TPROT = total protein concentration; TRIG = triglyceride concentration; UREAN = urea nitrogen concentration.
Not equivalent (Supplemental Table 7).
A single female rat had a GGT activity of 29 U/L, which was considered an outlier and not reflective of the true value. The serum GGT activity for this same female was 2 U/L and all other plasma and serum chemistry values for this rat were considered acceptable. The range of plasma GGT activity for all other female rats was 2 to 4 U/L.
Effects of non-fasting on plasma chemistry parameters in Sprague Dawley rats: triglyceride-chloride.
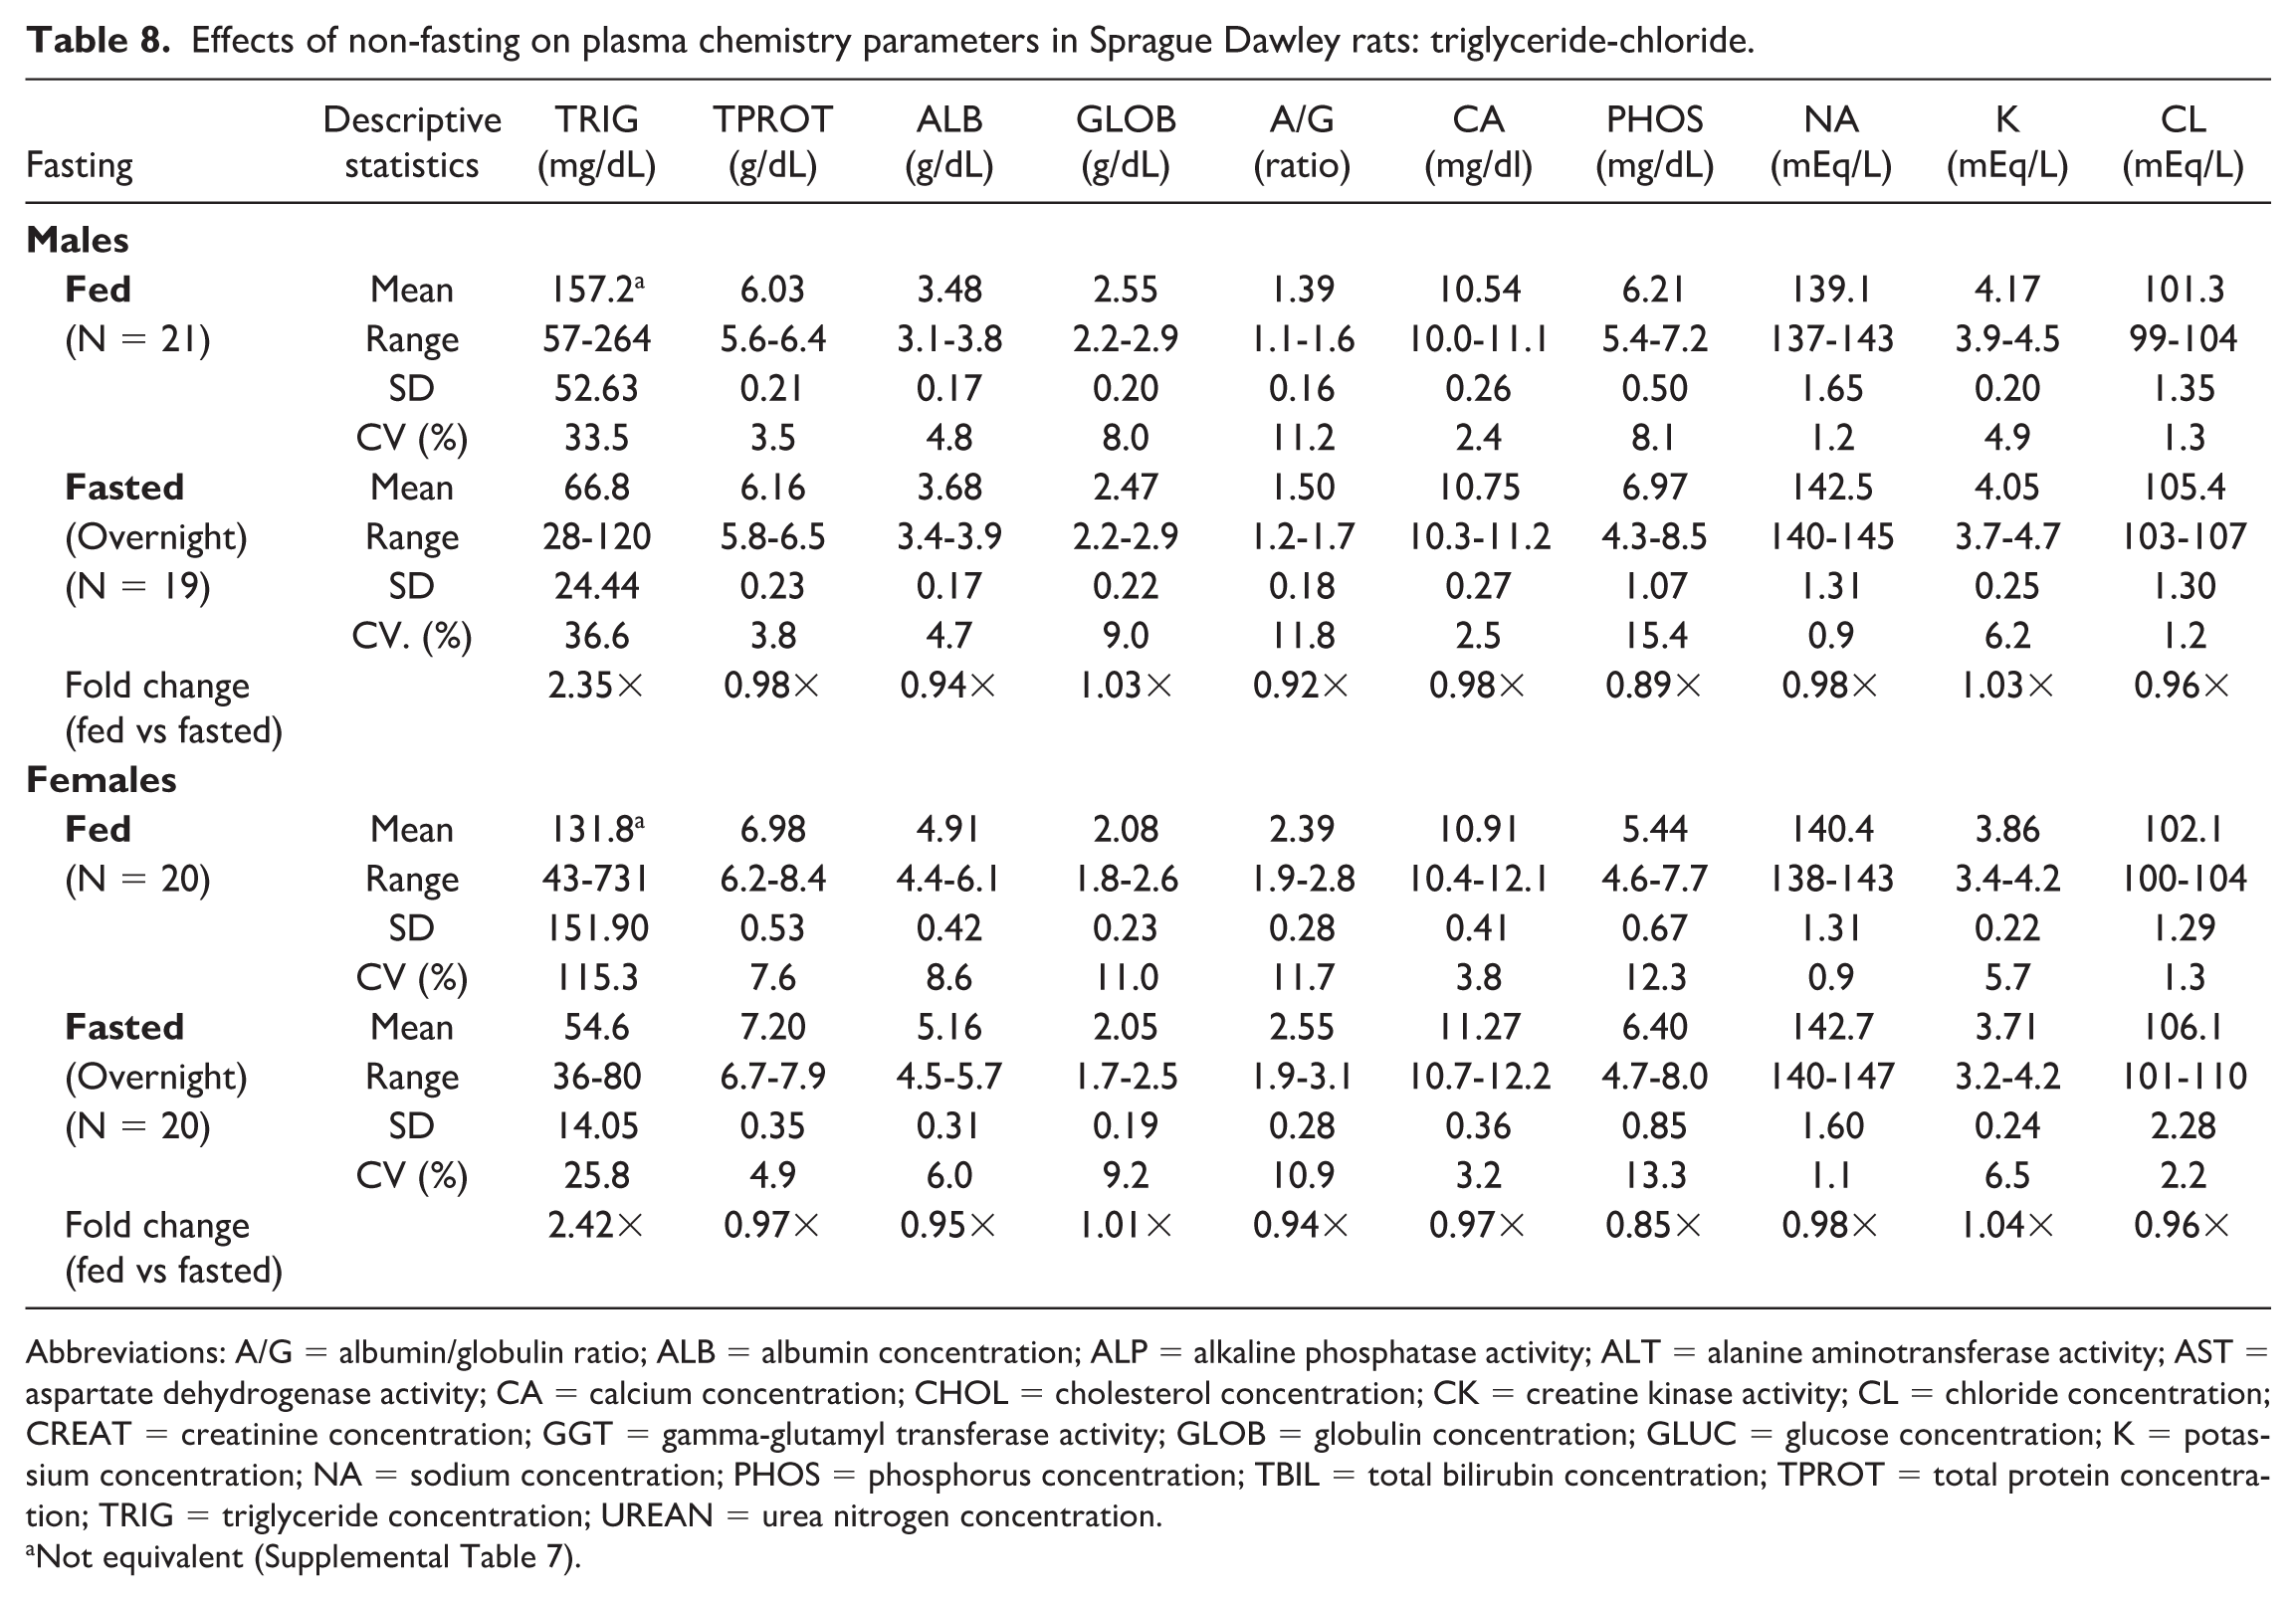
Abbreviations: A/G = albumin/globulin ratio; ALB = albumin concentration; ALP = alkaline phosphatase activity; ALT = alanine aminotransferase activity; AST = aspartate dehydrogenase activity; CA = calcium concentration; CHOL = cholesterol concentration; CK = creatine kinase activity; CL = chloride concentration; CREAT = creatinine concentration; GGT = gamma-glutamyl transferase activity; GLOB = globulin concentration; GLUC = glucose concentration; K = potassium concentration; NA = sodium concentration; PHOS = phosphorus concentration; TBIL = total bilirubin concentration; TPROT = total protein concentration; TRIG = triglyceride concentration; UREAN = urea nitrogen concentration.
Not equivalent (Supplemental Table 7).
Macaques
In fed macaques, lipemia was not observed in any of the serum samples and in only 1 of 20 (5%, 1 male) plasma samples (1+). In fasted macaques, 1 of 20 (5%, 1 female) had a lipemic serum and plasma sample (1+ for both; Table 9). The presence of lipemia corresponded to a high triglyceride concentration in the fed male (343 mg/dL) but not in the fasted female (148 mg/dL in serum and 150 mg/dL in plasma).
Incidence of lipemia in cynomolgus macaques.
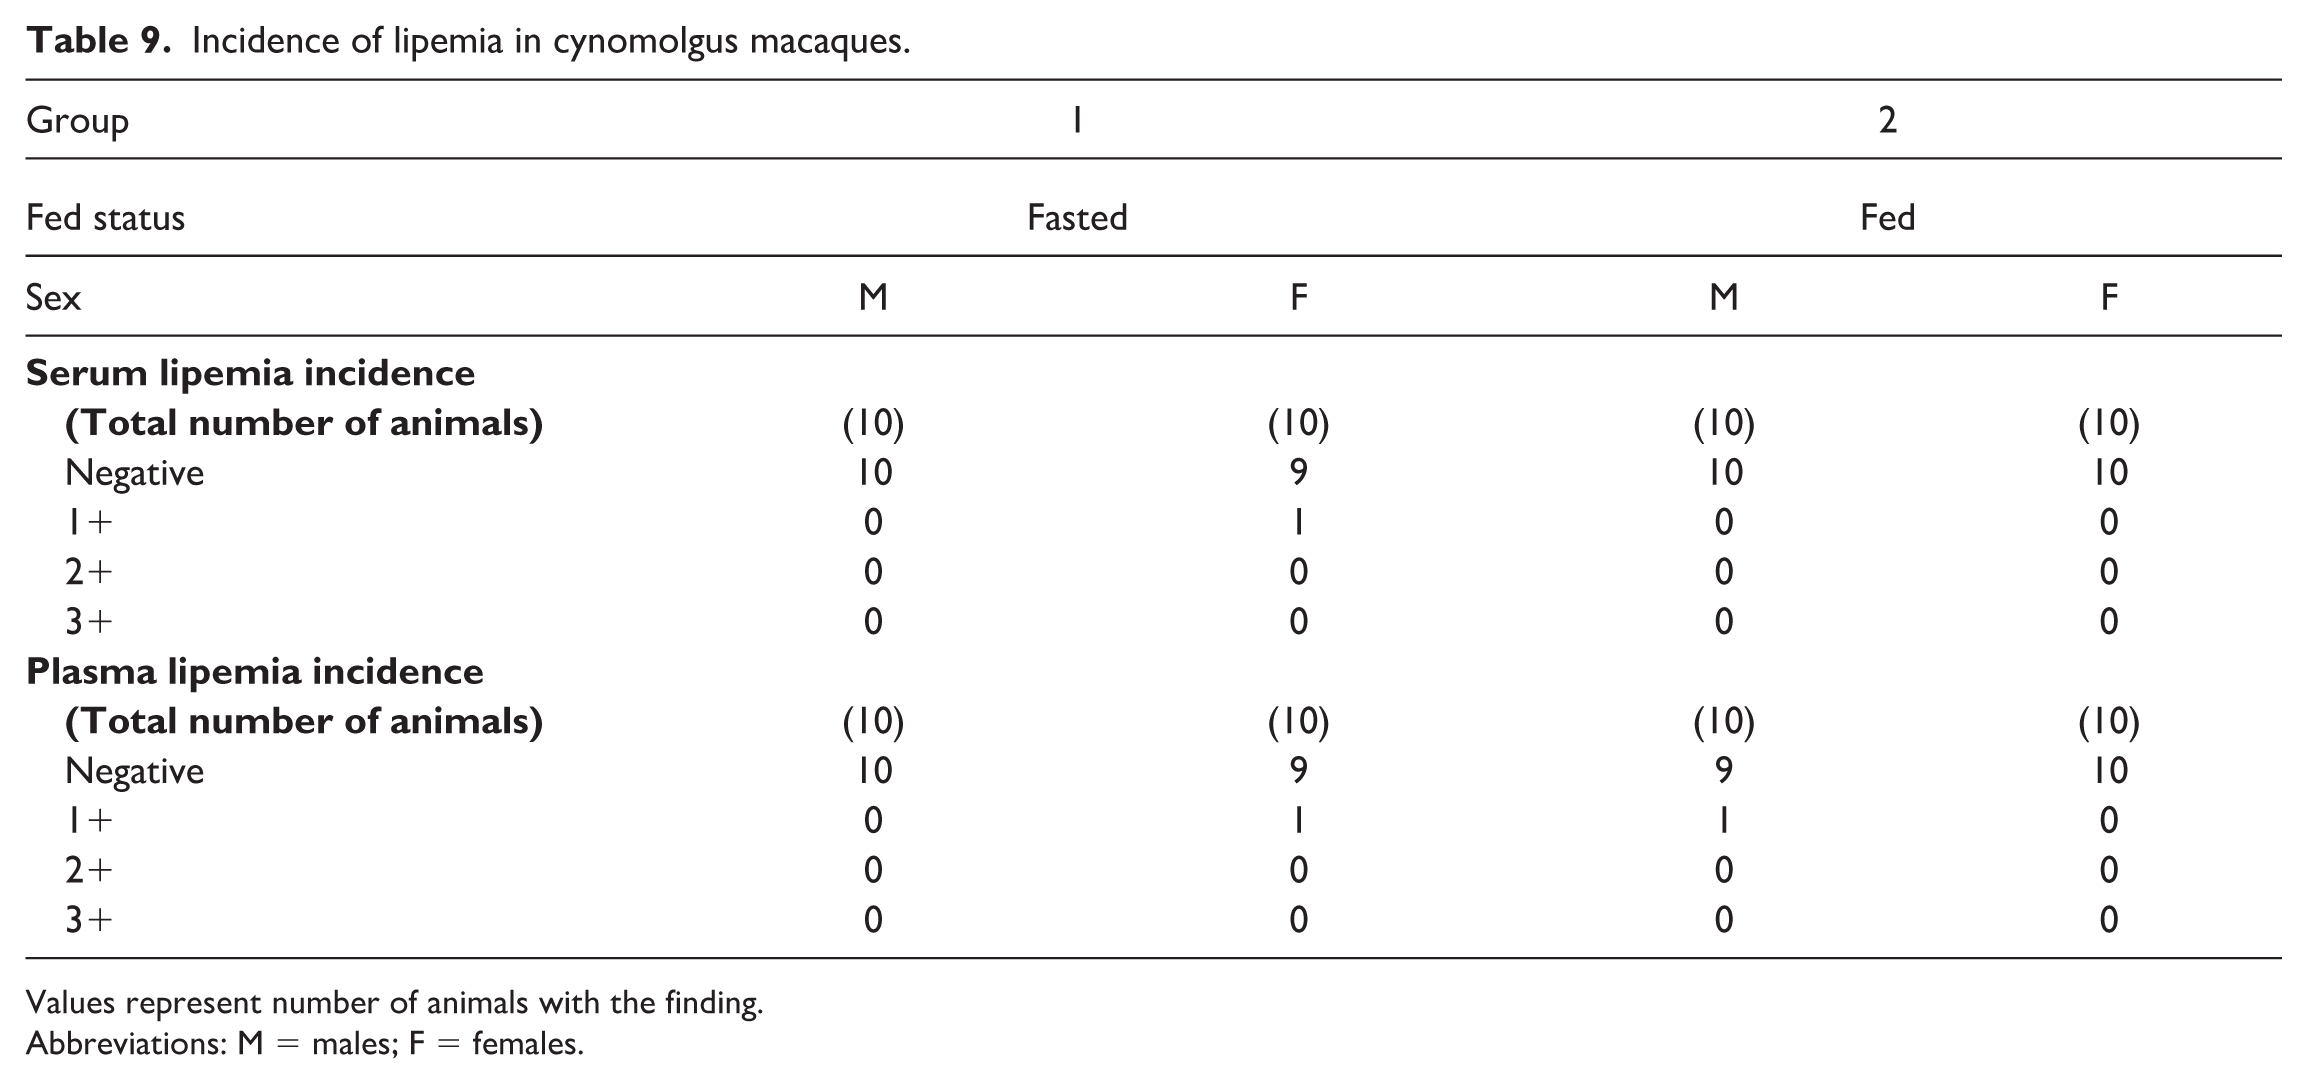
Values represent number of animals with the finding.
Abbreviations: M = males; F = females.
Hemolysis was not observed in any of the fed serum or plasma samples from macaques. In fasted macaques, 3 of 20 (15%, 1 male and 2 females) had hemolyzed serum samples (1+) and 1 of 20 (5%, 1 male) had hemolyzed plasma samples (Table 10).
Incidence of hemolysis in cynomolgus macaques.
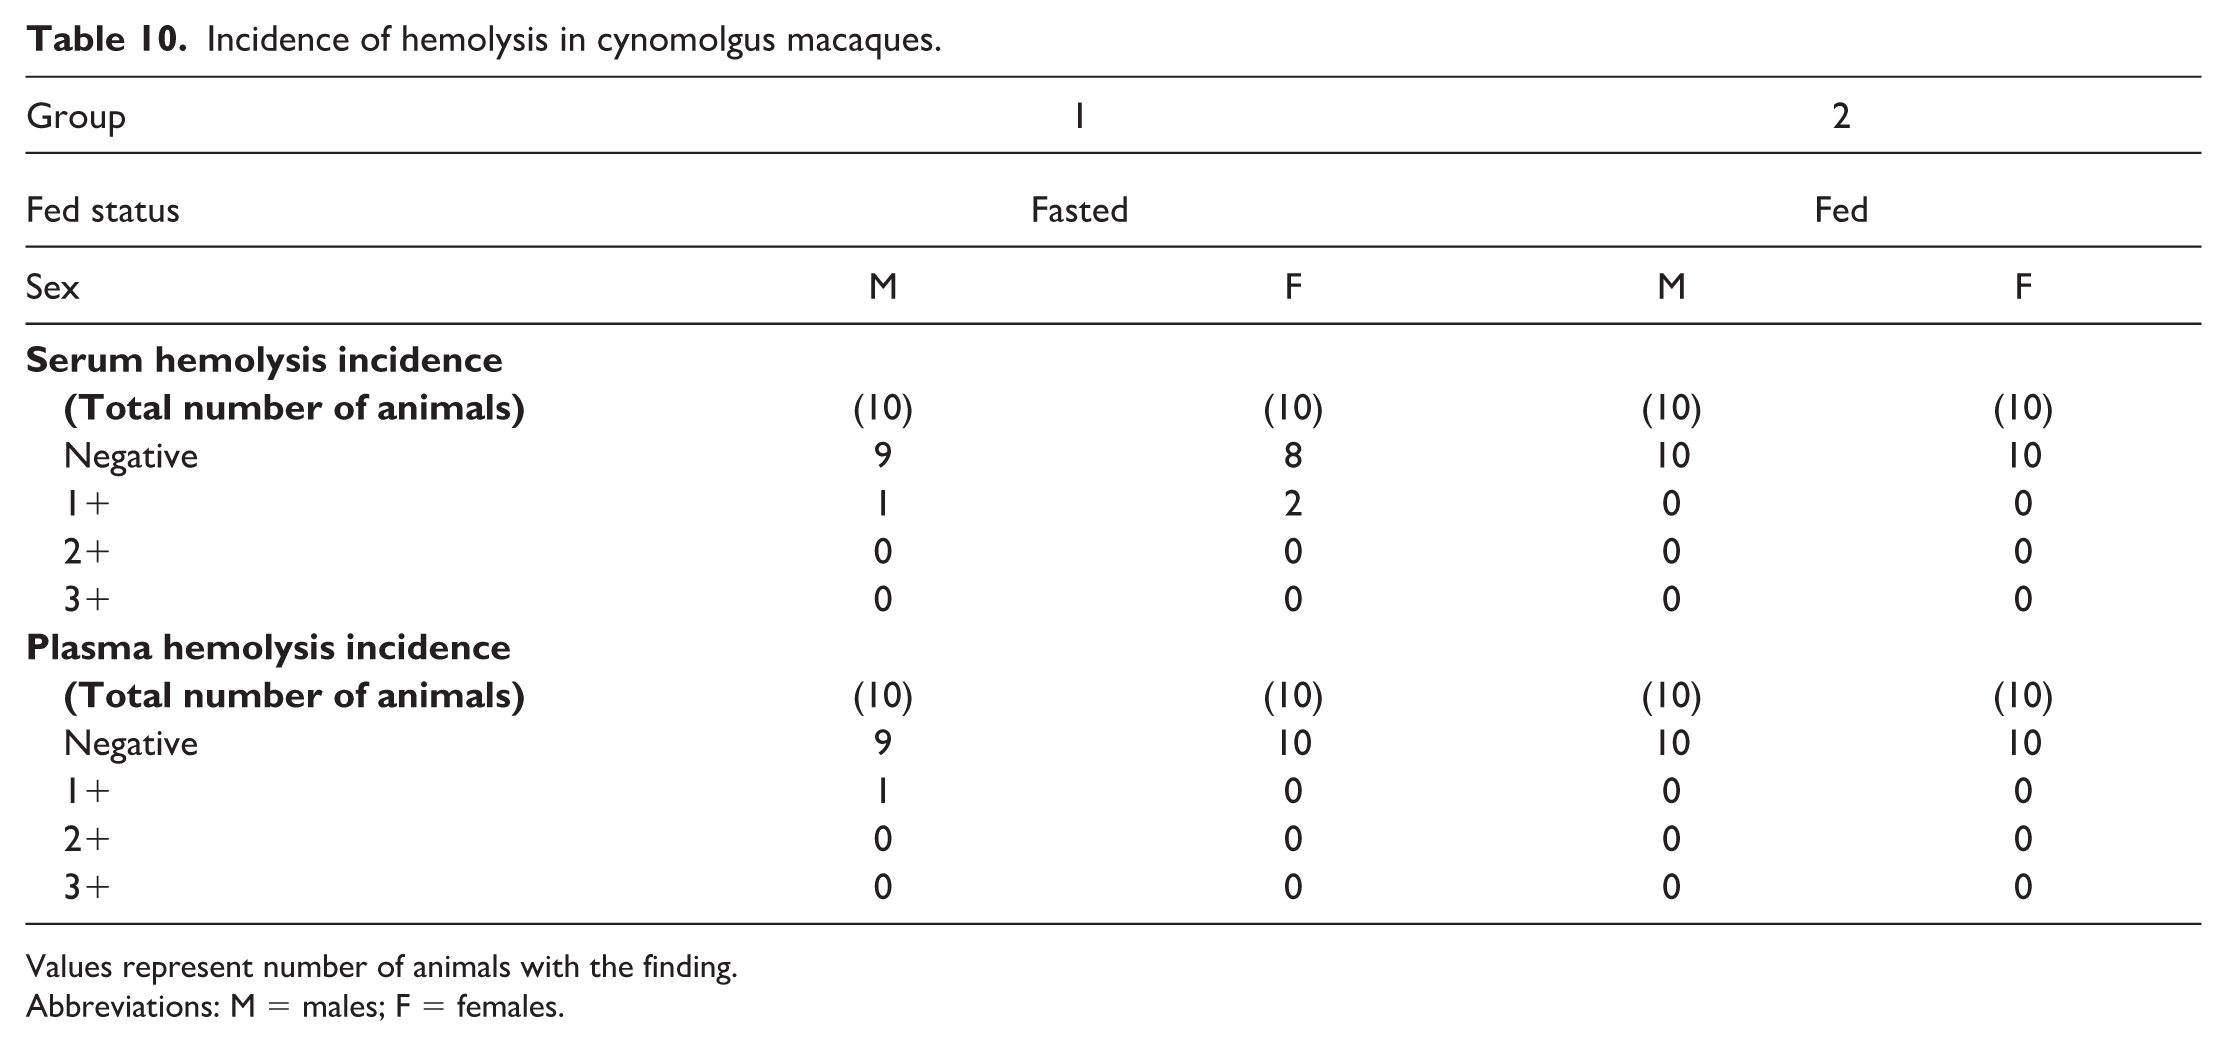
Values represent number of animals with the finding.
Abbreviations: M = males; F = females.
Noteworthy changes in serum and plasma of fed male and female macaques were minor and consisted of higher triglyceride (serum: 1.58× and 1.19×; plasma: 1.58× and 1.13× in males and females, respectively) and lower phosphorus (serum: 0.83× and 0.93×; plasma: 0.80× and 0.90×) and total bilirubin (serum: 0.71× and 0.84×; plasma: 0.78× and 0.77×) concentrations. The standard deviation was notably higher in the fed groups for triglyceride and the %CV for triglyceride was higher in fed females; however, none of the fold changes between fed and fasted groups were higher than the %CV for any of the parameters in fasted macaques. Fasting status had no impact on hematology (Online Supplemental Table 2) or coagulation (Online Supplemental Table 3) parameters in macaques. There were also no significant day by state interactions for any of the parameters measured, meaning that any differences between days 1 and 2 in the crossover design were not affected by the prandial state.
The statistical equivalency of reported values can be found in Online Supplemental Tables 4 to 11.
When clinical chemistry results were compared between serum (Tables 5, 6, 11, and 12) and heparinized plasma (Tables 7, 8, 13, and 14) samples, both fasted and fed rats and macaques generally had higher AST and CK activities, higher phosphorus and potassium concentrations, and lower glucose and globulin concentrations in serum compared with plasma samples. Calcium concentrations were lower in serum samples from rats, while calcium concentrations in macaques were higher in serum samples compared with plasma samples, independent of fasting status.
Effects of non-fasting on serum chemistry parameters in cynomolgus macaques: AST-cholesterol.
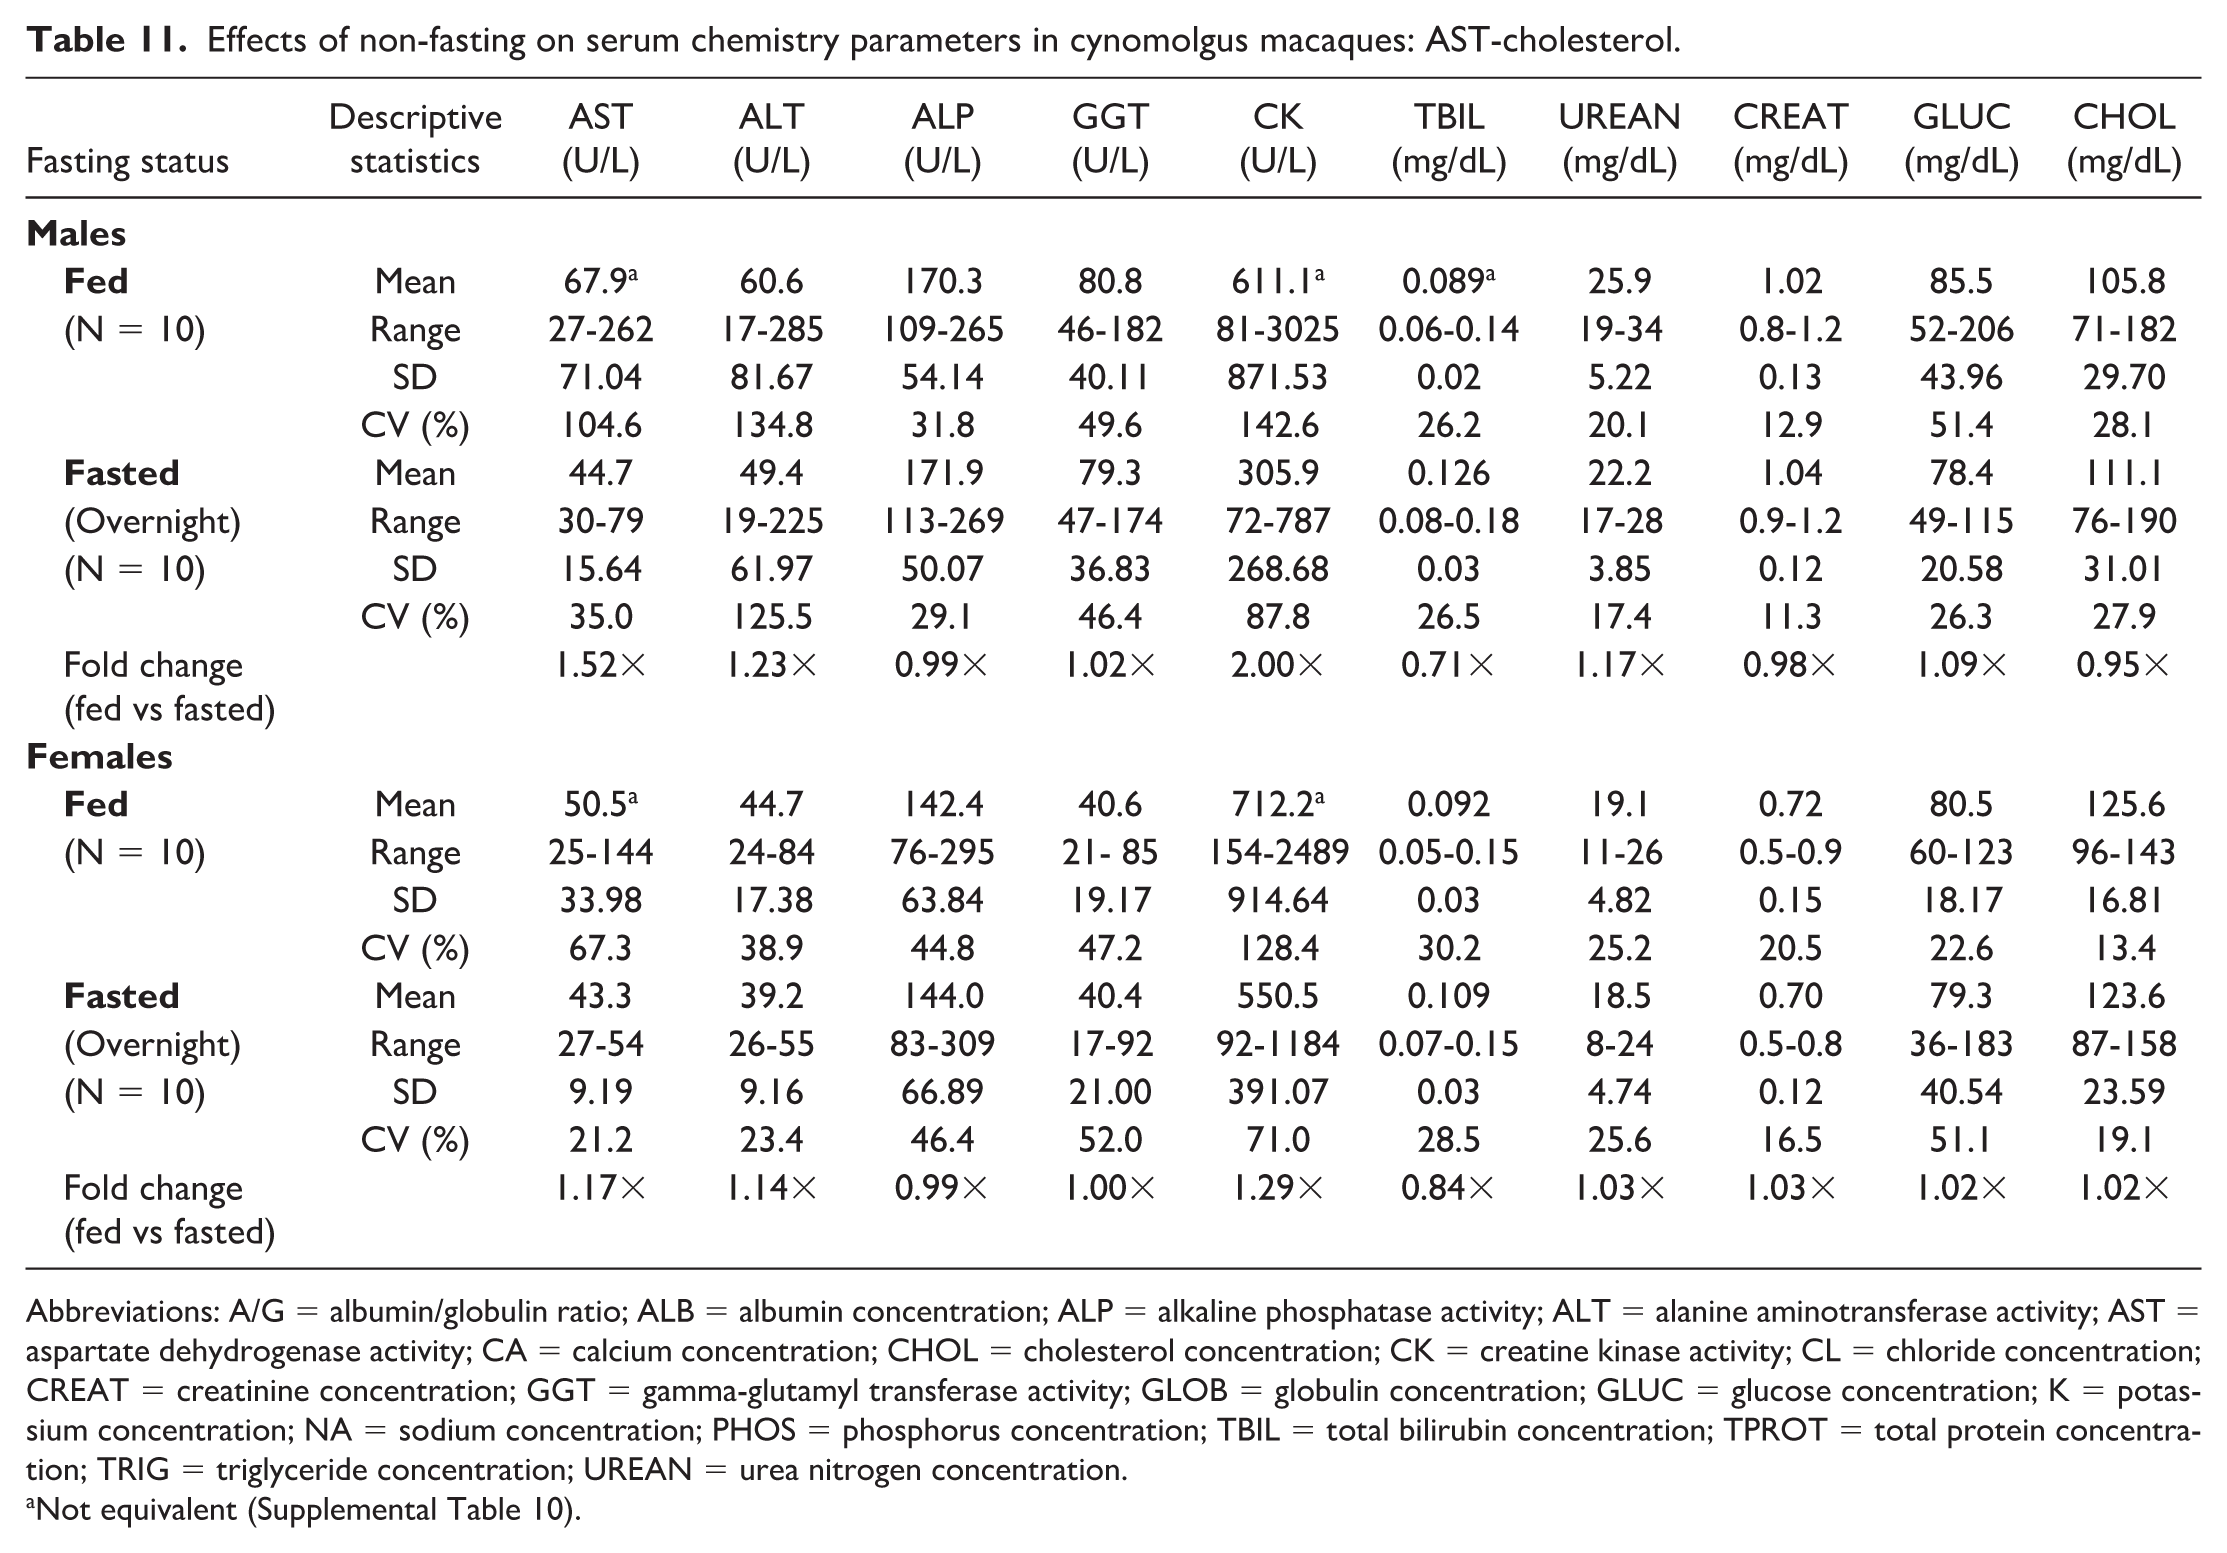
Abbreviations: A/G = albumin/globulin ratio; ALB = albumin concentration; ALP = alkaline phosphatase activity; ALT = alanine aminotransferase activity; AST = aspartate dehydrogenase activity; CA = calcium concentration; CHOL = cholesterol concentration; CK = creatine kinase activity; CL = chloride concentration; CREAT = creatinine concentration; GGT = gamma-glutamyl transferase activity; GLOB = globulin concentration; GLUC = glucose concentration; K = potassium concentration; NA = sodium concentration; PHOS = phosphorus concentration; TBIL = total bilirubin concentration; TPROT = total protein concentration; TRIG = triglyceride concentration; UREAN = urea nitrogen concentration.
Not equivalent (Supplemental Table 10).
Effects of non-fasting on serum chemistry parameters in cynomolgus macaques: triglyceride-chloride.
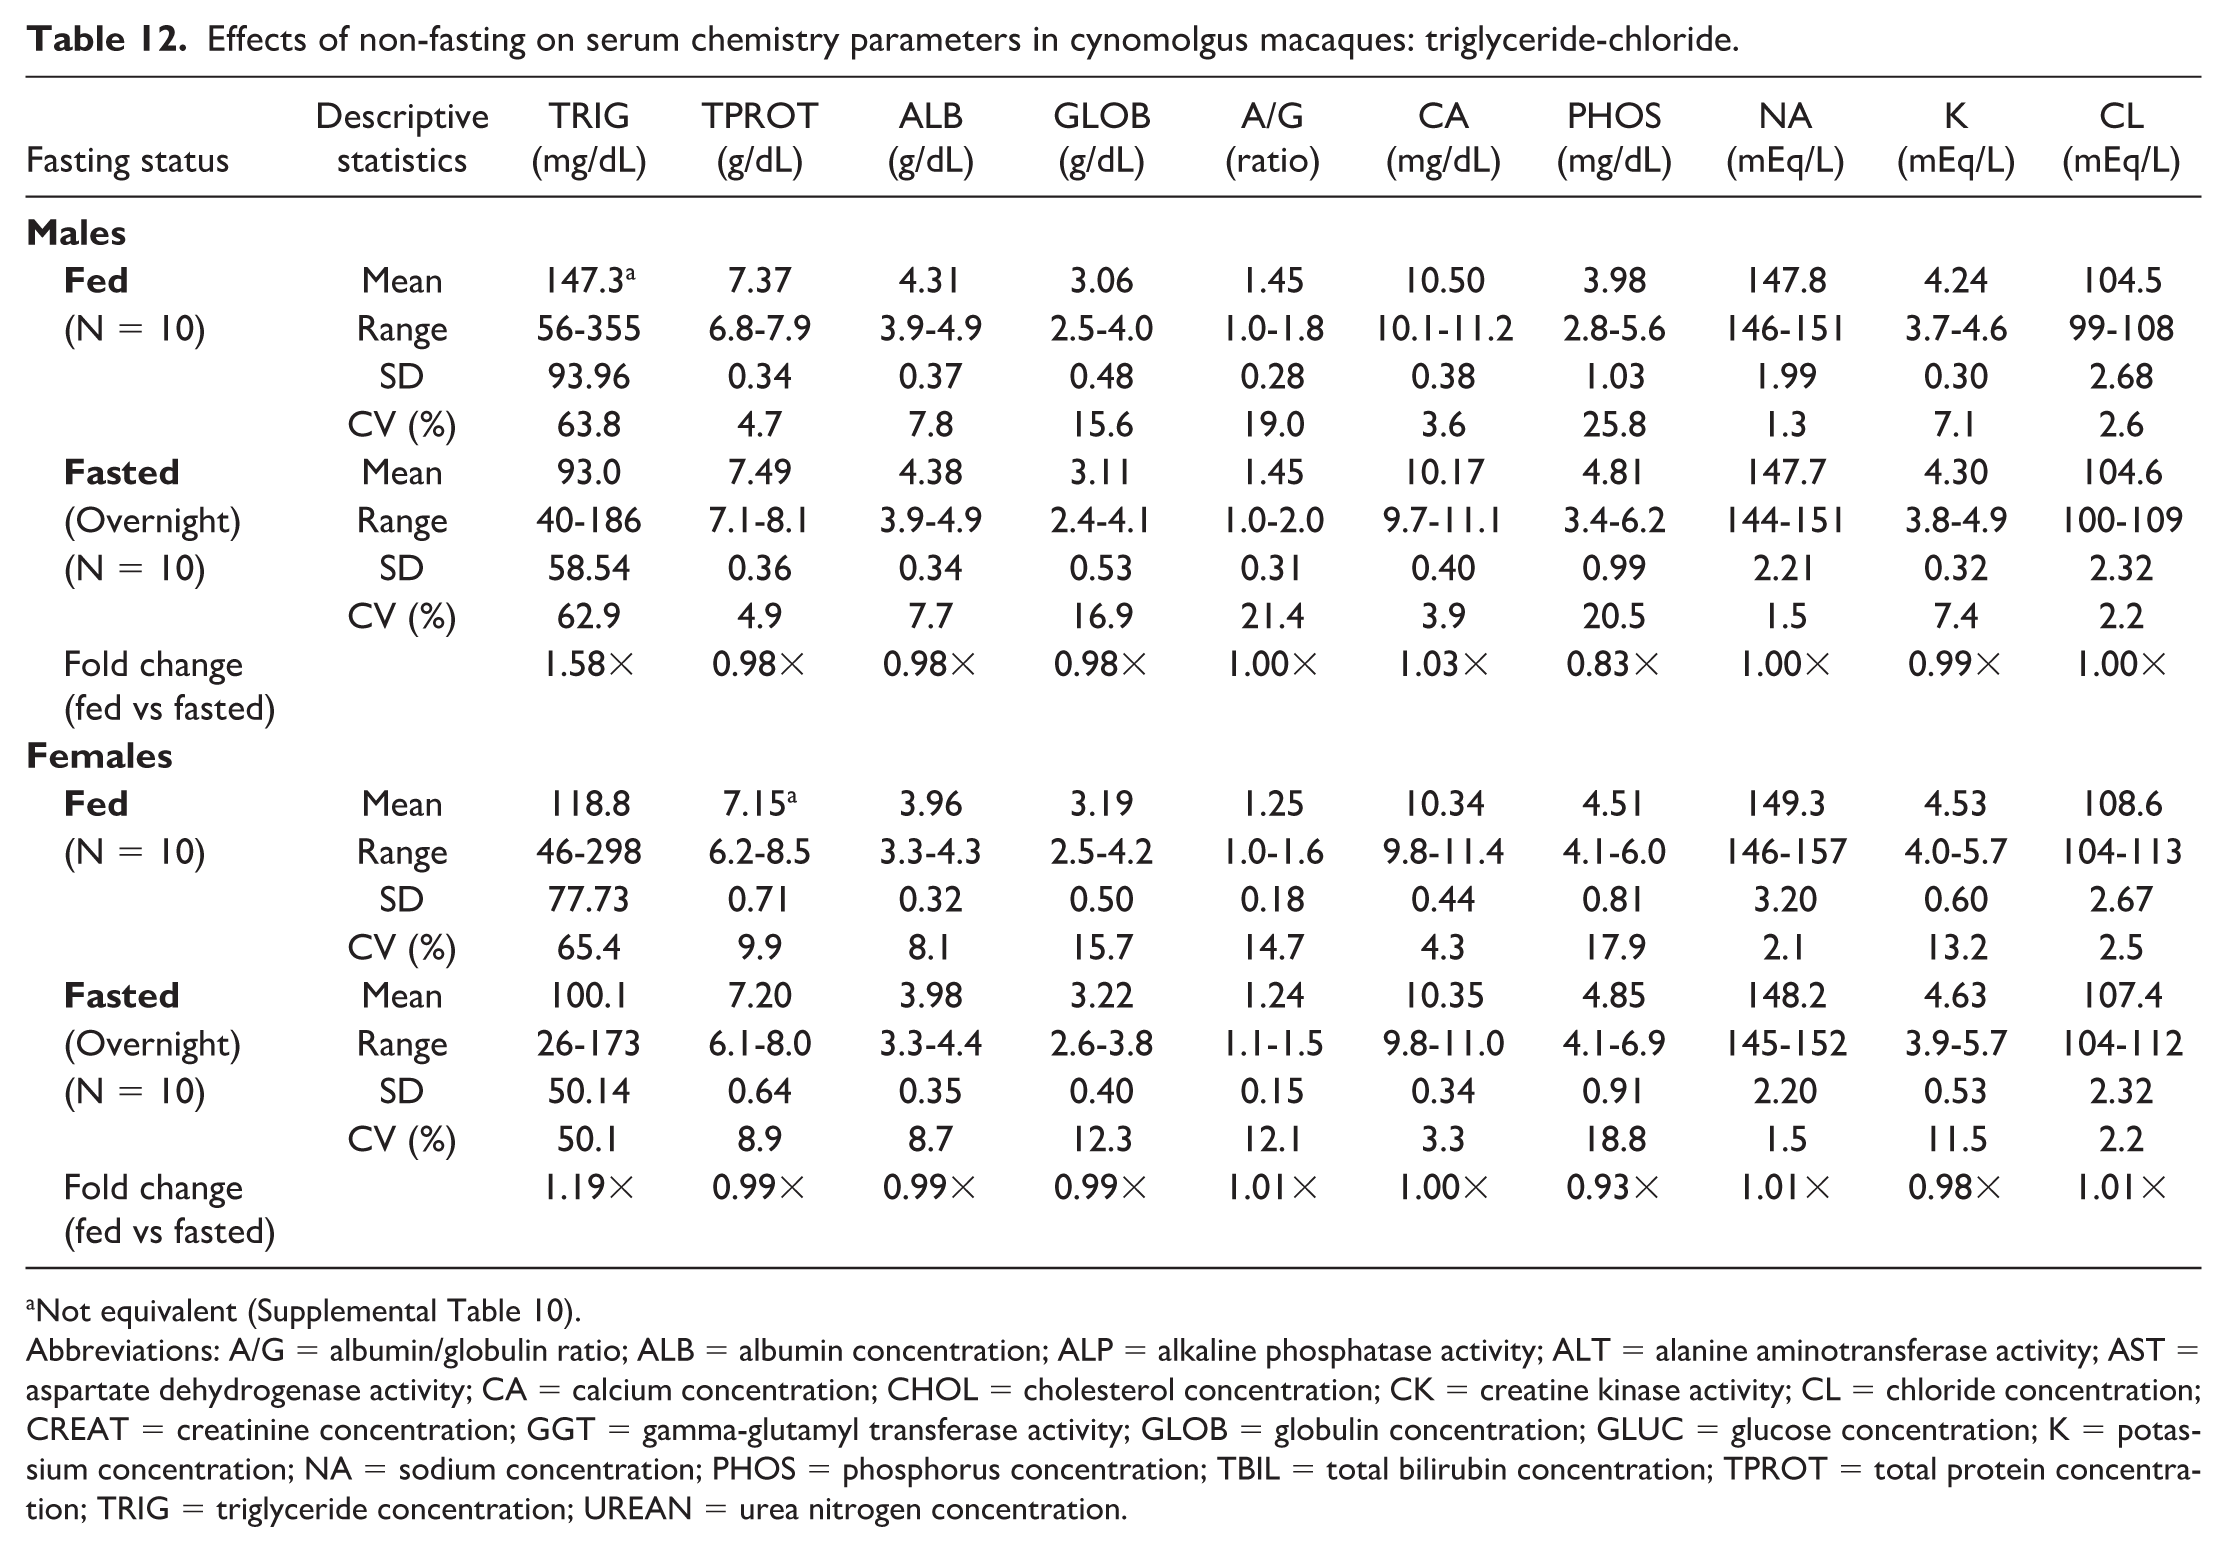
Not equivalent (Supplemental Table 10).
Abbreviations: A/G = albumin/globulin ratio; ALB = albumin concentration; ALP = alkaline phosphatase activity; ALT = alanine aminotransferase activity; AST = aspartate dehydrogenase activity; CA = calcium concentration; CHOL = cholesterol concentration; CK = creatine kinase activity; CL = chloride concentration; CREAT = creatinine concentration; GGT = gamma-glutamyl transferase activity; GLOB = globulin concentration; GLUC = glucose concentration; K = potassium concentration; NA = sodium concentration; PHOS = phosphorus concentration; TBIL = total bilirubin concentration; TPROT = total protein concentration; TRIG = triglyceride concentration; UREAN = urea nitrogen concentration.
Effects of non-fasting on plasma chemistry parameters in cynomolgus macaques: AST-cholesterol.
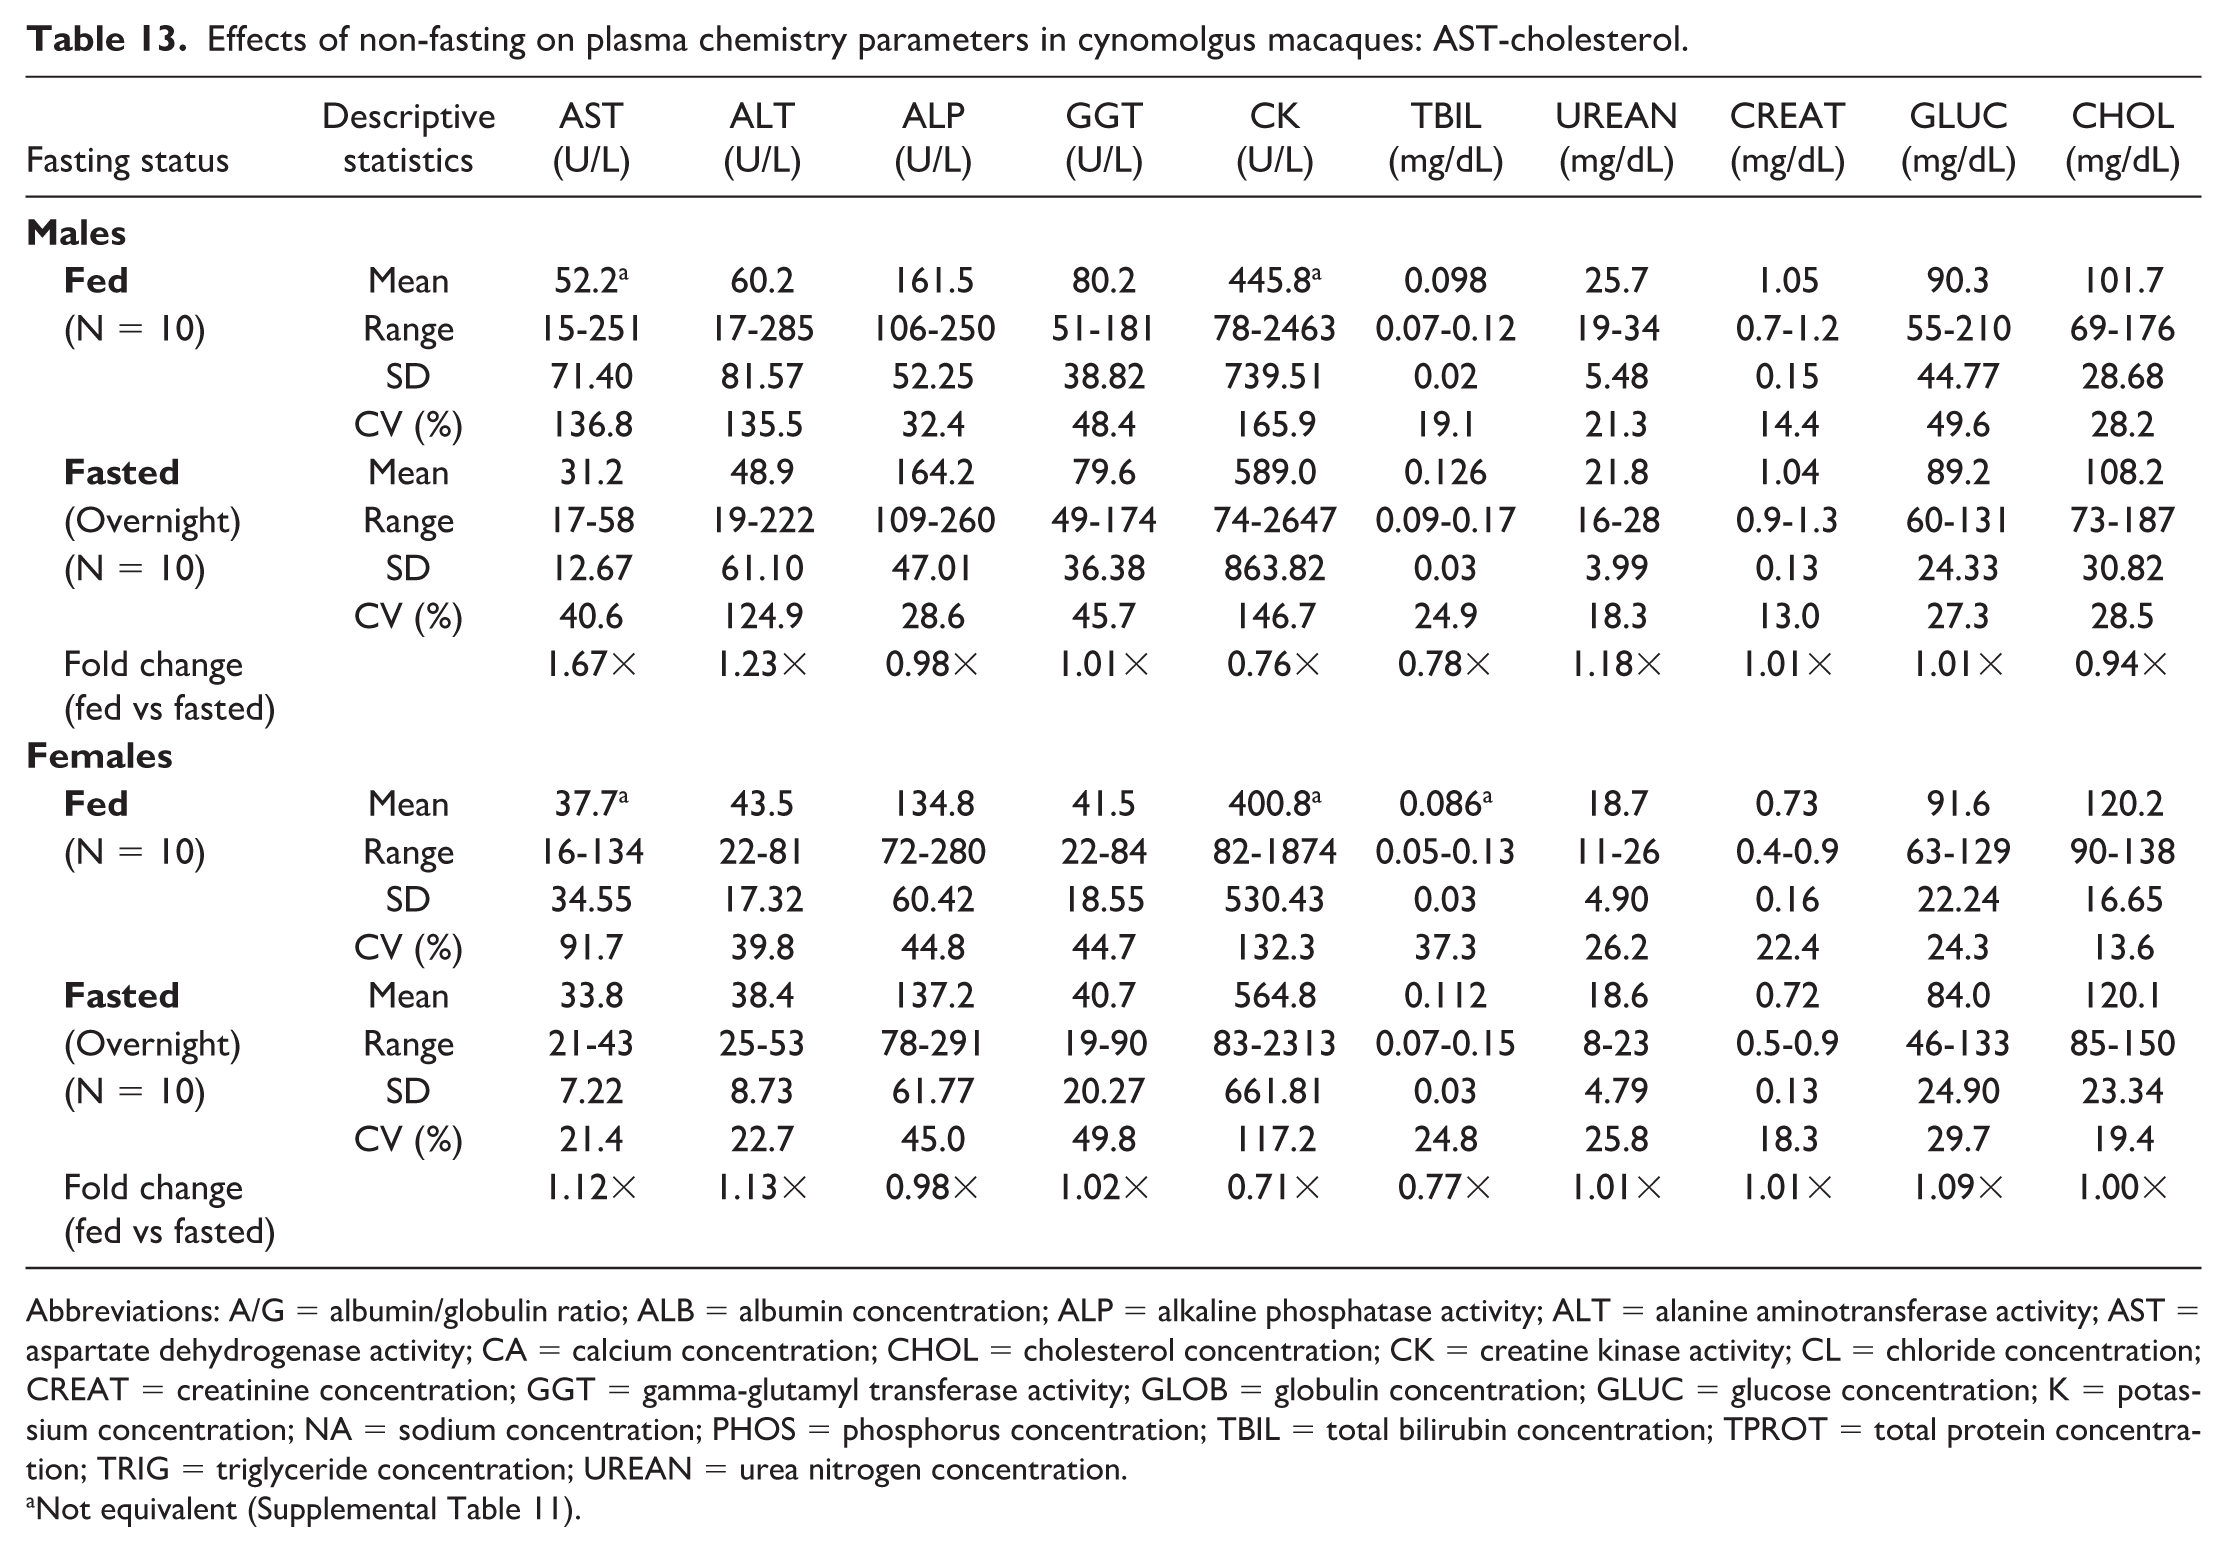
Abbreviations: A/G = albumin/globulin ratio; ALB = albumin concentration; ALP = alkaline phosphatase activity; ALT = alanine aminotransferase activity; AST = aspartate dehydrogenase activity; CA = calcium concentration; CHOL = cholesterol concentration; CK = creatine kinase activity; CL = chloride concentration; CREAT = creatinine concentration; GGT = gamma-glutamyl transferase activity; GLOB = globulin concentration; GLUC = glucose concentration; K = potassium concentration; NA = sodium concentration; PHOS = phosphorus concentration; TBIL = total bilirubin concentration; TPROT = total protein concentration; TRIG = triglyceride concentration; UREAN = urea nitrogen concentration.
Not equivalent (Supplemental Table 11).
Effects of non-fasting on plasma chemistry parameters in cynomolgus macaques: triglyceride-chloride.
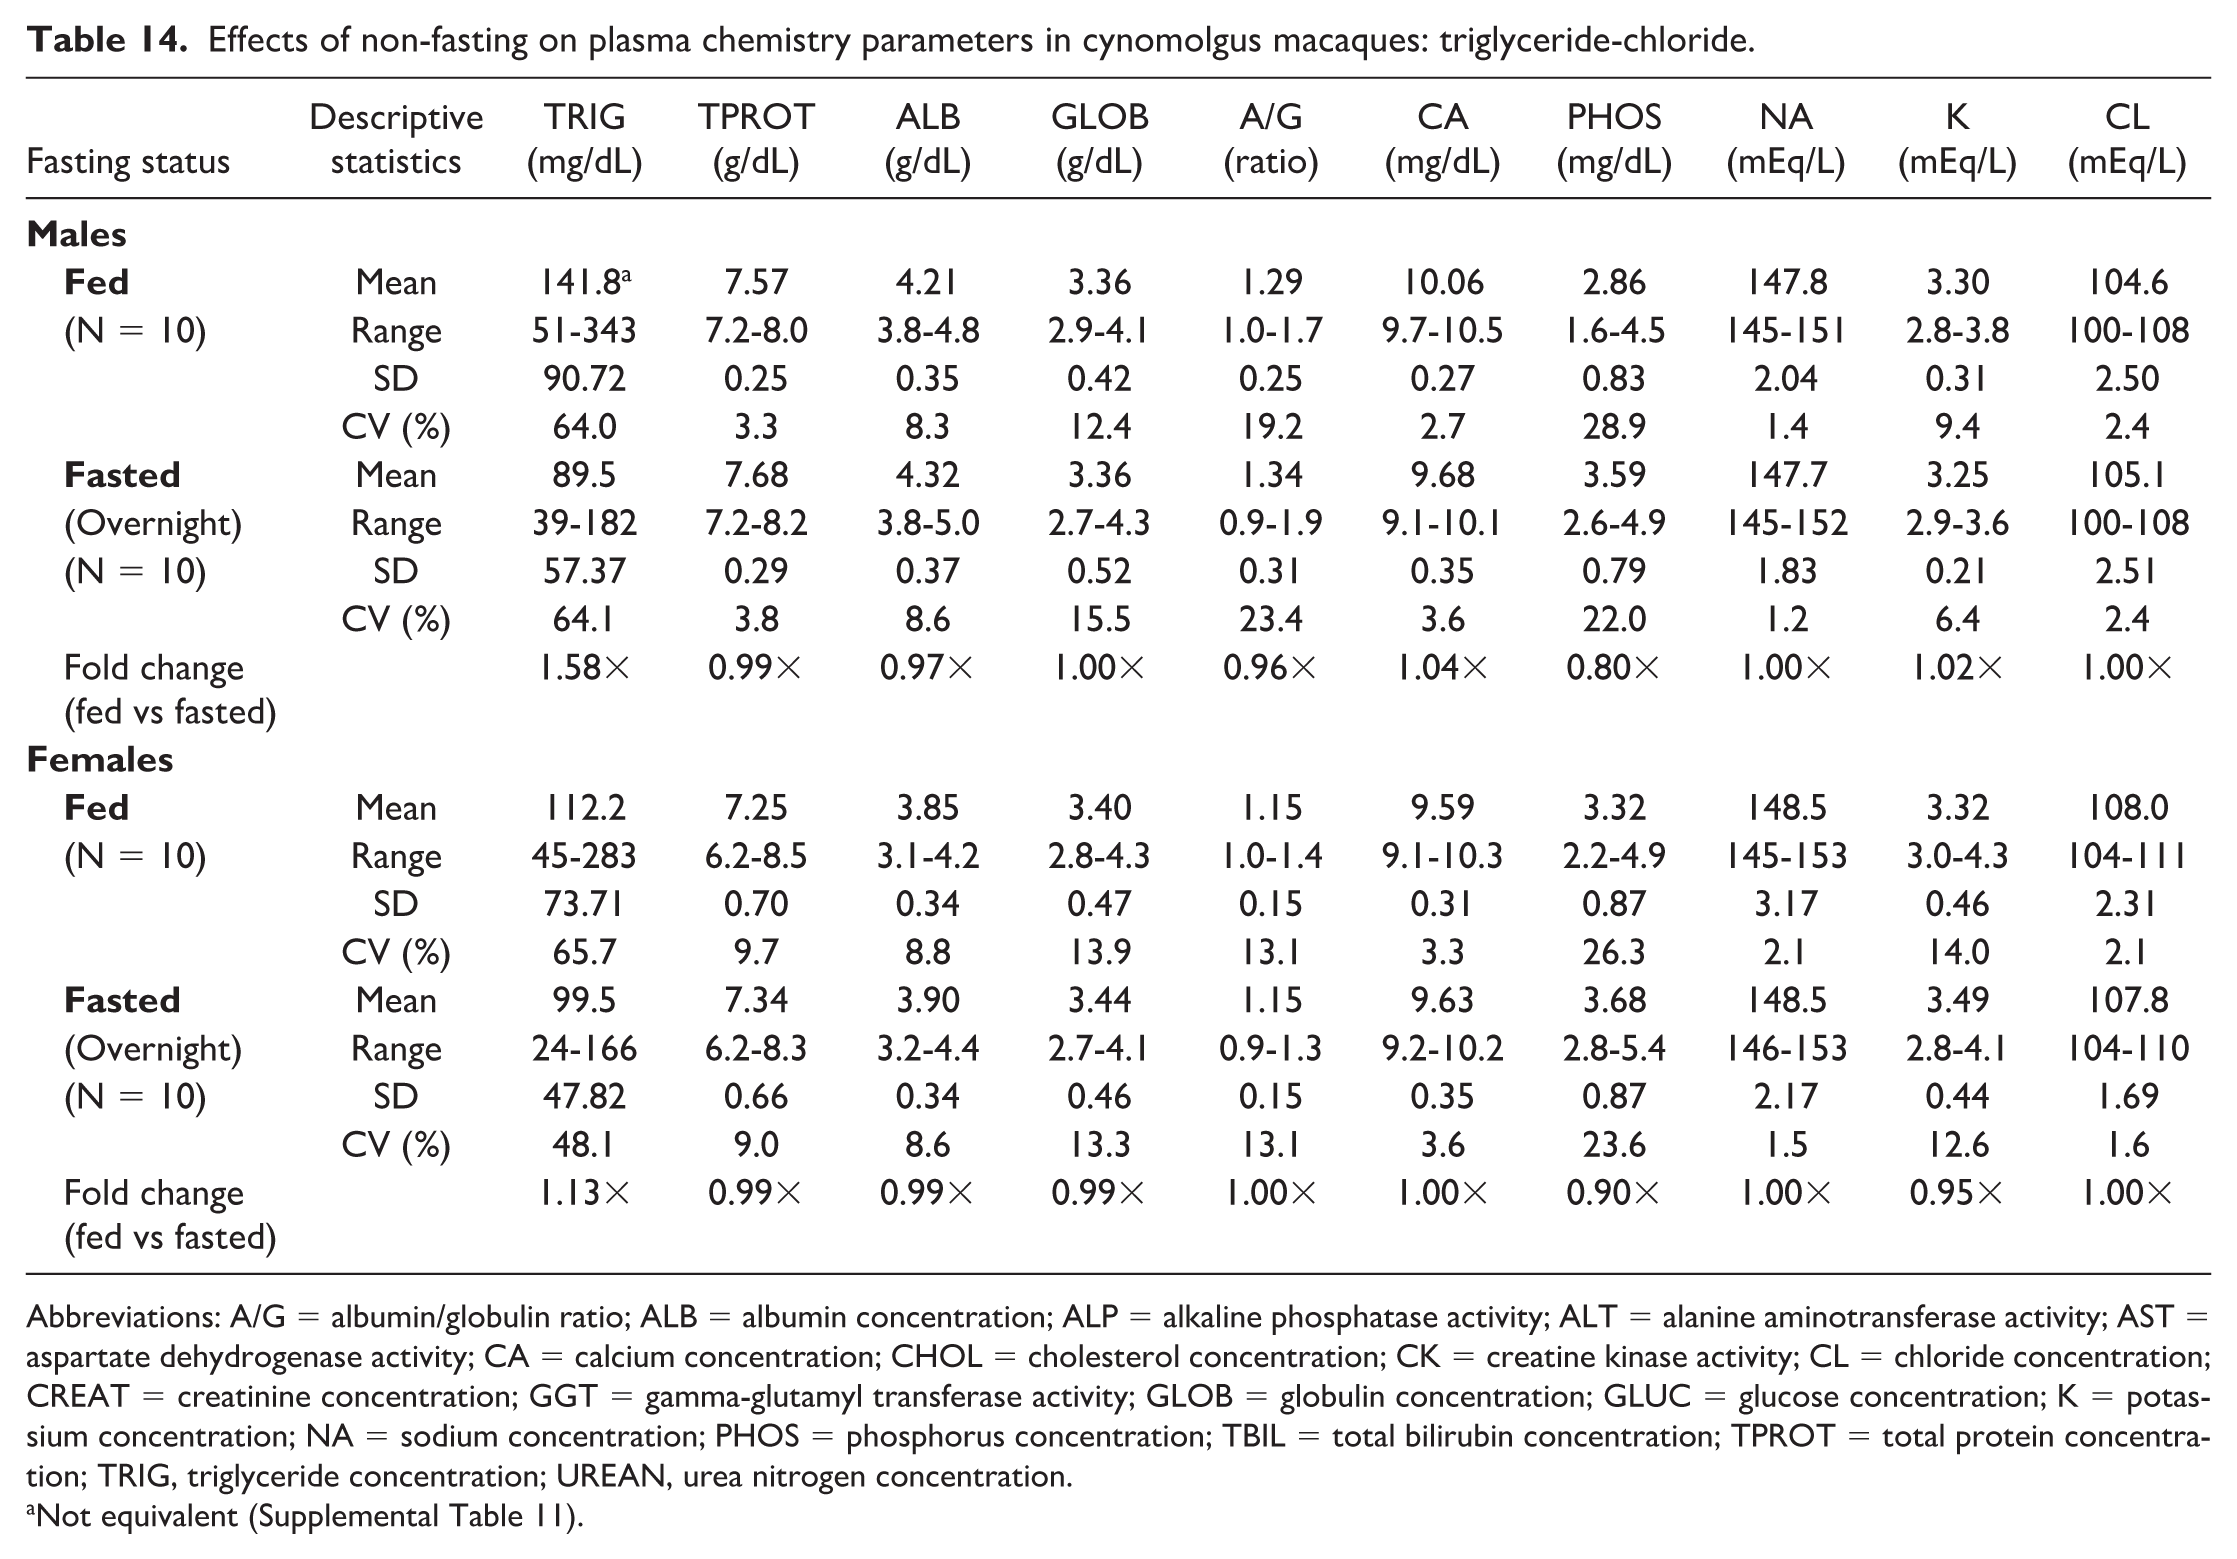
Abbreviations: A/G = albumin/globulin ratio; ALB = albumin concentration; ALP = alkaline phosphatase activity; ALT = alanine aminotransferase activity; AST = aspartate dehydrogenase activity; CA = calcium concentration; CHOL = cholesterol concentration; CK = creatine kinase activity; CL = chloride concentration; CREAT = creatinine concentration; GGT = gamma-glutamyl transferase activity; GLOB = globulin concentration; GLUC = glucose concentration; K = potassium concentration; NA = sodium concentration; PHOS = phosphorus concentration; TBIL = total bilirubin concentration; TPROT = total protein concentration; TRIG, triglyceride concentration; UREAN, urea nitrogen concentration.
Not equivalent (Supplemental Table 11).
Discussion
In human medicine, the recommendation to fast for routine clinical pathology assessment has grown less strict over time, partially due to a lack of consistent compliance. 34 Greater priority is placed on fasting for screening tests for metabolic disorders in which the assessment of glucose, cholesterol, and triglycerides are key.6,18 However, the aim in routine laboratory testing is distinctly different from that of safety assessment of novel compounds. Compounds under evaluation can have unanticipated metabolic impacts, making it difficult to prejudge when fasting should be included in a study protocol. It is most judicious to mandate fasting for compounds with anticipated impacts on endocrine systems that are either directly or indirectly related to energy metabolism in order to eliminate any confounding effects from feeding. In addition, compounds intended for metabolic disorders, such as diabetes mellitus, should likewise be assessed using animals fasted prior to sampling for clinical pathology evaluation. Apart from the aforementioned impacts on glucose and lipid metabolism, fasting can also have variable impacts on parathyroid hormone, gastrin, and calcitonin,29,40 and consequently, a general recommendation of fasting for all compounds with any potential endocrine impact is also recommended.
Robertson et al 38 assessed serum clinical chemistry changes after 16 hours of feed restriction in Sprague-Dawley rats and reported noteworthy but minimal decreases in ALT and ALP in fasted rats. Similar enzyme activity decreases were observed in two other rat studies.19,44 While a definitive mechanism for this repeatable change in ALT, which was also detected in our study, has not been explained, the observed changes in ALP activities between fasted states is expected due to decreases in the intestinal isoform secondary to food restriction. 15
Noteworthy transcriptomic changes have been described in rats after 16 hours of fasting pertaining to genes affecting lipid and glucose metabolism, including downregulations of genes involved in cholesterol biosynthesis, as well as transcripts for pyruvate kinase and glucokinase. 38 Waner and Nyska 44 also observed decreases in glucose between 16 and 24 hours of food deprivation but not at 8 hours. This aligns with our observation of higher glucose, triglyceride, and cholesterol concentrations in fed rats in the present study and supports our observation of a higher incidence of lipemia in fed rats.
Neutrophil counts were lower only in fed male rats compared to fasted animals. However, rats are a lymphocyte-predominant species and have low numbers of circulating neutrophils in health. 42 Therefore, this change was not considered to have an impact on data interpretation. Another study in male Sprague-Dawley rats observed significant increases in neutrophil counts after only 6 hours of fasting, 35 and there is some evidence in humans that fasting over 72 hours can stimulate neutrophil activation and lower apoptotic activity. 37 This is in contrast to several other studies in rats and mice that observed decreases in all white blood cell types after reduced food intake or fasting for 16 hours or more, with the greatest decreases tending to be in lymphocytes.4,5,22,31,36,43 Other studies observed no changes in leukocytes with fasting in rats.38,19 Our results support that the effects of non-fasting on rat leukocyte counts are minor to negligible.
Our finding of lower reticulocyte counts in fed compared with fasted male rats contrasts with reports that reticulocyte counts are either similar between fasted and fed rats 32 or are higher when food intake is not reduced. 31 Naeshiro et al 32 found that plasma erythropoietin levels only started decreasing in rats after 20 hours of fasting compared with fed rats, likely as a result of protein deficiency. Multiple studies in rats reported minimally to mildly increased RBC mass parameters attributed to decreased water intake secondary to fasting or reduced food intake19,22,31,32,36; however, we did not observe any changes in RBC mass between fasted and fed rats after 8 hours, and our results were similar to other reports after 16 hours of fasting.27,38 Most observed differences in rats were considered within biological variation. The minor changes observed in this study were inconsistent between males and females, and findings in previous studies are often contradictory. While lipemia is known to interfere with hemoglobin measurement and can result in falsely higher hemoglobin, MCH, and MCHC values, 14 these interferences were not detected in this study despite the measurement of lipemia in over a quarter of the non-fasted rat samples. Multiple guidelines for humans also no longer require fasting prior to a complete blood count because results are not impacted by fasting status.7,8,23 Overall, non-fasting was considered to have a minimal effect on hematology data in rats that should not impact data interpretation.
Regarding cynomolgus macaques, Zeng et al 47 only observed hematology changes (decreases in RBC mass and time-dependent increases in platelet counts) after 16 hours of fasting, which is consistent with the lack of changes we observed when macaques were either fed or fasted for 8 hours. Adedeji et al 1 described minimal increases in neutrophil counts after 8 hours of fasting only in females and minimal decreases in neutrophil counts in both sexes after 20 hours of fasting that were considered to be due to biological variation, although it was also noted that the decreased lymphocyte counts may be due to fasting-related stress at the 20-hour timepoint. Based on our findings, non-fasting should not have an effect on interpretation of hematology data in macaques.
Zeng et al 47 found that most changes in clinical pathology parameters occurred at or after 16 hours of fasting and did not note any alterations in triglyceride or glucose concentrations, even after 24 hours. Adedeji et al 1 reported that triglyceride concentrations were most variable in individual animals at shorter fasting time points (at 4 hours in males and at 4 and 8 hours in females), and suggested it could take up to 12 hours for gastrointestinal food digestion and absorption to be completed cynomolgus macaques. 1 We also did not observe changes in glucose concentration in the fed compared to fasted macaques, and Adedeji et al 1 reported a moderate decrease only after 20 hours of fasting. Zeng et al 47 did not detect any changes in total bilirubin concentration, whereas Adedeji et al 1 described a minimal increase after 20 hours of fasting in both sexes, and we noted a minor decrease in the fed compared to the 4-hour fasted macaques of both sexes. The higher total bilirubin concentrations in fasted versus fed macaques are likely due to increased bilirubin uptake by the liver due to fatty acid mobilization. 1 Finally, we observed a decreased phosphorus concentration in the fed compared with fasted macaques, whereas Zeng et al 47 did not report an increase in inorganic phosphorus concentration until 16 and 24 hours of fasting. Adedeji et al 1 also measured an increased phosphorus concentration, but not until after 12 hours of fasting. This change was postulated to be due to decreased glomerular filtration rate as a result of dehydration, 1 although we did not observe concurrent changes in hematocrit, urea nitrogen, or creatinine concentrations to support this in this study. Even after 20 hours of fasting, Adedeji et al 1 concluded that the differences observed in glucose, triglyceride, cholesterol, total bilirubin, and phosphorus concentrations were still well within the normal biological variation for these parameters in cynomolgus macaques. Similarly, our findings support that non-fasting should have minimal impact on interpretation of clinical chemistry findings in macaques.
For clinical chemistry, sample matrix can consist either of serum, collected after the blood clots, or heparinized plasma, collected with the addition of the anticoagulant heparin to prevent clotting. Both were assessed in this study because different laboratories may utilize different matrices. Sample matrix has a minor effect on a small set of clinical pathology parameters in rats and macaques (AST and CK activities and calcium, phosphorus, potassium, glucose, and globulin concentrations). Higher potassium and phosphorus concentrations in serum are consistently reported in humans and may reflect leakage from erythrocytes during blood clotting.21,25,28 Potassium is also released from platelets during the clotting process, further increasing its concentration in serum. 25 Sample matrix was generally found not to have an effect on enzyme activities in humans, although Doumas et al 10 observed minimally higher AST activity in plasma compared with serum and attributed it to being directly proportional to the concentration of heparin. Ladenson et al 21 also found minimally higher CK activity, although the potential mechanisms were not investigated. Lower total protein in serum was assumed to be due to the conversion of fibrinogen to fibrin during clotting, and lower calcium concentration could be explained by its role as a cofactor in the coagulation cascade. Based on these differences, serum and plasma samples should not be directly compared, especially for these six clinical chemistry parameters in rats and macaques regardless of fasting status.
Although both fed rats and macaques had increased triglyceride concentrations in our study, fasting status impacted sample quality measurements in rats, whereas it had little to no effect on sample quality in macaques. In fed rats, lipemia was observed more frequently in plasma compared with serum samples, whereas hemolysis was more frequent in serum compared with plasma samples. Fasting was successful at preventing lipemic samples in the rats in our study, and only one incidence of hemolysis was observed in a fasted rat serum sample, which is similar to what was reported in fasted rat serum samples by Waner and Nyska. 44 Fasting status did not have a similar effect on sample quality in macaques, which had only one mildly lipemic non-fasted plasma sample and no hemolysis of non-fasted samples. Conversely, there was a slightly higher incidence of both lipemia and hemolysis in the fasted macaque serum and plasma samples. Mismatches between the triglyceride concentrations and incidence of lipemia, particularly in the macaques, are thought to be due to differences in the types of lipoproteins present at the time of sample collection. If, for example, the triglycerides are primarily within very-low-density lipoproteins (VLDL) rather than in chylomicrons, the sample may not be lipemic despite a higher non-fasting triglyceride concentration. 33
The prevention of lipemia is a frequently cited reason in favor of collecting fasted samples since lipemia can cause interference in clinical chemistry assays through multiple mechanisms, including light scattering, differential partitioning of analytes between aqueous and nonpolar sample phases, and interaction of lipoprotein particles with assay reagents.11,44 This does not typically occur until lipemia is moderate or marked, and among rat samples in this study, only 1 of 40 serum samples and 4 of 40 plasma samples fit those criteria. For the Roche Cobas 6000 analyzer used in this study, standard clinical chemistry parameters are not affected until the lipemic index is 150, or a visual grade of 2+, at which time there may be a false decrease in ALT activity. 13 Most other parameters are unaffected or not affected until much higher lipemic indices. 16 Macaque samples did not have any lipemia severities above 1+. Therefore, lipemia in non-fasted rat and macaque samples is expected to have minimal impact.
An increased incidence of hemolysis can be seen in non-fasted samples secondary to lipemia increasing the fragility of RBC membranes, 26 although lipemia and hemolysis were only observed concurrently in two rat serum and three rat plasma samples. Only one incidence of hemolysis with a visual grade of 2+ or a hemolytic index between 200 and 299 mg/dL was observed in the serum a single fed female rat. This could potentially falsely increase potassium, AST, ALT, total bilirubin, and phosphorus, or falsely decrease ALP 13 ; however, animals without hemolytic samples had values for these parameters comparable with this individual. Therefore, hemolysis in non-fasted rat and macaque samples is also expected to have minimal impact.
One limitation of this study was the advanced age of the rats (24-32 weeks), whereas rats used on nonclinical studies are generally 6 to 10 weeks old at initiation of dosing. Given the directionally opposite findings in males and females or findings in only one sex in the rats used on our study, we consider whether these changes would be observed again if the study was repeated with younger rats. Some hematology and clinical chemistry changes that could be expected with age alone in rats include higher neutrophil counts, total protein, cholesterol, and triglyceride concentrations; and lower inorganic phosphorus concentration and ALP activity. However, these are not expected to differ substantially within the age range included in our study.2,46
Non-human primates can also have significant variability in age at initiation of treatment. Possible age-related changes in cynomolgus macaques can include higher triglyceride and lower phosphorus concentrations; however, these differences are most prominent when comparing 4- to 10-year-old macaques to macaques younger than 3 years of age. 24 The macaques in our study were all older than 4 years old, and the four randomly assigned groups (two for males and two for females) in the crossover design were generally balanced in age with the exception of one of the two groups of males, which contained animals who overall younger than those in the other groups. Since this group was statistically combined with the second male cohort for the fed and fasted states, age was further balanced and was not considered a confounding factor in our study. The low number of macaques included in this study was also a limiting factor but was mitigated by the two-period crossover design.
In summary, the data comparison studies between fasted and fed Sprague-Dawley rats and cynomolgus macaques demonstrated changes in hematology in rats and in clinical chemistry parameters for both rats and macaques. Clinical pathology data changes were considered to have a limited impact on the interpretation of standard parameters. Sample matrix (serum versus heparinized plasma) was also found to have a minor effect on a small number of clinical chemistry parameters. As clinical pathology and toxicology comparisons of study data are generally made with concurrent control and/or pre-treatment data from animals under the same feeding status (fed or fasted), there is minimal impact on data interpretation. However, reference intervals and historical control databases should be partitioned to reflect fasting status, and fasting is still recommended when there are anticipated effects on glucose and lipid metabolism or on endocrine systems related to energy metabolism.
Supplemental Material
sj-docx-1-tpx-10.1177_01926233261453322 – Supplemental material for Comparison of Standard Clinical Pathology Parameter Values in Fasted and Fed Rats and Non-human Primates
Supplemental material, sj-docx-1-tpx-10.1177_01926233261453322 for Comparison of Standard Clinical Pathology Parameter Values in Fasted and Fed Rats and Non-human Primates by Larissa Kipa, Tiffany N. Scott, Steve Denham and Angela Wilcox in Toxicologic Pathology
Supplemental Material
sj-docx-2-tpx-10.1177_01926233261453322 – Supplemental material for Comparison of Standard Clinical Pathology Parameter Values in Fasted and Fed Rats and Non-human Primates
Supplemental material, sj-docx-2-tpx-10.1177_01926233261453322 for Comparison of Standard Clinical Pathology Parameter Values in Fasted and Fed Rats and Non-human Primates by Larissa Kipa, Tiffany N. Scott, Steve Denham and Angela Wilcox in Toxicologic Pathology
Supplemental Material
sj-docx-3-tpx-10.1177_01926233261453322 – Supplemental material for Comparison of Standard Clinical Pathology Parameter Values in Fasted and Fed Rats and Non-human Primates
Supplemental material, sj-docx-3-tpx-10.1177_01926233261453322 for Comparison of Standard Clinical Pathology Parameter Values in Fasted and Fed Rats and Non-human Primates by Larissa Kipa, Tiffany N. Scott, Steve Denham and Angela Wilcox in Toxicologic Pathology
Supplemental Material
sj-docx-4-tpx-10.1177_01926233261453322 – Supplemental material for Comparison of Standard Clinical Pathology Parameter Values in Fasted and Fed Rats and Non-human Primates
Supplemental material, sj-docx-4-tpx-10.1177_01926233261453322 for Comparison of Standard Clinical Pathology Parameter Values in Fasted and Fed Rats and Non-human Primates by Larissa Kipa, Tiffany N. Scott, Steve Denham and Angela Wilcox in Toxicologic Pathology
Supplemental Material
sj-docx-5-tpx-10.1177_01926233261453322 – Supplemental material for Comparison of Standard Clinical Pathology Parameter Values in Fasted and Fed Rats and Non-human Primates
Supplemental material, sj-docx-5-tpx-10.1177_01926233261453322 for Comparison of Standard Clinical Pathology Parameter Values in Fasted and Fed Rats and Non-human Primates by Larissa Kipa, Tiffany N. Scott, Steve Denham and Angela Wilcox in Toxicologic Pathology
Supplemental Material
sj-docx-6-tpx-10.1177_01926233261453322 – Supplemental material for Comparison of Standard Clinical Pathology Parameter Values in Fasted and Fed Rats and Non-human Primates
Supplemental material, sj-docx-6-tpx-10.1177_01926233261453322 for Comparison of Standard Clinical Pathology Parameter Values in Fasted and Fed Rats and Non-human Primates by Larissa Kipa, Tiffany N. Scott, Steve Denham and Angela Wilcox in Toxicologic Pathology
Supplemental Material
sj-docx-7-tpx-10.1177_01926233261453322 – Supplemental material for Comparison of Standard Clinical Pathology Parameter Values in Fasted and Fed Rats and Non-human Primates
Supplemental material, sj-docx-7-tpx-10.1177_01926233261453322 for Comparison of Standard Clinical Pathology Parameter Values in Fasted and Fed Rats and Non-human Primates by Larissa Kipa, Tiffany N. Scott, Steve Denham and Angela Wilcox in Toxicologic Pathology
Supplemental Material
sj-docx-8-tpx-10.1177_01926233261453322 – Supplemental material for Comparison of Standard Clinical Pathology Parameter Values in Fasted and Fed Rats and Non-human Primates
Supplemental material, sj-docx-8-tpx-10.1177_01926233261453322 for Comparison of Standard Clinical Pathology Parameter Values in Fasted and Fed Rats and Non-human Primates by Larissa Kipa, Tiffany N. Scott, Steve Denham and Angela Wilcox in Toxicologic Pathology
Supplemental Material
sj-docx-9-tpx-10.1177_01926233261453322 – Supplemental material for Comparison of Standard Clinical Pathology Parameter Values in Fasted and Fed Rats and Non-human Primates
Supplemental material, sj-docx-9-tpx-10.1177_01926233261453322 for Comparison of Standard Clinical Pathology Parameter Values in Fasted and Fed Rats and Non-human Primates by Larissa Kipa, Tiffany N. Scott, Steve Denham and Angela Wilcox in Toxicologic Pathology
Supplemental Material
sj-docx-10-tpx-10.1177_01926233261453322 – Supplemental material for Comparison of Standard Clinical Pathology Parameter Values in Fasted and Fed Rats and Non-human Primates
Supplemental material, sj-docx-10-tpx-10.1177_01926233261453322 for Comparison of Standard Clinical Pathology Parameter Values in Fasted and Fed Rats and Non-human Primates by Larissa Kipa, Tiffany N. Scott, Steve Denham and Angela Wilcox in Toxicologic Pathology
Supplemental Material
sj-docx-11-tpx-10.1177_01926233261453322 – Supplemental material for Comparison of Standard Clinical Pathology Parameter Values in Fasted and Fed Rats and Non-human Primates
Supplemental material, sj-docx-11-tpx-10.1177_01926233261453322 for Comparison of Standard Clinical Pathology Parameter Values in Fasted and Fed Rats and Non-human Primates by Larissa Kipa, Tiffany N. Scott, Steve Denham and Angela Wilcox in Toxicologic Pathology
Supplemental Material
sj-docx-12-tpx-10.1177_01926233261453322 – Supplemental material for Comparison of Standard Clinical Pathology Parameter Values in Fasted and Fed Rats and Non-human Primates
Supplemental material, sj-docx-12-tpx-10.1177_01926233261453322 for Comparison of Standard Clinical Pathology Parameter Values in Fasted and Fed Rats and Non-human Primates by Larissa Kipa, Tiffany N. Scott, Steve Denham and Angela Wilcox in Toxicologic Pathology
Supplemental Material
sj-rtf-1-tpx-10.1177_01926233261453322 – Supplemental material for Comparison of Standard Clinical Pathology Parameter Values in Fasted and Fed Rats and Non-human Primates
Supplemental material, sj-rtf-1-tpx-10.1177_01926233261453322 for Comparison of Standard Clinical Pathology Parameter Values in Fasted and Fed Rats and Non-human Primates by Larissa Kipa, Tiffany N. Scott, Steve Denham and Angela Wilcox in Toxicologic Pathology
Footnotes
Acknowledgements
The authors appreciate the help of Karl Johnson, Shawnee Jensen, Leslie Myrhow, John Trousdale, Pat Lofy, and Stefanie McMaster for conducting the rat and non-human primate studies. The authors also thank Fred Morel for his assistance with the tabulation of data for this manuscript. The authors acknowledge Anne Provencher and Florence Poitout for their input and review of the manuscript.
Author Contributions
Authors contributed to conceptualization, formal analysis, visualization, and writing—review and editing (LK, TNS, SD, AW); writing—original draft (LK, TNS, AW); data curation and methodology (SD, AW); software (SD); project administration, supervision, validation, resources, data curation, and investigation (AW).
Declaration of Conflicting Interests
The author(s) declared no potential conflicts of interest with respect to the research, authorship, and/or publication of this article.
Funding
The author(s) received no financial support for the research, authorship, and/or publication of this article.
Ethical Considerations
Protocols for animal experiments were approved by the Institutional Animal Care and Use Committee of Charles River Laboratories, Nevada on March 1, 2022 (non-human primates) and April 21, 2022 (rats), in compliance with the National Institutes of Health guidelines for the care and use of laboratory animals. All animals were cared for in strict accordance with the Guide for the Care and Use of Laboratory Animals (NIH Publication No. 85-23, revised 1996).

Supplemental Material
Supplemental material for this article is available online.
References
Supplementary Material
Please find the following supplemental material available below.
For Open Access articles published under a Creative Commons License, all supplemental material carries the same license as the article it is associated with.
For non-Open Access articles published, all supplemental material carries a non-exclusive license, and permission requests for re-use of supplemental material or any part of supplemental material shall be sent directly to the copyright owner as specified in the copyright notice associated with the article.
