
Abstract
The implementation of transport infrastructure projects is a key priority of the Russian government. Large funds are allocated from the budget for road construction to ensure connectivity across the country’s regions. Evaluating their economic feasibility is a key step in managing transportation projects. A social discount rate is required to estimate the present value of net social benefits. This study aims to provide a reasonable methodology for estimating the social discount rate for long-term transport projects in Russia. To determine this rate, we use the social opportunity cost of capital approach (SOC) and the social rate of time preference approach (SRTP). For 0–30 years, we recommend SRTP = 3.2% in the general case and SOC = 7.4% to attract private funds. The confidence interval for the SRTP ranges from 1.7% to 4%. For 31–60 years, decision-makers should use 3.2%, and a zero-discount rate for the later period. The proposed solutions will be useful for other post-Soviet countries preparing large-scale infrastructure projects.
Introduction
Improving transport infrastructure is key to the successful economic development of all territories. Due to its large area, Russia is experiencing difficulties in ensuring regional economic coherence. In the previous decade, the government implemented a large-scale program, “Development of the Transport System (2010–2021)” to improve transport infrastructure (Ministry of Economic Development of Russia, 2021). Until the end of 2024, the large-scale national project “Safe and High-Quality Roads,” included an initiative to develop the federal highway network (Ministry of Transport of Russia, 2024). The government planned to develop the West-East and North-South transport corridors to ensure the economic connectivity of the territories (Ministry of Transport of Russia, 2024). Financing sources for the project included federal budget funds and extra-budgetary resources. Extra-budgetary financing was in the form of public-private partnerships, concessions, and attracting investors to the capital of special project companies. As transport projects require substantial funding, the costs and benefits must be carefully assessed. Benefits are expected to arise in both short- and long-term periods, while significant costs must be incurred up front. To estimate the net present value of the benefits from government investments, it is necessary to use the correct discount rate.
Since the first half of the 20th century, benefit-cost analysis has been actively applied to estimate government investments in Western countries. In Europe, the first application of a cost-benefit analysis was in the UK transport sector (Andersson et al., 2018). In 1999, the Russian Ministry of Economy approved general recommendations for estimating investment projects. However, it did not adequately reflect the issue of evaluating budget investments. During the Soviet era, there were recommendations for estimating investment projects. These recommendations addressed the issue of comparing the costs and benefits of investment projects over time. Presently, the implementation of the state’s investment policy, including transport infrastructure policy, suffers from a lack of methodological support for estimating the benefits and costs of projects. Government initiatives are implemented in the form of large-scale projects. No official recommendations exist for estimating the benefits of such initiatives or for choosing a social discount rate. Most project passports describe only target indicators and budget expenditures for project implementation, without estimating the net present value of the benefits. Interestingly, the values of the target indicators are regularly revised and adjusted to be less optimistic. The absence of official guidelines raises the question of the correct estimation of the social discount rate for public investment projects in Russia.
Approved methodological recommendations for the economic assessment of budget investments help the government systematize transport infrastructure policy and increase the transparency of investment decisions. These recommendations should describe the main methods for economic evaluation of the benefits and costs of projects and present a justified value for the discount rate. The discount rate should reflect the time preferences of society regarding budget spending. These guidelines will be useful tools for the Ministry of Transport and other government agencies.
Our article expands the benefit-cost analysis methodology using the example of transportation projects. We develop the social rate of time preferences (SRTP) approach and the social opportunity cost of capital (SOC) approach to evaluate Russia’s social discount rate. We propose a methodology for estimating the social discount rate for long-term infrastructure projects implemented in post-Soviet countries. There are ongoing discussions about the rate at which the long-term benefits and costs of projects are discounted. Recommendations vary depending on the country and industry in which the project is being implemented. This study’s conclusions may be useful for other countries investing in large-scale infrastructure projects.
Methods of Discounting in the Public Sector
There is an ongoing debate in the scientific literature about how to determine the social rate (Eden, 2023). Most researchers agree that the social discount rate should be positive (Lewandowsky et al., 2017). Official guidelines in different countries also recommend using a positive social discount rate. Recommendations provide values of 2%–4% for the risk-free social discount rate in European countries (Moore et al., 2017). Moore et al. (2017) systematized the risk-adjusted values of a social discount rate for several countries: 7% for the US; 8% for Australia, Canada, China, and South Africa; and 12% for India. Circular A-4 in the US also states a positive discount rate of 2%, which corresponds to the possible rate of government borrowing. The prior circular recommended rates of 3% and 7%, respectively (American Economic Association, 2025). Turan and Gurluk (2024) indicated that the rate for developed countries (3%–5%) was lower than that for developing countries (7.3%–15%).
Researchers have also discussed whether the rate should be the same for all projects in the country. As Moore et al. (2017, p. 304) stated, “Most governments recommend the use of a single social discount rate for all project appraisals.” In addition, multiple attempts have been made to calculate different social discount rates for government investments in various economic sectors. For example, the Green Book (HM Treasury, 2022) differentiated between the values of a social discount rate for health projects and projects in other economic sectors. The rate is 1.5% for health projects with a planning horizon of 0–30 years. For projects in other sectors, the rate is 3.5%. For a horizon of 31–60 years, the rates are 1.286% and 3%, respectively.
Originally, there were two main approaches to estimating the social discount rate: the SRTP and the SOC. Freeman et al.’s (2018) recommendations illustrated an ongoing debate on the best approach to social discount rate evaluation. The HM Treasury (2022) focused on the SRTP approach because it gives decision-makers a single value for all public sector investments in the country, regardless of whether the project has a competing alternative in the private sector. Ramsey (1928) introduced the SRTP approach, which has gained popularity among researchers. Previous research focused primarily on developed countries. At present, studies on this topic are available for developing countries. For example, a recent article by Daneshmand et al. (2018) provided an SRTP value of 5.8% for Iran. Akbulut and Seçilmiş (2019) estimated an SRTP of 4.41% for Turkey. Values for developed countries are somewhat lower. A comprehensive investigation by Groom and Maddison (2019, p. 1155) suggested a short-run SRTP value “of 4.5% declining to 4.2% in the very long-run” for the UK.
Ramsey’s formula is the following (HM Treasury, 2022): ρ: the rate of time preferences, estimated as the sum of the pure rate of time preferences and catastrophic risk; μ: the parameter of the utility function, estimated as the elasticity of the marginal utility of consumption with the opposite sign; g: the expected growth rate of real per capita consumption.

Moore et al. (2020) provided a modification of this formula concerning the variance of the growth rate of consumption:

Studies have suggested ranges of the most likely values for SRTP parameters. Harberger and Jenkins (2015, p. 25) argued that the elasticity of the marginal utility of consumption is typically in the range 0.5–2. Groom and Maddison (2019) proposed an elasticity estimate of 1.5 for the UK, which was higher than the official Green Book (HM Treasury, 2022) recommendation of 1. Nesticό and Maselli (2020) reported 1.34 for Italy and 1.33 for the USA. The growth rate of real per-capita consumption (g) also varies depending on the country under consideration. For example, Moore et al. (2020) estimated SRTP values for Latin American countries and found that the parameter (g) ranged from 1.14% for Paraguay to 3.96% for Chile. Nesticό and Maselli (2020) reported values of 1.31% for Italy and 2.71% for the USA. The Green Book (HM Treasury, 2022) recommended a value of 2% for the UK. Most authors agree that the pure rate of time preferences should be zero. This assumption is based on Ramsey’s (1928) argument that it is impossible to reliably predict whether the future generation will be better or worse off than the current generation. Therefore, no consumption preferences should be made in either generation. An example of empirical work based on the same approach is Bula and Foltyn-Zarychta (2023), who provided SRTP estimates for Central and Eastern European countries. Typically, catastrophic risk, measured by the overall death rate, is approximately 1% (HM Treasury, 2022). As a rule, the SRTP values recommended for different countries do not exceed 5% to 6% in real terms.
The SOC was first introduced by Marglin (1963) and Baumol (1968). This approach should be used when government intervention involves competition between private and public funds for project implementation. Estimating the opportunity cost of public investment allows decision-makers to avoid underestimating the desired return and, hence, the displacement of private investments. The European Investment Bank provides the following formula for the SOC (European Investment Bank, 2023, p. 48): α: the proportion of funds displaced from private-sector investment; ROI: the private-sector rate of return on investment; β: the proportion of funds made available through foregoing consumption; CRI: the after-tax return on savings; γ: the proportion of funds attracted through increased foreign borrowing; FB: the interest rate on foreign debt.

Another way of applying the social opportunity capital approach is to determine the shadow price of capital. The formula for determining SOC is as follows (Kossova & Sheluntcova, 2016): SPC: shadow price of capital (the present value of the effects created by the initial investment); SRTP: the social rate of time preferences; i: the rate of return on private capital; f: the fraction of an annual depreciation in the capital stock; s: the reinvested fraction of the gained return.

The SOC value in formula (4) strongly depends on the rate of return on private capital. When the return on private equity is low, private investment is unlikely to be implemented. The SRTP should be used to estimate a project that can be financed only from the budget, and there is no issue with the displacement of private investment.
The social discount rate might also be estimated as the cost of government borrowing (Council of Economic Advisers, 2017). Burgess (2018) argued that the social opportunity cost of borrowed funds is the best measure of the social discount rate. The advantage of this approach is that “no social welfare function needs to be specified, and therefore no welfare judgments need to be made” (Burgess, 2018, p. 5).
Usually, SOC estimates are higher than SRTP estimates. Foltyn-Zarychta et al. (2021) noted that SOC values are typically in the range of 6%–8% for developed countries. Burgess and Zerbe (2011) reported the same value for the US. Abelson and Dalton (2018) indicated that the SOC value for any project in Australia should be 6.5%. Boardman et al. (2018) reported SOC values of 6%, 8%, and 10% for Chile, Canada, and Mexico, respectively.
A key feature of transportation infrastructure projects is their long-term nature. Their “benefits will be provided to numerous users for many years into the future” (Andersson et al., 2018, p. 121). To estimate a project’s residual value, “a declining or hyperbolic rate should be explored” (Jones et al., 2014, p. 406). Freeman and Groom (2016) and Lewandowsky et al. (2017) considered the problem of long-term discounting and the possibility of making the benefit-cost analysis less targeted in the short term. The Green Book (HM Treasury, 2022) recommended a constant SRTP of 3.5% over 30 years. Subsequently, the rate gradually decreases as the project planning horizon increases. “The maximum life span of an intervention is assumed to be up to 60 years” (HM Treasury, 2022, p. 118). Circular A-4 also suggested that long-term discount rates should gradually decrease “from 2.0% for effects in 2023–2079, to 1.1% for effects in 2164–2172” (American Economic Association, 2025).
Hansson et al. (2016) described decisions in infrastructure policy and the choice of the social discount rate in Sweden. The discount rate for infrastructure policy was 4%. However, the 2014 recommendations provided a value of 3.5%. When estimating the initiative from a business perspective, a rate of 6%–7% was applied (Hansson et al., 2016). “Although the expected lifetime of built structures such as bridges and roads is at least 100 years, the economic analyses of the Swedish Transport Administration typically have a time horizon of 40 years” (Hansson et al., 2016, p. 60) because of “uncertainties of technological development” and difficulties with predicting “the role of roads for transportation within a 70–80-year time horizon” (Hansson et al., 2016, p. 61). In this context, Hultkrantz et al. (2014) recommended using a higher social discount rate for transport infrastructure investments in Sweden. They argued that “the social discount rate should be between 5 and 6 percent and decline with not more than 50 interest rate points during the time horizon of a typical road or rail infrastructure investment” (Hultkrantz et al., 2014, p. 79). Goldmann (2017) estimated social discount rates for transport infrastructure planning in Germany, observing a social discount rate of approximately 3.5%. This declines to 2.7% after 50 years. In the latter period, it ranges between 2% and 1.3%.
In Russia, there are no official guidelines for benefit-cost analyses with a determined value of the social discount rate. In the literature, one example assessed the construction of infrastructure facilities for the 2014 Winter Olympic Games in Sochi. The authors applied a benefit-cost analysis and used a discount rate of 6.5%, which was the sum of the base rate for estimating government investments in the US and the country’s risk premium (Pilipenko, 2011, pp. 69–70). Such a calculation requires careful justification, especially in terms of the country’s premium for the risk of implementing public investment. Therefore, it is important to develop existing approaches for evaluating the social discount rate for Russia. The urgency is reinforced by the active implementation of transport projects that require a reasonable assessment.
Results of Evaluating the Social Discount Rate for Transport Projects in Russia
To evaluate SRTP for Russia, we use Ramsey’s formula (1). The first controversial component is the pure rate of time preference. We follow Pearce and Ulph (1995) and Armitage (2017) and use a zero pure rate of time preference. With a zero rate of time preference, we do not assign the consumption preferences to any generation. Catastrophic risk suggests that comprehensive catastrophic events will prevent the generation of benefits from the project. This risk was assessed as the crude death rate (Akbulut & Seçilmiş, 2019; Lopez, 2008; Pearce & Ulph, 1995).
The elasticity of marginal utility of consumption (μ) can be estimated using the personal taxation model (Moore et al., 2020), the demand-for-food model (Akbulut & Seçilmiş, 2019), or the savings method (Pearce & Ulph, 1995; Stern, 1977). These methods have been described by Percoco (2008), Lopez (2008), Arrow et al. (2014), Groom and Maddison (2019), and others. The application of the savings method in Russia was described in detail in an article by Kossova and Sheluntcova (2014). The personal taxation model is not applicable because Russia’s taxation system is not progressive. In this article, we estimate elasticity with the demand for food model (Akbulut & Seçilmiş, 2019): D: food demand; А: constant;Y: income; P
1
: the food price index; P
2
: the non-food price index; e1: income elasticity; e2: price elasticity.
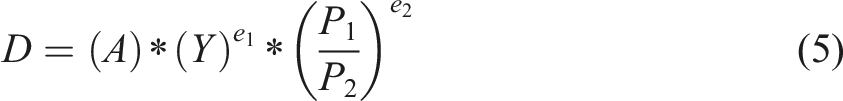
The elasticity of marginal utility of consumption requires estimating compensated price elasticity instead of total elasticity (Akbulut & Seçilmiş, 2019):

To estimate model (5), we take the logarithm and use a panel data model with fixed effects: D
it
: food spending in constant prices; Y
it
: average per capita monetary income of the population in constant prices; P
1it
: food price index; P
2it
: non-food price index; α
i
: an individual fixed effect of a region; ε
it
: normally distributed random error.

Estimating the demand for food model
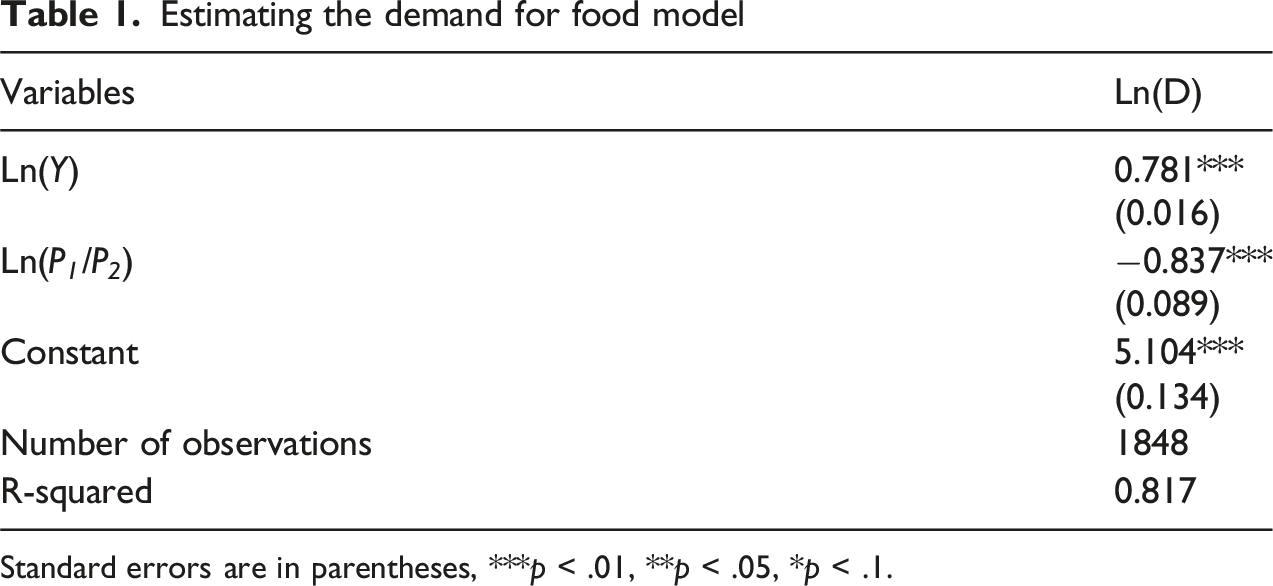
Standard errors are in parentheses, ***p < .01, **p < .05, *p < .1.
All the estimated coefficients are significant at the 1% level. The elasticity of marginal utility of consumption is the following:
Therefore, the parameter of the utility function (μ) equals 0,69.
Forecasting the expected growth rate of real per capita consumption (g) is difficult because of uncertainty in the country’s future economic development. It is inappropriate to use the average growth rates for the period 2000–2023. Instead, we use simple exponential smoothing, in which the greatest weight is given to the most recent observations (Hyndman & Athanasopoulos, 2021):
STATA 17 software provides the optimal exponential coefficient equal to 0.2516. Thus, the expected consumption growth rate (g) is 3.2%. For the same period, the average growth rate of real per-capita consumption is 5.5%.
Similarly, simple exponential smoothing provides the expected value of the death rate (ρ = L) equal to 1.21%. The value of SRTP is calculated as follows:
Using formula (2), we consider the variance in the growth rate of real per capita consumption as follows:
This rate is the base rate for estimating all public sector projects in Russia.
To derive a confidence interval for SRTP, we use an analog of the bootstrap under the assumption of independence of SRTP parameter estimates. This assumption is necessary because we estimate independent models for different SRTP parameters; hence, we cannot determine the correlation between them. We implement the following procedure: − We generate 1000 “replicas” for each SRTP parameter. To do this, we take the estimates of the SRTP parameter values from models (7) and (8), as well as their standard errors (SE). We use a random variable generator with a normal distribution, where the mathematical expectation equals the obtained estimate of the SRTP parameter, and the variance equals the square of SE. Using Ramsey’s formula (1), we obtain 1000 “replicas” for SRTP. − We discard the largest 2.5% and smallest 2.5% of values and obtain a confidence interval for the SRTP value.
Finally, the confidence interval for SRTP is from 1.7% to 4%.
The second approach concerns SOC. Formula (3) is difficult to apply because there are no recommendations on how to generally determine the proportion of funds displaced from private-sector investment and the proportion of funds made available through foregoing consumption. Therefore, we use formula (4). The data source is the Federal State Statistics Service of Russia (2025) for the period 2000–2023. According to formula (4), we should define the rate of return on private capital (i), the fraction of annual depreciation in the capital stock (f), and the reinvested fraction of the gained return (s). The Federal State Statistics Service of Russia provides information on enterprises’ financial results, data on changes in fixed assets for the year, and investments. These indicators are available for the entire country and for different economic sectors. The SOC calculations for Russia are as follows:
This SOC value is relevant for the general estimation of government investment projects with the participation of private capital. As an example, we consider the construction sector because private capital is often specifically attracted to the construction of roads and infrastructure. The rate of return on private capital is 16% for the construction sector. The depreciation rate is 5%, and the reinvestment rate is 13.7%. All values are estimated as averages for the given period. Using this methodology, we obtain a value of 7.4% for building transport infrastructure: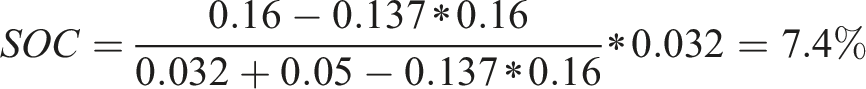
In Russian practice, the participation of private businesses in the implementation of transport projects takes place only within a horizon of 0–30 years. Private firms do not invest over long periods. There is no problem with the displacement of private investment by public investment after 30 years after the start of a project. We assume that there is no need to predict the SOC for the long-term horizon.
Social discount rate for long-term transport projects
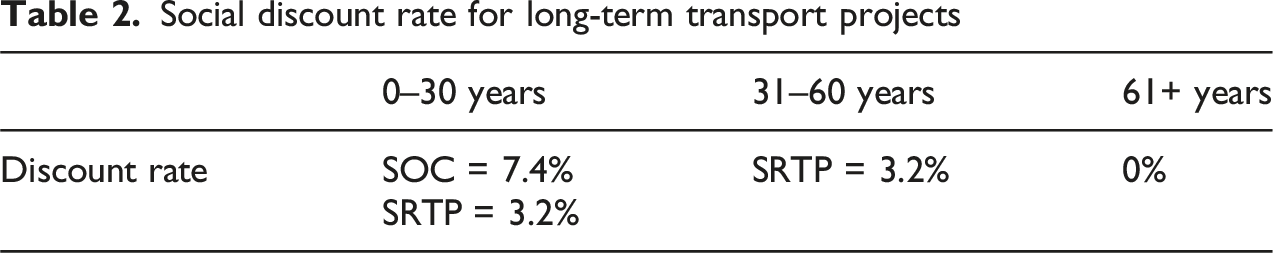
The first interval of 0–30 years is a standard short-time interval fixed in official guidelines for project appraisal, such as The Green Book (HM Treasury, 2022). We follow the Commission Delegated Regulation (EU) and use the 30-year time interval for railway and road projects (European Union official website, 2025). At this time interval, private capital participation is likely; therefore, we propose two possible discount rate values: SRTP and SOC. We then aim to capture the moment when the current taxpayers’ generation is succeeded by the next generation. We assume that this occurs 60 years from now. Recent data from the Federal State Statistics Service of Russia showed that the life expectancy at birth was 73.4 years for both sexes in 2023, specifically 78.7 years for females and 68 years for males (Federal State Statistics Service, 2025). The age of majority in Russia is 18 years, and young people may enter the labor market at this age. Even the youngest members of the current taxpayer population will not benefit from the project 60 years from now. The benefits that arise 60 years from now are those that the current generation passes on to the next. Using a zero discount rate for the period of 60+ means that we equalize, in time, the significance of the benefits that will arise in 60 years and the benefits of later periods. For example, the benefits of year 61 and all subsequent years will be discounted using a multiplier
Discussion and Implications for Post-Soviet Countries
The economic appraisal of transport projects for developed countries is facilitated by the existence of guidelines that describe the steps of cost-benefit analysis necessary for project estimation. Examples include the Green Book in the UK (HM Treasury, 2022) and the Economic Appraisal of Investment Projects (European Investment Bank, 2023). These guidelines provide methods for assessing the benefits and costs of transport projects, such as traffic forecasting, valuing travel time and time savings, and evaluating environmental impacts. They also include a ready-to-use value for the social discount rate. Decision-makers can apply the recommended discount rate directly in economic analyses without additional estimations.
In addition to official recommendations for developed countries, studies have provided examples of estimating transport infrastructure projects. Andersson et al. (2018) presented cases for estimating transportation infrastructure projects in Sweden and Norway. Along with details of estimating benefits and costs, the authors indicated the discount rate values for economic analysis. In Sweden, a rate of 3.5% was based on the Ramsey equation. In Norway, the Norwegian Road Administration recommended a 4% rate declining over the project lifetime. This value was based on Weitzman’s approach and is close to the average return on equity. This rate is relevant for projects with a lifecycle of 40 years or more (Andersson et al., 2018).
As noted earlier, Russia and post-Soviet countries do not have official guidelines for implementing cost-benefit analysis for public sector investments. However, the need for this type of analysis is significant because budgetary allocations require a reliable assessment of all resulting benefits and costs. Along with Russia, Uzbekistan and Kazakhstan are successors of the Soviet Union. 30 years ago, they had a similar system for planning and implementing government projects. However, the independent development of these countries has caused differences in the institutional environment and approaches to managing public sector projects. Nowadays, Russia and other post-Soviet countries face similar challenges in developing their transport infrastructure. Kazakhstan and Uzbekistan are also planning to use their territories as transit routes. Additionally, Uzbekistan does not have direct access to international seaports; therefore, the development of new railway routes is particularly important. We analyze Kazakhstan and Uzbekistan because they are ready to co-finance large infrastructure projects, rather than relying solely on financial subsidies from wealthier countries such as China. If budgetary funds are planned for project implementation, the time preferences of the populations of these countries must be considered in the economic analysis.
The government of Uzbekistan plans to finance the construction of railways that should become part of the corridor from China to Europe. This is important for Uzbekistan, because the transport corridors of the Soviet period were mainly oriented to the north. Priority is given to the development of railways because they bring the greatest return. However, automobile roads are also being actively developed. The President approved the Strategy for the Development of the Transport System of the Republic of Uzbekistan until 2035. Before the adoption of the transport development strategy, the modes of transport were developed in isolation from each other. Until 2019, there was no single authorized government body represented by the Ministry of Transport, which would be responsible for the development and implementation of a unified transport policy in Uzbekistan. Among the challenges of investment management, the authors of the strategy indicated weaknesses in the long-term forecasting and planning system of the transport industry, problems of tariff formation in transport, and issues in the personnel training system (Government Portal of the Republic of Uzbekistan, 2024). At present, estimated investment parameters are published several years ahead. However, no methodology exists to evaluate project performance in open access. An external user can only find a methodology for evaluating the performance of a state agency, such as a road transport agency. This is a point system, in which the agency is awarded points based on criteria such as the opening of new passenger routes, construction and reconstruction of passenger bus stations, and volume of export-import cargo. The government also monitors indicators, such as staff turnover reduction, growth in the number of industrial workers who have improved their skills, and the level of licensing coverage of activities related to the transportation of passengers and goods on a commercial basis (Cabinet of Ministers of the Republic of Uzbekistan, 2018).
Kazakhstan also has the opportunity to participate in the formation of Eurasian corridors (Sultanov et al., 2019). At present, the government is implementing a large-scale Infrastructure Development Program “Nurly Zhol” (Ministry of Industry and Infrastructure Development of the Republic of Kazakhstan, 2024). The program involves the large-scale construction and reconstruction of roads, as well as the growth of road and rail transit. The first phase of the program was implemented from 2015 to 2019, with an extension until 2025. As in Uzbekistan, the program emphasizes the creation of many jobs. The target indicators include capital investment growth and labor productivity. The program’s passport specifies its sources of investment and volumes of financing. However, the target indicators are not measured in monetary terms. For example, they include the proportion of roads in good and satisfactory condition or the average daily speed of transit container trains along the China–Europe route (Ministry of Industry and Infrastructure Development of the Republic of Kazakhstan, 2024). Overall, project performance is evaluated by monitoring the target indicators and adherence to the investment schedule.
Attracting investment is one of the most important tasks for governments in post-Soviet countries. In Russia, Kazakhstan, and Uzbekistan, national governments are improving the availability of information to external users. This is achieved through special websites such as “Open Data Portal” in Uzbekistan, “Electronic Government” in Kazakhstan, and “Open Government” in Russia. The progress of project implementation and adjustments introduced into the project design are partially available to external users. Information on the expected benefits of the project is either unavailable or has not been described in detail. As a rule, governments only disclose data on proposed budget expenditures and the amount of private investment attracted. For Russian transport projects, external users can determine the detailed costs by year of project implementation. Kazakhstan is also making progress toward increasing project management transparency as the government publishes project passports with target indicators and budget expenditures. It is easy to identify the agencies responsible for project implementation. In Uzbekistan, emphasis has shifted toward assessing the performance of the state agency responsible for the implementing the project rather than evaluating the effectiveness of the project itself. Overall, project evaluation can be performed more accurately in post-Soviet countries. It is also important to consider the long-term nature of infrastructure projects and carefully compare expected benefits and expenditures.
Conclusion
The construction of high-quality automobile roads is a national priority in Russia. The development of transportation infrastructure occurs through the implementation of investment projects, both at the public expense and with private capital participation. Project management in the public sector involves using a social discount rate to evaluate alternative investments and monitor project implementation. Determining the value of the social discount rate is extremely important, as it increases transparency in decision-making process and strengthens decision validity.
This study presents a methodology for estimating the social discount rate for long-term infrastructure projects. We follow existing recommendations for applying a constant social discount rate for 30 years. For this period, a rate of 3.2% to 7.4% should be used to estimate transport infrastructure projects in Russia. A rate of 3.2% (SRTP) is appropriate for projects financed only by budgetary funds. The confidence interval for the SRTP ranges from 1.7% to 4%. A rate of 7.4% (SOC) should be used for projects that can attract private funds, such as the construction of automobile roads. For the 30- to 60-year interval, the rate should be lower to avoid underestimating future benefits. In addition, there is no risk of private investment displacement beyond 30 years in Russia. We recommend using an SRTP of 3.2% for the 31- to 60-year horizon. For projects with a horizon of 61+ years, we recommend a zero discount rate. This ensures that at least 10% of the remote net effects of investments are accounted for. The estimated social discount rate values for transport investment projects in Russia are higher than those recommended for infrastructure policy in Sweden (4%) (Hansson et al., 2016) and Germany (3.5%) (Goldmann, 2017).
The most important limitation of the SOC method is the availability of information on the rate of return on equity, reinvestment rate, and depreciation rate for different economic sectors. If this information is unavailable, the SRTP approach should be used to determine the social discount rate. When the rate of return on private capital is low, the displacement of private investment is unlikely, and the SRTP should be used in project estimation. Future research may involve developing a methodology to estimate the social discount rate for projects implemented with the participation of several countries. These can be large infrastructure projects with long lifecycles. For such projects, the social discount rate should account for the proportion of capital attracted from different countries and the distribution of project benefits.
Thus, global practice in assessing transport infrastructure projects is not limited to initiatives in developed countries. Today, developing countries actively participate in implementing transport investments. The projects under consideration cover several countries and regions, particularly in Asia. Countries planning such large-scale projects still rely on their own economic and financial assessment systems, which are not transparent to external users. The availability of open, accessible, and understandable recommendations for the economic evaluation of such projects could help increase public confidence in government decisions. A clear methodology for estimating investment projects also increases the likelihood of attracting private capital through public-private partnerships. The social discount rate is a key parameter in public sector project appraisal. Determining a method for estimating the social discount rate in official recommendations will help prevent manipulations in evaluating the economic efficiency of projects and improve the quality and validity of assessments.
Footnotes
Funding
The authors received no financial support for the research, authorship, and/or publication of this article.
Declaration of Conflicting Interests
The authors declared no potential conflicts of interest with respect to the research, authorship, and/or publication of this article.