
Abstract
Frailty, a relatively unexplored concept among vulnerable populations, may be a significant issue for homeless adults. This cross-sectional study assessed correlates of frailty among middle age and older homeless adults (N = 150, 40-73). A Pearson (r) bivariate correlation revealed a weak relationship between frailty and being female (r = .230, p < .01). Significant moderate negative correlations were found between frailty and resilience (r = −.395, p < .01), social support (r = −.377, p < .01), and nutrition (r = −.652, p < .01). Furthermore, Spearman’s rho (rs) bivariate correlations revealed a moderate positive relationship between frailty and health care utilization (rs = .444, p < .01). A stepwise backward linear regression analysis was conducted and in the final model, age, gender, health care utilization, nutrition, and resilience were significantly related to frailty. Over the next two decades, there is an anticipated increase in the number of homeless adults which will necessitate a greater understanding of the needs of this hard-to-reach population.
Homeless populations are aging in the United States (Hahn, Kushel, Bangsberg, Riley, & Moss, 2006) and evidence suggests will double by 2050 (Sermons & Henry, 2010). In San Francisco, nearly 33% of the homeless population were above 50 years of age (Hahn et al., 2006) and in Los Angeles, nearly one quarter of the 51,000 homeless adults were 55 to 61 years of age (Los Angeles Housing Services Administration [LAHSA], 2011).
Population aging may be associated with clinical geriatric disorders, namely, frailty, wherein an accumulation of deficits (Rockwood & Mitnitski, 2007; 2011); in physical, psychological, and social domains may lead to adverse outcomes such as disability and mortality (Gobbens, van Assen, Luijkx, & Schols, 2012). Among homeless persons in particular, adverse life events such as trauma (Hamilton, Poza, & Washington, 2011), drug and alcohol abuse (Fountain, Howes, Marsden, Taylor, & Strang, 2003), incarceration (Greenberg & Rosenheck, 2008), along with physical and mental health conditions (Brown, Kiely, Bharel, & Mitchell, 2012; Fazel, Khosla, Doll, & Geddes, 2008; Nyamathi et al., 2011), may likewise place this population at greater risk for frailty, and adverse outcomes such as hospitalizations, incident falls, and premature mortality (Fried, Ferrucci, Darer, Williamson, & Anderson, 2004; Puts, Lips, Ribbe, & Deeg, 2005).
In a homeless community that has a high burden of disease and disabilities, identifying frailty among an already vulnerable population may help us to understand these interrelationships. Thus, the purpose of this study is first to identify correlates of frailty among homeless adults and discuss these initial findings and implications.
The concept of frailty has been aptly debated in the literature for decades; more recently, it has been defined as a decline in multiple physiological systems, a geriatric syndrome (Gielen et al., 2012), or a nonspecific state of vulnerability (Fulop et al., 2010). There is extensive literature to operationalize frailty measures based on conceptual differences (Fried et al., 2001; Searle, Mitnitski, Gahbauer, Gill, & Rockwood, 2008). Two popular schools of thought predominate the literature; one identifies frailty as a clinical syndrome with specific hallmark characteristics (Fried et al., 2001), whereas others define frailty as an accumulation of deficits that include symptoms, signs, and disease classifications, often leading to adverse outcomes (Mitnitski, Mogilner, MacKnight, & Rockwood, 2002). Based on the Fried phenotype, prefrailty is presence of two out of five frailty signs (shrinking, weakness, exhaustion, slowness, low activity, whereas frailty is the presence of at least three or more of those signs (Fried et al., 2001).
Frailty prevalence rates differ based on the populations tested and the operational definition utilized. In a study of relative fitness of individuals in Canada across the life span (N = 14,713, 15-102 years of age), findings revealed that 7.2% of the population was frail at baseline and the frail segment was more likely to be hospitalized when compared with their nonfrail counterparts (Rockwood, Song, & Mitnitski, 2011). In another population-based study using a modified frailty index (FI) among older Mexican Americans, 37.1% of the population was frail, 33.3% of the population was pre-frail and 29.6% of the population was not frail (Aranda, Ray, Snih, Ottenbacher, & Markides, 2011). Another study found that the prevalence of frailty was nearly 7% among community dwelling older adults (Fried et al., 2001), and when applying the same criteria to a Boston-based homeless sample, aged 50 to 69 years, the frailty prevalence was 16% (Brown et al., 2012).
Understanding frailty among homeless population necessitates clarification regarding frameworks as previous models have described clinical pathways of frailty such as underlying alterations, clinical features, and adverse outcomes (Fried & Walston, 2003). Furthermore, some focus on age-related physiologic changes, which include sarcopenia, neuroendocrine dysregulation, and immune dysfunction (Fried & Walston, 2003). Some aspects that are lacking in the literature include a guiding framework for homeless and otherwise vulnerable populations.
Frailty Framework Among Vulnerable Populations (FFVP)
The FFVP is a modification of the Integral Conceptual Model of Frailty (ICMF; Gobbens et al., 2012), the Working Frailty Framework model (Bergman et al., 2004), the vulnerable populations model (Flaskerud & Winslow, 1998), and biological models of frailty (Fried & Walston, 2003). The FFVP is the theoretical framework that has evolved from empirical research and consultation from frailty experts (R. Gobbens, personal communication, September 23, 2012) in an effort to characterize situational, health-related, behavioral, resource, biological, and environmental factors which contribute to physical, psychological, and social frailty domains and ultimately contribute to adverse outcomes such as disability, hospitalization, health care dependency, and death.
In this model, situational variables included race/ethnicity, gender, income, education, marital status, physical, sexual, verbal victimization, and homelessness. Behavioral factors such as drug and alcohol use may likewise be significant issues among this population (Nyamathi, Hudson, Greengold, & Leake, 2012; Nyamathi, Leake, & Gelberg, 2000) affecting health-related factors and increasing health care utilization (Hahn et al., 2006; Stein, Andersen, Robertson, & Gelberg, 2012). Resource factors include resilience which may influence the aforementioned antecedents. The domain of frailty is composed of physical, psychological, and social domains, which may impact each other. Physical frailty may encompass slow walking, decreased grip strength, and an overall decline in physical functioning, whereas psychological frailty may be composed of a decline in cognition, and coping, all of which may affect physical and social frailty. Alternatively, social frailty may affect physical and psychological frailty. Adverse outcomes of frailty included disability, hospitalization, health care dependency, and premature mortality.
Investigators have noted that homeless populations have a substantial disease burden (Garibaldi, Conde-Martel, & O’Toole, 2005). Health conditions related to aging, namely, chronic health conditions (Garibaldi et al., 2005), depression, and disabilities are all significant issues (LAHSA, 2011). Furthermore, visual and hearing impairment, functional limitations, and cognitive impairments (Brown et al., 2012) may likewise place older adults at greater vulnerability.
Research suggests that food insecurity is a formidable challenge among homeless populations, compromising nutrient intake due to lack of sufficient food (Dachner & Tarasuk, 2002). Baggett et al. (2011) studied food insufficiency and health service utilization among a national sample of homeless adults and found that 25% did not get enough to eat. In addition, among those who were chronically homeless, prevalence of food insufficiency was 45.5% and 37.5% among those who had been physically or sexually abused in the past year (Baggett et al., 2011). Food insufficiency was similarly linked to increased health care utilization; in particular, those who were food insufficient were more likely to be hospitalized in the last year when compared with those who were not food insufficient (46.3% vs. 30.3%; Baggett et al., 2011).
Poor social support has been linked to increasing frailty (Woo, Goggins, Sham, & Ho, 2005). Research indicates that homeless populations can similarly be socially isolated (Hwang et al., 2009). One study focused on multidimensional social support among homeless adults (N = 544) in Canada and differences were noted between perceptions of support versus actually receiving support. In particular, 62% perceived access to financial support, 51% perceived access to instrumental support, and 60% perceived access to emotional support; however, only 7% were accompanied to a health care provider by a family or friend (Hwang et al., 2009). Understanding the influence of social support and frailty among homeless persons will enable a greater understanding of the dimensional and intersecting relationships.
Frail adults and homeless adults utilize a large majority of health care services. Hahn et al. (2006) studied aging trends more than 14 years among homeless adults (N = 3,534) and found that median age increased, along with emergency department visits (p = .01), staying overnight in a hospital (p < .001), and mental health hospitalization (p < .001). Authors assert that due to aging, chronic health conditions will be predominant among homeless adults (Hahn et al., 2006). Furthermore, women have been found to be frailer when compared with men (Garre-Olmo, Calvo-Perxas, Lopez-Pousa, de Gracia Blanco, & Vilalta-Franch, 2013; Goggins, Woo, Sham, & Ho, 2005; Syddall et al., 2010). While chronological age may serve as a proxy of a person’s vulnerability to frailty (Bergman et al., 2007), in effect, age often becomes a principal risk factor for disease. Seminal authors have indicated that homeless populations age prematurely, in fact, generally 10 to 20 years older than their chronological age (Gelberg, Linn, & Mayer-Oakes, 1990).
Prolonged exposure to stress may induce premature aging (Epel et al., 2004) described as weathering, which may be of significant concern for those living in poverty (Geronimus et al., 2010; Geronimus, Hicken, Keene, & Bound, 2006), homeless, and on the streets. One author compared immune markers of homeless (n = 40) and nonhomeless housed counterparts (n = 40) in Spain and found that when compared with nonhomeless counterparts, homeless adults had impaired interleukin-2 and lower plasma total antioxidant capacity (Arranz, de Vicente, Munoz, & De la Fuente, 2009). Homeless adults may have altered immune systems and increased oxidative stress (Arranz et al., 2009). One biological marker, telomere length, may serve as an indicator of cellular senescence and may be affected by consistent stress activation (Epel et al., 2004; Kotrschal, Ilmonen, & Penn, 2007). Some data suggest that telomere length is affected by chronic stress in socially and economically vulnerable adults (Geronimus et al., 2010).
On the basis of existing empirical literature, we hypothesized that there would be a positive relationship between frailty and (a) chronological age, (b) length of time homeless, (c) health care utilization, (d) illicit drug use, and (e) women would be more frail when compared with men. We also hypothesized (f) an inverse relationship between resilience, (g) nutrition, and (h) social support and frailty.
Method
Design
In this cross-sectional study, homeless adults from Los Angeles were enrolled and administered a survey designed to assess correlates of frailty. The study was approved by the University Human Subjects Protection committee, with data collected from February to May 2012.
Sample
The sample included 150 homeless adults; based on the power analysis, this would allow detection of a small to medium (.22) effect size at an alpha of .05 and power of .80. Participants who were eligible for the study if they were (a) aged 40 or above, (b) free of evidence of acute psychotic hallucinations and psychosis, (c) English-speaking, and (d) considered homeless. “Homeless” was operationally defined as an individual who lacks a fixed, regular, and adequate nighttime residence, and who has a primary nighttime residence that was a supervised publicly or privately operated shelter designed to provide temporary living accommodations (United States Department of Housing and Urban Development, 1995). Participants were recruited from three participating homeless day center drop-in sites on skid row and one residential drug treatment (RDT) facility, which provides temporary shelter for homeless adults on parole or probation within the same perimeter.
Procedure
The principal investigator (PI) established partnerships with the research sites, and upon obtaining human subjects institutional board approval, flyers were posted in common areas at the sites. The PI made frequent announcements in the research sites during the recruitment period. In total, 313 homeless adults showed interest and approached the PI in a private and confidential area of each respective agency. If interest continued, a brief screening questionnaire was administered by the PI to assess birth year, homeless status, and sleeping arrangements in the previous night. If determined eligible, the PI set an appointment with the potential participant and subsequently completed informed consent in a quiet screened area of the facility. The PI administered the questionnaires and other assessments; sessions lasted approximately 1 hr and 30 min. At the end of the session, each participant was compensated with a US$25 gift card that could be utilized at a neighboring food vendor.
Instruments
The instrumentation was composed of measures chosen based on the FFVP and selected empirical data linking situational, behavioral, health-related, and resource factors.
Situational Factors
Sociodemographic data were obtained related to chronological age, gender, birthplace, race/ethnicity, educational history, marital status, education, current monthly income, number of times homeless in their lifetime, living arrangements, and length of time homeless.
Health-Related Factors
Comorbid conditions were assessed using the self-reported comorbidity index (SCQ) for medical conditions, treatment, and physical limitations (Sangha, Stucki, Liang, Fossel, & Katz, 2003). The total problem subscale consisted of 13 questions and two open-ended spaces. Responses were coded as “yes/no” along with the presence of a condition. Higher numbers meant higher comorbid scores. The alpha coefficient for the total problem score was .91 in this sample.
Depressive symptomology was assessed using the Center for Epidemiologic Scale (CES-D; McDowell, 2006; Radloff, 1977). The scale consisted of 20 items with a 4-point response scale; responses ranged from “rarely or none of the time” to “most of the time.” Items 4, 8, 14, and 16 were reverse scored. Scores of ≥16 indicates a need for psychiatric evaluation for depressive symptoms (Weissman, Sholomskas, Pottenger, Prusoff, & Locke, 1977). The alpha coefficient for the CES-D in this sample was .89.
Physical functioning was assessed using the Medical Outcomes Study (MOS) Physical Functioning Measure (McDowell, 2006). This 10-item self-report instrument was used to determine functioning and scores ranged from 1 “limited a lot” to 3 “not limited at all.” Individuals with higher scores have better functioning. The alpha coefficient for part 1 (10 items) of physical functioning was .94.
Falls was assessed by three self-report questions about having fallen in the last year, in the last 30 days and having a fear of falls. Responses included “yes/no.” The alpha coefficient for falls was .71.
Behavioral Factors
Drug use and dependency was assessed using the Texas Christian University (TCU) Drug Screen II (Knight, Simpson, & Hiller, 2002). The 15-item self-report screening test provides an understanding of a history of heavy drug use or dependency within the last 12 months. Responses included “yes/no” to each drug mentioned. The total score ranges from 0 to 9; higher scores (≥3 or greater) indicate relatively severe drug-related problems and corresponds approximately to Diagnostic and Statistical Manual of Mental Disorders (DSM) drug dependence diagnosis. The alpha coefficient for drug use and dependency was .95.
Nutrition was assessed using the mini nutritional assessment (MNA; DiMaria-Ghalili & Guenter, 2008; Vellas et al., 1999). The screening includes questions related to weight loss in the last 3 months, mobility, psychological distress, neuropsychological problems, and body mass index (BMI). If a client scores 11 points or less in the screening (6 items; Part I), they then need to proceed to the nutritional assessment (12 items; Part II), which includes questions related to types of protein intake, use of prescription pills, pressure sores, and mid arm and calf circumference. A total score is derived that indicates whether the participant is malnourished (<17), at risk of malnutrition (17-23.5) or has a normal nutritional status (24-30). The alpha coefficient for nutrition was .70.
BMI was evaluated by measuring height and weight. Weight was assessed in pounds, whereas height was assessed in inches.
Resource Factors
Resilience was assessed using the resilience scale (Wagnild, 2009; Wagnild & Young, 1993). The 25-item index evaluates a purposeful life, perseverance, equanimity, self-reliance, and existential aloneness activities on a 7-point scale ranging from (1) “strong disagree” to (7) “strongly agree”; the total score ranges from 25-175 (Wagnild, 2009; Wagnild & Young, 1993). A higher score meant greater resilience. The alpha coefficient for resilience was .94.
Social support was assessed using the MOS Social Support Survey (MOS-SSS; Sherbourne & Stewart, 1991). Items in the four subscales were evaluated or a 5-point scale ranging from (1) “none of the time” to (5) “all of the time.” The data were transformed to a 0 to 100 point scale. Alpha coefficient for the subscales included emotional support (eight items, α = .95), tangible support (four items, α = .93), positive social interaction (four items, α = .94), and affectionate support (three items, α = .91). The overall alpha coefficient for social support was .97.
Adverse Outcomes
Disability was assessed using the Katz activities of daily living (ADL) scale (Katz & Akpom, 1976). The six-item scale takes into account bathing, dressing, toileting, transfer, continence, and feeding. The instrument uses “yes/no” scale with 1 point given for each ADL in which the participant is independent and 0 points given for each ADL in which the participant is dependent. Higher scores mean greater level of independence and lower scores signify higher dependence.
Health care utilization was assessed by self-report questions on health care utilization within the last year (e.g., seeing a health care provider, frequency of emergency department use). Respondents answered “yes/no” and number of times they sought health care services (0-35 times); a total score was added for items. A higher score indicated using health care resources.
Frailty was assessed using the frailty index. (Rockwood et al., 2011), which measures symptoms, signs, and disease classifications. The PI consulted with primary developmental investigators related to the FI items (A. Mitnitski, personal communication, November 3, 2011; K. Rockwood, personal communication, July 30, 2010), coding (A. Mitnitski, personal communication, June 26, 2011; July 13, 2011; March 2, 2012). This study utilized an established cut point assignment as relatively fit (FI ≤ 0.03, that is, no or only one deficit), less fit (0.03 < FI ≤ 0.10), least fit (0.10 < FI ≤ 0.21), frail (0.21 < FI < .44), and most frail (FI ≥ 0.45; Rockwood et al., 2011). The alpha coefficient for the 42-item FI was .88.
Analysis
Frequencies and percents were used to describe the sample characteristics of age, gender, educational level, socioeconomic status, marital status, and length of time homeless. Variables that were not normally distributed were log-transformed and they included health care utilization, drug use, and length of time homeless. To evaluate bivariate associations between frailty and possible predictors, Pearson correlations assessed normally distributed variables, whereas Spearman rho correlations assessed independent-level variables, which were not normally distributed. Stepwise backward linear regression was selected as the method to identify independent correlates of frailty. The resulting model was confirmed using a stepwise forward regression.
Several variables were originally selected because they are significant among homeless populations (i.e., comorbid conditions, physical functioning, depressive symptomology, falls, BMI, and ADLs). However, to avoid tautological error and overlap with the dependent variable, these variables were excluded as independent variables from bivariate and multivariate analysis. Assumptions of linearity and normal distribution were checked and met. In particular, the histogram illustrated a normal distribution for the dependent variable. Likewise, scatterplots depicted linear relationship between frailty and each continuous independent variable and homoscedasticity with the points being randomly and evenly dispersed throughout the plot. Multicollinearity diagnostics were checked by determining whether the variance inflation factor (VIF) and tolerance (1/VIF) have strong linear relationships; based on collinearity diagnostics, values were not problematic and within range.
Results
Sociodemographic and Behavioral Characteristics
Table 1 presents demographic characteristics for the sample. The mean age was 52.4 (40-73; SD 6.80). Slightly more than half of the participants (59.3%) were above the age of 50 and gender was equally distributed. More than half of the sample were frail (54%) and 10% were considered most frail. With respect to race/ethnicity, the majority of participants were African American (63.3%), followed by Anglo/White/Caucasian (12%), and Hispanic/Latino (10.7%). The majority of participants was unmarried (48%) or divorced (34.7%) and most completed Grades 9 to 12 (53.3%). About one third of the sample completed some college (32%).
Sociodemographic Characteristics (N = 150 Homeless Adults).
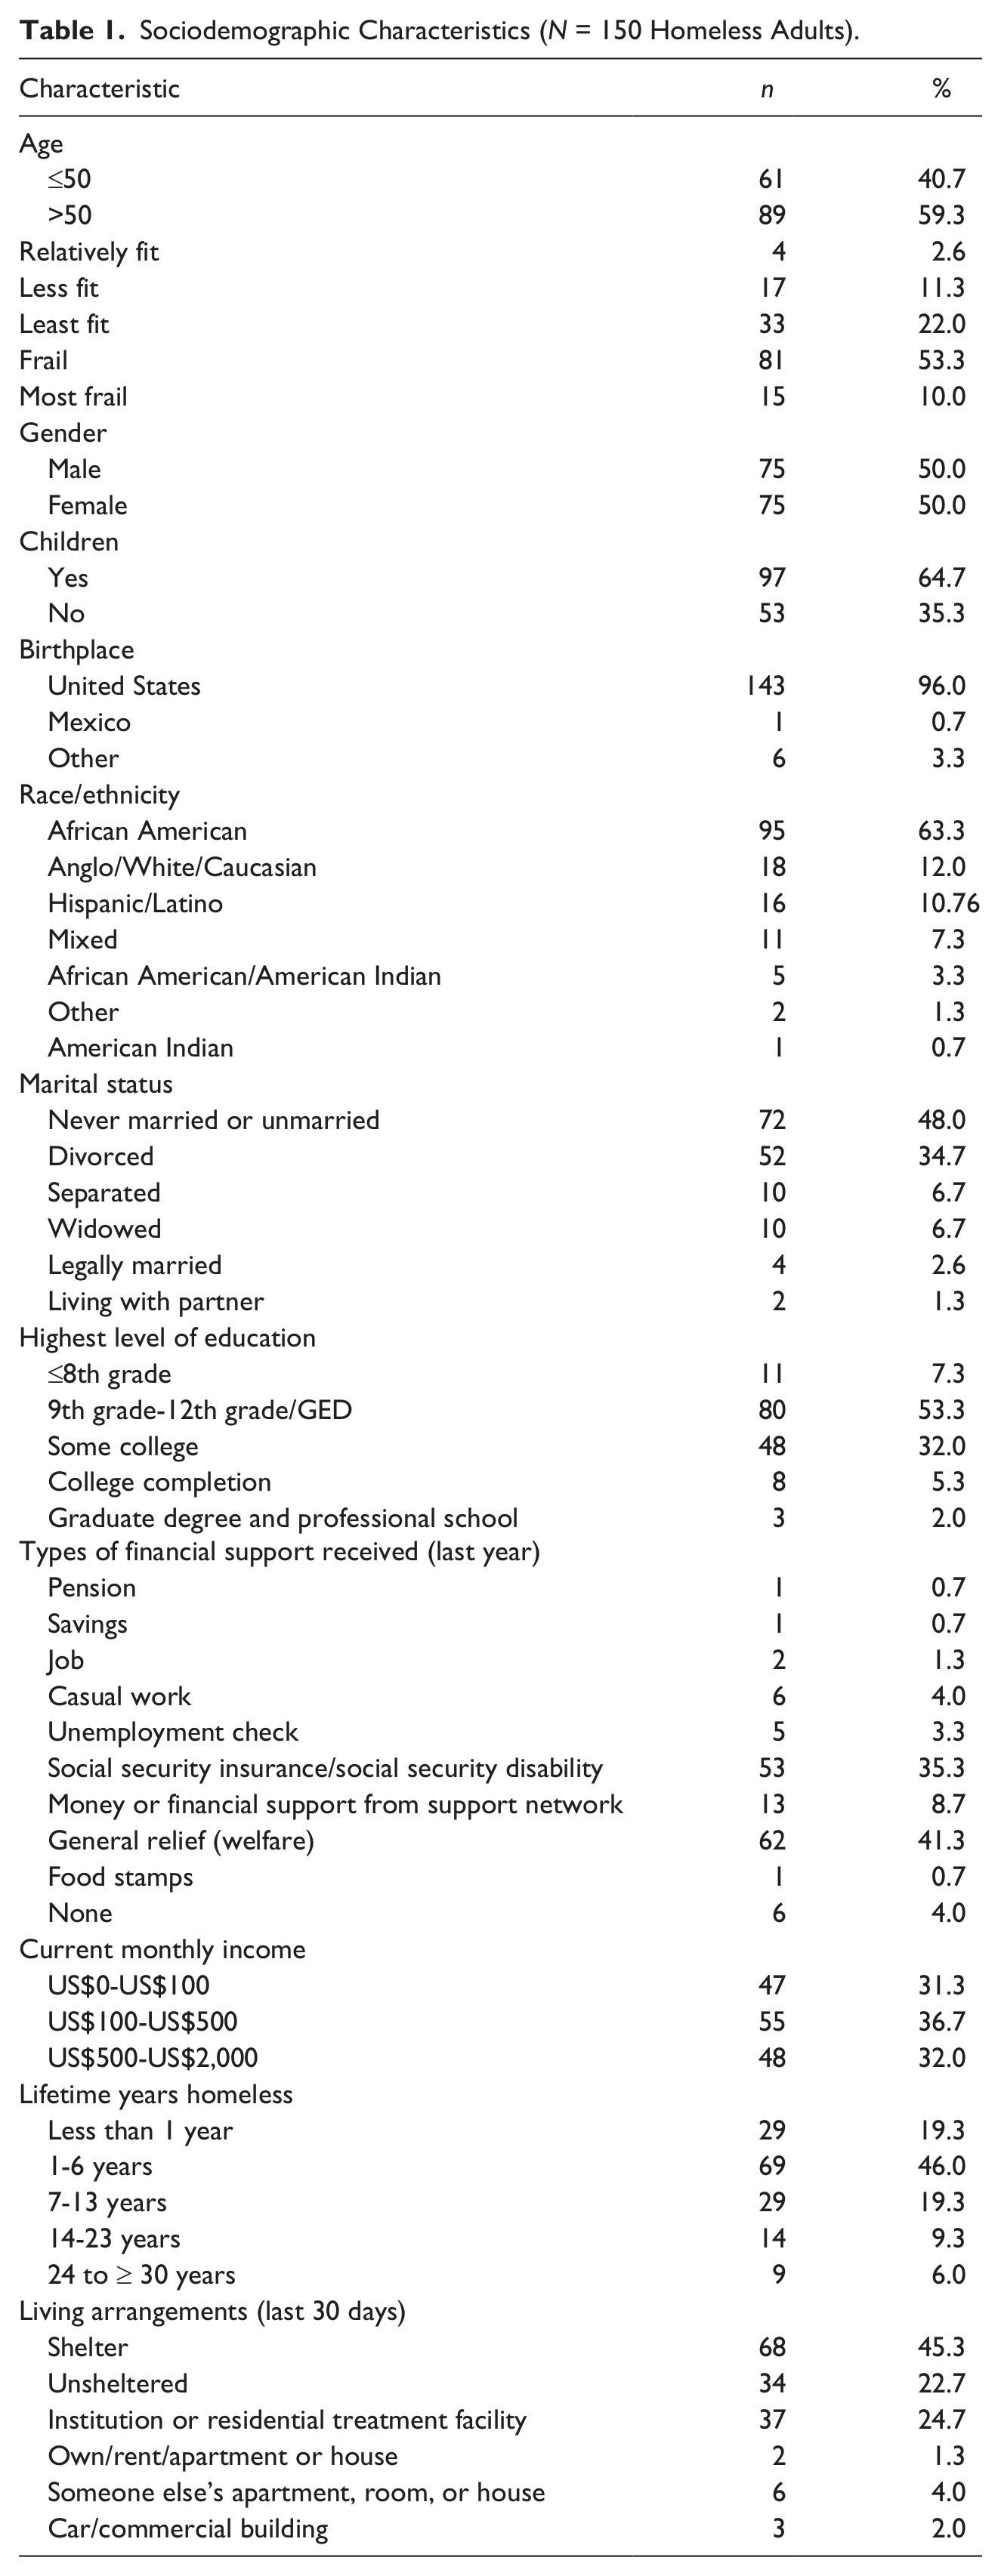
Number of years homeless ranged from less than 1 year to greater than 30 years. Nearly 46.0% of the sample had been homeless for 1 to 6 years of their life; 19.3% had been homeless less than 1 year. The remainder of the sample, 34.6% have been homeless longer than 7 years. Approximately 80.6% of our sample was homeless greater than 1 year and among that population, 54% were frail or most frail. In terms of living arrangements within the last 30 days, 45.3% lived in a shelter and 22.7% were unsheltered and lived in the streets or other outdoor areas.
In terms of substance use, the most frequent type of drug used in the last 12 months, which was perceived by the participant as causing the most serious problem, included crack/freebase (23.3%), followed by alcohol (20.7%), cocaine (7.3%), and methamphetamine (4.0%; Table 2). Alcohol was consumed by 14.7% of the sample every day. About a third (32.7%) denied drug or alcohol use.
Substance Use Past 12 Months (N = 150).
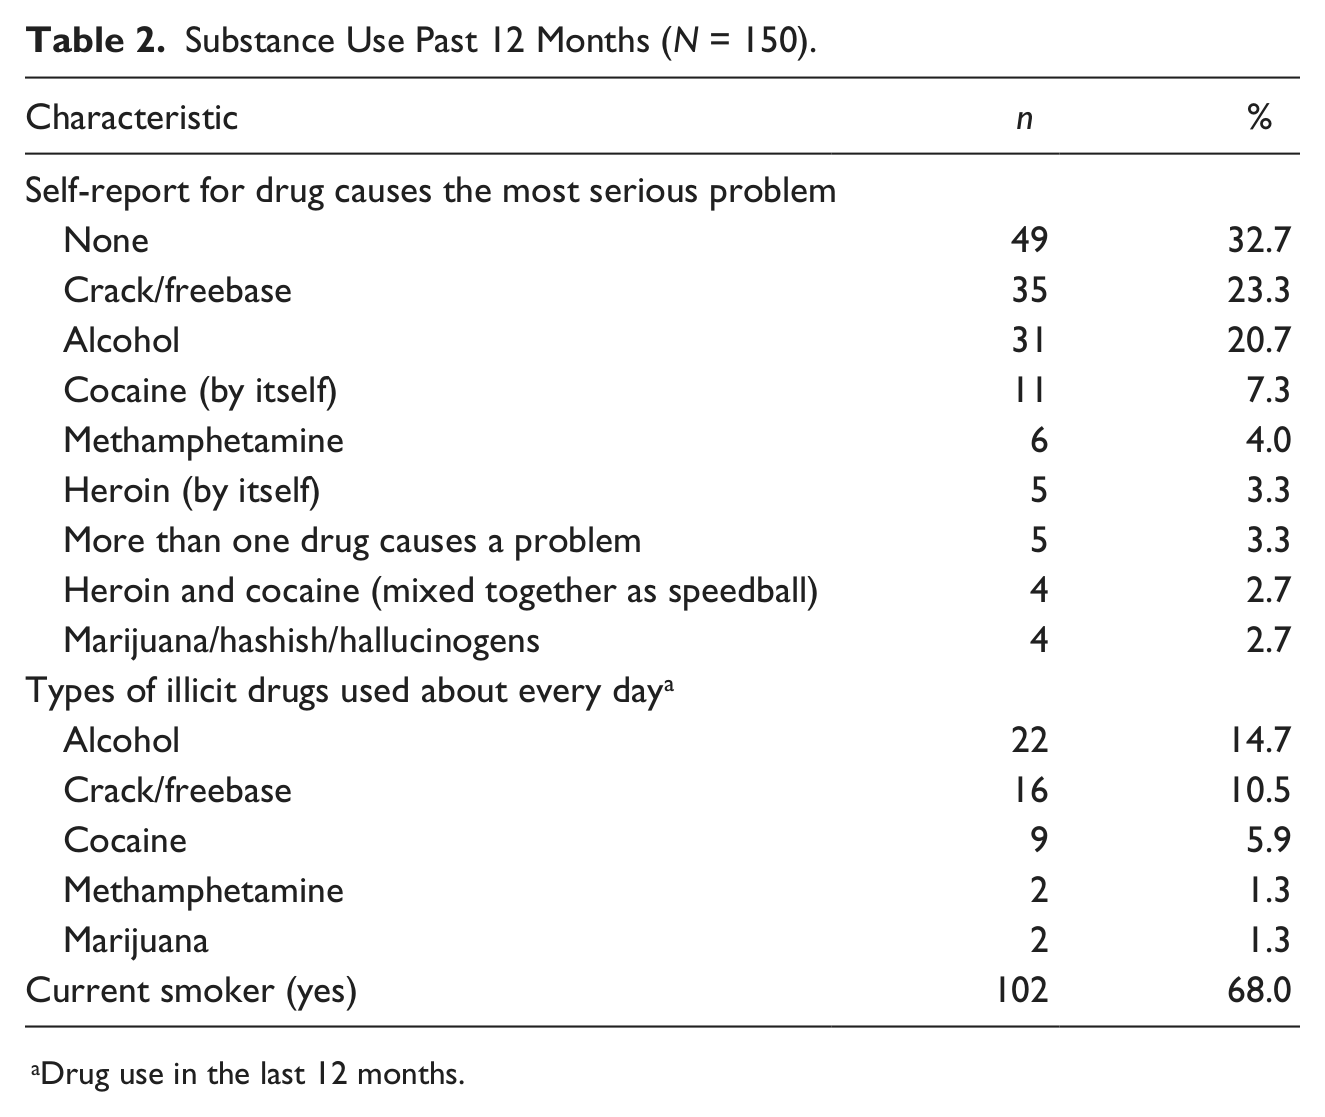
Drug use in the last 12 months.
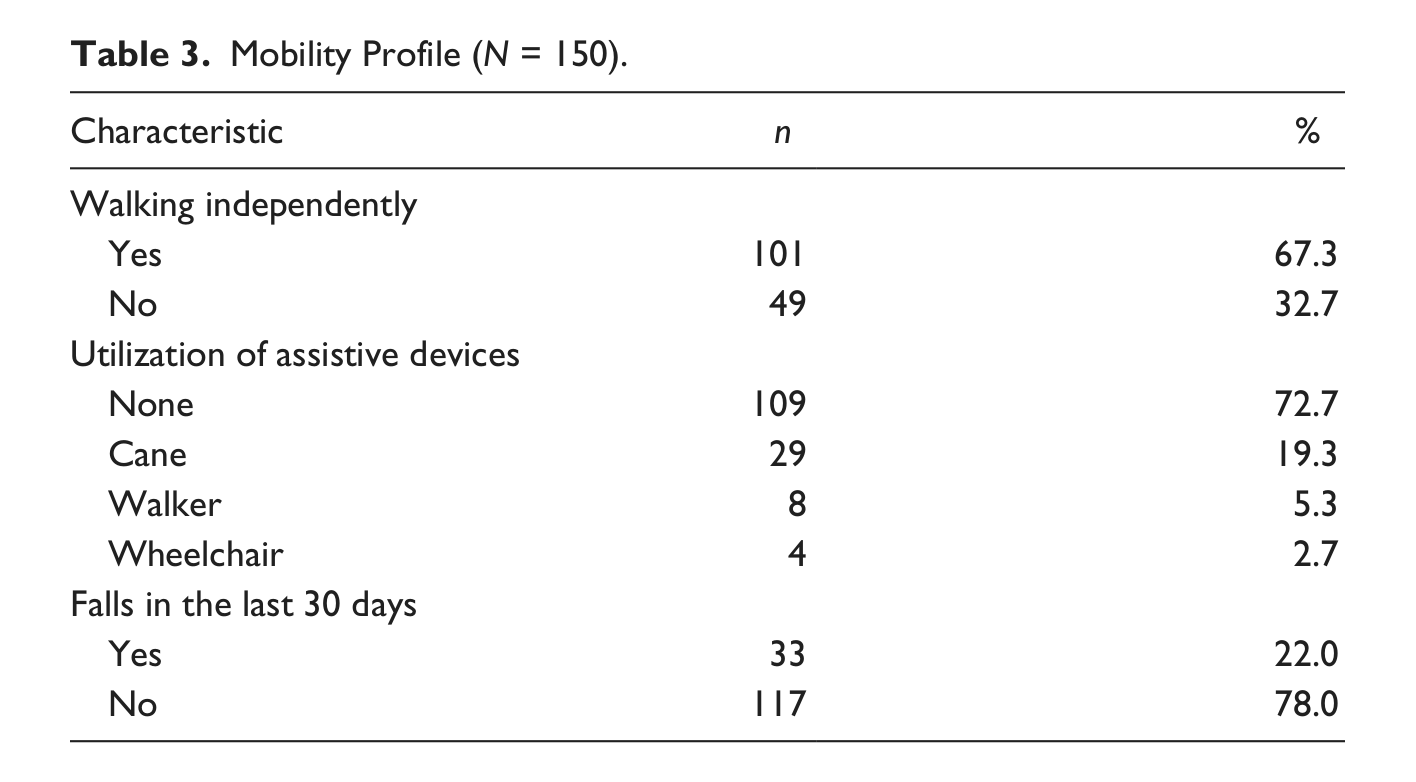
Table 3 presents findings related to the sample mobility profile. About two thirds (67.3%) reported ability to walk independently while about one third (32.7%) reported the need to use an assistive device, such as a cane (19.3%), a walker (5.3%), or a wheelchair (2.7%). Falls within the last 30 days were reported by 22% of the population.
Mobility Profile (N = 150).
Self-Reported Health Conditions
More than half (57.3%) of the participants reported that they experienced depression, followed by back pain (54.7%), hypertension (46.3%), rheumatoid arthritis (24.0%), osteoarthritis/degenerative arthritis (14.0%), asthma (12.7%), diabetes (11.3%), and bipolar/schizoaffective disorder (10.7%). Other more commonly reported conditions included heart disease (9.3%), hepatitis c virus infection (9.3%), and anemia or other blood diseases (8.0%). In terms of health care utilization, 48% of the sample had visited an emergency room for at least one night and 46.7% had health insurance.
Descriptive Statistics for Selected Variables
Table 4 presents findings of means, standard deviations of variables. The mean days homeless was 2,413 (SD = 2,896) and the mean number for health care utilization was 7.28 (SD = 7.12). In addition, the mean resilience score was 134 (SD = 28.64) and the mean FI was 0.26 (SD = 0.15).
Descriptive Statistics for Selected Variables (N = 150).
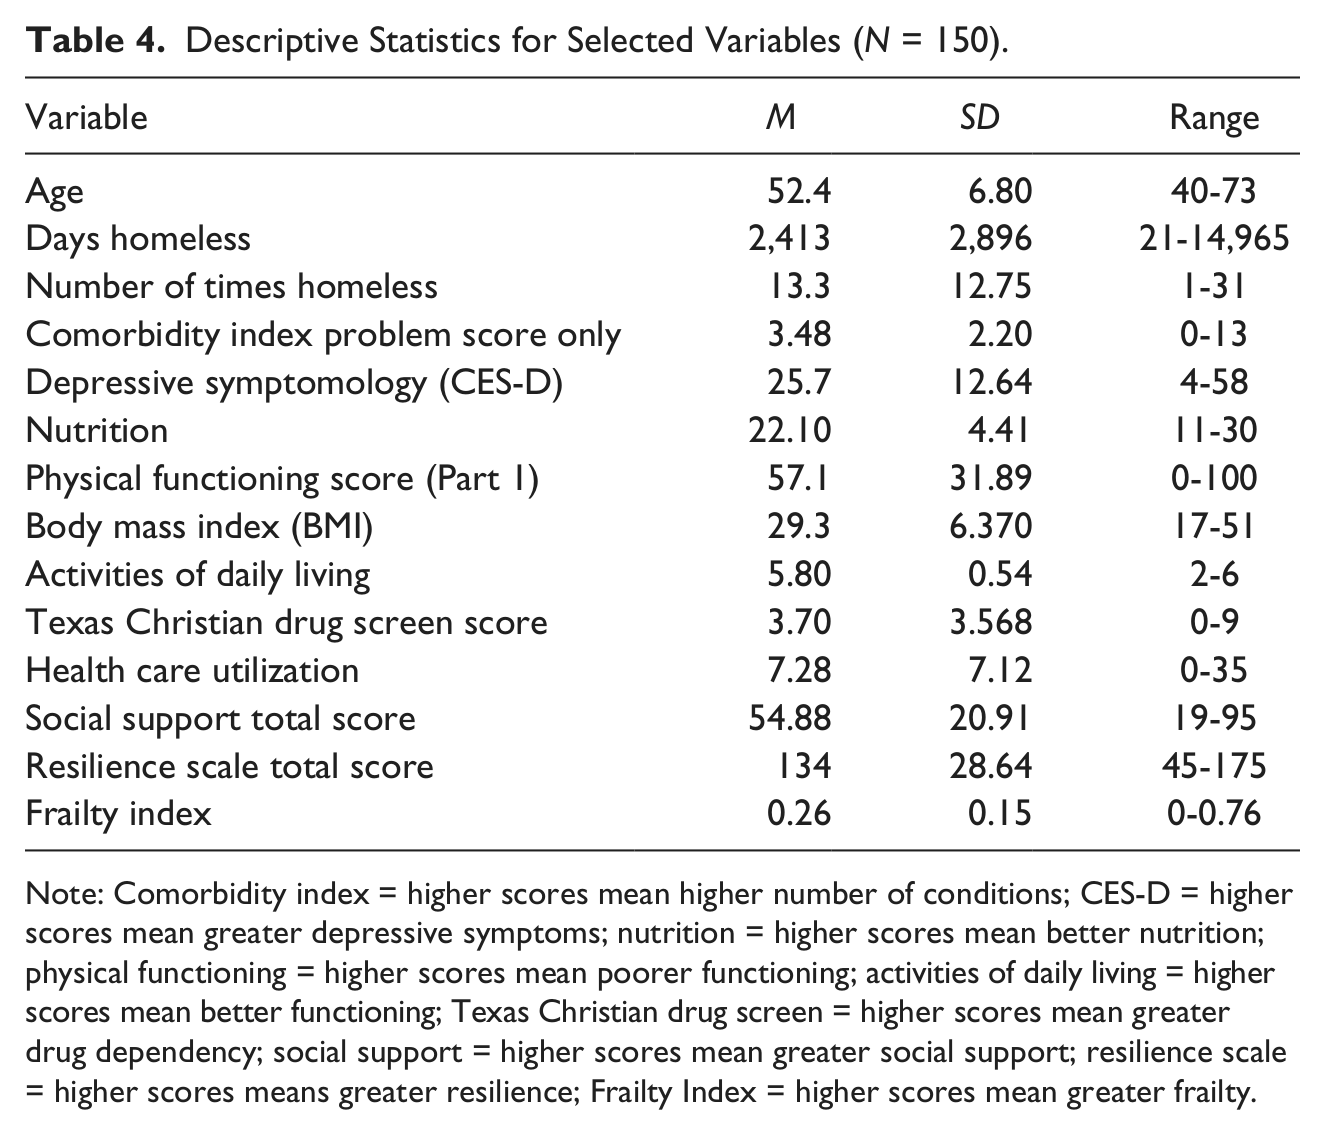
Note: Comorbidity index = higher scores mean higher number of conditions; CES-D = higher scores mean greater depressive symptoms; nutrition = higher scores mean better nutrition; physical functioning = higher scores mean poorer functioning; activities of daily living = higher scores mean better functioning; Texas Christian drug screen = higher scores mean greater drug dependency; social support = higher scores mean greater social support; resilience scale = higher scores means greater resilience; Frailty Index = higher scores mean greater frailty.
Bivariate Analysis
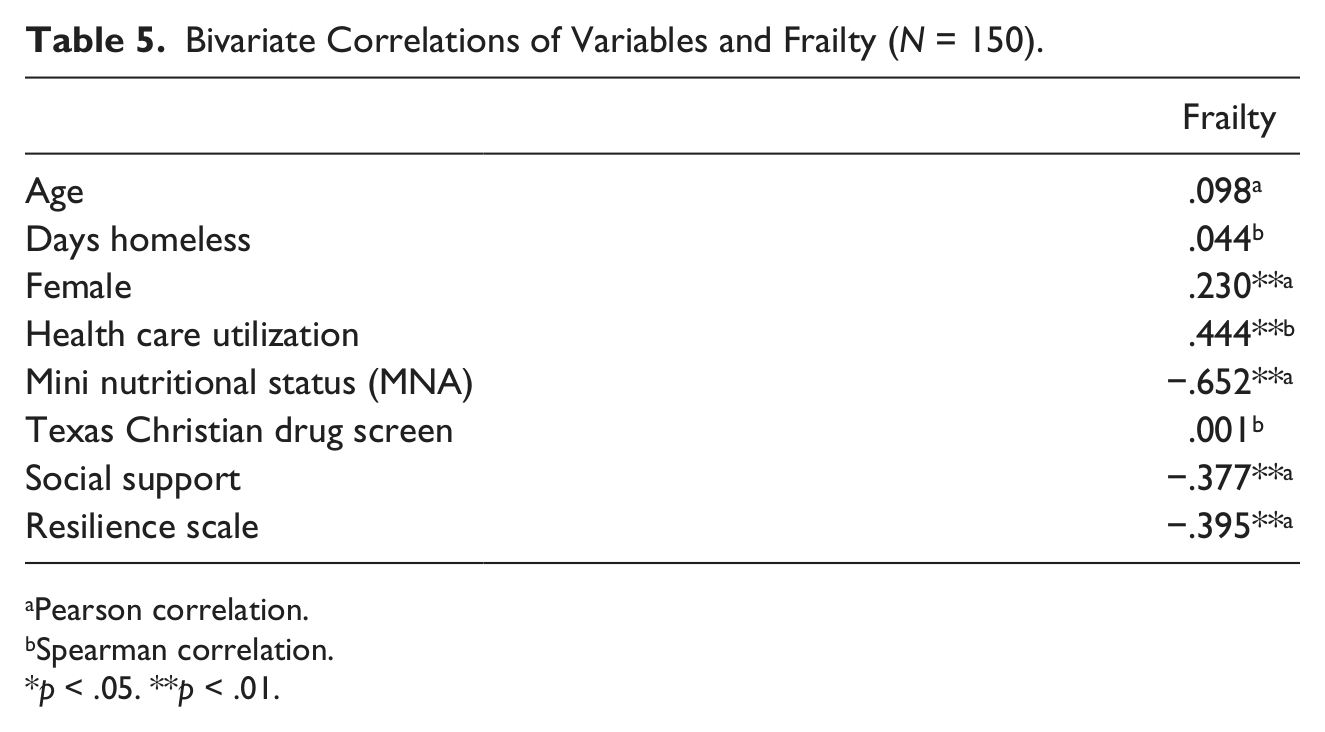
A Pearson (r) bivariate correlation revealed a weak relationship between frailty and being female (r = .230, p < .01). Significant moderate negative correlations were found between frailty and resilience (r = −.395, p < .01), social support (r = −.377, p < .01), and nutrition (r = −.652, p < .01). Furthermore, Spearman’s rho (rs) bivariate correlations revealed a moderate positive relationship between frailty and health care utilization (rs = .444, p < .01; Table 5).
Bivariate Correlations of Variables and Frailty (N = 150).
Pearson correlation.
Spearman correlation.
p < .05. **p < .01.
Multivariate Analysis
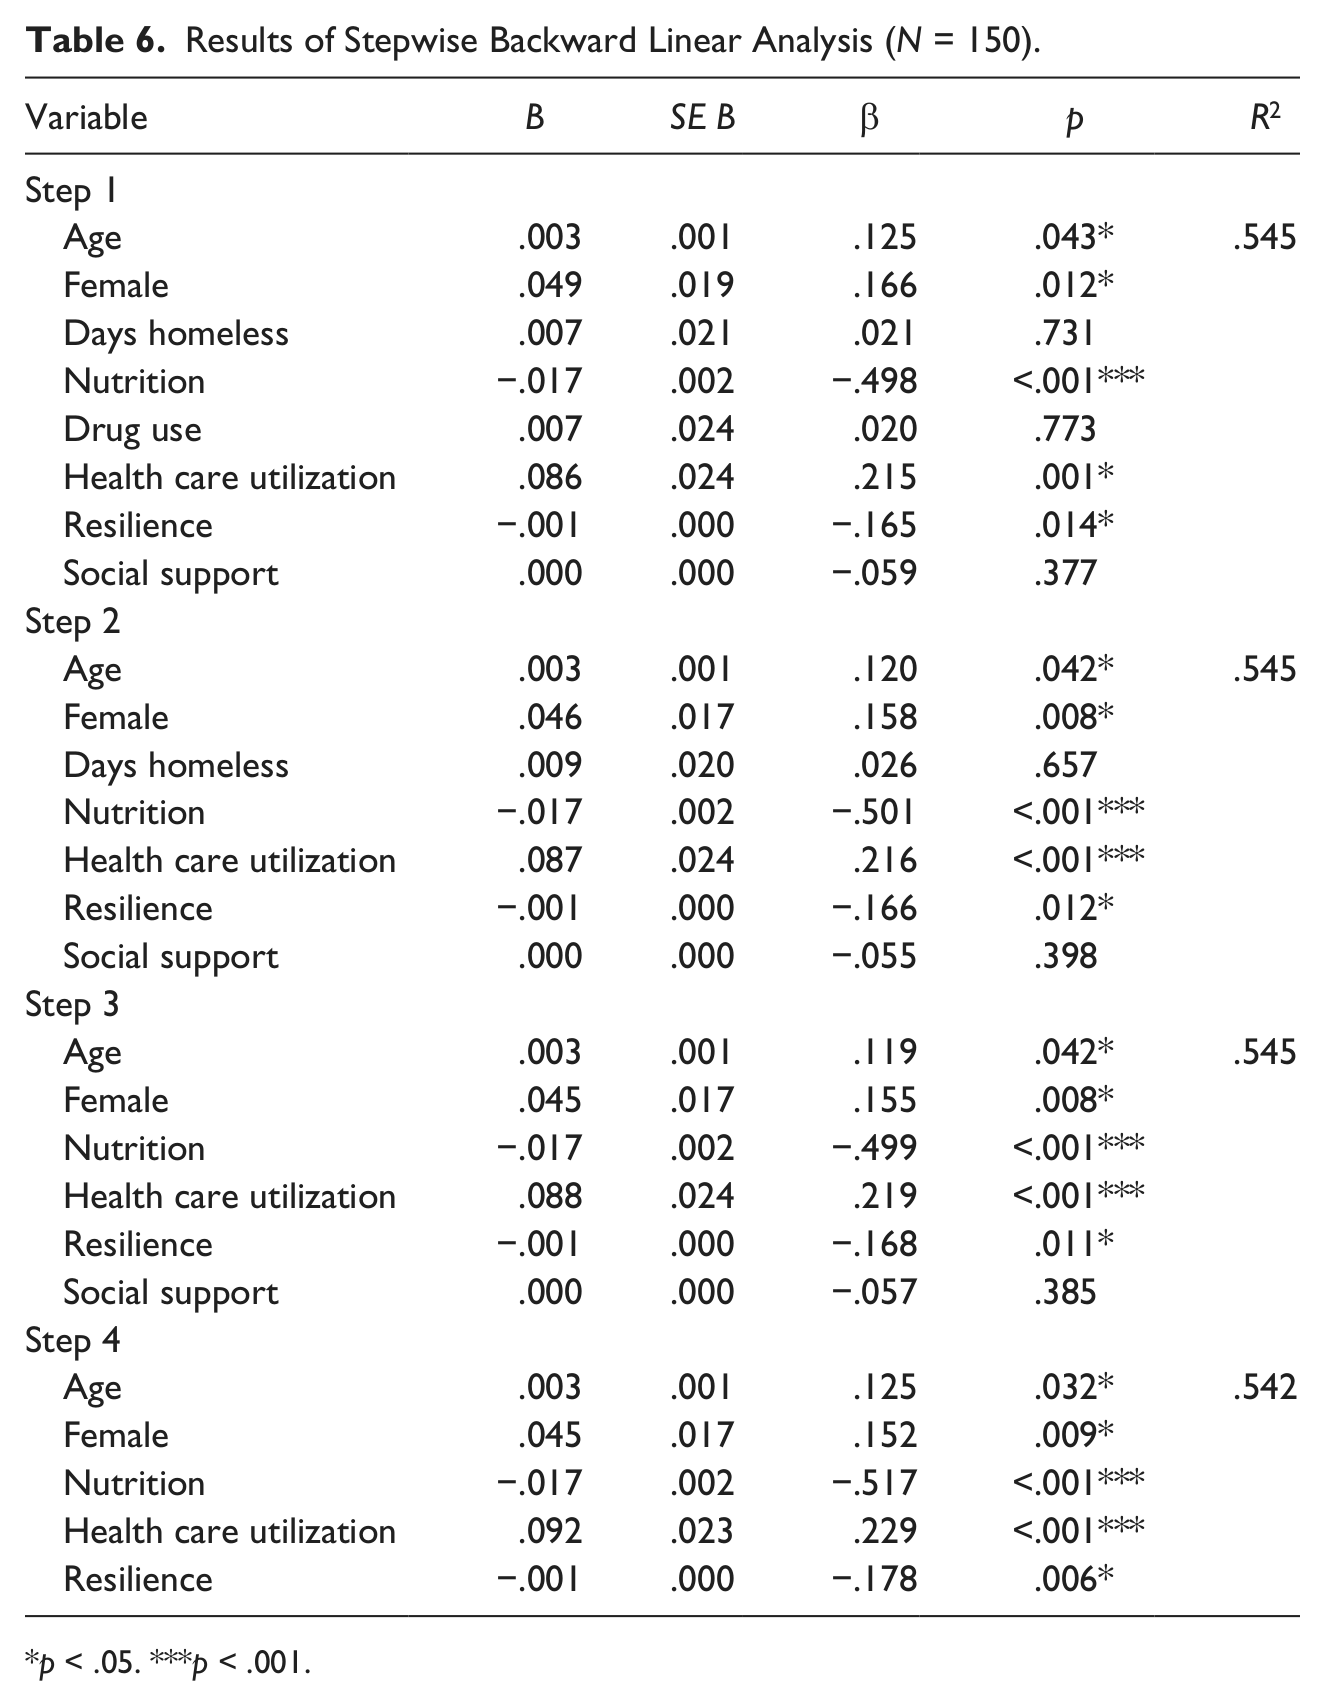
Table 6 describes the stepwise backward linear regression among variables which have been selected based on lack of redundancy and overlap in the model. In the final model, age, gender, health care utilization, nutrition, and resilience were significantly related to frailty. At each step, the variable with the smallest nonsignificant F ratio was deleted. In Step 1, age, gender, days homeless, nutrition, drug use, health care utilization, resilience, and social support were all entered into the regression equation, F(8, 140) = 21.000, p < .001, and the multiple correlation coefficient was .545, indicating approximately 54.5% of the variance in frailty can be predicted by the variables in frailty. In the last step, length of time homeless was removed, F(5, 143) = 33.859, p < .001, and age, gender, health care utilization, nutrition, and resilience were significantly related to frailty. The squared multiple correlation coefficients was .542 explaining 54.2% of the variance in frailty can be predicted by and age, gender, health care utilization, nutrition, and resilience.
Results of Stepwise Backward Linear Analysis (N = 150).
p < .05. ***p < .001.
Discussion
The purpose of this study was to understand correlates of frailty among homeless adults. Our findings revealed that approximately 53.3% of the sample was considered frail, and 10% were considered most frail. Moreover, significant correlates of frailty included age, gender, health care utilization, and significant negative relationships were found between nutrition and resilience. We selected the FI as one out of many available frailty instruments because of its multidimensional properties; other measures may singly focus on physical (Syddall, Cooper, Martin, Briggs, & Aihie Sayer, 2003) or other functional and psychological parameters (Fried et al., 2001; Fried et al., 2004).
Chronological age was found to be predictive of frailty. The FI counts deficits that can include symptoms, signs, illnesses, and disabilities (Rockwood & Mitnitski, 2011); thus, it is reasonable that as the population ages, chronic diseases will similarly increase. Published literature likewise suggests that as age increases, frailty levels similarly increase (Crews & Zavotka, 2006; Song, Mitnitski, & Rockwood, 2010; Yu et al., 2012). Currently, nearly one third of chronically homeless adults are above the age of 55 (LAHSA, 2011). As the homeless population continues to age, it will become increasingly necessary to focus on translational research which will address frailty.
Gender was also significantly related to frailty; more specifically, women were found to be frailer than men. In fact, regardless of type of frailty measure used, data reveal that women are at greater risk for frailty when compared with men (Goggins et al., 2005; Woo et al., 2005), live a greater number of years, and may have greater functional limitations (Graham et al., 2009). This area warrants further study as it relates to homeless women.
Our data further suggest that increased health care utilization was significantly related to increasing levels of frailty. Among homeless populations, health care utilization is a significant issue as many homeless adults utilize emergency departments frequently (Hahn et al., 2006; Kushel, Perry, Bangsberg, Clark, & Moss, 2002). One study examining factors of emergency department utilization among homeless adults (N = 2,578) found that 40.4% had one or more emergency department visits (Kushel et al., 2002). In our sample, 48% had visited the emergency department for at least one night, about one in five self-reported having an illness as a contributing factor to becoming homeless, and about half did not have health insurance. This area necessitates further exploration as it has significant health care cost and quality of life implications.
Among homeless populations, a greater degree of chronic disease burden may be one of the contributing factors relating to increased emergency department utilization (Sadowski, Kee, VanderWeele, & Buchanan, 2009). The most common conditions reported by our participants included depression, followed by back pain, hypertension, rheumatoid arthritis, and osteoarthritis/degenerative arthritis. We know that chronic health conditions are frequently reported by homeless populations (Garibaldi et al., 2005; Wiersma et al., 2010). In fact, one study found that nearly 85% of homeless adults older than 50 years of age had at least one chronic condition and the top three conditions were hypertension, arthritis/musculoskeletal disorders, and psychiatric conditions (Garibaldi et al., 2005).
We also found that poorer nutrition scores were related to higher frailty scores. Authors acknowledge that one of the key issues related to frailty is an impairment of nutritional status, which is a critical issue among older adults (Bartali et al., 2006; Fulop et al., 2010; Kaiser, Bandinelli, & Lunenfeld, 2010), as well as homeless adults. In a secondary study among homeless adults in this sample, data revealed that 25% were food insufficient and not having adequate quantity to eat (Baggett et al., 2011). For some homeless adults, scavenging dumpsters, stealing food, and pawning personal belongings (Richards & Smith, 2006) were means by which to obtain food. Although some measures of frailty may include nutrition as a component, due to the condition of homelessness and challenges with ascertaining adequate nutrition, we decided to include this variable as an antecedent. Future research should focus on identifying nutritional deficiencies and intervening with supplementation and measuring effectiveness among this population.
This study yielded several variables that were not associated with frailty. First, length of time homeless was also not related to frailty; to our knowledge, no previous research has investigated the relationship between frailty and length of time homeless. Approximately 80.6% of our sample was homeless more than one year and among that population 54% were frail and most frail. Due to the cross-sectional nature of the study, it is difficult to determine whether these findings would be consistent with a longitudinal study. Due to the lack of variability with length of time homeless measure, it is difficult to determine the role that this measure had on frailty. However, it seems logical that homeless persons should have higher degrees of frailty especially due to the constellation of physical, psychological, and social challenges. Moreover, transition between frailty states may be improved if resources became more accessible.
No relationships were noted with respect to frailty and either drug use or social support. Previous studies in the general population have found that social vulnerability is related to frailty (Bilotta et al., 2010). It is plausible that in this sample participants perceive support rather than receive support. Among older adults (N = 2,032), decreased social support was related to increasing frailty; furthermore, one strategy to delaying onset of frailty is active participation in the community (Woo et al., 2005). In a study of multidimensional social support among homeless adults (N = 544), Hwang et al. (2009) found that the sample included had high levels of emotional and instrumental social support. Our findings may be related to the fact that while this population self-reports high levels of emotional/information support, tangible support, affectionate support, or positive social interaction; they may not actually receive support. This area necessitates further exploration. Data suggest that substance use is a significant issue among homeless populations (Christiani, Hudson, Nyamathi, Mutere, & Sweat, 2008; Nyamathi, Branson, et al., 2012); however, substance use was not found to be correlated with frailty in the multiple regression analyses. It is possible that self-reported drug use was not accurate. It is also the case that a portion of the homeless sample was living in a substance abuse treatment facility; thus, substance abuse may have been under control for some participants.
Frailty is a public health challenge; homeless populations have a greater burden of disease and challenges abound in terms of comorbid conditions, physical functioning, and nutrition. These study findings raise several research questions and encourage us to contemplate different models of care. First, it may be necessary that service agencies have frontline geriatric nursing triage to accurately case manage clients, especially those who need higher acuity care. It may also be necessary to develop shelter-based convalescence (van Laere, de Wit, & Klazinga, 2009) facilities for homeless populations. In addition to nurse case management, another promising component of an intervention program may be to utilize a chronic disease self-management program (CDSMP), initially established for helping patients manage arthritis (Lorig & Holman, 2003; Lorig, Laurin, & Holman, 1984; Lorig, Ritter, & Plant, 2005).
It may also be beneficial for service agencies to provide health promotion activities in day centers and to have nutritionists on staff guiding and planning meals. Among an already vulnerable population, it remains to be seen whether utilizing a FI would enable a clearer identification of issues and subsequent rendering of services or care. Taken together, it will be critical that clinicians and service providers work together and begin to consider clinical applications of frailty screening. It may also be necessary to triangulate services focusing on nutrition, exercise, and case management of chronic disease processes in an effort to care for the most vulnerable. In essence, these findings serve as an impetus and a foundation for understanding frailty that will undoubtedly inform future nurse-led larger replicative studies that will lead to interventions.
A discussion of limitations is warranted; first, the study is limited to homeless men and women between 40 and 73 years of age and cannot be generalized to other populations. Furthermore, this study only utilized one frailty instrument (e.g., FI). Future research should compare and contrast frailty instruments among this population. Similarly, cross-sectional studies cannot infer directional relationships or causality. In fact, due to the nature of this design, it is not possible that we are able to completely understand the nature of the relationship between longer time spent on the street and frailty. Furthermore, self-report data are prone to errors and may cause bias in the data. Future research should focus on replicating this study with a larger sample size, without a minimum inclusion age in an effort to obtain greater variability with the measures.
Footnotes
Acknowledgements
We acknowledge the support of Dr. Arnold Mitnitski and Dr. Kenneth Rockwood for providing guidance with utilizing the FI. We similarly thank the Los Angeles–based skid row homeless service agencies and homeless participants who generously gave of their time, experiences, and resources.
Declaration of Conflicting Interests
The author(s) declared no potential conflicts of interest with respect to the research, authorship, and/or publication of this article.
Funding
The author(s) disclosed receipt of the following financial support for the research, authorship, and/or publication of this article: This work was supported by the National Institute of Health (NIH)/Nursing Research (NINR) T32 NR007077 and the University of California Los Angeles (UCLA) Dissertation Year Fellowship Award.