
Abstract
Although nursing care hours (NCH) is commonly used to examine factors related to adverse events among inpatients, the reliability of the NCH measure has rarely been examined. This study assessed the reliability of NCH data from the National Database of Nursing Quality Indicators® by estimating intraclass correlation coefficients (ICCs) with data from the California Office for Statewide Health Planning and Development. Hospital-level aggregated NCH data for critical care units were linked from each of the databases for 48 California hospitals matched in the two databases. Estimated ICCs were .96 for registered nurse (RN) hours and .72 for non-RN hours. Findings provide evidence that NCH data of the national database were substantially reliable for use in national comparable benchmarking reports for hospitals’ quality improvement activities and research.
With increasing concerns about the quality of patient care over the past two decades, hospital nurse staffing has become a major focus in examining the relationship between nursing workforce characteristics and patient outcomes. A large body of research has demonstrated that better nurse staffing levels are significantly associated with better patient outcomes, including shorter length of stay, lower mortality rates, and fewer falls (Kane, Shamliyan, Mueller, Duval, & Wilt, 2007; Lake & Cheung, 2006; Unruh, 2008). Various staffing measures have been used in studies where researchers examined such relationships. Two nurse staffing measures, nursing hours per patient day (NHPPD) and registered nurse (RN) skill mix, are used most frequently in the nurse staffing and quality literature (Unruh, Russo, Jiang, & Stocks, 2009). Nursing care hours (NCH) is the key element of these nurse staffing measures, which may affect research findings on the relationships between nurse staffing and patient outcomes. Therefore, it is important to establish ongoing evidence of reliability of NCH measures. Yet, research on the reliability of NCH is sparse.
National Database of Nursing Quality Indicators® (NDNQI®)–NCH Indicator
In 1998, the American Nurses Association (ANA) established the NDNQI to facilitate ANA’s Patient Safety and Nursing Quality initiative (Montalvo, 2007). Since then the NDNQI has been serving as a unit-level data repository to support participating hospitals’ quality improvement efforts by providing quarterly performance reports with national comparison data on 18 nursing-sensitive quality indicators, such as nurse staffing, patient falls, and RN job satisfaction. The quality indicators included in NDNQI were developed within Donabedian’s (1988, 1992) quality framework, which reflects the structures, processes, and outcomes of care. Included in the NDNQI’s structural quality measures are NHPPD and nursing staff skill mix. The NDNQI has developed standardized definitions and data collection guidelines for both these staffing measures, which are included in a set of nursing-sensitive care performance measures endorsed by the National Quality Forum (NQF) as national consensus standards based on four evaluation criteria. These criteria are as follows: importance to measure and report, scientific acceptability (reliability and validity), usability, and feasibility (NQF, 2012). Currently, there are more than 1,900 participating hospitals nationwide in the NDNQI. Considering the important role of the NDNQI database to provide participating hospitals with unit-level data for their quality improvement and national benchmarking, it is essential to collect reliable and valid data from NDNQI participating hospitals. Accordingly, the NDNQI researchers periodically evaluate measurement properties of each indicator as part of ongoing efforts to improve data quality. Recently, the NCH indicator was reevaluated to ensure continued evidence of reliability. We present the study findings in this article.
Variations in the operational definition of NCH (or nursing hours) exist in the literature, including variation in labels, inclusion and exclusion criteria of nursing staff, included hours, and hospital or unit settings. These variations are very likely a result of the databases available to researchers (Spetz, Donaldson, Aydin, & Brown, 2008; Unruh et al., 2009). For example, there are several data sources that contain data elements for nurse staffing measures, including the American Hospital Association (AHA) Annual Survey of Hospitals, the California Office of Statewide Health Planning and Development (OSHPD), and the California Nursing Outcomes Coalition (CalNOC). While the AHA contains data on full-time equivalents (FTEs) for RNs, licensed vocational/practical nurses (LVNs/LPNs), and nursing assistive personnel at the hospital level, the CalNOC contains data on productive hours worked by RNs, LPNs, and unlicensed assistive personnel (UAP) at the patient care unit level. Nurse FTEs reported in the AHA (2011) database can be computed by dividing the total number of hours worked by full-time (35 hr or more) and part-time (less than 35 hr) employees by the normal number of hours worked by a full-time employee during the full (12 months) reporting period (e.g., 2,080 hr = 40 hr per week × 52 weeks).
NDNQI (2012) defines NCH as “the number of productive hours worked by nursing staff (RNs, LVNs/LPNs, and UAP) assigned to the unit who have direct patient care responsibilities for greater than 50% of their shift.” The term productive hours refers to direct patient care hours actually worked by nursing staff on a unit, not budgeted or scheduled hours. Therefore, hours such as vacation, sick time, orientation time, education leave, and committee time are considered nonproductive hours and are excluded in calculating NDNQI NCH. This NDNQI definition was reendorsed by the NQF in November 2012.
NDNQI NCH data are collected separately for each nursing licensure level (RN, LPN, and UAP) as well as employment status (hospital employees and agency/contract personnel). Hospitals submit their data by calendar month via a NDNQI secure website. To collect accurate data in compliance with the NDNQI definition, the NDNQI has implemented several strategies, including periodic site coordinator surveys, data cleaning tools and summary reports to verify data during the entry process, and educational teleconferences for site coordinators. Most importantly, during NDNQI’s process of data cleaning prior to generating quarterly reports for participating hospitals, all submitted data are thoroughly audited by NDNQI statistical analysts regarding outliers, errors, and missing data. When analysts find data that appear to be erroneous, they ask the site coordinator to verify the accuracy of the data. For example, when analysts find NCH data extremely different from previous quarters, they will ask the site coordinator to investigate whether an error occurred in converting NCH data for the hospital’s biweekly pay period to those in the calendar month required by NDNQI. If erroneous appearing data are not verified, they are deleted.
In 2007, NDNQI researchers conducted a reliability study of the NCH measure and found that NCH data collected from NDNQI hospital data sources were substantially reliable (Klaus, Dunton, Gajewski, & Potter, 2012). The study was conducted in two phases. In Phase 1, the level of the compliance with NDNQI data collection guidelines was evaluated as a way to estimate the reliability of the NCH indicator. Findings indicated that the majority of participating hospitals (70%) correctly identified the NDNQI definition of NCH, including inclusion and exclusion criteria for types of care providers. Overall hospital compliance with NDNQI data collection guideline standards was high. Some issues were associated with the inclusion of hours from ineligible staff, including unit secretaries, monitor technicians, sitters, and nurses during their orientation period. These topics were identified as an area in need of enhanced training materials to increase compliance with inclusion criteria for reporting NCH to NDNQI.
In Phase 2, the reliability of the NDNQI NCH measure was examined by estimating intraclass correlations (ICCs) on NCH values among nursing units from each of 11 participating hospitals. NCH based on the NDNQI definition were calculated by the NDNQI staff using nursing clock hours files obtained directly from the hospitals’ electronic sources, then calculated ICCs with NCH data previously submitted by the hospitals. A scatter plot showed a high degree of agreement between unit-level total NCH calculated by the NDNQI staff and those submitted by the participating hospitals. The estimated ICCs for total NCH among nursing units in each hospital ranged from .69 to .99. The study findings provided evidence of the reliability for the NDNQI NCH measure.
Purpose
Our study purpose was to reassess the reliability of NCH data collected by the NDNQI using its standardized definition and specific data collection guidelines with those from the OSHPD database. Two specific aims were to examine the level of discrepancy in NCH between the two different databases (the NDNQI and the OSHPD) and to estimate reliability coefficients of the NCH measures from these two data sources.
Method
Data Sources
In the present study, the NDNQI NCH data for participating hospitals in California were empirically evaluated with data for the same hospitals from the California OSHPD Hospital Annual Disclosure Report. The California OSHPD database was selected because it is a commonly used data set in nurse staffing research, is publicly available, and is one of the few available data sources containing unit-level nurse staffing data elements. Moreover, the NCH reported by the OSHPD represent the productive hours worked by RNs, LPNs, and aides/orderlies. A brief overview of the NDNQI and California OSHPD databases is presented in Table 1. While the NDNQI is a proprietary repository of data from voluntarily participating hospitals in the United States, the OSHPD database contains data from the mandatory annual final reports of all acute care hospitals licensed by the state of California. Although NCH is defined as “productive hours” worked by nursing staff in both databases, the definition of productive nursing hours is slightly different in the two databases. NDNQI NCH represents direct patient care hours, so education leave or committee time is considered as nonproductive hours and excluded in reporting NCH to NDNQI, whereas NCH collected by OSHPD includes these hours. In addition, data reporting intervals are different (quarterly reports for the NDNQI vs. yearly reports for the OSHPD).
Overview of the NDNQI and California OSHPD Data Sources.
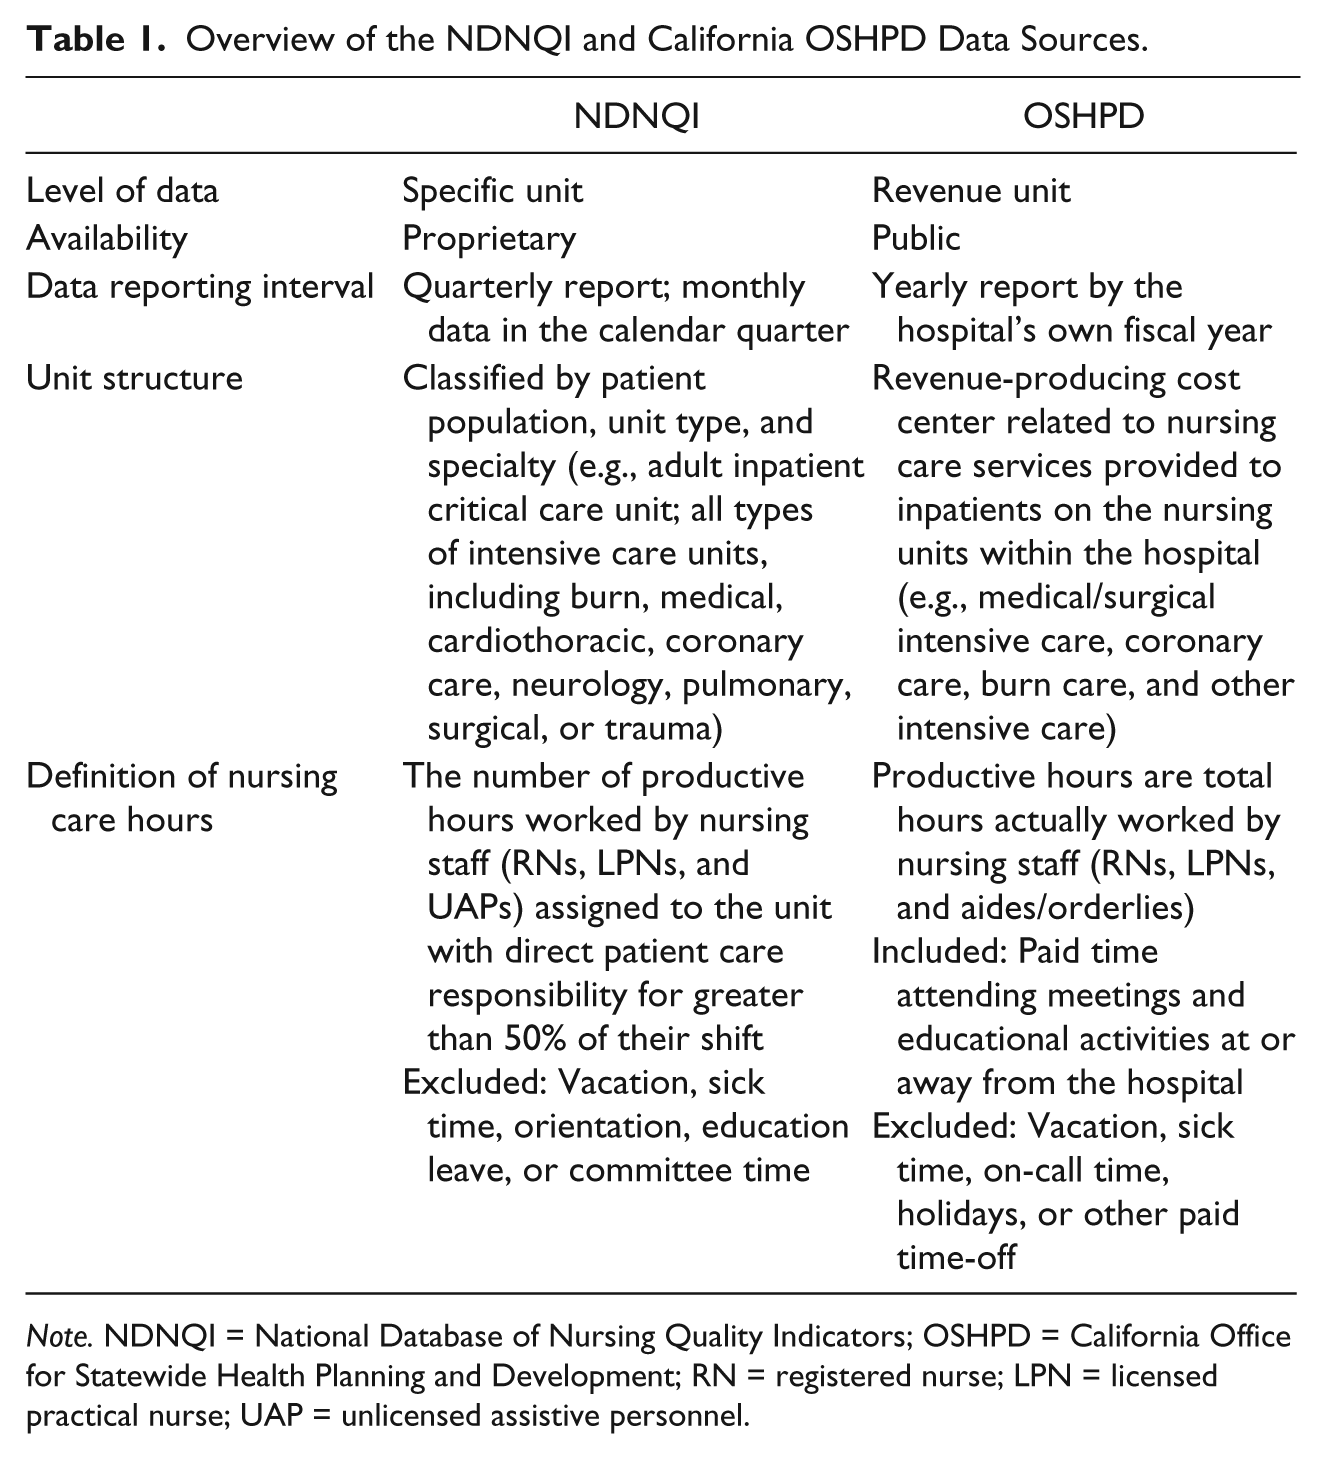
Note. NDNQI = National Database of Nursing Quality Indicators; OSHPD = California Office for Statewide Health Planning and Development; RN = registered nurse; LPN = licensed practical nurse; UAP = unlicensed assistive personnel.
Unit structure is also defined differently in the two databases. While the NDNQI classifies units by patient population and unit type, the OSHPD groups units into revenue-producing cost centers by the nursing care services provided on the units. NDNQI critical care units refer to all types of intensive care units, including burn and coronary care. Examples of intensive care units classified by the NDNQI are adult critical care, pediatric critical care, and neonatal critical care units. The revenue units that provide intensive care as classified by the OSHPD are as follows: medical/surgical intensive care, coronary care, burn care, pediatric intensive care, neonatal intensive care, psychiatric intensive care (isolation), and other intensive care.
Analytic Data File Construction
Our general approach was to link data from the 35th Year OSHPD database (the most recent database at the time of the study) with NDNQI NCH data for adult critical care unit type in each of the matching hospitals. In this way, linked NCH data from the two databases were directly compared and used to estimate reliability coefficients of the NCH data. First, 50 hospitals in NDNQI and OSHPD were matched based on Medicare provider number, address, and zip code. Of these, two hospitals were excluded because they did not have data for the same period of time in 2009. In addition, after a thorough review of the defined unit structure in the two databases, only adult critical care units were included in this study because adult critical care was the only unit type category consistent across the two databases. Second, 2008-2009 NCH data in NDNQI and OSHPD were matched by data collection month. Because the 35th OSHPD database contains NCH data from reporting hospitals by their fiscal year, which may begin in January, July, or October, monthly NCH data from 2008 and 2009 were extracted from the NDNQI to match the time period for NCH data from each hospital in the OSHPD database. Finally, the two data files were merged for data analysis at the hospital level because detailed information on individual reporting revenue units, such as the names of reporting units or number of beds, was not available from the OSHPD database. More precisely, we aggregated data at the hospital level to obtain total NCH for the type of adult critical care units within a hospital. Thus, for each hospital in the analytical data file, we had a measure of total critical care NCH for the fiscal year 2009 from each of the two databases.
Measures
For this study, average monthly critical care NCH for NDNQI and OSHPD data were calculated as total critical care NCH in a year divided by the number of reporting months (e.g., 12 months). Also, NCH were calculated separately for RNs and non-RNs (LPN/LVN and UAP).
Data Analysis
Descriptive statistics were used to summarize and compare NCH for each type of nursing staff (RNs and non-RNs) derived from two databases. ICCs were computed to examine the reliability of NCH measures for RNs and non-RNs between the two databases. The ICC represents the proportion of the total variance of the observed measure that can be explained by group membership (Raudenbush & Bryk, 2002). In this study, the unit of reliability is the individual NCH measure, not the mean of NCH measures from each of the same two databases, which were the only available databases. Thus, the ICC(3,1) was calculated using mean squares from a two-way ANOVA model in which average monthly critical care NCH is the dependent variable and group memberships (hospital and database) are the independent variables with the following formula (Shrout & Fleiss, 1979):

where BMS is the between-individual mean score (i.e., the squared deviation of hospitals from the overall mean), EMS is the error mean square, and k is the number of judges. In this case, judges refers to the NDNQI and OSHPD databases. Shrout (1998) proposed the following ranges of ICCs for reliability as .00–.10 (no reliability), .11–.40 (slight), .41–.60 (fair), .61–.80 (moderate), and .81–1.0 (substantial). The minimally acceptable ICC for reliability is above .6. The data were analyzed using IBM SPSS Version 20.
Results
A total of 48 hospitals in California made up the final sample. As shown in Table 2, about two thirds of sample hospitals were hospitals with fewer than 300 staffed beds and nonteaching hospitals. The majority of sample hospitals were non-Magnet hospitals. Sample hospitals with fewer than 300 staffed beds were disproportionately underrepresented compared with all NDNQI member hospitals in 2009. However, the proportions of large hospitals (with 300 beds or more) and not-for-profit hospitals were higher in the sample and all NDNQI hospitals than those in all hospitals reporting to the AHA.
Hospital Characteristics in 2009.
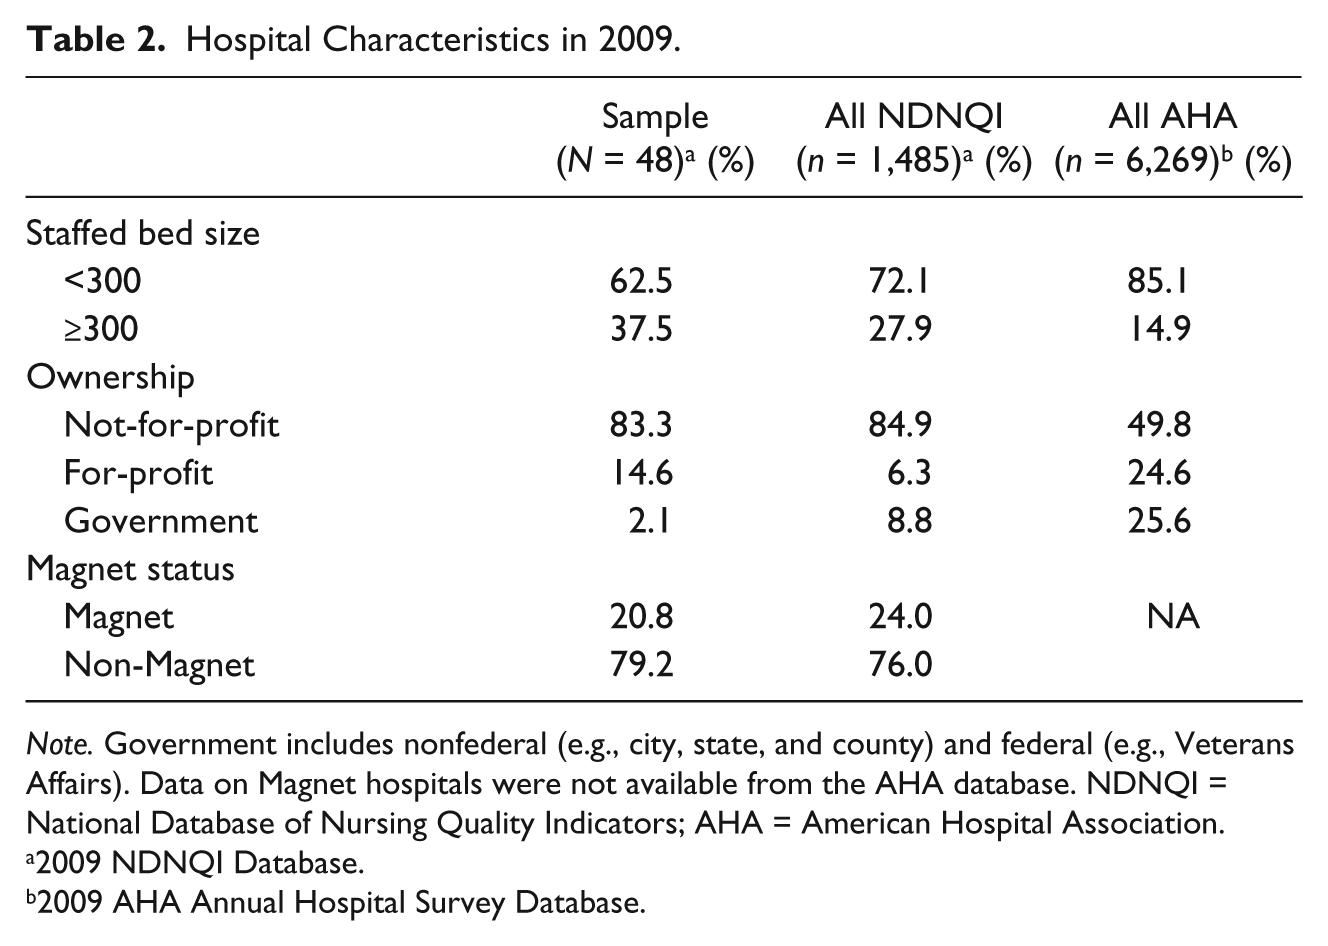
Note. Government includes nonfederal (e.g., city, state, and county) and federal (e.g., Veterans Affairs). Data on Magnet hospitals were not available from the AHA database. NDNQI = National Database of Nursing Quality Indicators; AHA = American Hospital Association.
2009 NDNQI Database.
2009 AHA Annual Hospital Survey Database.
Table 3 summarizes average monthly critical care NCH for RNs and non-RNs by NDNQI and OSHPD. Both critical care NCH for RNs and non-RNs, based on the NDNQI definition, were less than those derived from the OSHPD. We calculated the standardized mean difference (SMD) in NCH between the two databases as the difference between means divided by the pooled standard deviation. SMDs in critical care NCH for RNs and non-RNs were 0.13 and 0.23, respectively. According to Cohen’s (1988) guideline for interpreting the SMD—small = 0.2, medium = 0.5, and large = 0.8—the results indicate that the differences in average monthly critical care NCH between the two databases are small for RNs and non-RNs.
Average Monthly Critical Care Nursing Care Hours by Data Source and Intraclass Correlation Coefficients for Nursing Care Hours (N = 48).
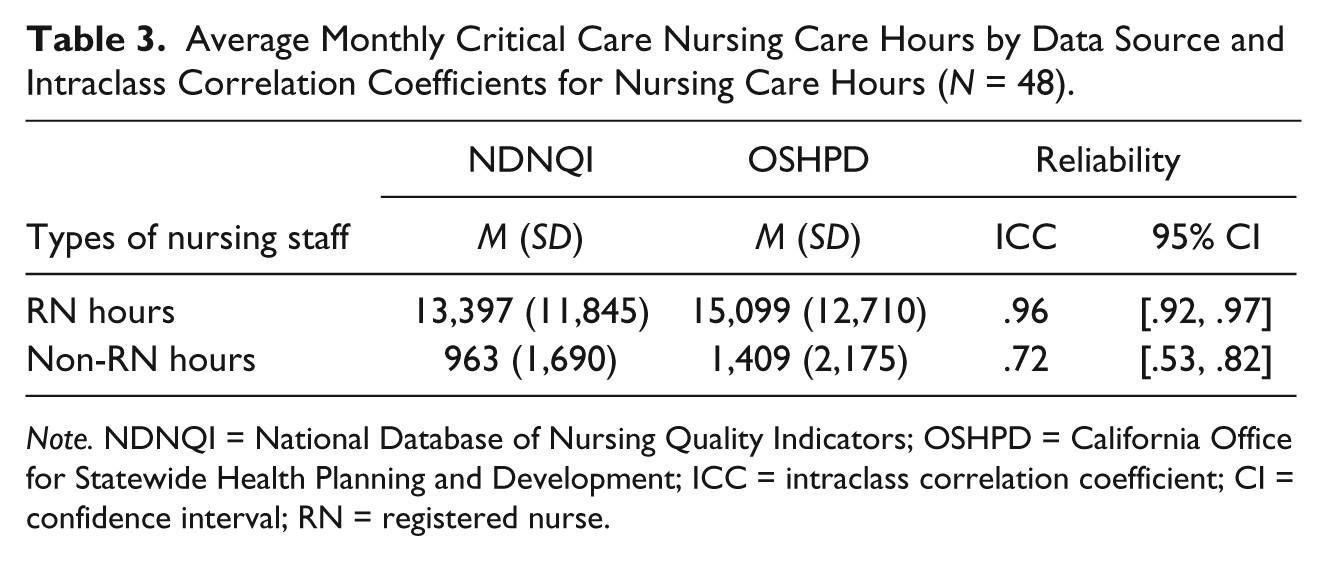
Note. NDNQI = National Database of Nursing Quality Indicators; OSHPD = California Office for Statewide Health Planning and Development; ICC = intraclass correlation coefficient; CI = confidence interval; RN = registered nurse.
Reliability coefficients with 95% confidence intervals (CIs) are presented in Table 3 for each category of NCH (RNs and non-RNs). The estimated ICCs for RN hours and non-RN hours were .96 and .72, respectively. The results indicate that the critical care NCH measures between the two databases have substantial reliability for RN hours and moderate reliability for non-RN hours.
Discussion
NCH has been used as a standard measure in reporting hospital and/or unit nurse staffing. Establishing evidence for the reliability of NCH is vital to support a link between better nurse staffing and better patient outcomes. The NDNQI NCH data are collected from hospitals according to a standardized definition and detailed data collection guidelines. In our study, the NDNQI NCH indicator was reevaluated to determine whether there was continued support for reliability. We assessed the consistency of NDNQI NCH data with those derived from the OSHPD database. ICCs for each of the NCH measures (RNs and non-RNs) were estimated between two databases, and it was determined that NDNQI NCH measures had moderate to high levels of reliability.
Although it appears that the overall definition of NCH is the same in the two databases in regard to productive hours worked by nursing staff, inclusion and exclusion criteria in reporting productive hours are somewhat different. NCH worked by both types of nursing staff (RNs and non-RNs) were somewhat less from the NDNQI than NCH derived from the OSHPD. The observed differences in our sample were small for RN hours and non-RN hours. Our findings are consistent with those from a study that investigated NCH derived from two databases using 2002 data: the OSHPD and the CalNOC (a specific unit-level database that collects data from participating general acute care hospitals in California). Researchers found that RN and LPN hours from the OSHPD were greater than those from the CalNOC for critical care units within the 106 matched hospitals (Spetz et al., 2008). These discrepancies may be explained by the fact that OSHPD’s definition of productive nursing hours includes nondirect patient care hours, such as paid time for attending meetings and educational activities at or away from the hospital. Furthermore, the NDNQI data on NCH for RNs and non-RNs were less dispersed than those from the OSHPD.
The nursing unit is the place where patients receive direct care by nursing personnel and where adverse events occur. Having information at the patient care unit level is beneficial and essential for improving patient safety and quality of care. Although issues regarding unit-level data collection, such as cost, feasibility, and burden of data collection, have been recognized (Needleman, Kurtzman, & Kizer, 2007), several researchers have found that unit-level data were more complete than hospital-level data reported by administrative databases (Jiang, Stocks, & Wong, 2006; Spetz et al., 2008). Jiang et al. (2006) compared nurse staffing data between the AHA and the OSHPD and found that hospital nurse staffing levels from the AHA were higher than those from the OSHPD. Spetz et al. (2008) also found discrepancies on hospital nurse staffing data between the AHA and the OSHPD. For example, the mean number of hospital full-time LPNs in the AHA was higher than in the OSHPD when researchers converted nursing hours data from the OSHPD to FTEs to directly compare data from the two databases. Nevertheless, the most frequently used data for nurse staffing research were hospital-level data from the AHA because this information is publicly available (Unruh, 2008).
We must acknowledge two study limitations. First, units included in our study were limited to critical care units due to inconsistencies between NDNQI and OSHPD in definitions of other types of units. The lower variability of NCH in critical care units compared with other types of units, such as medical or surgical units, may have unknown effects on the measurement of NCH. Second, sample hospitals were limited to those located in the state of California by the data source used. Thus, generalizing study findings to hospitals outside California or to all unit types within hospitals should be undertaken with some caution.
The comparison on NCH measures between the two databases in our study was not an ideal approach because it was conducted at the critical care unit type within a hospital. Further investigation is needed to assess the consistency of the NCH measure at the unit level. It may not be possible to have a single ideal measure of nurse staffing, but it is important to develop a standardized nurse staffing measure at the patient care unit level that can improve the consistency and accuracy of nurse staffing data, as well as the usability and comparability across databases. A standardized definition and specific data collection guidelines on NCH will allow investigators to compare study findings that link nurse staffing and patient outcomes.
In addition to the evidence of feasibility of data collection and reliability of the NDNQI NCH measure in the 2007 study (Klaus et al., 2012), findings from our study provide additional support for reliability of NDNQI NCH data. The high level of agreement between the NDNQI and the OSHPD data is even more noteworthy, given the somewhat different definitions of NCH. The operational definition of NCH by NDNQI is specified to accurately capture the hours worked by nursing staff with direct patient care responsibility. Although the participation in NDNQI is voluntary and the NDNQI database is proprietary, the database has robust unit-level NCH data with a standardized NCH definition, thorough monitoring for data quality, and periodic reliability studies. Thus, the NDNQI NCH measure provides reliable unit-level standardized nurse staffing data elements for national benchmarking reports and research.
Footnotes
Acknowledgements
The authors would like to thank Peggy Miller and Emily Cramer for helpful comments on this article.
Declaration of Conflicting Interests
The author(s) declared no potential conflicts of interest with respect to the research, authorship, and/or publication of this article.
Funding
The author(s) disclosed receipt of the following financial support for the research, authorship, and/or publication of this article: This study was conducted under a contract with American Nurses Association.