
Abstract
Obesity is a chronic, progressive, multifactorial medical condition. It is known that obesity is associated with cardiovascular disease, metabolic disorders, degenerative joint disorders, and decreased health-related quality of life (HRQoL). In addition, there are socio-economic, gender, age, and racial differences in the population distribution of obesity. The extent to which HRQoL is impaired by obesity independent of associated chronic disease and known demographic risk factors is less well understood by nurses. A secondary analysis of the National Health Measurement Study (NHMS) was conducted to illustrate this relationship. Regression analyses were used to assess the association between body mass index (BMI) and HRQol. BMI was categorized as normal, overweight, obese, and morbidly obese. HRQoL was measured using the EQ-5D and EQ-VAS. After adjusting for chronic health conditions and demographic factors, lower HRQoL was observed as BMI category increased for both the EQ-5D, F = 40.49, 15 df, p < .001, and EQ-VAS, F = 35.5, 15 df, p < .001.
Obesity is a public health crisis in the United States and contributes significantly to the global burden of disease (Malik, Willett, & Hu, 2013). The associated health care costs are staggering, as the obese suffer greater chronic disease burden and thus consume a greater proportion of health care resources (Malinoff, Elliott, Giordano, Grace, & Burroughs, 2013). It is estimated that in the United States, health care costs associated with obesity approached 150 billion dollars in 2008 (Malik et al., 2013).
More than two thirds of Americans are overweight (body mass index [BMI] ≥ 25 kg/m2) or obese (BMI ≥30 kg/m2) (Go et al., 2013), and obesity is strongly associated with increased mortality in the U.S. population (Go et al., 2013; Ul-Haq, Mackay, Fenwick, & Pell, 2013). Health conditions associated with obesity include high rates of diabetes mellitus, coronary heart disease, heart failure, and stroke (Allison et al., 2008; Go et al., 2013). Many non-cardiovascular health conditions such as asthma, cancer, chronic renal failure, back pain, and degenerative joint disease are also known to be related to obesity (Allison et al., 2008; Go et al., 2013; Malik et al., 2013; Malinoff et al., 2013). Health-related quality of life (HRQoL) may be diminished in obese individuals due to symptoms associated with obesity-related diseases and medical illnesses. However, obesity is a complex multifactorial disease process with environmental and genetic risk factor and multisystem health consequences (Allison et al., 2008). This study seeks to identify the impact of obesity on HRQoL independent of other obesity associated health conditions in a large sample that is representative of the U.S. population.
HRQoL and Obesity
There is a large body of literature documenting the negative relationship between obesity and HRQoL, but knowledge gaps exist. The majority of published reports of large population based studies were conducted in Europe, and so generalizability to the U.S. population is limited (Maheswaran, Petrou, Rees, & Stranges, 2013). The studies conducted on samples representative of the U.S. population do not include analyses of the morbidly obese (BMI ≥ 40) or do not account for the negative health consequences of being underweight and include those with BMI ≤ 18.5 in the normal weight category (Bentley et al., 2011; Sullivan, Ghushchyan, & Ben-Joseph, 2008; Sullivan, Ghushchyan, Wyatt, Wu, & Hill, 2007). However, the literature does depict the complex nature of the relationship between excess weight and HRQoL.
The multifactorial relation between obesity and HRQoL may be illustrated by analyzing the potential causes of musculoskeletal discomfort in persons with obesity. Obesity may cause chronic back pain because both carrying excessive weight and obesity-related impaired glucose homeostasis place patients at risk of altered musculoskeletal function. In a study by Wilkens, Scheel, Grundnes, Hellum, and Storheim (2013), high BMI and low EQ-5D scores, along with high fasting glucose and disability scores, predicted 31.4% of the variance in reported low back pain (Wilkens et al., 2013).
Morbid obesity carries significant psychological and social burden in addition to the physiological consequences (Oliva-Moreno & Gil-Lacruz, 2013). Obesity is stigmatizing and socially undesirable, so it has an impact on multiple dimensions of quality of life (Wee, Davis, Huskey, Jones, & Hamel, 2013). Herman, Hopman, and Rosenberg (2013) reported gender-related differences in HRQoL based on self-perception of weight category. These authors found that women who identified themselves as being overweight reported lower HRQoL, whereas a difference in HRQoL was only observed in men who identified themselves as obese (Herman et al., 2013). In addition, data from the National Health and Nutrition Examination Survey (NHANES) indicate that caloric consumption has increased over the past decade more among women than men, thus resulting in higher rates of obesity among women in the United States (Go et al., 2013).
There are age, race, and economic based differences in the prevalence of obesity in addition to gender-based differences. Two published reports used data from the 2000 and 2002 Medical Expenditure Panel Survey (MEPS) to illustrate this point (Sullivan et al., 2008; Sullivan et al., 2007). Using data from this large representative sample of U.S. citizens, Sullivan et al. (2007) demonstrated that men, those above age 50, Blacks, Hispanics, and the economically disadvantaged have the highest prevalence rates of cardiometabolic syndrome. These authors reported that EQ-5D scores were lower among persons with obesity (BMI ≥ 30) than those with normal weight category (BMI ≤ 25) (Sullivan et al., 2007). This relationship may have been strengthened had the investigators excluded the underweight from the normal category, as undernutrition is also associated with negative health consequences (Malik et al., 2013).
In another publication, Sullivan et al. (2008) observed the highest mean BMI among Native Americans, Hispanics, and Blacks. A regression analysis demonstrated lower HRQoL scores among the persons with obesity when compared with the normal weight even after controlling for chronic medical conditions. These authors also observed the lowest HRQoL scores, including EQ-5D and EQ-VAS scores, among diabetic persons with obesity. However, only two body weight categories were included in the analyses: normal and obese. The authors did not define the BMI ranges for these categories, and this omission limits the generalizability of these results (Sullivan et al., 2008).
The socio-economic implications of obesity on HRQoL were reported by Minet Kinge and Morris (2010). In this large study of more than 4,900 subjects, the most economically deprived U.K. residents with obesity reported lower HRQoL when compared with obese persons of greater financial means. These authors also reported a strong negative correlation between HRQoL and obesity.
McDonough et al. (2013) found that being overweight or obese was an independent predictor of low HRQoL in a mixed population study of White European and south Asian subjects. These authors showed the relationship between obesity and poor HRQoL to be strengthened after controlling for the potentially confounding effects of gender, age, ethnicity, smoking, vegetable and fruit intake, physical activity, and chronic heart and kidney disease.
In a previously published secondary analysis of the National Health Measurement Study (NHMS) data, Bentley et al. (2011) showed that overweight Black men reported higher HRQoL than any other group analyzed. These authors also reported significantly lower scores on six different HRQoL instruments for each progressively higher BMI category. Although these investigators did exclude underweight subjects and those with BMI > 50 from their final analysis, the obese category included subjects with BMI 30 to 50 (Bentley et al., 2011; Malik et al., 2013).
A preference-based HRQoL survey conducted in England demonstrated that morbid obesity (BMI > 40) was associated with significantly diminished HRQoL. The adjusted multivariable analyses reported by these authors showed reductions in EQ-5D utility scores of 0.105, (95% confidence interval [CI] = [0.072, 0.137]) for morbidly obese subjects (Maheswaran et al., 2013). This study was conducted in the United Kingdom, and so the generalizability of these results to the U.S. population is limited.
No study, in a sample representative of the U.S. population, both excludes the underweight from the normal category and analyzes the morbidly obese separately from the obese. Among the morbidly obese, organ system function, mobility, and life expectancy are severely diminished (Allison et al., 2008). Obesity is a complex medical condition with multiple contributing causes including genetic and environmental factors that are beyond an individual’s ability to control (Allison et al., 2008). There is strong empirical evidence supporting the negative relationship between HRQoL and obesity. Evaluating HRQoL in terms of body size categories, which considers the underweight and morbidly obese in the analysis and controls for the multiple associated medical conditions and environmental and genetic condition, will help illustrate the magnitude of this relationship.
Purpose
The purpose of this study is to describe the relationship between HRQoL and BMI while controlling for obesity-related chronic health conditions and risk factors associated with decreased HRQoL. The ability of the EQ-5D and EQ-VAS to capture this relationship will be evaluated. A secondary objective is to estimate the effect size of the relationship between HRQoL and BMI category.
Method
Data from the NHMS were used for this analysis. The NHMS compared commonly used preference-based HRQoL instruments administered simultaneously to a cross-section of the U.S. population obtained through random digit dialing. The representative sample included oversampling of minorities. The sampling and weighting scheme has been described previously (Fryback et al., 2007).
All data were collected between June 2005 and August 2006 by trained interviewers at the Wisconsin Survey Center using commercial computer-assisted telephone interview software. The sample consisted of 3,783 community dwelling adults and older adults aged 35 to 89 years. Demographic data collected in the survey included gender, race, marital status, and socio-economic information.
The dependent variable HRQoL was operationalized by the single item EQ-VAS and the 5-item EQ-5D (Rabin & de Charro, 2001; Shaw, Johnson, & Coons, 2005). The EQ-5D consists of asking subjects to rate their level of health problems on five dimensions: mobility, self-care, usual activities, pain, and anxiety/depression. Each dimension is rated as follows: 1 “no health problems,” 2 “moderate health problems,” and 3 “extreme health problems.” A U.S.-preference-based scoring algorithm is then applied to calculate the EQ-5D score that may range from 0 (death) to 1.0 (perfect health; Shaw et al., 2005). For the EQ-VAS, subjects are asked to rate their health state on an imagined visual analog scale bounded by 0 (i.e., “worst imaginable health state”) and 100 (i.e., “best imaginable health state”) (Rabin & de Charro, 2001; Shaw et al., 2005).
The EQ-5D was selected because it has well established reliability and validity (Luo, Johnson, Shaw, Feeny, & Coons, 2005; Shaw et al., 2005) and has been normed in the U.S. population (Fryback et al., 2007). In a survey of 4,048 community dwelling adults, the reported Spearman’s correlations coefficients for the EQ-5D subscales and the comparable subscale scores for the Health Utilities Index Mark 2 (HUI2) were as follows: mobility = 0.63, self-care = 0.57, pain = 0.64, anxiety/depression = 0.51 (Luo et al., 2005). The reported Pearson’s correlations for the EQ-5D are 0.71 with the HUI2, and 0.64 for both the Quality of Wellbeing Scale Self-Administered (QWB-SA), and the Health and Activities Limitations Index (HALeX) (Fryback et al., 2007). The reported mean EQ-5D for adults aged 35 to 44 is 0.89, and it declines in each subsequent decade of life to 0.84 among those aged 75 to 89 (Fryback et al., 2007).
BMI was calculated using self-reported height and weights. The formula for calculating BMI is weight in pounds multiplied by 703 then divided by height in inches. The following BMI classifications were used in this secondary analysis: Normal range BMI = 18.5-25; Overweight BMI = 25-29.9; Obese BMI = 30-39.9; Morbid Obesity BMI ≥ 40 (World Health Organization [WHO], 1995). These ranges are consistent with the weight categories used by the WHO and the U.S. Department of Health and Human Services and reflect the BMI categories associated with increased, high, and extremely high risk of cardiovascular disease and metabolic syndrome.
Self-reported health conditions associated with both obesity and decreased HRQoL included in the analysis were diabetes, chronic heart disease, osteoarthritis, back pain, and chronic airway disease (Maheswaran et al., 2013; Malinoff et al., 2013; McDonough et al., 2013; Wilkens et al., 2013). In addition, age, gender, race, and socio-economic status were included in the adjusted model as prior research has demonstrated a relationship between these variables with both HRQoL and obesity (Go et al., 2013; Herman et al., 2013). Because socio-economic status could not be measured directly, income and education level served as proxy.
Linear regression analyses were conducted to examine the relationship between BMI category and HRQoL in the sample. For comparisons between each HRQoL instrument and BMI category, bivariate analyses were used. Analyses of covariance were used to compare mean HRQoL scores across BMI groups adjusting for other variables. Weighted means and standard deviations of the EQ-5D score and the EQ-VAS stratified by BMI category were calculated. Unadjusted and adjusted mean differences between each of the BMI categories for the scores for each measure were estimated. Two models were estimated: (a) an unadjusted model and (b) a model adjusted for age, gender, race, income, education, back pain, respiratory conditions, arthritis, coronary heart disease, and diabetes. Finally, effect sizes were calculated to estimate standardized group differences from the adjusted and unadjusted model using the residual standard error of the model. In this context, the effect size is an indicator of the measure’s ability to discriminate between known groups. An alpha of .05 was used to assess statistical significance for all comparisons. All analyses were performed using SAS Version 9.3 and utilized the trimmed, post-stratification sampling weights to produce nationally representative estimates.
Results
Of the 3,844 subjects included in the original dataset, 61 had missing data on weight and/or height and were excluded leaving a total of 3,783 subjects available for analysis. Less than 1% of the data was unavailable for analysis. More women (57%) than men (43%) participated in the survey. The mean subject age was 60 years (SD = 14), and the majority of participants were under age 55. Most subjects identified themselves as White and partnered with another person (51.6%). Approximately 68% of the sample was overweight or obese based on their self-reported weights and heights. The weighted and unweighted demographic characteristics of the final sample are presented in Table 1.
Actual and Weighted Demographic Characteristics of National Health Measurement Study Participants (N = 3,783).
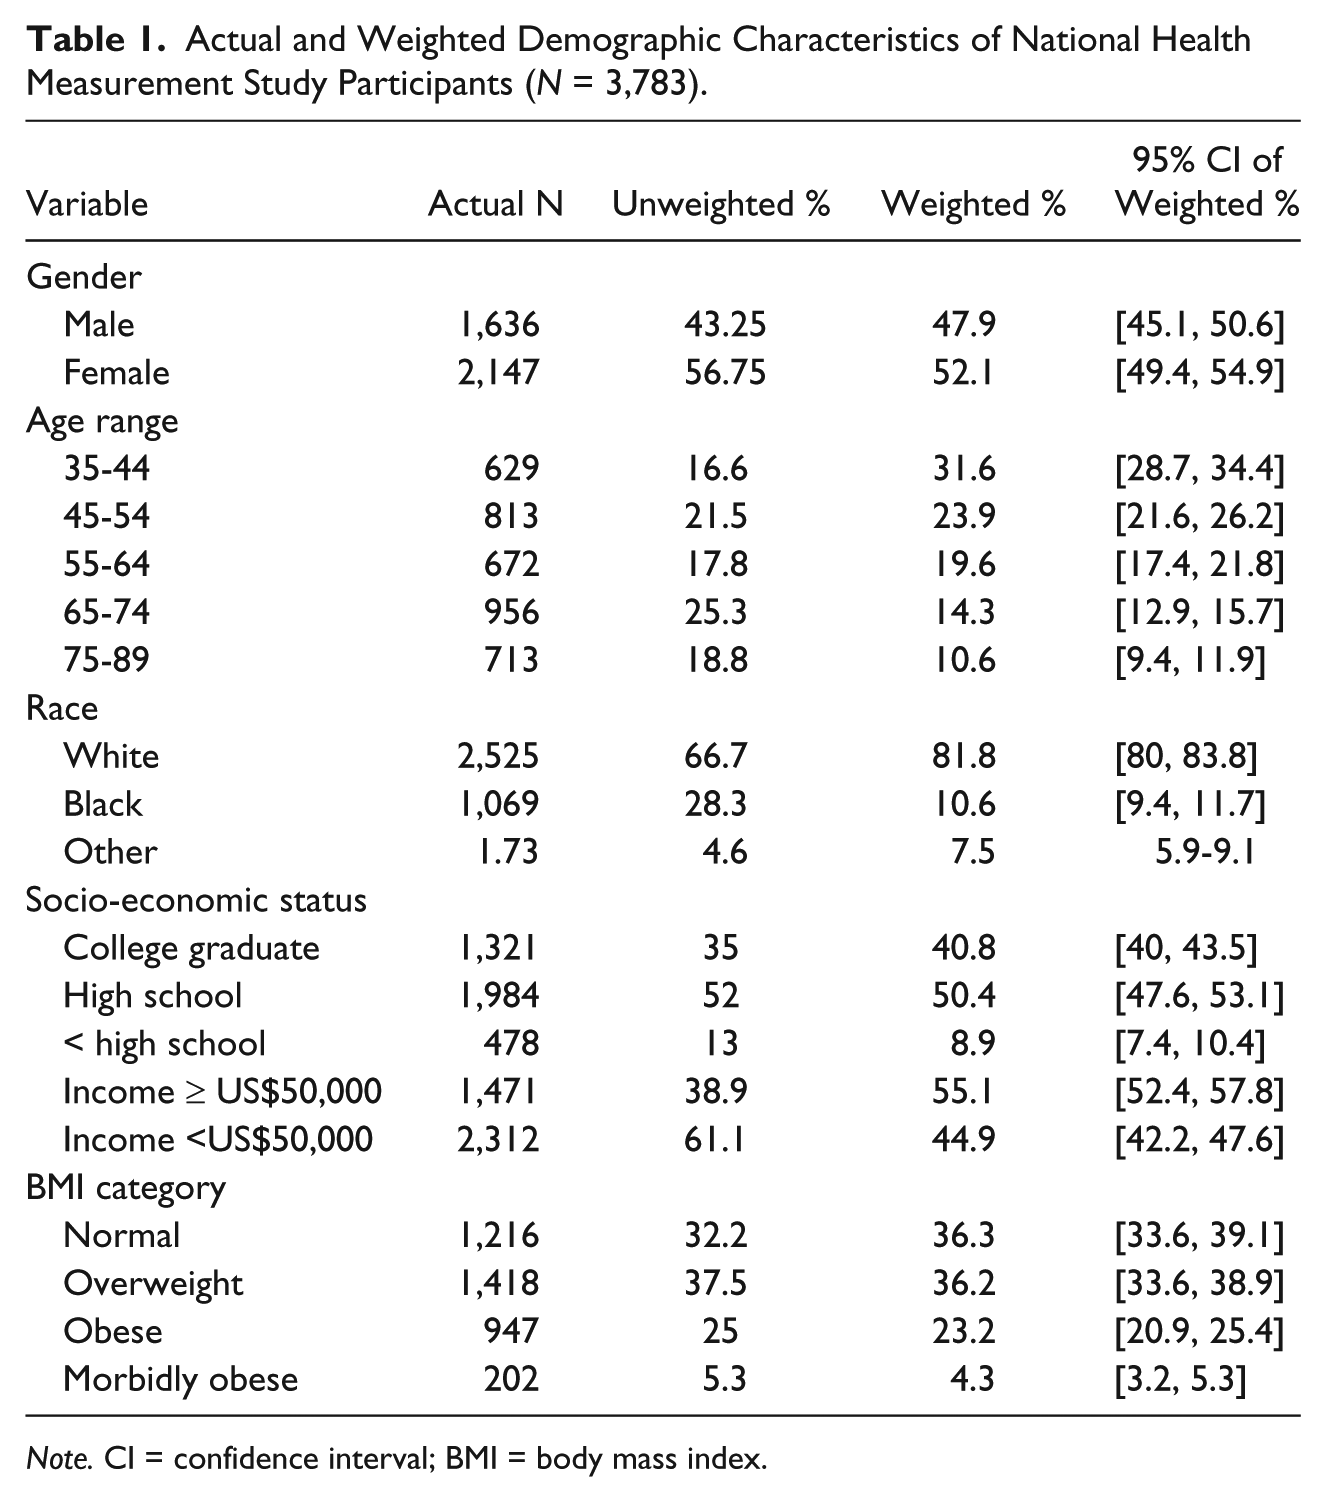
Note. CI = confidence interval; BMI = body mass index.
A significant relationship was observed between BMI and EQ-VAS unadjusted, F = 16.69, 3 df, p < .001, and adjusted, F = 35.51, 15 df, p < .001, and BMI and EQ-5D unadjusted, F = 13.34, 3 df, p < .001, and adjusted, F = 40.49, 15 df, p < .001; Table 2. Mean HRQoL scores were progressively lower for each BMI category from normal to morbidly obese in both the EQ-5D and the EQ-VAS unadjusted and adjusted analyses. Analyses including a category for underweight (BMI < 18.5) were also conducted, but no differences between the underweight and normal weight groups were found.
EQ-5D and EQ-VAS Scores Means by BMI Category (N = 3,761).
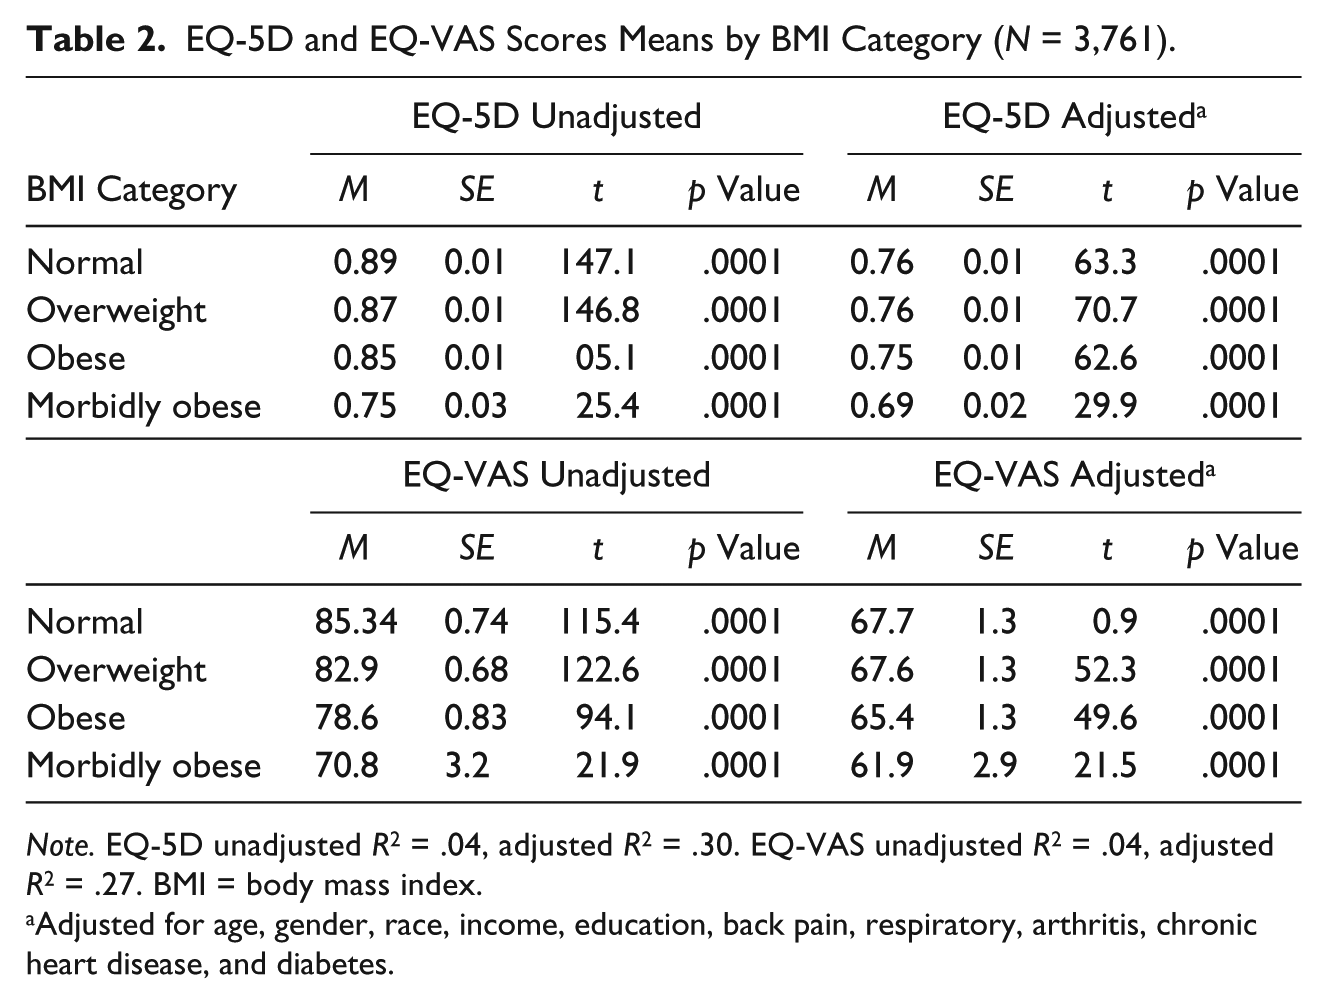
Note. EQ-5D unadjusted R2 = .04, adjusted R2 = .30. EQ-VAS unadjusted R2 = .04, adjusted R2 = .27. BMI = body mass index.
Adjusted for age, gender, race, income, education, back pain, respiratory, arthritis, chronic heart disease, and diabetes.
Table 3 shows the difference in mean score between BMI categories for both the EQ-5D and the EQ-VAS unadjusted and adjusted analyses. In the unadjusted analysis, differences in mean EQ-5D score and mean EQ-VAS were statistically significant between all BMI categories. The morbidly obese category had significantly lower unadjusted mean EQ-5D and EQ-VAS scores compared with the obese, overweight, and normal weight categories. On adjustment for age, gender, race, income, education, and related comorbidities, the pattern of progressively lower HRQoL scores for each BMI category from normal to morbidly obese for both the EQ-5D and the EQ-VAS was reduced but preserved. However, in the adjusted analysis of the EQ-VAS, there was no longer a significant difference between the morbidly obese and obese categories (t = −1.23, p = .22) and the overweight and normal weight categories (t = −.13, p = .9). After adjustment for age, gender, race, income, education, and health conditions, the difference between obese and normal (t = −1.07, p = .28), the obese and overweight (t = −1.08, p = .28), and the overweight and normal categories (t = .07, p = .9), EQ-5D scores were no longer significant.
EQ-VAS and EQ-5D Scores Mean Differences (N = 3,761).
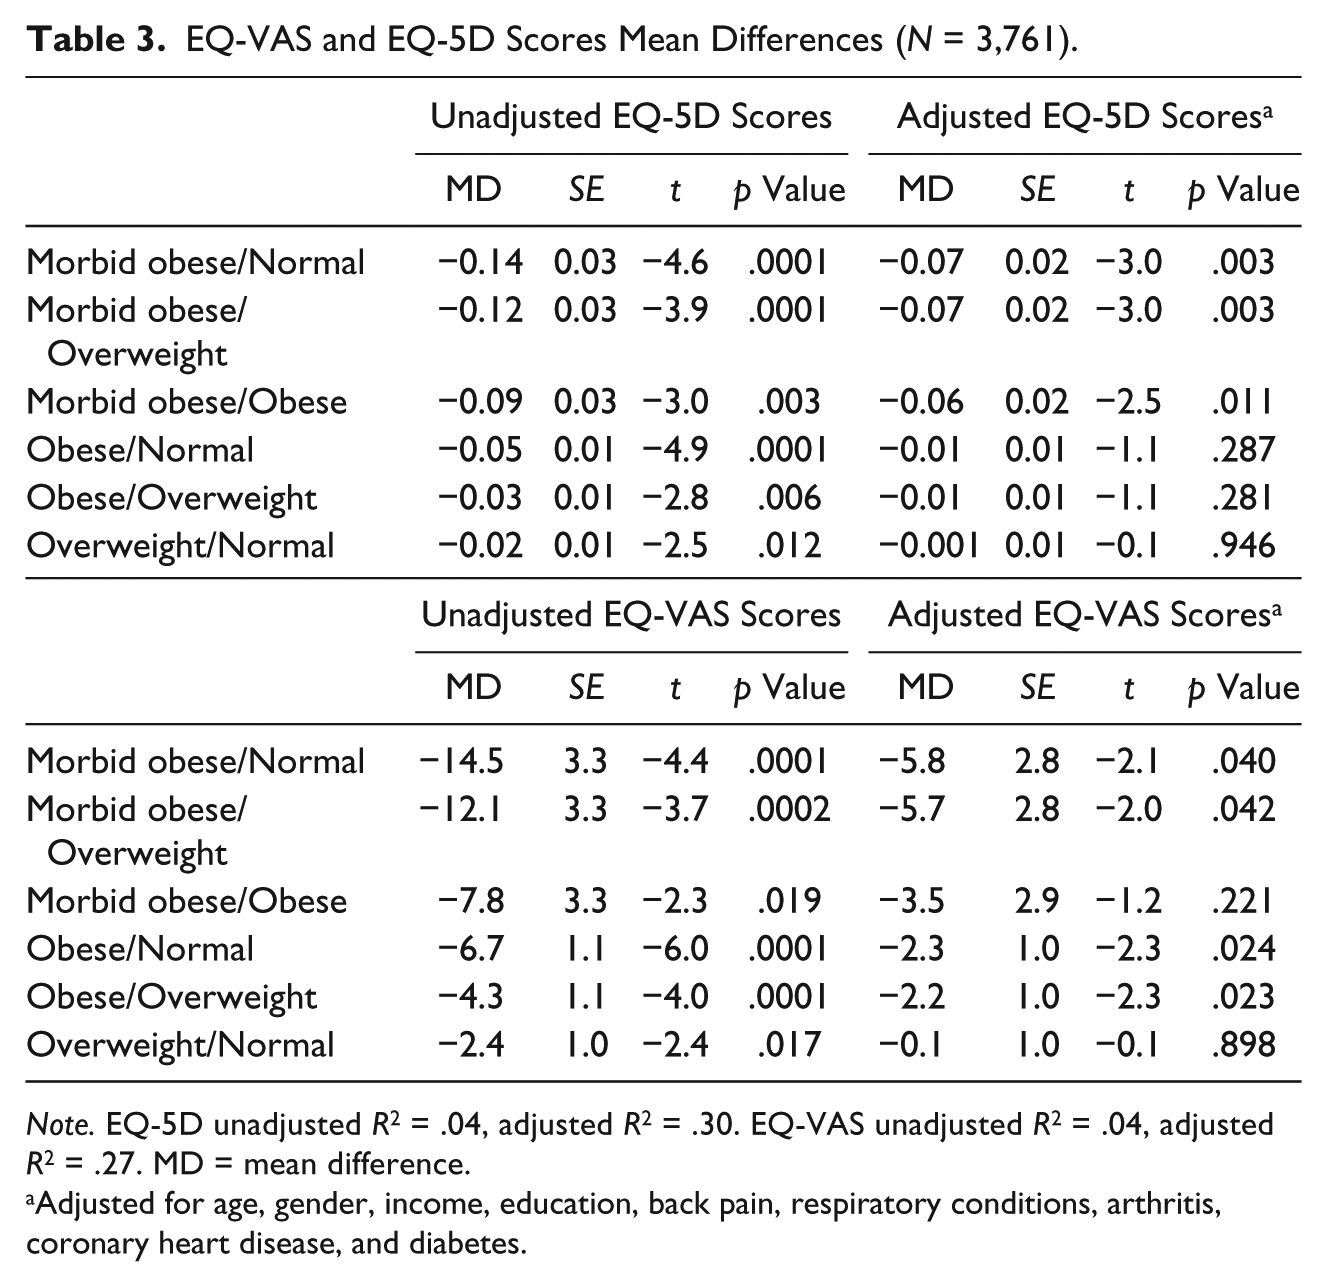
Note. EQ-5D unadjusted R2 = .04, adjusted R2 = .30. EQ-VAS unadjusted R2 = .04, adjusted R2 = .27. MD = mean difference.
Adjusted for age, gender, income, education, back pain, respiratory conditions, arthritis, coronary heart disease, and diabetes.
Effect sizes were calculated for the difference in mean scores between BMI categories for both the EQ-5D and the EQ-VAS for the unadjusted and adjusted models (Table 4). Unadjusted, the effect sizes ranged from 0.86 to 0.14 for the EQ-VAS and 0.93 to 0.13 for the EQ-5D. The effect sizes ranged from 0.39 to 0.01 for the EQ-VAS and 0.54 to 0.008 for the EQ-5D in the adjusted model. When comparing the morbidly obese category with the other weight categories, the EQ-5D demonstrated higher effect sizes, when compared with effect sizes for the EQ-VAS. For both measures, comparisons between the morbid obese category and the other weight categories were larger than comparisons made between any of the other category pairings.
EQ-VAS and EQ-5D Scores Unadjusted and Adjusted Mean Differences Effect Sizes by BMI Category (N = 3,761).
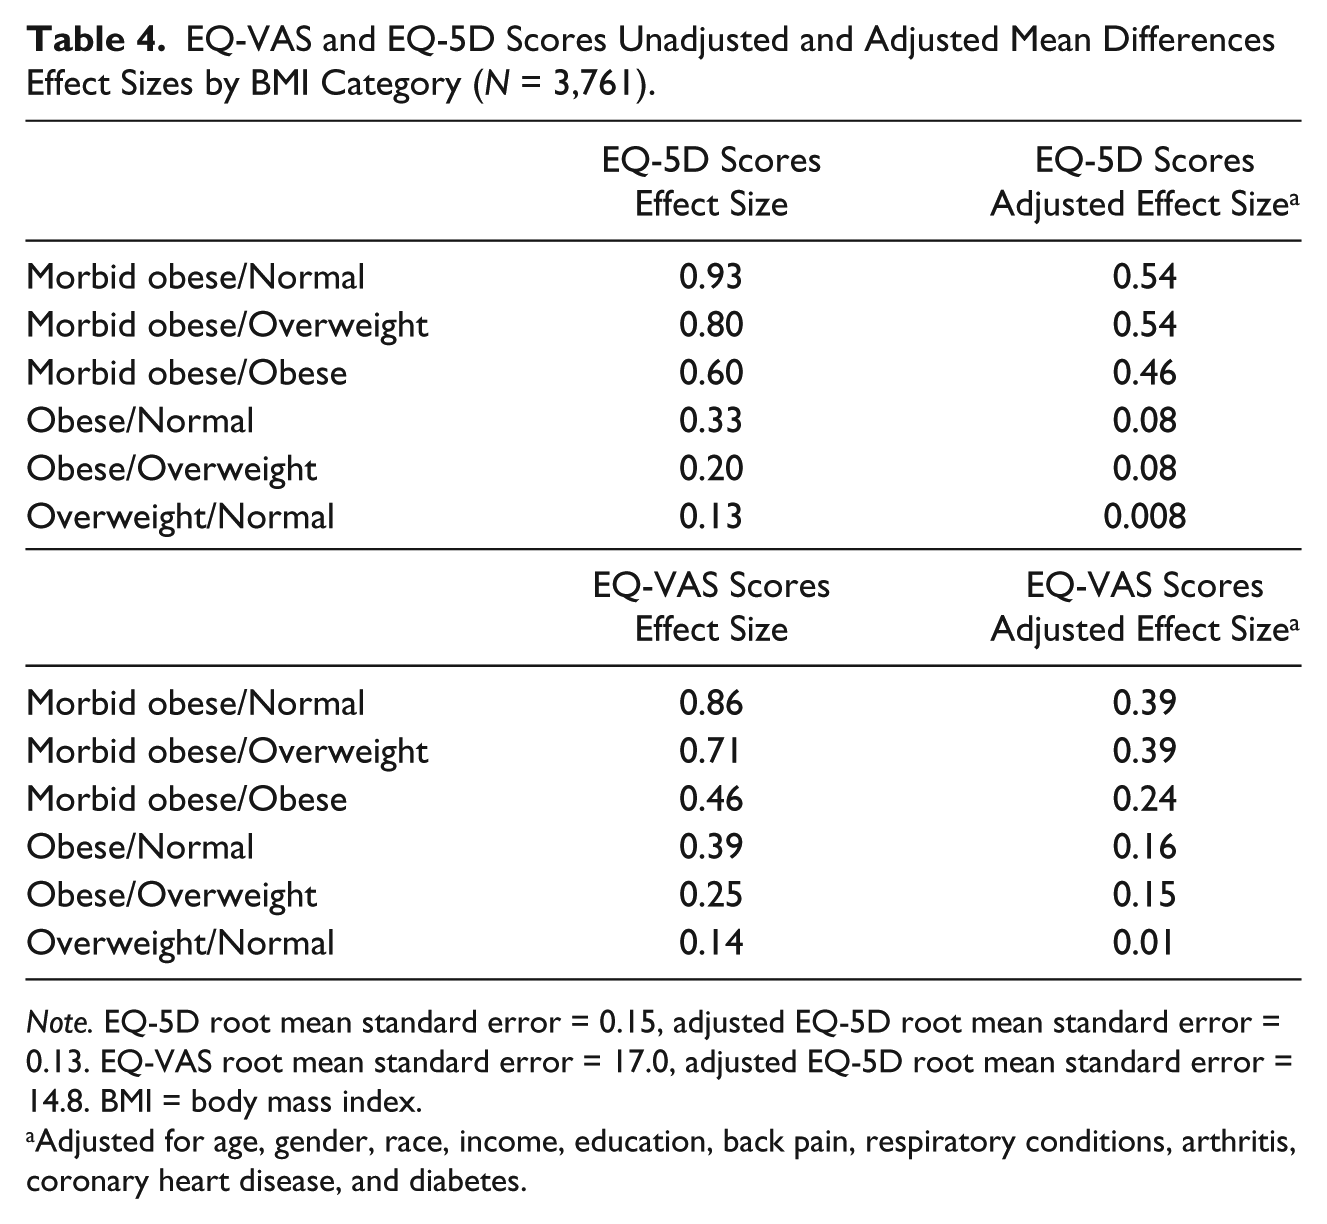
Note. EQ-5D root mean standard error = 0.15, adjusted EQ-5D root mean standard error = 0.13. EQ-VAS root mean standard error = 17.0, adjusted EQ-5D root mean standard error = 14.8. BMI = body mass index.
Adjusted for age, gender, race, income, education, back pain, respiratory conditions, arthritis, coronary heart disease, and diabetes.
Discussion
The results of this secondary analysis supported prior reports of a negative relationship between HRQoL and high BMI (Lee, Kim, & Cho, 2013; Maheswaran et al., 2013; McDonough et al., 2013; Ul-Haq et al., 2013). Analyzing the BMI data based on hierarchical categories helped illustrate the point that diminished HRQoL as a significant problem for the obese and morbidly obese and that there is a dose response relationship even after controlling for confounders and chronic conditions known to be associated with obesity.
Non-obese subjects in this study reported higher overall HRQoL even after controlling for chronic health conditions. We found that morbidly obese persons demonstrated significantly lower HRQoL compared with their obese, overweight, and normal weight counterparts when HRQoL was measured using the EQ-5D and the EQ-VAS. This finding is consistent with previous research conducted in the United Kingdom by Maheswaran et al. (2013). Given the rising rates of morbid obesity and the apparent greater impact of morbid obesity on HRQoL, it is imperative for researchers to begin assessing this category separately from obese.
Demonstrated effect sizes were larger using the EQ-5D compared with the EQ-VAS for comparisons between the morbidly obese and other weight categories. In addition, the EQ-VAS showed only a small effect size for comparisons between the lower weight categories. It is possible that the EQ-5D is more sensitive to detriments in HRQoL for persons who are in the morbidly obese range; whereas the EQ-VAS is a better indicator for discriminating between persons with BMIs in the normal to obese range.
This finding could also reflect a dose response to obesity. It is possible that once HRQoL is significantly reduced by the burden of carrying excess weight, the influence of additional weight is less apparent to the individual. This may also account for the larger effect sizes found only in the morbid obese categories of the EQ-5D in the adjusted model.
The results of this study are limited by a number of factors. This was a secondary analysis, and data were not collected with the intent of examining the relationship between BMI and HRQoL. Because obesity was not a focus of the original study, BMI was calculated based on subjects’ self-report of height and weight. The BMI scores reported here may in fact be different from subjects’ actual BMI. It has been demonstrated that self-reported BMI tends to be overestimated by those in the lower range (<22 BMI) and underestimated by those in the higher range (>28 BMI; Stommel & Schoenborn, 2009). In addition, the NHMS was a cross-sectional study, so the long-term impact of excessive body weight on HRQoL cannot be addressed by this investigation. Future prospective research tracking changes in HRQoL and BMI over time would help establish whether there is a temporal relationship between these variables.
Although secondary analyses have limitations, nurses should consider using existing databases as sources for answering their research questions. Publically available secondary data sources are often large, nationally representative, and allow multiple comparisons while controlling for potential confounding variables. Such analyses may be used to refine research questions, or to identify target populations for future human subject research. Nurses possess unique empirical knowledge of health conditions that allows them to identify areas of inquiry not addressed by population health focused researchers. In addition, HRQoL is a commonly used health outcome measure for program evaluation but can and should be used to evaluate individual need for and response to interventions.
Numerous reliable and valid HRQoL instruments are available. Nurses should take advantage of using instruments such as the EQ-5D and EQ-VAS because they are normed to the U.S. population, are simple to use, and both may be completed in less than 2 min (Fryback et al., 2007). In health care settings where BMI may be directly measured and categorized, clinicians should consider measuring health outcomes such are HRQoL for appraising disease progression and evaluating care especially among persons with morbid obesity.
Footnotes
Declaration of Conflicting Interests
The author(s) declared no potential conflicts of interest with respect to the research, authorship, and/or publication of this article.
Funding
The author(s) disclosed receipt of the following financial support for the research, authorship, and/or publication of this article: During the preparation of this manuscript, Laura McLaughlin was funded by the Oncology Nursing Society (ONS) Foundation. She was the RE02 Career Development Award recipient for 2012. The ONS Foundation Career Development Award was sponsored through an unrestricted grant from Genentech, Inc.