
Abstract
Objective
To determine characteristics and trends for outpatient otolaryngology visits and practices in the United States.
Study Design
Cross-sectional analysis of national survey database.
Setting
Ambulatory care settings in the United States.
Methods
Outpatient otolaryngology records from 2005 to 2009 were extracted from the National Ambulatory Medical Care Survey. Visit characteristics were assessed for patient type (established versus new), expected source of payment, and average time spent with the physician. Provider characteristic variables were assessed for practice type (solo versus group), employment status of the physician, electronic claims submission, and the use of electronic medical records in the practice. Trends were analyzed for the above and the average number of outpatient visits per otolaryngologist per year.
Results
A total of 98.8 ± 7.0 million outpatient otolaryngology office visits, consisting of 27.9 ± 2.1 million new patient visits and 70.9 ± 5.3 million established patient visits, were studied. Expected sources of payment consisted of private insurance (65.1%), Medicare (21.1%), Medicaid (9.2%), and self-pay (2.0%). These sources did not change over the 5 calendar years (P = .301). Practitioners consisted of solo (30.7%) and group (69.3%) practices. Electronic medical records were in use in 40.2%. Electronic medical record penetration did significantly increase over the 5 years to 57.7% in 2009 (P = .002). The number of outpatient visits per otolaryngologist per year remained remarkably consistent over the years at about a mean of 3325 ± 299 visits seen per year (P = .580).
Conclusion
Characteristics of otolaryngology outpatient visits have remained largely consistent over the past 5 years. Electronic medical record penetration has noticeably increased. These results help validate prior Academy socioeconomic surveys.
The socioeconomics of medicine, once considered an almost taboo subject in medical circles, have become increasingly important in the evolving health care landscape in the United States. With current and expected changes in provision of medical care, such as quality metric reporting and accountable care organizations, characteristics of the health care provider have come under increasing scrutiny.1,2 Federal legislation regarding electronic medical records, electronic prescribing, and access to care are also raising the concerns of medical providers in all disciplines. 3
Therefore, it is essential to maintain a contemporary understanding of the characteristics of medical providership in all areas of medicine, including otolaryngology–head and neck surgery. The American Academy of Otolaryngology—Head and Neck Surgery has conducted continued surveillance of the “business of medicine” as it applies to otolaryngology. This has manifested perhaps most prominently in the form of recurring socioeconomic surveys of the Academy membership. 4 These surveys cover multiple aspects of practice including practice ownership, services offered and rendered, expectations regarding future practice plans, and a cross-sectional, descriptive analysis of many other otolaryngologic practice characteristics.
However, skeptics might question the results of these surveys as they are voluntary, have a relatively low reported response rate, and may suffer from several potential biases. To our knowledge, the data published from these surveys have not been externally validated. Therefore, we sought to potentially validate the results of these Academy-based socioeconomic surveys via an outside data source, the National Ambulatory Medical Care Survey (NAMCS). The NAMCS provides objective, reliable information about the provision and use of ambulatory medical care services in the United States. Findings are based on a sample of visits to non–federally employed office-based physicians who are primarily engaged in direct patient care. 5 This annually conducted survey, obtained by the National Center for Healthcare Statistics of the Centers for Disease Control, contains several data elements regarding characteristics of the office visits and characteristics of the health care provider in the ambulatory medical care setting. These data elements may serve as independent points of validation for the Academy’s socioeconomic survey results.
Methods
The American Academy of Otolaryngology—Head and Neck Surgery conducted and published the results of 2 recent socioeconomic surveys concerning the business of medicine in 2008 and 2011. 4 From the published results for the 2 socioeconomic surveys, reporting variables were extracted that could be matched against analogous data fields present in the NAMCS data set.
The NAMCS data set used for validation included the 5 calendar years 2005 to 2009, inclusive. 6 From this combined data set, the records for ambulatory medical care visits to an otolaryngology provider were extracted and imported into SPSS (version 17.0; IBM Corp, Armonk, New York). This study was deemed exempt from review by the Partners Human Research Committee. The following visit characteristic variables were extracted: patient type (established versus new), expected source of payment, and average time spent with the physician. The following provider characteristic variables were extracted: practice type (solo versus group), employment status of the physician, electronic claims submission, and the use of electronic medical records in the practice.
Aggregate data were obtained to characterize the visits and the providers combining all calendar years. Next, trends across the calendar years were investigated for number of patients seen per physician per year, expected source of payment, and use of electronic medical records. Trends were also examined across the calendar years for time spent with physician, stratified according to new patient versus established patient visits. As the data from the NAMCS rely on stratification, clustering, and sample weights, appropriate statistical algorithms (complex samples procedures CSTABULATE and CSGLM in SPSS) were used to account for the structured survey design of the NAMCS. Standard errors are reported to determine the relative accuracy of the estimates. 6 Statistical significance for χ2 and analysis of variance was set at P = .05 within the complex samples algorithms above. Qualitative comparisons between the data obtained from the NAMCS and the reported data from the published 2008 and 2011 socioeconomic surveys are discussed.
Results
For the calendar years 2005 to 2009, there were an estimated 98.8 ± 7.0 million outpatient otolaryngology office visits, consisting of 27.9 ± 2.1 million new patient visits and 70.9 ± 5.3 million established patient visits. Table 1 presents the aggregate characteristics for these visits according to patient type and expected source of payment. Table 1 also presents characteristics of the outpatient otolaryngology practices in aggregate over the 5 years
Characteristics of Outpatient Otolaryngology Visits in the United States, 2005-2009
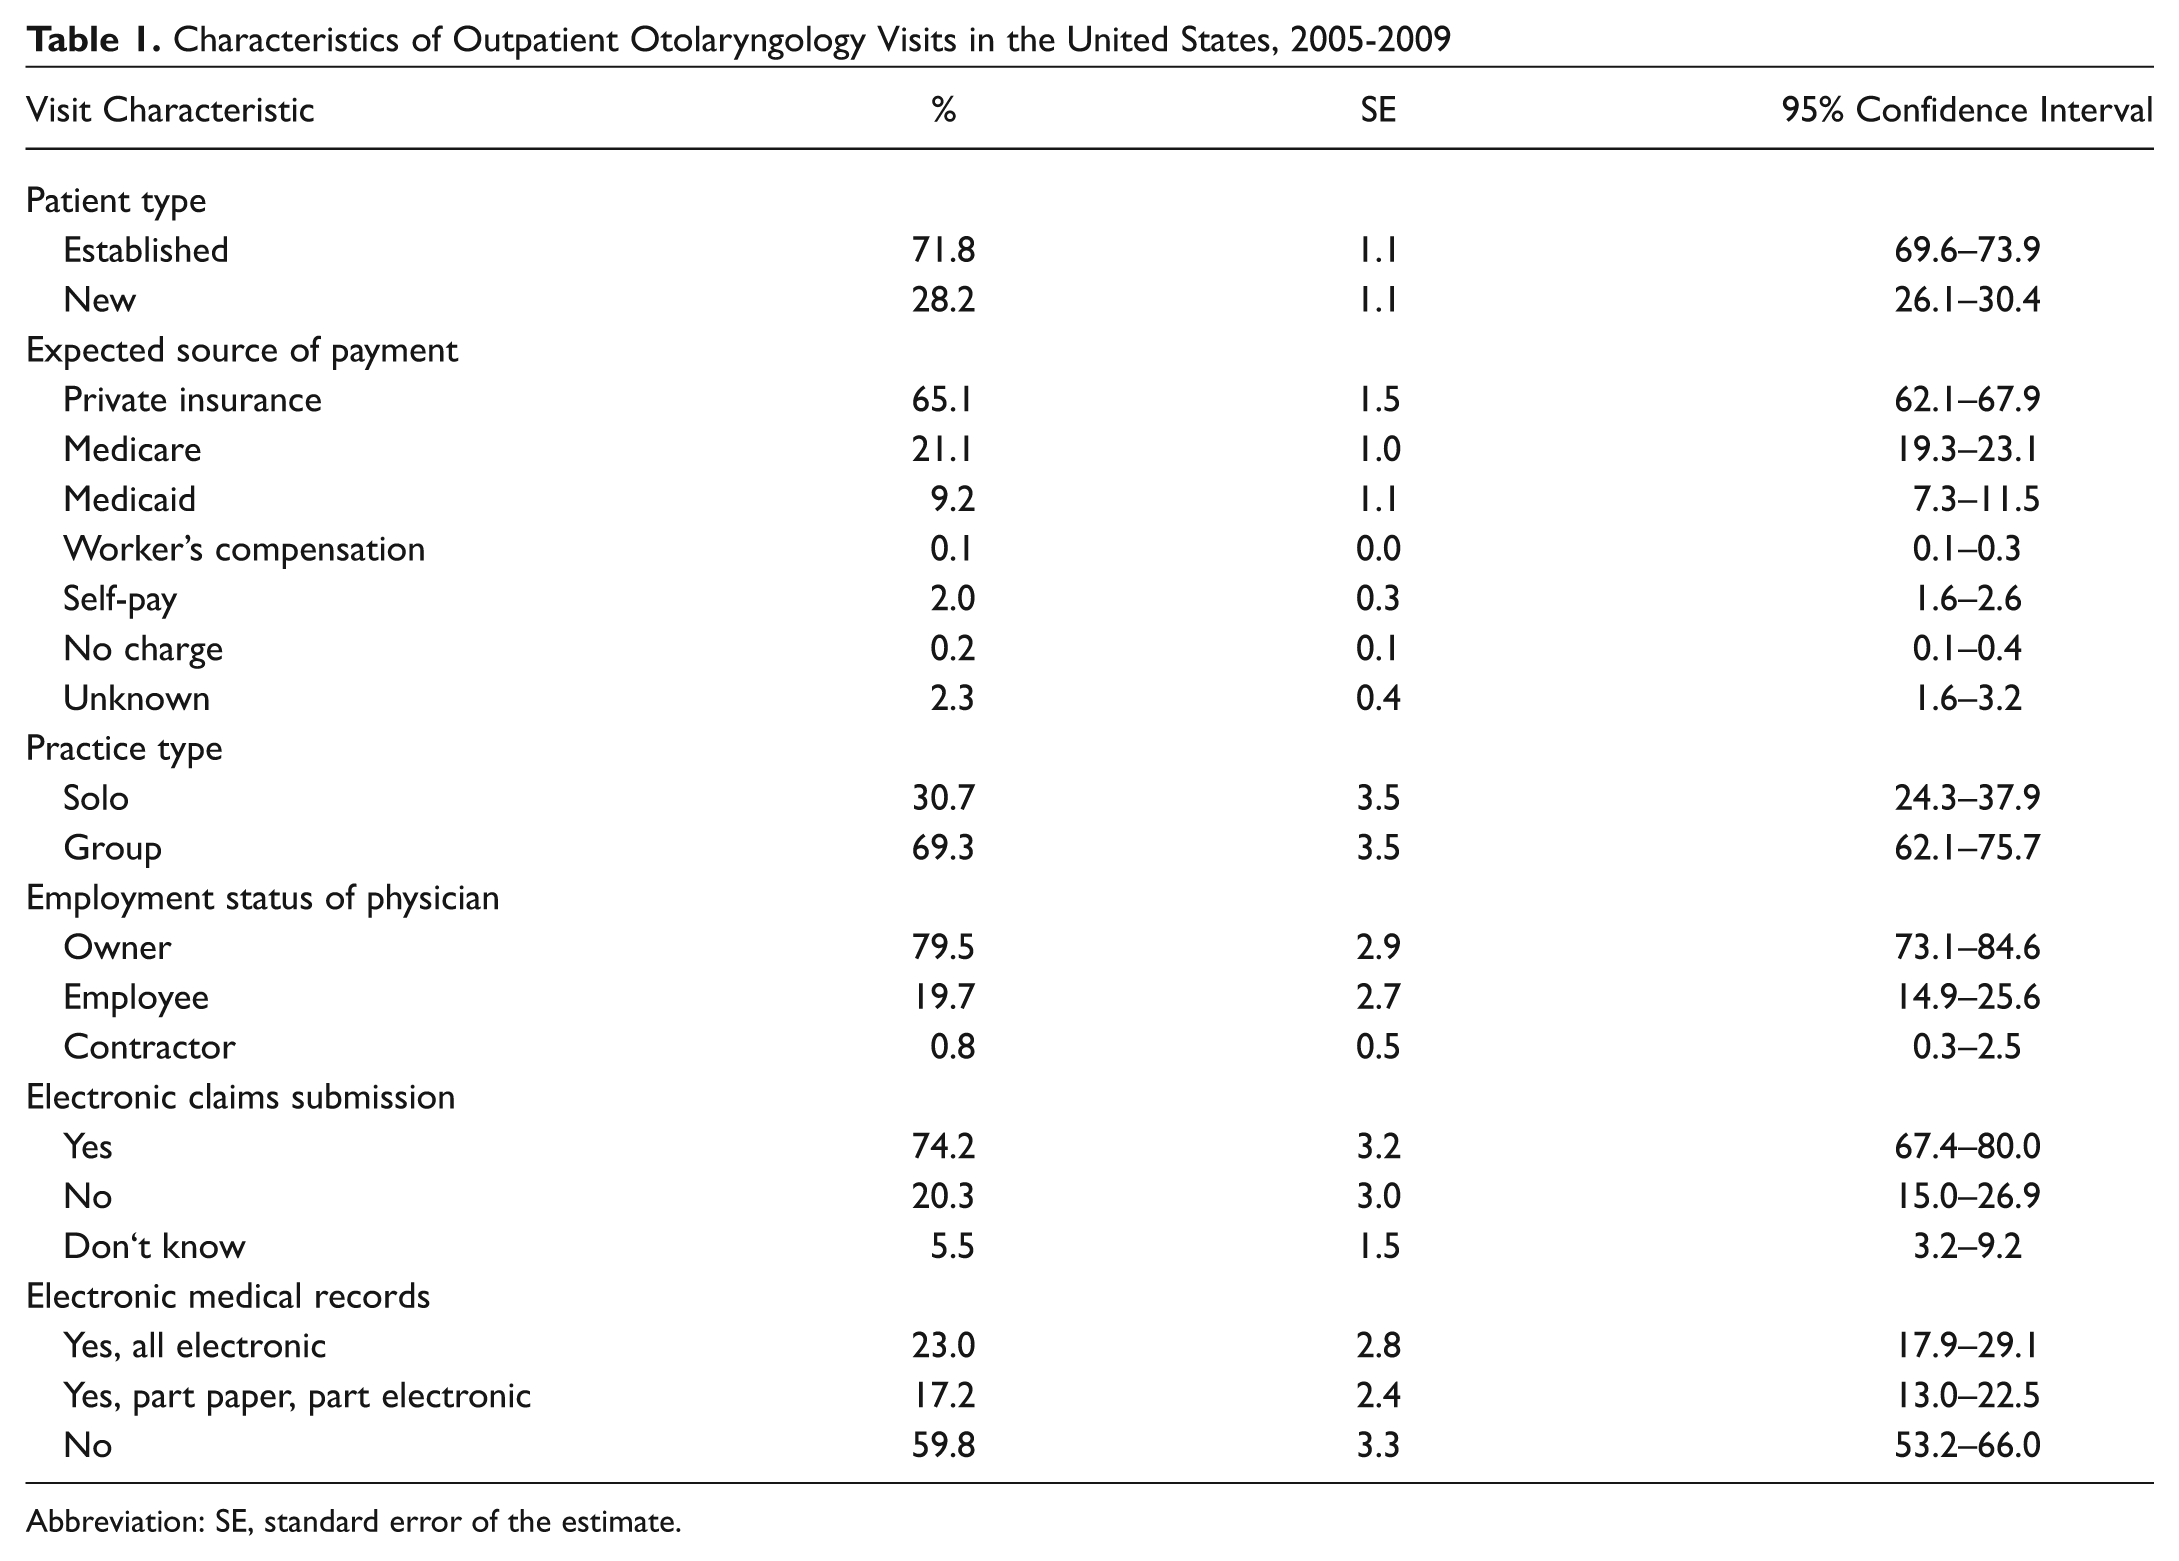
Abbreviation: SE, standard error of the estimate.
With respect to trends across the years, Figure 1 presents the relative distribution of expected payment source by year. The distribution of expected source of payment did not significantly change from year to year (P = .301). Figure 2 presents the average number of outpatient visits per otolaryngologist per year according to study year. The average number of outpatient visits per physician per year was not significantly different across the study years (P = .580). Finally, Figure 3 presents the penetration of electronic medical records into outpatient otolaryngology practices according to study year. The increasing prevalence of electronic medical records across the study years was statistically significant (P = .002). With respect to the duration of the average office visit as measured by time spent with the physician, there was no significant change over the study years in this parameter, both with respect to new patient visits (P = .994) and established patient visits (P = .107; Table 2 ).
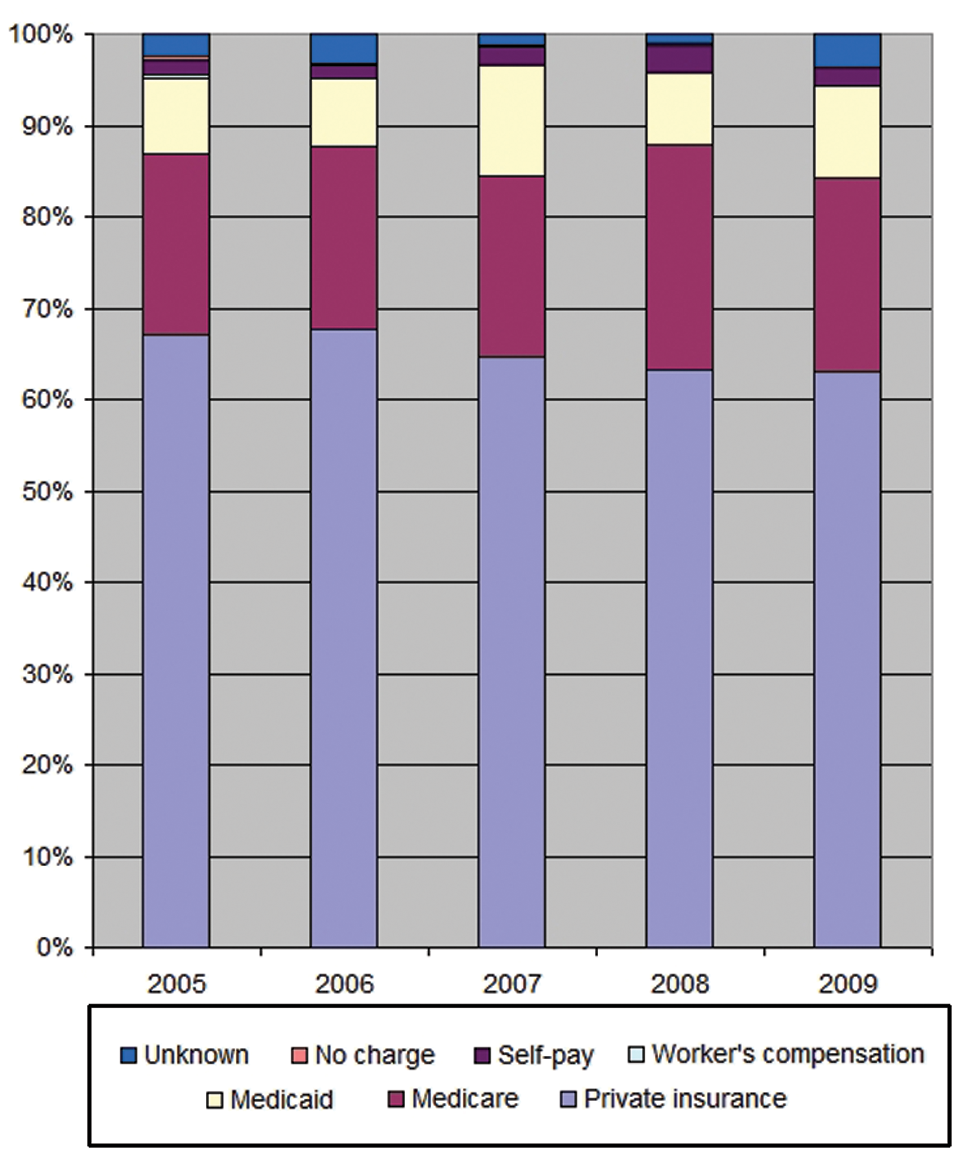
Expected source of payment for outpatient otolaryngology visits according to year.
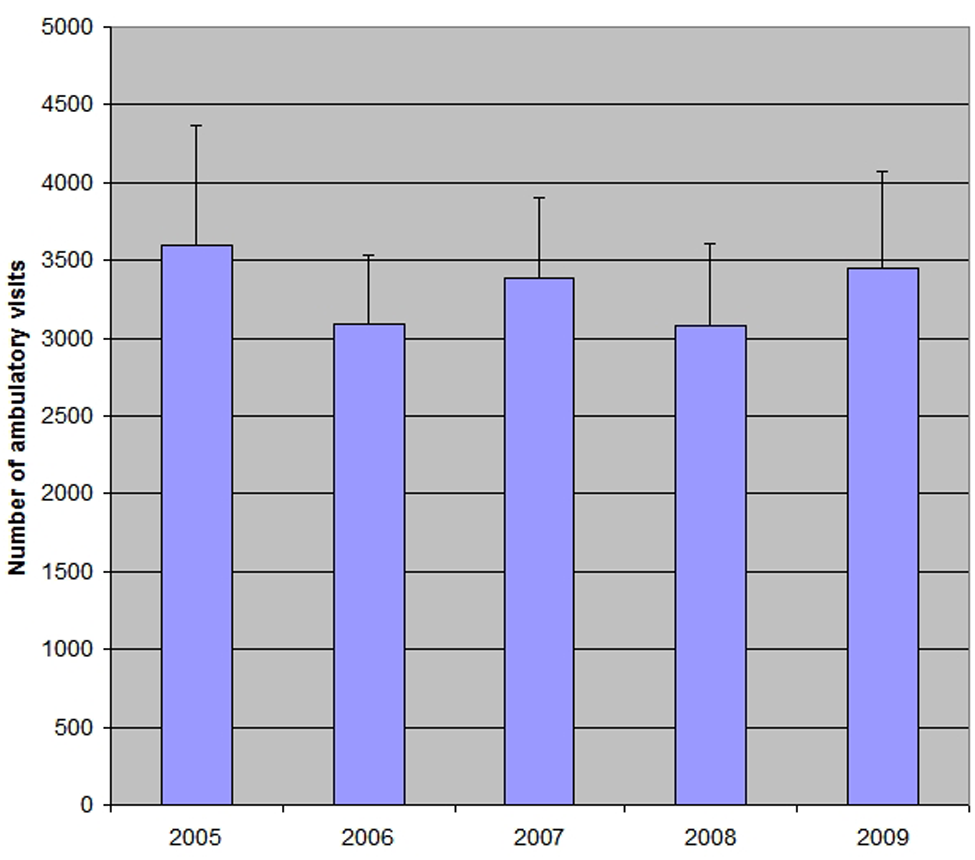
Average number of outpatient visits per otolaryngologist according to year.
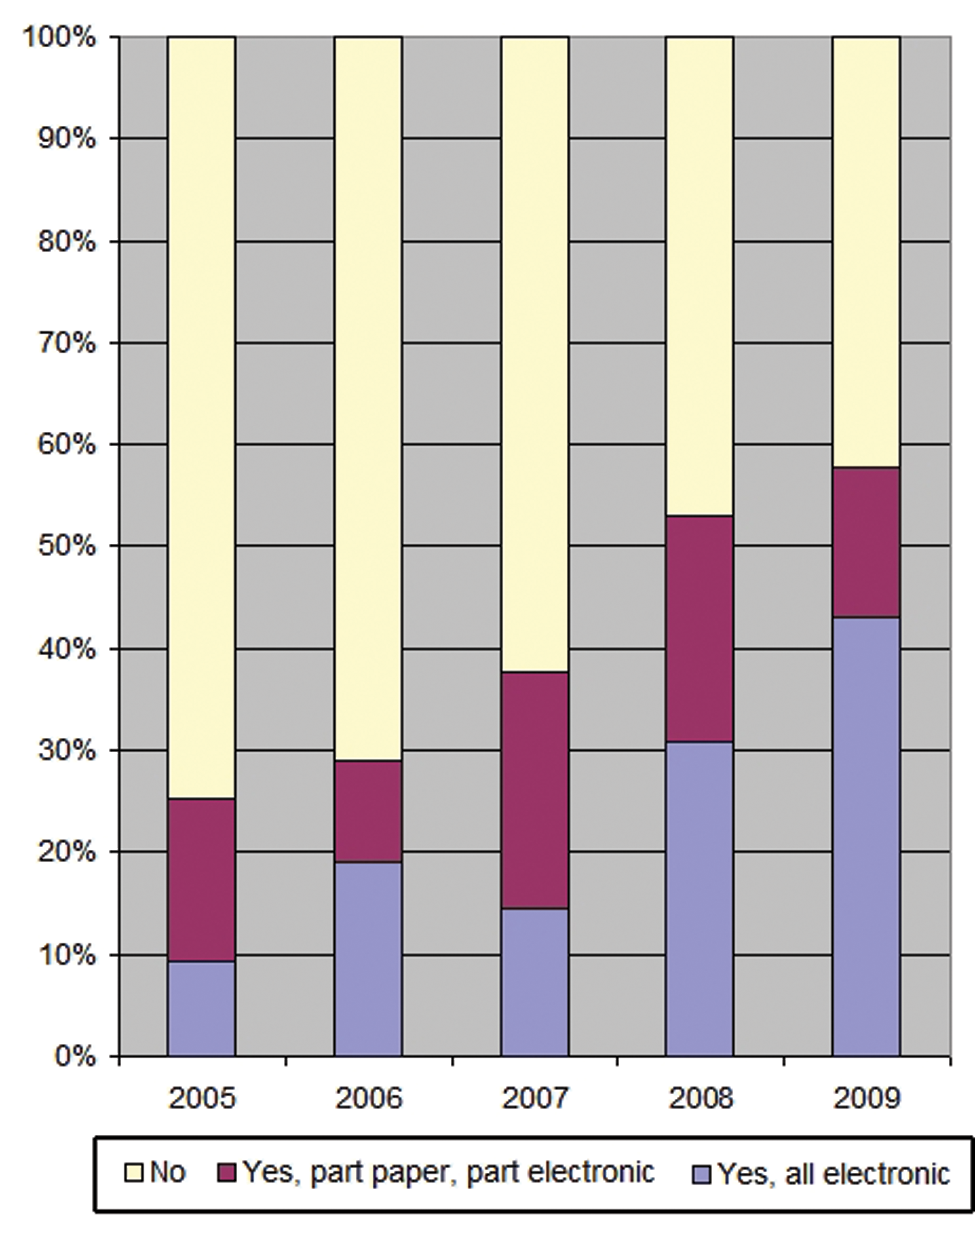
Percentage of practices using electronic medical records by year.
Time Spent with Physician, New and Established Patients by Year
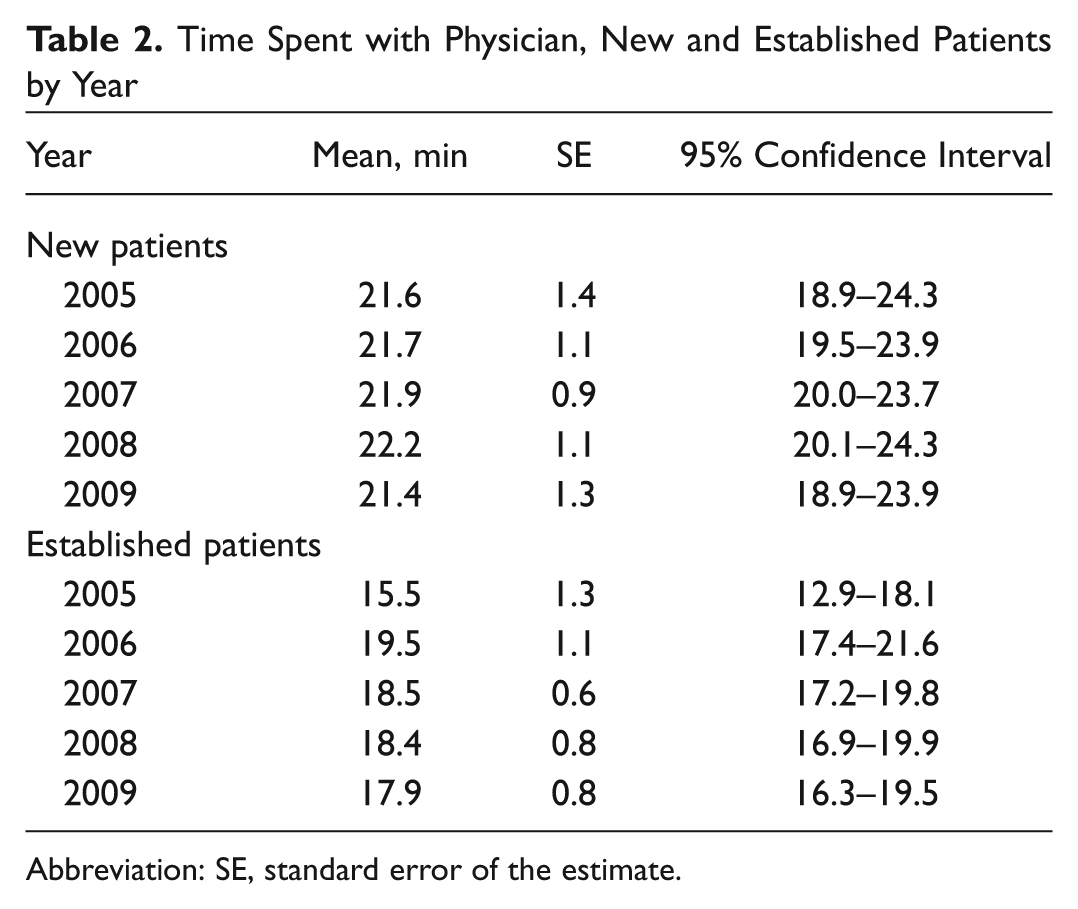
Abbreviation: SE, standard error of the estimate.
Discussion
The practice of medicine is constantly in a state of evolution, reacting to a variety of internal and external forces including governmental legislation, macroeconomic factors, population factors, and provider factors. As such, it is important to track characteristics of patient visits and physician practices in every discipline of medicine, including otolaryngology–head and neck surgery. Information sources for such data are usually sparse and oftentimes limited to surveys conducted by medical societies. Such surveys, while very important for purposes of benchmarking, comparison, and ultimately modeling the future, are also difficult to validate in many respects. For example, it is a widely held belief that physician extenders and advanced practice clinicians are a potential solution to a looming physician shortage. Using the NAMCS, we previously quantified the actual penetration of physician extenders in outpatient otolaryngology, which was found in fact to be relatively low. 5 Herein, we have elaborated objective, nationally based data regarding outpatient otolaryngology office visits and characteristics of otolaryngology physician practices.
These data merit comparison with data that have been obtained by the Academy’s socioeconomic surveys, for purposes of confirmation and validation. 4 In 2011, the Academy’s socioeconomic survey found that the relative expected sources of payments were distributed as 51.7% private payer, 25.3% Medicare, 15.7% Medicaid, and 7.3% self-pay. The currently presented data identified a higher rate of private insurance (65.1%), similar rates of Medicare (21.1%), and lower rates of Medicaid (9.2%) prevalence. Although there are some differences in these percentages, the relative hierarchy of payment is similar. In addition, the relatively lower rates of Medicare and Medicaid payment sources for the current study may be explained by the fact that the NAMCS does not typically include hospital-based academic otolaryngologists whereas the Academy survey does. In 2011, the Academy survey indicated that the typical physician had a ratio (according to median comparison) of 2:1 established versus new patients. In slight contrast, we found herein a ratio of approximately 2.5:1 established versus new patients.
In 2008, 53.0% of NAMCS respondent practices were using some form of electronic medical record ( Figure 3 ). This compares favorably with the reported rate of electronic medical record utilization in the Academy’s survey of 48% in 2008. As can be seen in Figure 3 , there is a strong trend toward adoption of electronic medical records in otolaryngology practices in the United States, arriving at 57.7% in 2009. Furthermore, the 2011 socioeconomic survey indicated that 67% of otolaryngology practices were now using electronic medical records systems.
Finally, we may compare subjective responses for practice attitudes from the Academy’s survey to the objective findings from the NAMCS data. First, in 2008, the following opinion question was asked, “I have adequate time to spend with my patients during office hours.” Of the respondents, 49.0% agreed with that statement. In 2011, 51.0% of respondents agreed with that statement on the Academy survey. This remarkably consistent agreement rate across years is echoed by the data presented in Table 2 , in which the mean time spent with patients has not appreciably changed (and therefore has not declined) over 5 years. In addition, in both 2008 and 2011, the following opinion question was asked, “It is a priority for my practice to increase patient volume,” with agreement rates of 64.5% and 65.0% in 2008 and 2011, respectively. However, despite this consistently reported respondent prioritization, the number of outpatient visits seen per unit otolaryngologist has not shown an increase over the 5 years of this study ( Figure 2 ) and has remained remarkably consistent.
The remarkably consistent per otolaryngologist patient volume seen across calendar years has broader-reaching implications. For example, recent focus has been placed on the physician workforce in otolaryngology, with a projected undersupply of otolaryngologists anticipated in the next decade. 7 Given these consistent volumetric findings, it may be unlikely that increased per-physician throughput can accommodate anticipated increases in patient demand. Furthermore, the consistency in minutes spent with the physician across the calendar years also makes it seem unlikely that physicians will be able to or even be interested in seeing more patients per unit time to accommodate increasing visit demands. However, perhaps contrary to intuitive perception, external pressures have not seemingly eroded the amount of time that otolaryngologists are able to spend with their patients. As we move into an era where patient satisfaction may be a determinant of reimbursement, the positive correlations between visit length and patient satisfaction should be kept in mind, particularly in light of these remarkably consistent patient visit length timings. 8
These data not only offer a current perspective on ambulatory practice within the specialty of otolaryngology–head and neck surgery but also give rise to a number of questions and intriguing lines of potential future investigation. For example, it would be interesting to examine subgroups with respect to the practice parameters studied. Unfortunately, because of limitations in the level of detail for data collection within the NAMCS, we are unable to analyze practice parameters such as visit length according to subspecialty, scope of practice, or academic versus community setting. In addition, looming changes in provider workload, which is predicted to rise due to the Patient Protection and Affordable Care Act of 2010 and due to an aging population, may have a significant impact on a number of practice parameters including visit times and patient volume seen per otolaryngologist. 2 The time frame for the current study (2005-2009, with data as of yet unavailable for 2010) precedes the effective period of this Act; ongoing surveillance of these practice parameters is likely warranted.
Author Contributions
Disclosures
Footnotes
Sponsorships or competing interests that may be relevant to content are disclosed at the end of this article.