
Abstract
Objectives
To investigate the correlation between the percentage of metastatic tumor present in lymph nodes resected from patients with squamous cell carcinoma of the head and neck (HNSCC) and level of expression of 3 marker genes: pemphigus vulgaris antigen (PVA), parathyroid hormone–related peptide (PTHrP), and tumor-associated calcium signal transducer 1 (TACSTD1). In addition, we investigated whether the level of expression of these 3 markers was associated with clinical outcomes for patients with HNSCC.
Study Design
Retrospective analysis of previously harvested patient samples.
Setting
The University of Pittsburgh.
Subjects and Methods
A total of 448 lymph nodes from 92 patients with HNSCC were evaluated for expression of the gene markers PVA, PTHrP, and TACSTD1 using real-time polymerase chain reaction. Confirmation of metastasis was determined by histologic examination. The expression level of these markers versus tumor percentage was analyzed.
Results
All 3 markers were studied independently and were associated with tumor percentage in metastatic lymph nodes. PVA had the strongest correlation, followed by PTHrP and then TACSTD1. PVA levels had a trend toward association with clinical outcome, specifically time to death caused by cancer, but this was confounded by tumor stage.
Conclusion
All 3 tumor gene markers were associated with percentage of tumor cells in metastatic lymph nodes. PVA had the strongest correlation. PVA may add prognostic utility beyond pathologic staging, but this requires analysis of a larger cohort. Prospective studies of tumor volume in metastatic nodes should determine a lower limit threshold of molecular marker detection.
For patients diagnosed with squamous cell carcinomas of the head and neck (HNSCC), regional lymph node involvement is arguably the most important prognostic factor.1,2 Studies have shown that patient survival correlates strongly with nodal staging of the tumor at the time of presentation. 3 Despite this, up to 40% of patients with node-negative (N0) malignancies will develop recurrent disease and distant metastases. 4 This evidence supports the existence of micrometastases within these N0 lymph nodes. 5 Micrometastases are tumor metastases smaller than 2.0 mm, which enables them to evade detection by standard diagnostic procedures.6,7
There is hope that with the discovery of molecular markers of metastatic disease and highly automated, real-time, quantitative reverse-transcriptase polymerase chain reaction (qRT-PCR), there may be a novel way to detect micrometastasis within an intraoperative time frame, without sacrificing accuracy. 8 We have investigated molecular markers of positive disease within lymph nodes. From a panel of 40 highly expressed gene markers of HNSCC, pemphigus vulgaris (PVA), parathyroid hormone–related peptide (PTHrP), and tumor-associated calcium signal transducer 1 (TACSTD1) are 3 gene markers that proved to have the highest sensitivity and specificity to distinguish positive and benign lymph nodes. 9 The study assembled a cohort of 448 lymph nodes from 92 patients who underwent routine elective neck dissection (END) for HNSCC. The lymph nodes were sectioned, and alternate sections were sent for either pathological assessment as per the gold standard or qRT-PCR for the 3 gene markers. The results of both were then compared to assess the diagnostic properties of qRT-PCR for the 3 gene markers based on the pathologic gold standard at detection of tumor cells within the lymph nodes. All 3 gene markers had a specificity of 98% to 99%. PVA was shown to have the highest sensitivity (92%) compared with the pathologic gold standard followed by TACSTD (70%) and then PTHrP (60%). 10 We previously extended these studies to develop a completely automated multiplex qRT-PCR assay to detect lymph node metastases in HNSCC with a level of conformity to the current pathologic gold standard.
Here, we investigated whether the level or amount of expression of each of these 3 tumor markers would correlate with the amount or percentage of tumor present within the lymph node and with clinical outcome. This information would enable us to determine whether the level of expression of these markers could provide us with information about the burden of disease of each individual patient, such as might permit outpatient molecular analysis of cytologic specimens.
Methods
Patient and Lymph Node Selection
We performed a retrospective analysis of a cohort of patients assembled from the previous study. The University of Pittsburgh institutional review board (UPCI 99-069) approved the entire collection, storage, and subsequent analysis of the tissue samples. Informed consent was obtained from all patients who donated samples. All cervical lymph nodes were collected from 92 patients, a total of 448 grossly negative lymph nodes.
The lymph nodes were sectioned in alternating 1-mm sections; half of the sections were used for pathologic diagnosis, and the other half were used in the original study. For the present analysis, we looked at the slides that had been set aside for pathologic diagnosis and designated for research.
Histological Analysis
The slides had previously been analyzed for the original study. Histologic analysis by 2 pathologists was performed at 3 separate occasions for each lymph node. All of these data were amalgamated to form an overall “consensus pathology” reading. For our study, we used this consensus pathology result to classify the lymph nodes as either positive or negative for metastatic tumor.
To determine tumor percentage, 2 slides from each of the lymph nodes were examined by a head and neck pathologist. To avoid bias, the pathologist was blinded to the previous consensus pathology results as the slides were read. Tumor percentage reading denotes an estimate of the percentage of cells within the slide that microscopically appeared to be tumor cells; it is not routinely undertaken during pathological evaluation of lymph nodes. We chose to include this in our study as it is believed to approximate the amount of tumor within the particular section of lymph node.
qRT-PCR
The results for the level of expression for each of our genes were derived from the qRT-PCR performed during the previous study, with methods published previously.8,9 Briefly, serial sections were cut from each optimal cutting temperature-embedded lymph node. Sections were placed in chaotropic lysis buffer for RNA isolation. RNA was isolated using the Stratagene RNA isolation mini-kit. Reverse transcription reactions were completed with random hexamer priming and SuperScript II. All qRT-PCR was performed on the Stratagene MX3000P qPCR system. Relative expression of the 3 marker genes was calculated using the ΔCT method. B-glucuronidase was used as the endogenous control.
Statistical Analysis
Patterns of association between percentage tumor and marker expression by qRT-PCR were investigated by fitting a linear regression model based on a 3 degree-of-freedom–restricted cubic spline. To explore the diagnostic potential of individual markers with qRT-PCR, receiver-operating characteristic (ROC) curves were constructed using all individual lymph nodes, and the cutoff value of each marker that produced the highest overall classification accuracy was selected. The diagnostic parameters sensitivity, specificity, positive predictive value, negative predictive value, and overall accuracy were calculated for each cutoff. In addition, the area under the ROC curve was estimated. The Spearman correlation coefficient was also calculated. For the study of association between lymph node markers and oncologic outcome, we estimated 2 outcome variables: disease-free survival (DFS), defined as time to recurrence or death due to cancer, and disease-specific survival (DSS), defined as time to death from cancer. For both of these endpoints, patients who died of other causes were censored on their day of death. The effects of individual makers, percentage tumor, (T) stage, and node (N) stage were calculated with proportional hazards regression. Patient-level lymph node expression levels were computed 2 ways: by taking the maximum expression value among all nodes for a patient and by computing an empirical Bayes estimate of the average lymph node expression. The empirical Bayes estimate shrinks the patient average toward the grand mean, with the amount of shrinkage proportional to the variance of the patient average. Variables with sufficient correlation as a univariate measure were included as components of a joint multivariate proportional hazards regression model. The adequacy of the proportional hazards assumptions was verified with Schoenfeld residuals. To rule out undue influence of death due to other causes as a competing risk, cumulative incidence curves were constructed, and Grey’s test was applied to measure the influence of covariates upon cumulative incidence.
Results
Pathologic Analysis
A total of 430 lymph nodes were included in our analysis. Nodes that had been classified as isolated tumor cells were omitted from the analysis. Three hundred seventy-one slides were confirmed negative for tumor, and 51 slides were confirmed positive by both the consensus pathology results and percentage tumor readings of 2 slides from each lymph node. There were 4 nodes that had been classified as negative under consensus pathology, but histological examination of tumor percentage showed tumor cells in at least 1 of the 2 sections examined. Eight nodes that had been classified as positive for tumor by the consensus pathology results were found to have no tumor cells in either of the 2 sections examined. One explanation for this is that the slides that were used to estimate the percentage tumor were different from the slides used in the analysis for consensus pathology.
Positive Correlation between Increasing Percentage Tumor and Increasing Expression of Gene Markers
Figure 1 shows a matrix representing the 2-dimensional scatter plots between each set of 2 variables, giving an overview of all the lymph nodes within the cohort. The top right of the image is a mirror representation of the bottom left. The variables within our study (percentage tumor and the 3 gene expression markers) are listed along the central diagonal from top left to bottom right. The intersection of each column and row represents the scatter plot of the respective variable, with the column variable along the x-axis and row variable along the y-axis. Pathologically positive nodes (more than 0% tumor) are indicated by crosses and benign nodes (0% tumor) by circles. Within each scatter plot, data points representing the benign nodes are tightly clustered, and points representing the positive nodes are more widely spread, representing the variation in the percentage of tumor within the positive nodes. The scatter plots show a positive correlation between the level of gene expression of each of the 3 genes and the percentage of tumor present in positive lymph nodes. There also appears to be a positive relationship between the level of expression of all of the 3 genes, the strongest of which appears to be PVA and TACSTD1.
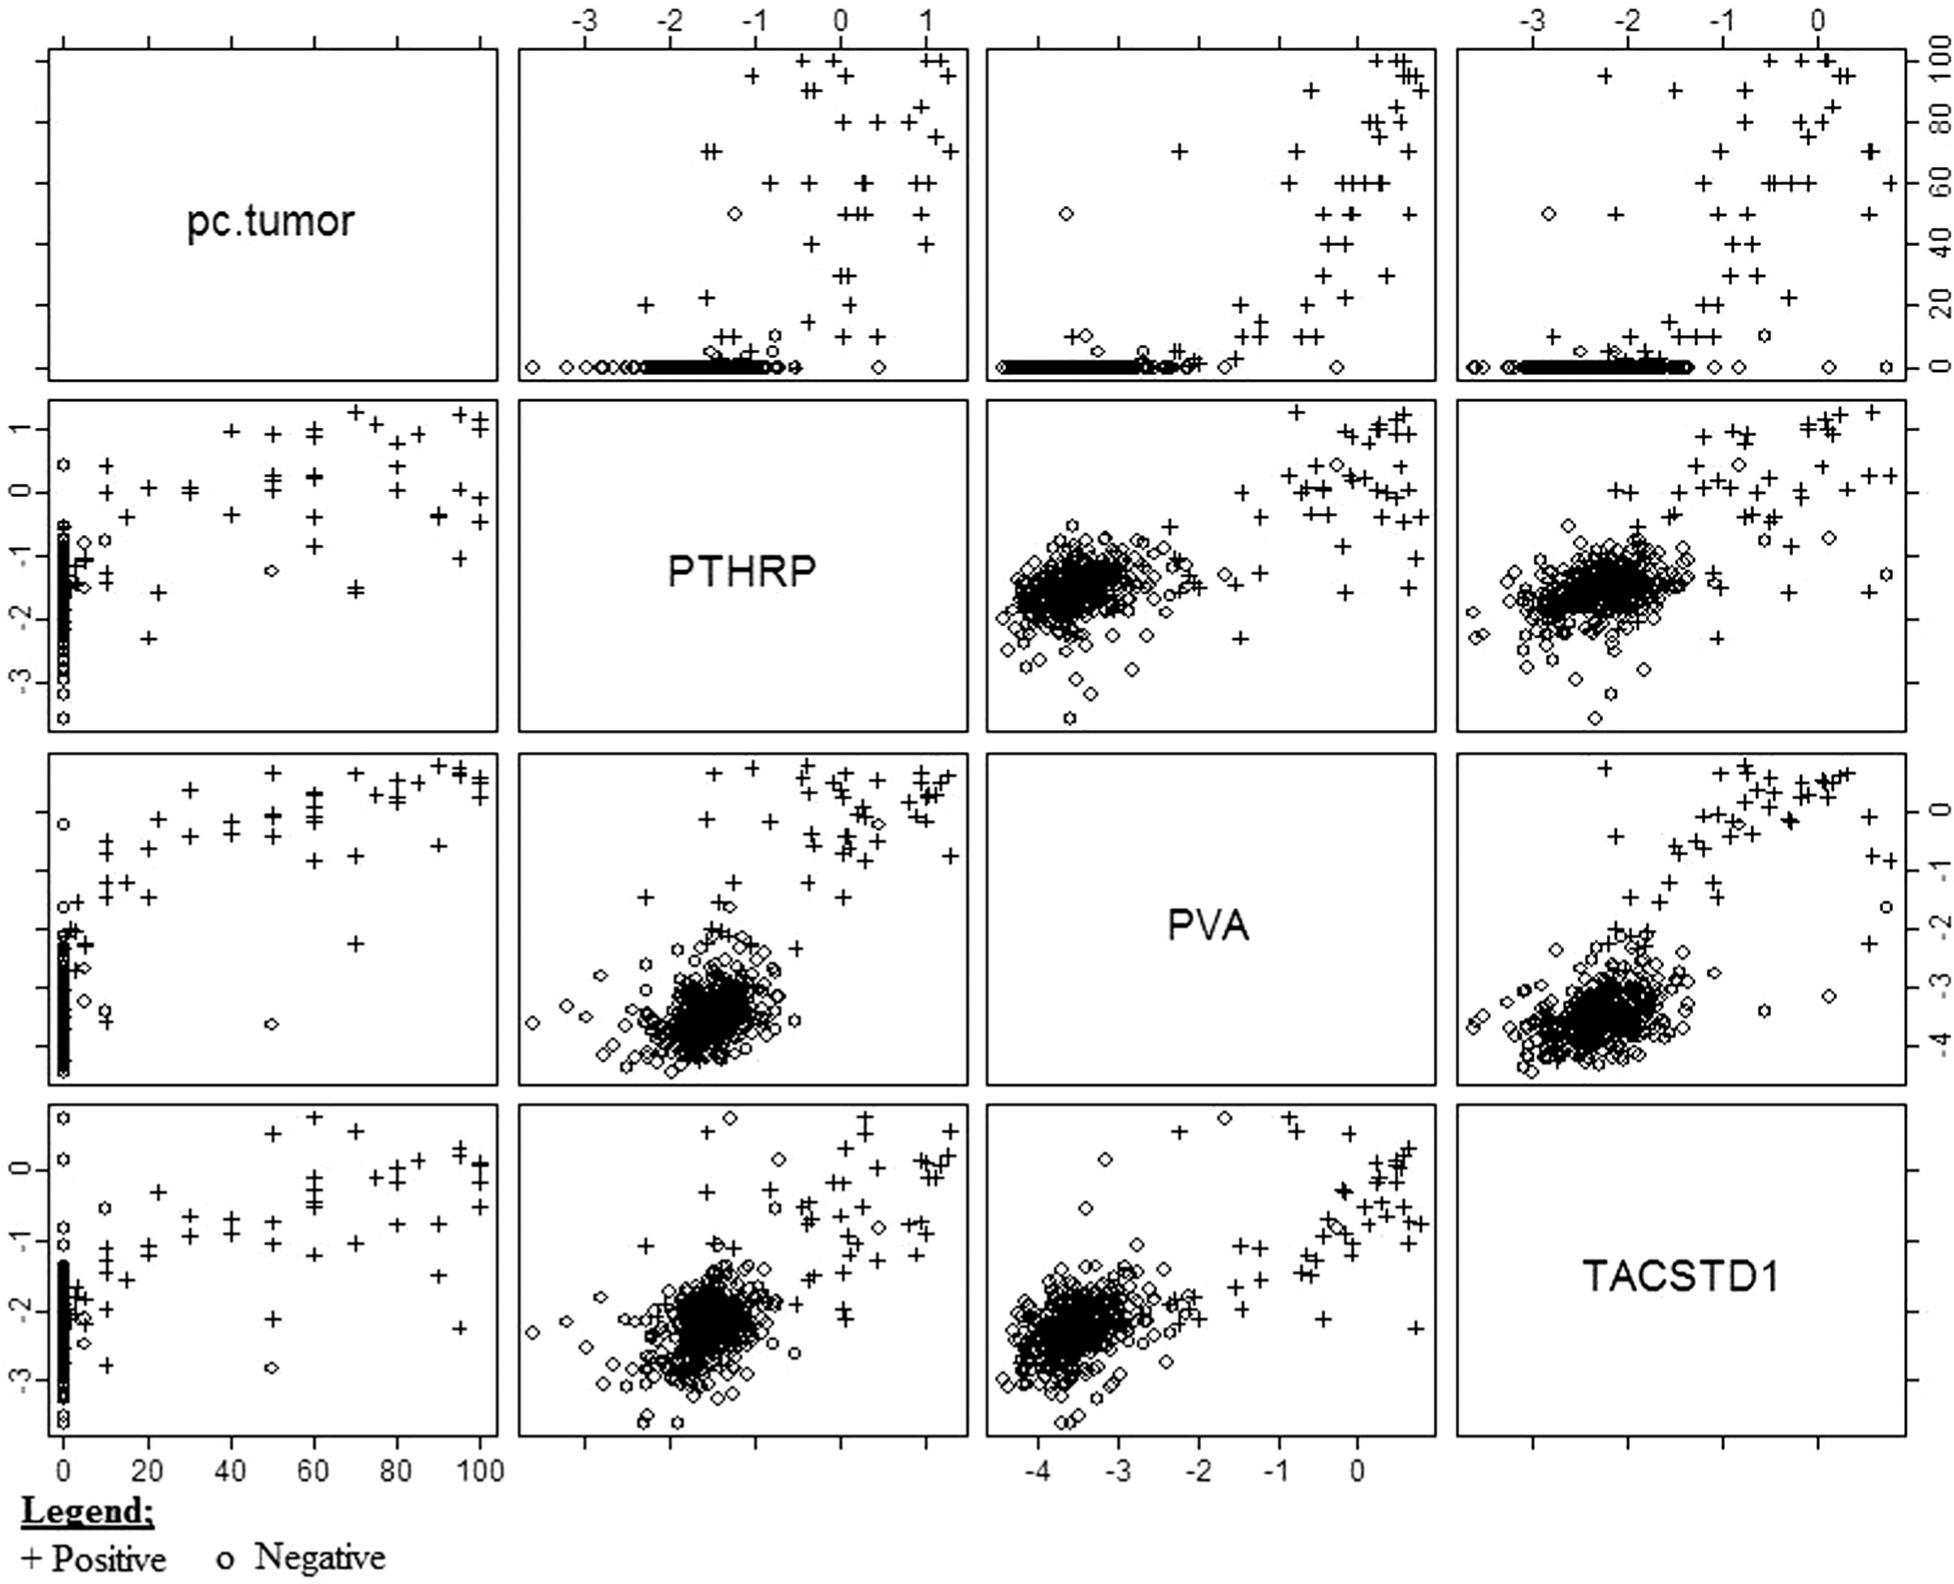
Positive correlation between increasing percentage tumor and increasing expression of gene markers. Tumor percentage of each node was estimated as described in the Methods section. A matrix representing 2-dimensional scatter plots between each set of 2 variables is shown. The top right of the image is a mirror representation of the bottom left. The variables within our study are listed along the central diagonal from top left to bottom right. The intersection of each column and row represents the scatter plot of the respective variable, with the column variable along the x-axis and then row variable along the y-axis. Pathologically positive nodes are indicated by crosses and negative nodes by circles. A positive correlation between the level of gene expression of each of the 3 genes and the percentage of tumor present in positive lymph nodes is shown.
PVA Has the Strongest Correlation with Percentage of Tumor
Figure 2 presents 2-dimensional scatter plots between each set of 2 tumor gene marker variables. The markers within the variables boxes along the diagonal are represented by histograms, showing the distribution of each of the variables. Of note, none of the variables are normally distributed; for this reason, the Spearman rank correlation is used to analyze these data. The Spearman rank correlation coefficients of each of the 2 variables represented in the scatter graphs are provided; a coefficient of +1 or −1 is considered perfect correlation between 2 variables.
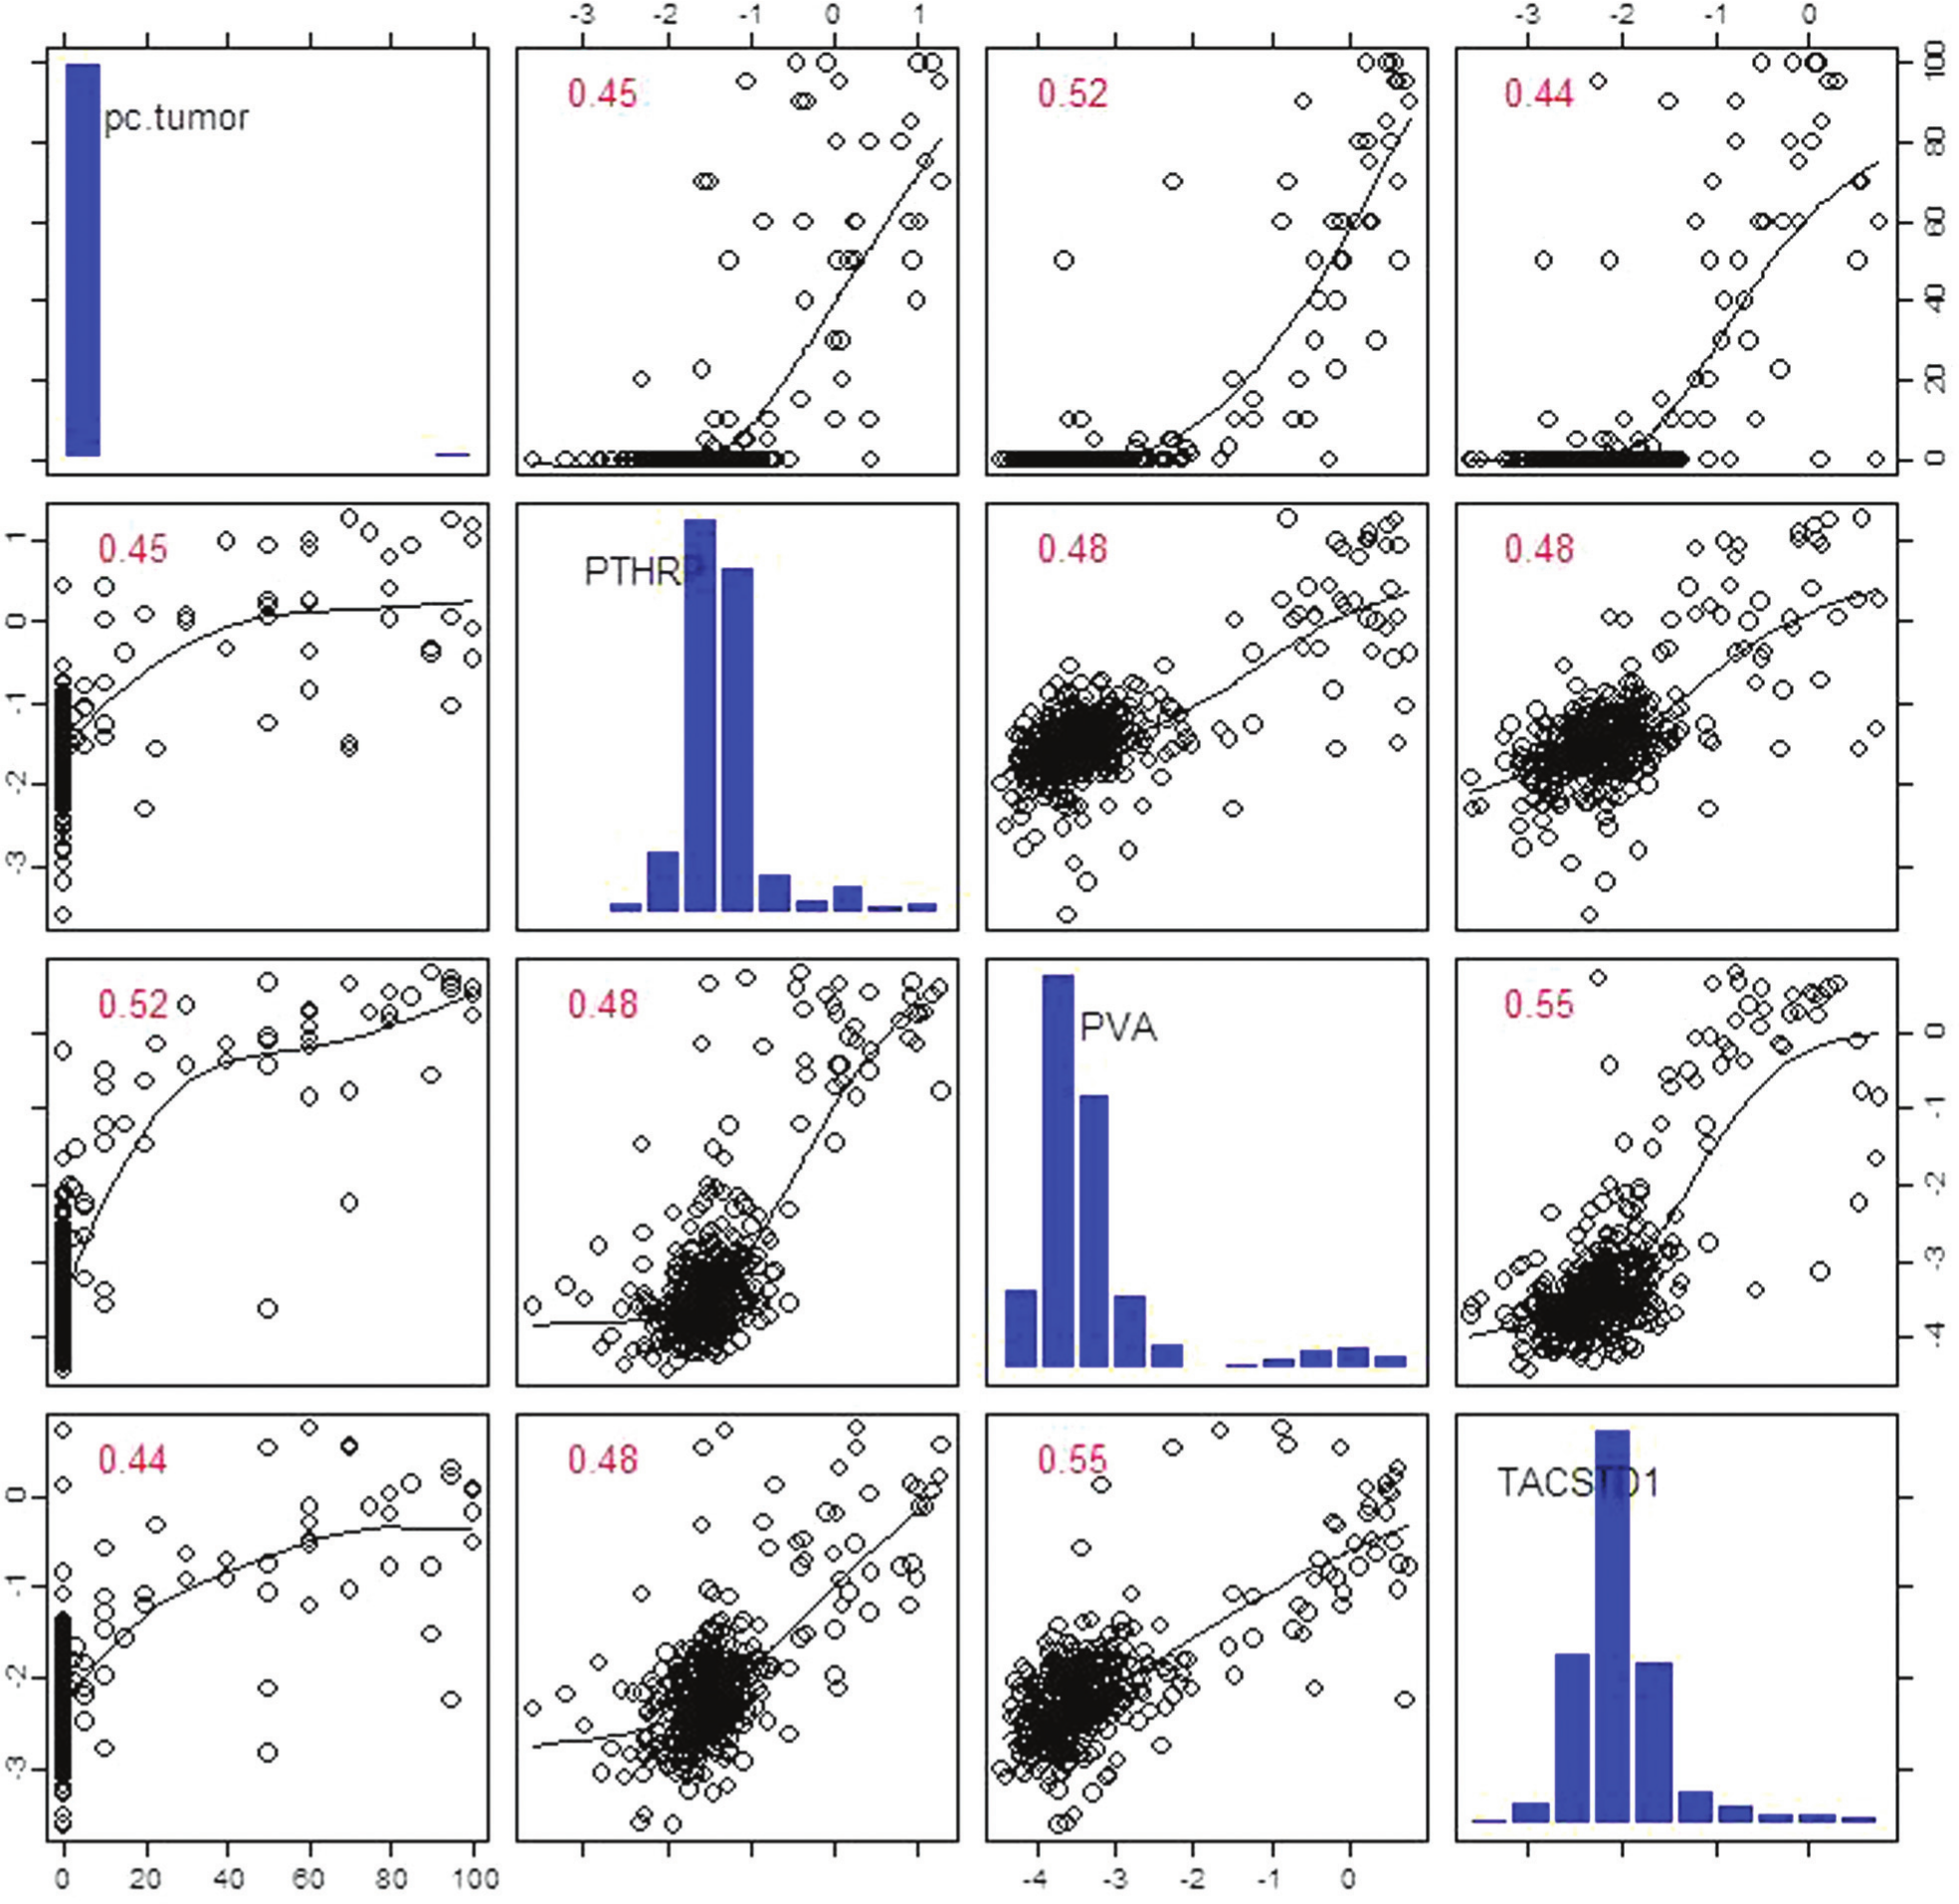
Two-dimensional scatter plots between each set of 2 tumor gene marker variables. Spearman rank correlation was used to analyze these data. The central diagonal lists all variables (percentage tumor and expression of parathyroid hormone–related peptide, pemphigus vulgaris antigen, and tumor-associated calcium signal transducer 1). The intersection of row and column variables results in a scatter plot with row variable along the y-axis and column variable along the x-axis. The Spearman rank correlation coefficients of each of the 2 variables represented in the scatter graphs is provided; a coefficient of +1 or −1 is considered perfect correlation between 2 variables. A moderately strong, positive correlation is seen between percentage tumor and each of the 3 tumor gene markers.
We observe a Spearman rank correlation coefficient of 0.52 between PVA and percentage tumor, representing a moderately strong, positive correlation. In addition, there is a positive correlation between percentage tumor and level of expression of PTHrP and TACSTD1, with Spearman rank correlation coefficients of 0.44 and 0.45, respectively. As noted previously, there is a positive correlation between each of the 3 gene markers, with the strongest correlation between PVA and TACSTD1, which has a Spearman rank correlation coefficient of 0.55.
PVA Level Is As Effective As Tumor Percentage at Distinguishing between Positive Metastases and Benign Lymph Nodes
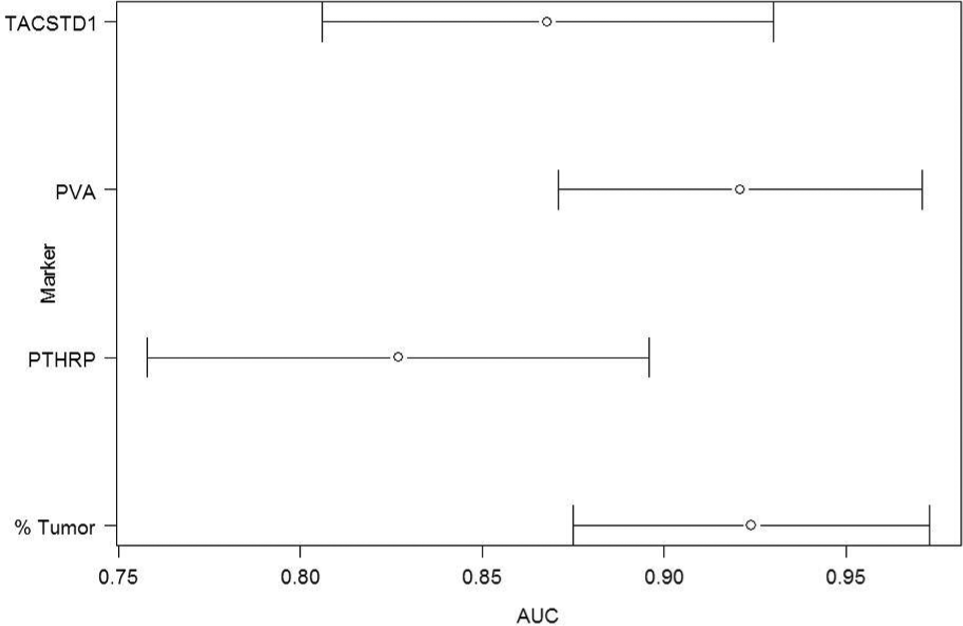
Figure 3 shows the area under the curve (AUC) of the ROC curve. The AUC ranges from 0.75 to 1.0 and indicates the probability of success of each of the 4 variables at correctly identifying a pair of samples, 1 negative and 1 positive. Tumor percentage is analyzed as an independent variable as are the 3 gene markers. The AUC of each variable is indicated by circles; in addition, the 95% confidence intervals (CIs) are indicated.
Area under the curve of the receiver-operating characteristic curve tumor gene markers.
The probability of each variable correctly identifying a randomly selected positive specimen from a randomly selected negative specimen is indicated by the AUC. Each of the variables is analyzed independently. The AUC of the variables ranges from 0.75 to 1.0 and is indicated by circles; in addition, the 95% CIs are indicated by brackets extending from the circles. Both PVA and tumor percentage have the same probability (93%) of correctly identifying positive from negative samples.
The estimated AUC for PTHrP was 85% (95% CI, 75%-90%). The AUC for TACSTD1 was 86% (95% CI, 81%-93%). The AUC for PVA was estimated to be 93%; this is the same as using percentage tumor of a sample alone. Both PVA and percentage tumor AUC also have similar 95% CIs of 87% to 98%.
Of note, there is overlap between all CIs; statistically, this is interpreted as no one of these has better discriminatory properties. However, there is greatest overlap between PVA and percentage tumor, indicating that they are comparable in their ability to distinguish between malignant and benign nodes.
Positive Correlations Are Driven by Positive Lymph Nodes with Low Tumor Percentages
Figure 4 shows 3 scatter plots with percentage tumor along the y-axis and each of the 3 gene markers along the x-axis, with 2 lines of best fit superimposed over the plots. The lower line is a fitted smoothing spline for all lymph nodes analyzed. As in Figure 2 , this line suggests there is a positive correlation between percentage tumor and each of the 3 gene markers. The upper, dashed line indicates estimated correlation based on only the nodes with greater than 20% tumor; this line is relatively flat for PTHrP and TACSTD1, indicating that there is no correlation between the nodes with more than 20% tumor and level of expression of both of these gene markers. The upper, dashed line of correlation of the scatter plot of PVA and percentage tumor appears flat at first and then starts to show a positive linear correlation following the line at PVA expressions levels greater than −1. This suggests that the moderately strong, positive correlation that we noted between all the gene markers and tumor percentage was driven by the cluster of samples with less than 20% tumor and low gene expression.
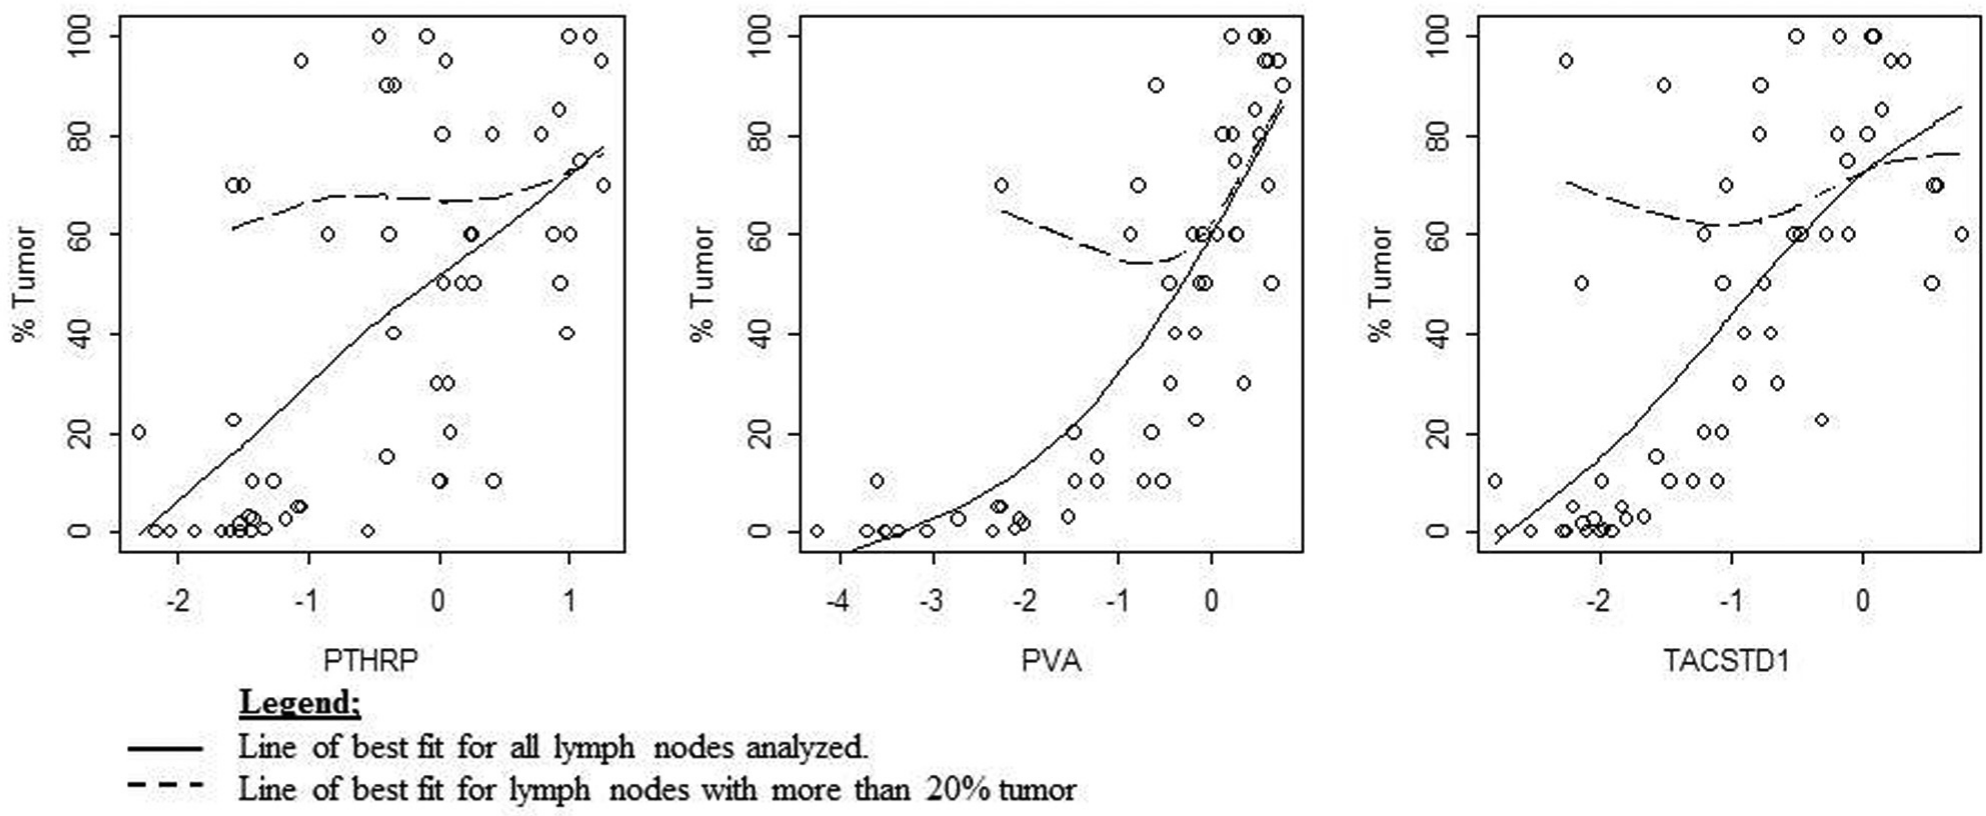
Scatter plots showing percentage tumor and each of the 3 gene markers. Two lines of best fit are superimposed. The lower line is for all lymph nodes analyzed. The upper, dashed line is for lymph nodes with great than 20% tumor. The upper line of correlation of the scatter plots of the tumor gene markers and percentage tumor appears mostly flat. This indicates that the positive correlation seen between the tumor gene markers and percentage tumor is driven by the nodes with low tumor percentages.
Nodal Expression Level of PTHrP and PVA and Percentage Tumor Are Not Independently Associated with DSS
We analyzed the effect of lymph node markers and percentage tumor on DFS, defined as time to either disease recurrence or death from cancer, and on DSS, defined as time to death from disease. Analysis was conducted on a subset of 88 patients having complete staging by surgical pathology. In this cohort, the median follow-up for living patients was 57 months, with a range from 8 to 118 months. Twenty-four patients died of their disease; the probability of 3-year DSS was 0.76 (95% CI, = 0.67-0.86). The probability of 3-year DFS was 0.60 (95% CI, 0.46-0.68), as shown in Table 1 . Based on a univariate analysis, maximum node PVA and PTHrP along with percentage tumor had hazard ratio CIs that excluded 1.0 for DSS. No markers were associated with DFS.
Results of univariate cox regression.
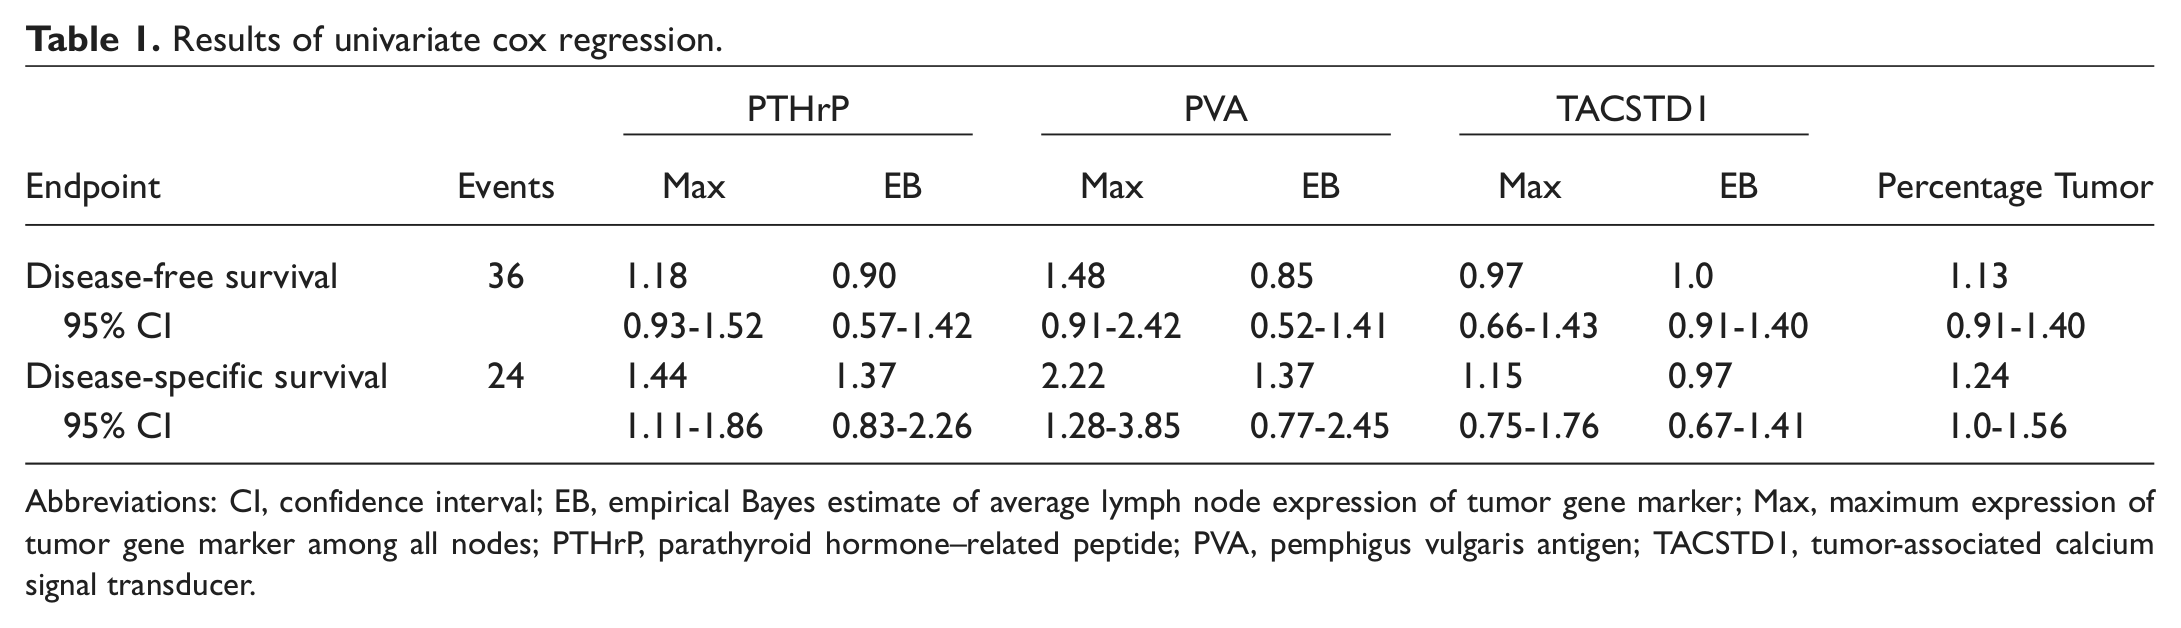
Abbreviations: CI, confidence interval; EB, empirical Bayes estimate of average lymph node expression of tumor gene marker; Max, maximum expression of tumor gene marker among all nodes; PTHrP, parathyroid hormone–related peptide; PVA, pemphigus vulgaris antigen; TACSTD1, tumor-associated calcium signal transducer.
In addition to maximum expression of PTHrP and PVA, percentage tumor, T stage, and N stage were also modestly associated with DSS. We next conducted multivariate proportional hazards regression for DSS using maximum PTHpR, maximum PVA, T stage, N stage, and percentage tumor. As shown in Table 2 , after simultaneous covariate adjustment, only T stage remained significant; specifically, the risk of DSS increases by a factor of 8.5 for state T4 versus T1 (P = .0070). We conclude that lymph node markers PTHrP, PVA, and percentage tumor are not independently associated with DSS but rather were confounded by T stage.
Multivariate proportional hazards regression for DSS using maximum PTHPR, maximum PVA, T stage, N stage, and percentage tumor.
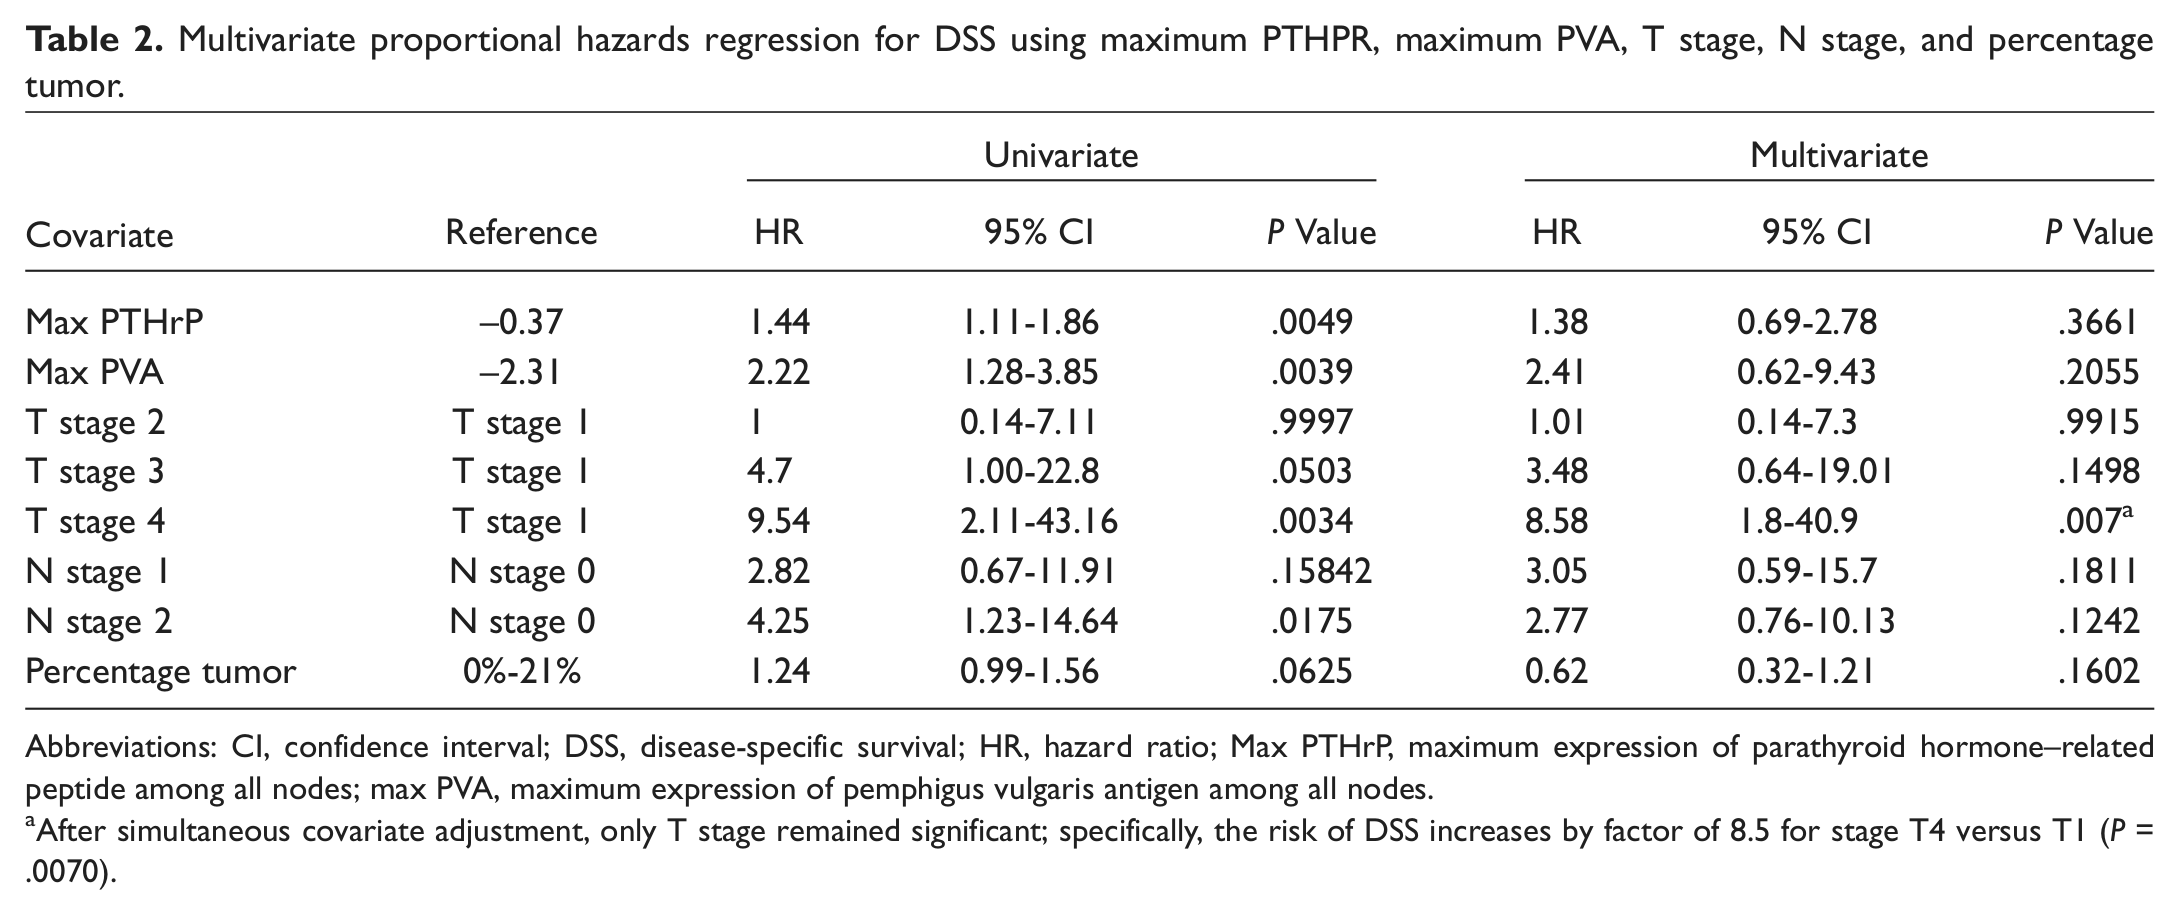
Abbreviations: CI, confidence interval; DSS, disease-specific survival; HR, hazard ratio; Max PTHrP, maximum expression of parathyroid hormone–related peptide among all nodes; max PVA, maximum expression of pemphigus vulgaris antigen among all nodes.
After simultaneous covariate adjustment, only T stage remained significant; specifically, the risk of DSS increases by factor of 8.5 for stage T4 versus T1 (P = .0070).
Given T Stage, the Role of Tumor Gene Markers as Predictors of DSS
Figure 5 shows 2 Kaplan-Meier survivor function plots. Here, max nodal PVA expression was divided into 3 groups: high, middle, and low. The plot on the left was not adjusted for T stage. The probability of survival to 60 months postsurgery is 80% with middle, 75% with low, and 40% with high nodal PVA expression. This result is statistically significant with a P value of .0079. Once this was adjusted for T stage, as in the plot on the right, the results were no longer statistically significant (P = .12) but suggest a trend association may exist. However, the significance of this trend is unclear as the sample size is too small. A greater sample size is needed to improve the statistical power of this analysis.
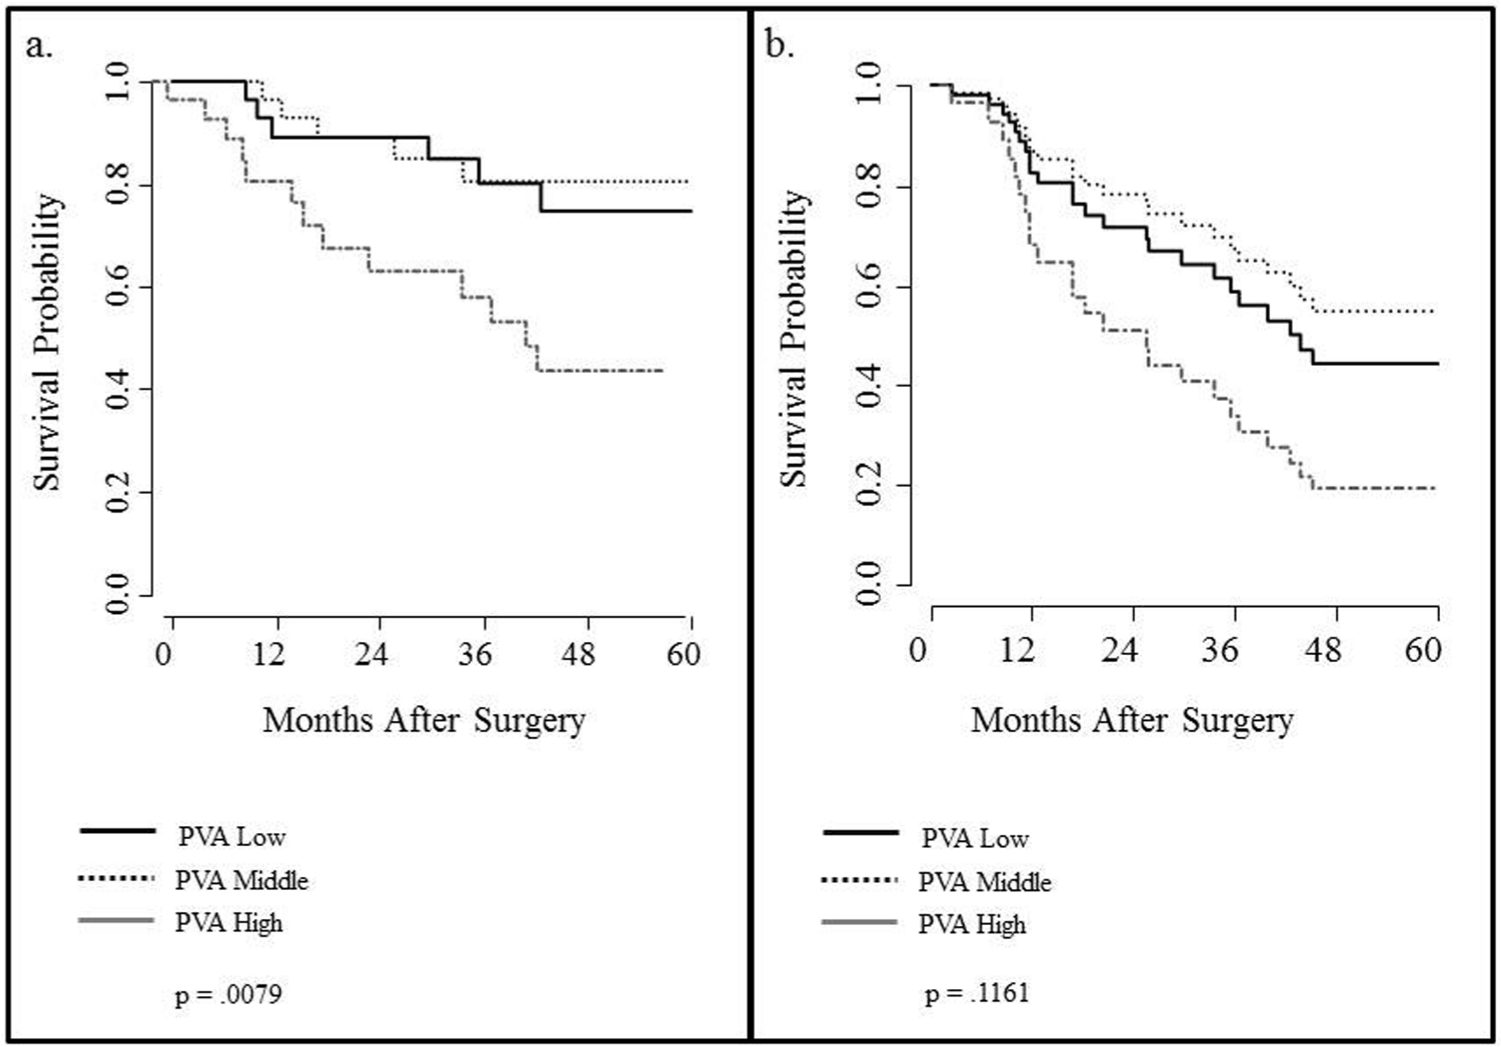
Kaplan-Meier plots of disease-specific survival by max pemphigus vulgaris antigen tertile.
Max nodal PVA expression is divided into high, middle, and low levels of expression. The probability of survival appears to correlate with middle and low levels of PVA expression ( Figure 5a not adjusted for T stage is statistically significant, P = .0079). However, once this has been adjusted for T stage, the result is no longer statistically significant (P = .12) but suggests a trend association may exist.
This indicates that level of expression of PVA is only marginally more effective than T stage at determining DSS. Hence, once the T stage of a patient’s disease is known, the level of expression of PVA provides little additional predictive power of clinical outcome.
Discussion
With the advent of molecular markers of lymph node disease and the development of rapid and precise molecular techniques, there is hope for developing improved tools for identifying and treating lymph node metastases in HNSCC.
As shown in previous studies, PTHrP, TACSTD1, and PVA are molecular tumor markers that can be used in conjunction with qRT-PCR to predict nodal metastases in HNSCC accurately. A cartridge-based assay has been developed so that rapid qRT-PCR can now be applied to the intraoperative time frame; it may be possible to know the nodal status of the patient during the procedure to remove the primary tumor, resulting in reduced morbidity associated with END.
Nodal disease status plays a crucial role in the prognosis of HNSCC; as well as the number of positive nodes, the size of the metastases within the node is a pertinent factor in staging of disease. 11 Although PTHrP, TACSTD1, and PVA are highly sensitive and specific markers for lymph node metastases, we investigated whether the level of these markers correlates with the amount of disease present within the nodes. Our results show that there is a moderately strong, and statistically significant, correlation between the level of expression of all of these markers and the percentage of tumor within each lymph node. PVA has the strongest correlation with tumor percentage. We can use the R2 value as an approximate measure of how much variation in percentage tumor can be explained by the level of expression of PVA independently. The square of the Spearman rank correlation coefficient for PVA against percentage tumor (0.52) provides a similar interpretation to the standard R2 value. The outcome of this calculation is 0.27, or 27%. This indicates that almost 27% of the variability in the percentage of tumor within a lymph node can be explained by the variability in the expression levels of a single tumor marker, PVA.
One reason for these correlations appears to be the cluster of lymph nodes with none to low tumor percentages. This correlation could be greatly influenced by the large ratio of benign to malignant nodes, 375 to 55.
We have attempted to explore the clinical significance of these gene markers in HNSCC. While both PVA and PTHrP are associated with DSS, a multivariate analysis revealed that their association was not independent of T stage. The apparent association between lymph node markers and DSS was confounded by the correlation between lymph node markers and T and N stage, which are themselves highly prognostic. Thus, the expression of the molecular markers, while relevant for diagnostic accuracy, do not improve outcome prognosis when patients are staged by surgical pathology.
An area of future interest would be to expand our analysis of the extent to which qRT-PCR levels for these 3 gene markers alone or taken together compare with the current gold standard (pathology and/or cytology) in correctly identifying disease status and clinical outcomes. This would offer valuable information regarding the practical applicability of this technique and may enable us to improve our standards for detection of metastases, including possibility of molecular analysis of cytologic speciemens obtained from suspicious nodes subjected to surgical excision.
Author Contributions
Disclosures
Footnotes
Sponsorships or competing interests that may be relevant to content are disclosed at the end of this article.
This article was presented at the 2012 AAO-HNSF Annual Meeting & OTO EXPO; September 9-12, 2012; Washington, DC.