
Abstract
Objective
To evaluate the relationships between anatomical changes and treatment outcomes after velopharyngeal surgery in obstructive sleep apnea (OSA) patients with small tonsils (grade 0-2 on the Brodsky scale).
Study Design
Case series with planned data collection.
Setting
University medical center.
Subjects and Methods
Thirty-six OSA patients with small tonsils underwent velopharyngeal surgery including revised uvulopalatopharyngoplasty with uvula preservation and transpalatal advancement pharyngoplasty. Pre- and postoperative upper airway 3-dimensional computed tomography and polysomnography findings were obtained for comparison and analysis.
Results
The overall apnea hypopnea index (AHI) decreased from 56.8 (interquartile range, 37.5-70.1) preoperatively to 16.1 (10.8-33.5) postoperatively (P < .001). The change in minimal cross-sectional area of the velopharynx (VmCSA) was independently associated with the change in AHI (P = .001, R2 = 0.271). Preoperative VmCSA was the only preoperative anatomical variable that was an independent predictor of change in VmCSA (P = .009, R2 = 0.184). Postoperative VmCSA was independently associated with postoperative AHI (P < .001, R2 = 0.341).
Conclusion
In patients with small tonsils, an adequate increase in VmCSA is associated with a successful outcome after surgery. Patients with a relatively small preoperative VmCSA are more likely to have favorable anatomical changes after surgery.
Keywords
Velopharyngeal surgery that includes tonsillectomy is the most commonly performed surgical treatment for obstructive sleep apnea (OSA). Although this surgery is very effective in controlling snoring, daytime sleepiness, and other subjective symptoms of OSA, objectively assessed success rates are relatively low and treatment outcomes are unpredictable. 1 Large tonsil size is thought to be an important predictor of successful outcome after surgery.2-5 Removal of large tonsils can significantly widen a relatively narrow pharynx, which is thought to be one of the most important causes of OSA. 6 However, some patients with small tonsils may also benefit from this surgery, even though the benefits of tonsillectomy may be smaller. The precise anatomical changes needed to achieve good surgical outcomes in these patients are unclear. This study evaluated the effects of velopharyngeal surgery in patients with tonsil grade 0-2 on the Brodsky scale 7 by comparing pre- and postoperative 3-dimensional computed tomography (3D-CT) and polysomnography (PSG) findings.
Methods
Subjects
Thirty-six patients with small tonsils (grade 0-2 on the Brodsky scale 7 ) who requested surgical treatment for their snoring and sleep apnea were prospectively studied between September 2008 and April 2011. All these patients were diagnosed with OSA based on an apnea hypopnea index (AHI) ≥5 and typical symptoms (eg, snoring, witnessed apneas, and daytime sleepiness). The other inclusion criteria were as follows: (1) no previous surgical treatments for OSA, (2) age >18 years, (3) complete pre- and postoperative PSG and 3D-CT findings, (4) continuous positive airway pressure therapy refusal or intolerance, and (5) type 1 obstruction on fiberoptic endoscopy with the Muller maneuver. 8 All patients underwent velopharyngeal surgery performed by the same surgeon, including revised uvulopalatopharyngoplasty with uvula preservation and concomitant transpalatal advancement pharyngoplasty. The details of this procedure have been published elsewhere.9,10 The study protocol was approved by the Institutional Review Board of Beijing Tongren Hospital, Capital Medical University. Postoperative reassessment was performed at least 4 months after surgery.
Sleep Evaluation
Pre- and postoperative overnight PSG were performed at the Sleep Centre of Beijing Tongren Hospital. The results were analyzed by experienced technicians according to the scoring guidelines of the American Academy of Sleep Medicine. 11 An apnea episode was scored when there was a complete cessation of airflow or a ≥90% reduction in the peak thermal sensor signal for at least 10 seconds. A hypopnea episode was scored when there was a ≥50% reduction in the nasal pressure signal for at least 10 seconds in association with oxygen desaturation of ≥3% or an arousal. The AHI was defined as the sum of the numbers of apneas and hypopneas per hour of sleep.
3D-CT of the Upper Airway
Pre- and postoperative 3D-CT examinations were performed in the radiology department of Beijing Tongren Hospital using a high-speed 64-channel spiral CT scanner (Brilliance 64, Philips, Cleveland, Ohio). All scans were performed at the end of expiration with the patient in the supine, neutral position with the Frankfort plane perpendicular to the horizontal. Patients were instructed to refrain from swallowing and to stay awake during scanning. Axial images were acquired from the skull base to below the vocal cords at 1.2 mm intervals. All 3D-CT data were exported to a workstation (GE, AW4.1, Sun Microsystems, Palo Alto, California) for analysis.
Anatomical Definitions, Measurements, and Analyses
The upper airway was divided into 2 parts for the analyses: the velopharynx and the glossopharynx. The superior border of the velopharynx was defined as the line passing through the anterior nasal spine and the lowest point of the clivus in the mid-sagittal plane. The inferior border of the velopharynx (superior border of the glossopharynx) was defined as the line passing through the caudal margin of the soft palate, parallel to the superior border of the velopharynx. The inferior border of the glossopharynx was defined as the line passing through the tip of epiglottis, parallel to the superior border of the velopharynx ( Figure 1 ).
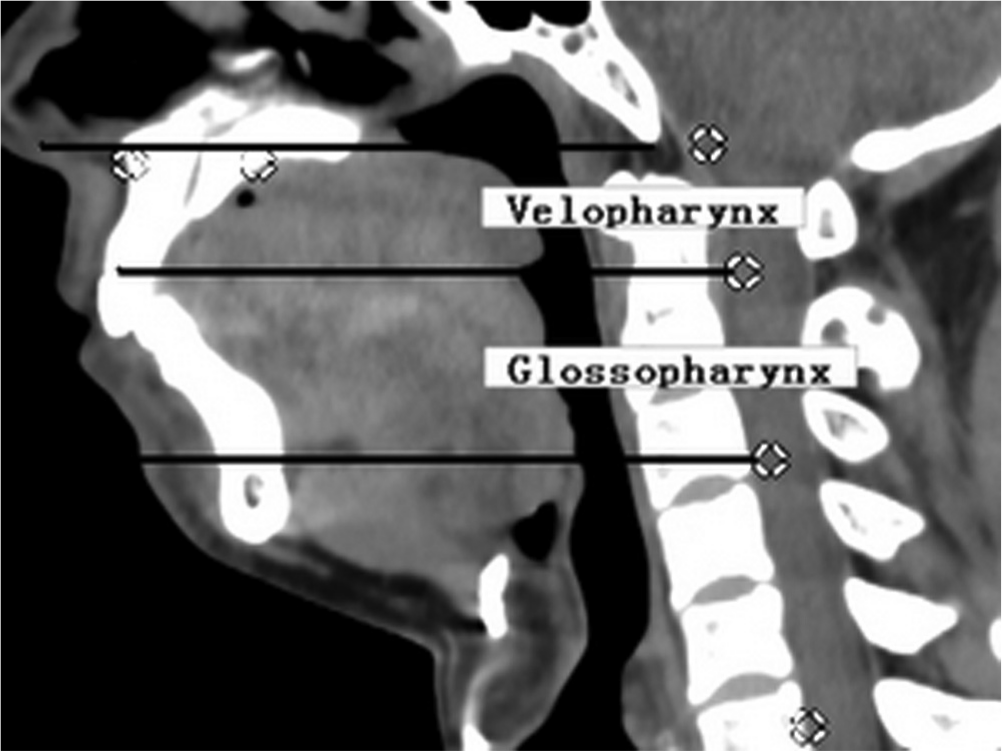
Computed tomography image (mid-sagittal plane), showing division of the upper airway into the velopharynx and glossopharynx.
The following measurements were recorded for the velopharynx and the glossopharynx: length (L; vertical height in the mid-sagittal plane), minimal cross-sectional airway area (mCSA; smallest cross-sectional airway area in the axial plane), minimal lateral airway dimension (mLAT; smallest lateral airway dimension in the axial plane), minimal anteroposterior airway dimension (mAP; smallest anteroposterior airway dimension in the mid-sagittal plane), airway volume (AV), and soft tissue volume (SV; all the soft tissue in the area bordered by the mandible, spine, and parotid glands). AV and SV were calculated by summation of the cross-sectional areas in all the axial images. Average cross-sectional airway area (aCSA) was calculated as the ratio of AV to L. The AV and SV of the whole upper airway were calculated by summation of the respective velopharyngeal and glossopharyngeal values. Total volume (TV) was defined as the sum of AV and SV, and the proportional volume of soft tissue was calculated as the ratio of SV to TV. Changes in the mCSA, mLAT, mAP, aCSA, and SV/TV of the velopharynx and glossopharynx and the AV and SV/TV of the whole upper airway were analyzed.
Analysis
Statistical analyses were performed using SPSS 17.0 (SPSS Inc., Chicago, Illinois). The Wilcoxon test was used to compare pre- and postoperative parameters. The Mann-Whitney U test was used to compare independent parameters between both groups of patients. Linear regression analysis was used to identify significant associations. All parameters are presented as the median and interquartile range. Statistical significance was set at P < .05.
Results
The 36 patients in this study were all men. The median age was 39.5 (36.0, 46.0) years, with a range of 23 to 58 years. Three patients (8.3%) had tonsil grade 0, 9 patients (25.0%) had tonsil grade 1, and 24 patients (66.7%) had tonsil grade 2 on the Brodsky scale. 7 Postoperative assessments were performed at 7 (6, 8) months after surgery, with a range of 4 to 10 months. No severe complications related to surgery were observed during the follow-up period. There was a significant overall decrease in AHI, from 56.8 (37.5, 70.1) preoperatively to 16.1 (10.8, 33.5) postoperatively (P < .001). There was also a significant overall decrease in body mass index (BMI), from 27.8 (24.8, 29.4) kg/m2 preoperatively to 26.5 (24.8, 28.0) kg/m2 postoperatively (P = .007). The pre- and postoperative 3D-CT findings are shown in Table 1 . Many of the anatomical parameters evaluated changed significantly after surgery.
Preoperative and postoperative upper airway anatomical parameters (n = 36).
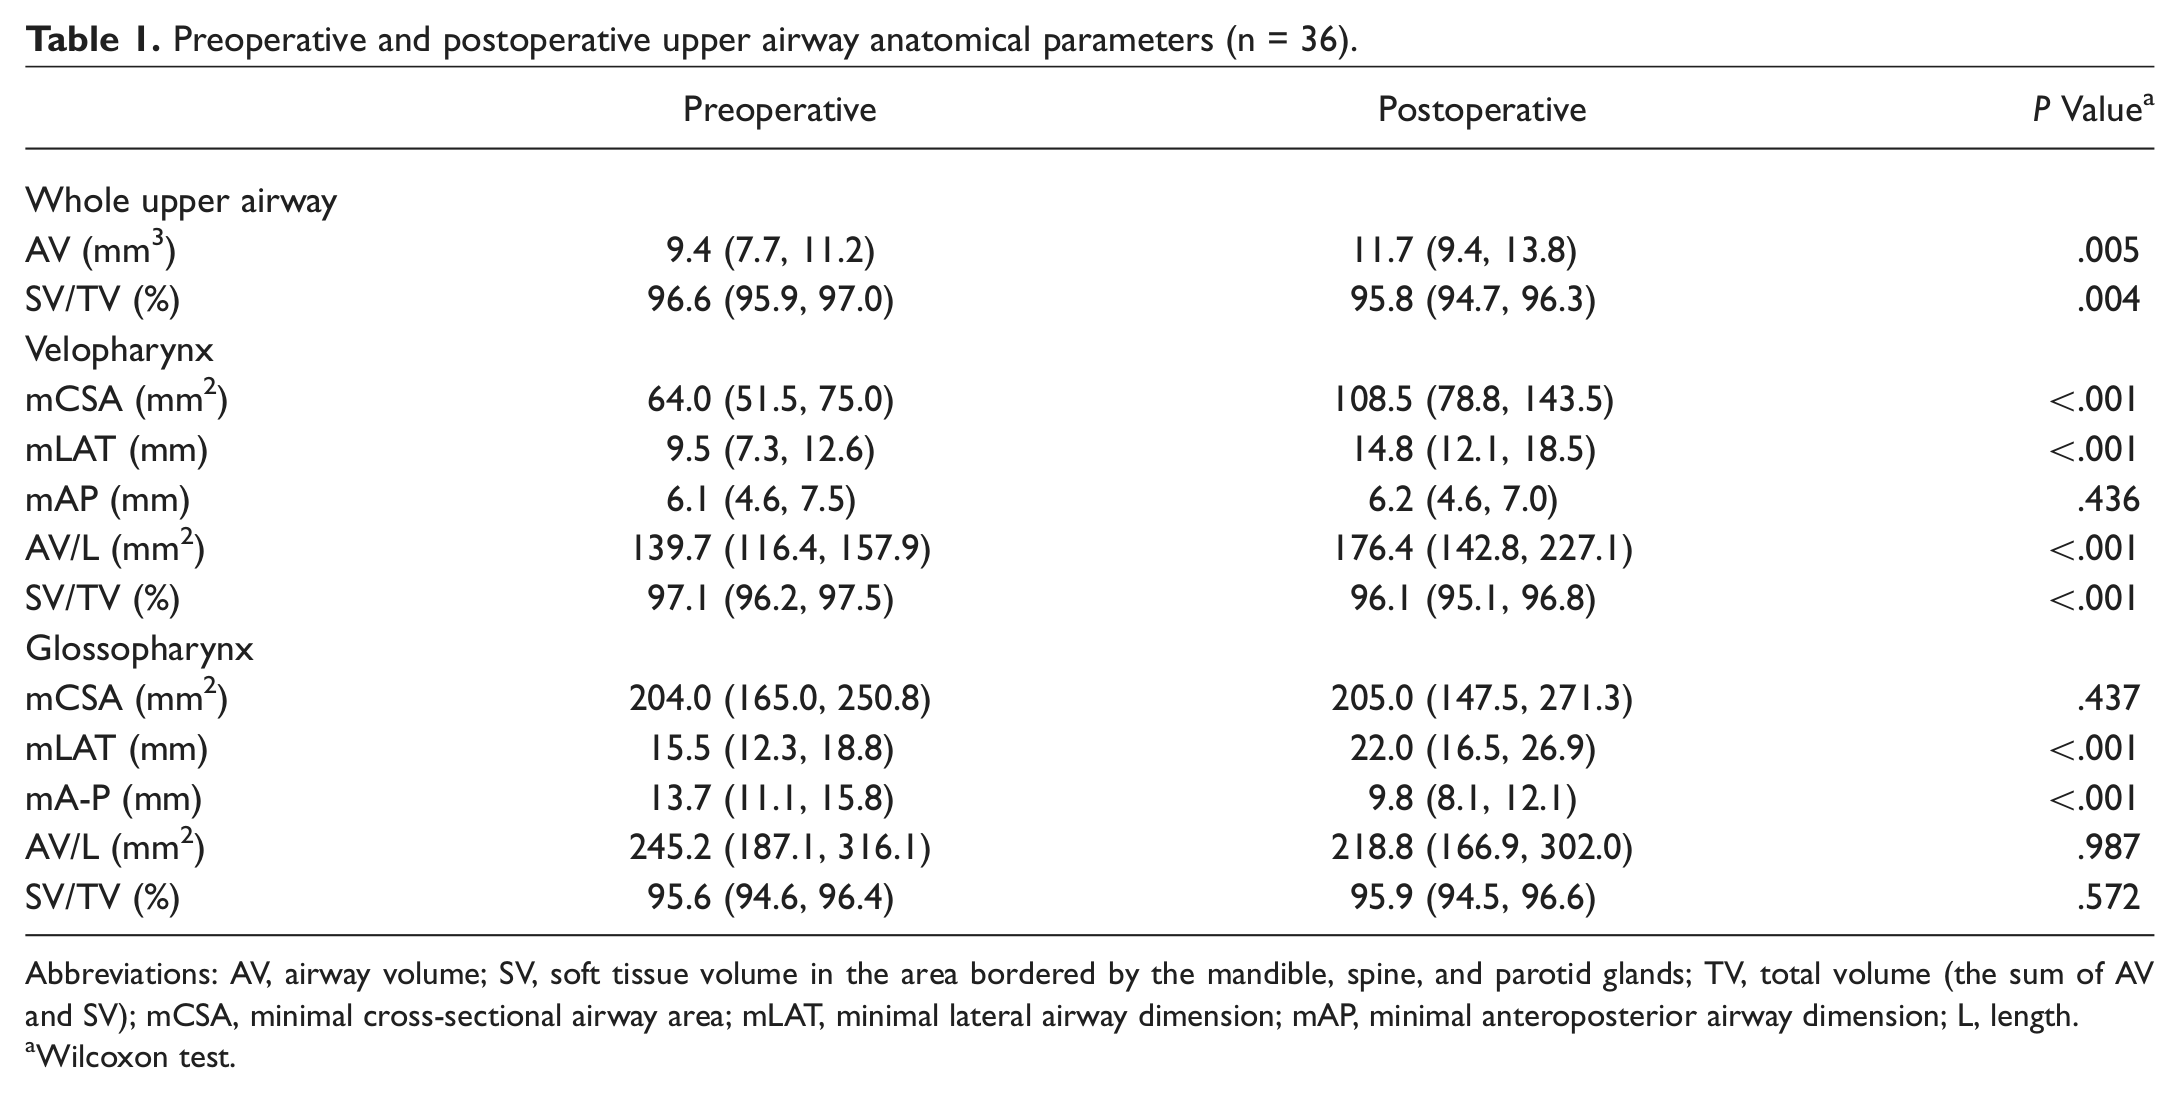
Abbreviations: AV, airway volume; SV, soft tissue volume in the area bordered by the mandible, spine, and parotid glands; TV, total volume (the sum of AV and SV); mCSA, minimal cross-sectional airway area; mLAT, minimal lateral airway dimension; mAP, minimal anteroposterior airway dimension; L, length.
Wilcoxon test.
A ≥50% reduction in AHI to a final AHI of <20, <15, <10, and <5 was achieved in 19 (52.8%), 15 (41.7%), 8 (22.2%), and 2 (5.6%) patients, respectively. The classical definition of successful surgical treatment, defined as a ≥50% reduction in AHI to a final AHI of <20, was used to analyze the relationships between anatomical changes and treatment response. Preoperative demographic characteristics and changes in anatomical parameters were compared between patients who had a successful outcome after surgery (responders) and those who did not (nonresponders). BMI was significantly higher in responders than in nonresponders (P < .05), but there were no significant differences between these 2 groups in age, AHI, or lowest oxygen saturation ( Table 2 ). Changes in several anatomical parameters including SV/TV of the whole upper airway, mCSA of the velopharynx (VmCSA), and mCSA and mLAT of the glossopharynx were significantly different between responders and nonresponders (all P < .05) ( Table 3 ).
Preoperative Patient Characteristics According to Treatment Response
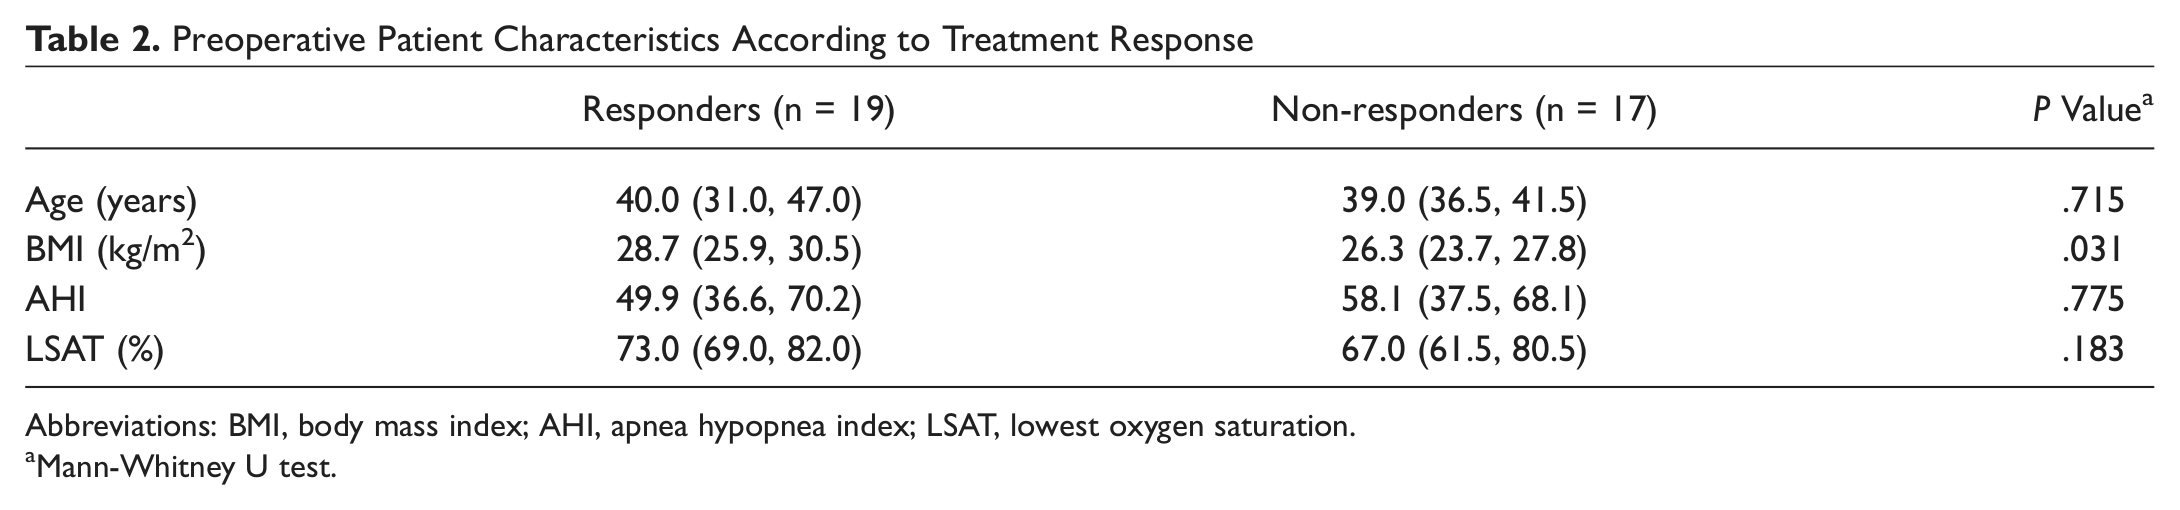
Abbreviations: BMI, body mass index; AHI, apnea hypopnea index; LSAT, lowest oxygen saturation.
Mann-Whitney U test.
Changes in anatomical parameters according to treatment response.
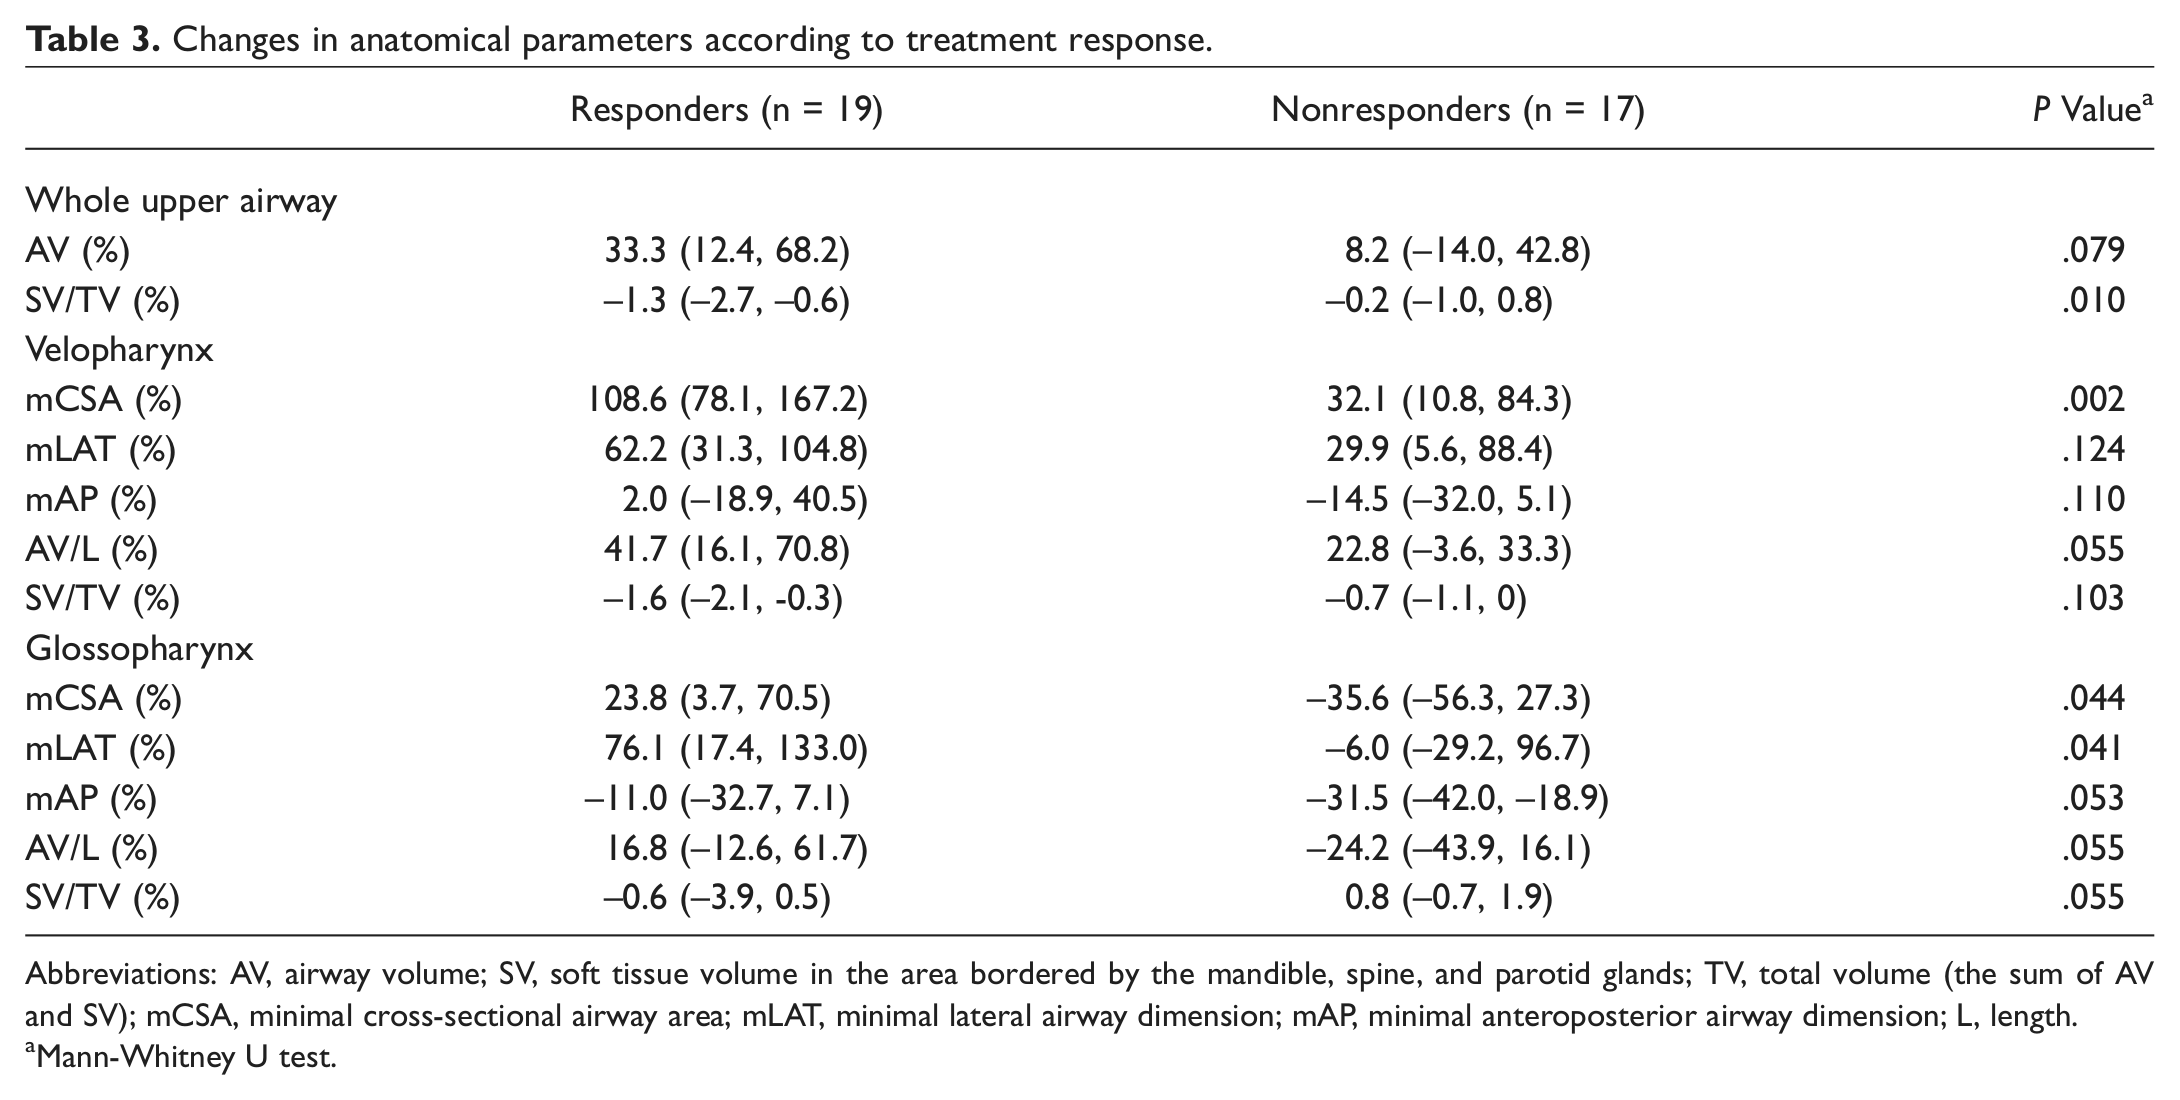
Abbreviations: AV, airway volume; SV, soft tissue volume in the area bordered by the mandible, spine, and parotid glands; TV, total volume (the sum of AV and SV); mCSA, minimal cross-sectional airway area; mLAT, minimal lateral airway dimension; mAP, minimal anteroposterior airway dimension; L, length.
Mann-Whitney U test.
Linear regression analysis including the changes in BMI and all the anatomical parameters found that only the change in VmCSA was significantly associated with the change in AHI after surgery (P = .001). The coefficient of this parameter was −0.2 (SE 0.056) and the R2 of this model was 0.271 (adjusted R2 0.249, SE of the estimate 25.2). Figure 2 shows the typical change in VmCSA in a responder (preoperative AHI 57.3, postoperative AHI 5.1). Figure 3 shows the typical change in VmCSA in a nonresponder (preoperative AHI 70.2, postoperative AHI 64.4). There was no significant difference in the change in VmCSA between patients with grade 2 tonsil size (83.9% [32.8, 137.1]) and patients with grade 0-1 tonsil size (59.3% [−0.1, 109.1] ) (P = .240).
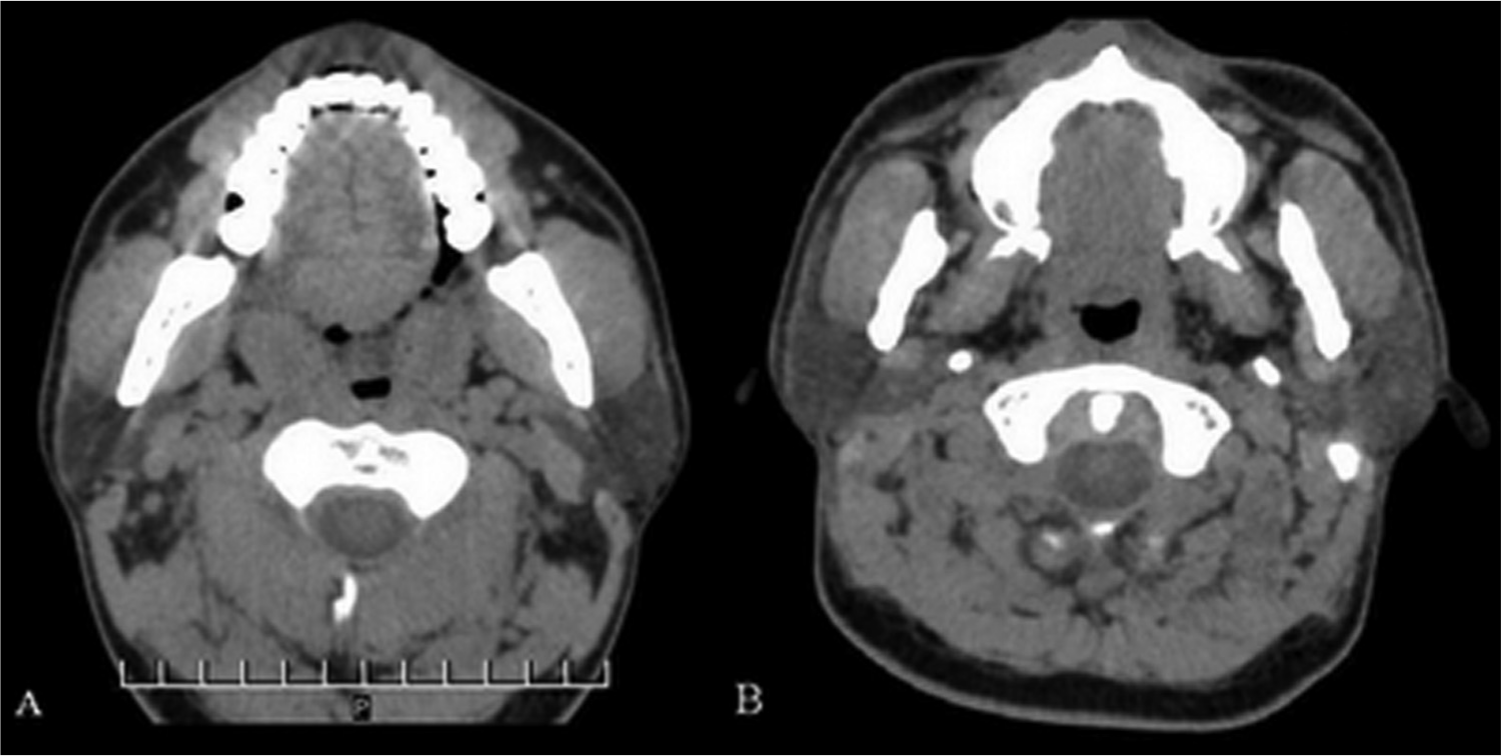
Computed tomography images in a patient who had a successful outcome after surgery. (A) Preoperative minimal cross-sectional area of the velopharynx. (B) Postoperative minimal cross-sectional area of the velopharynx, showing obvious enlargement.
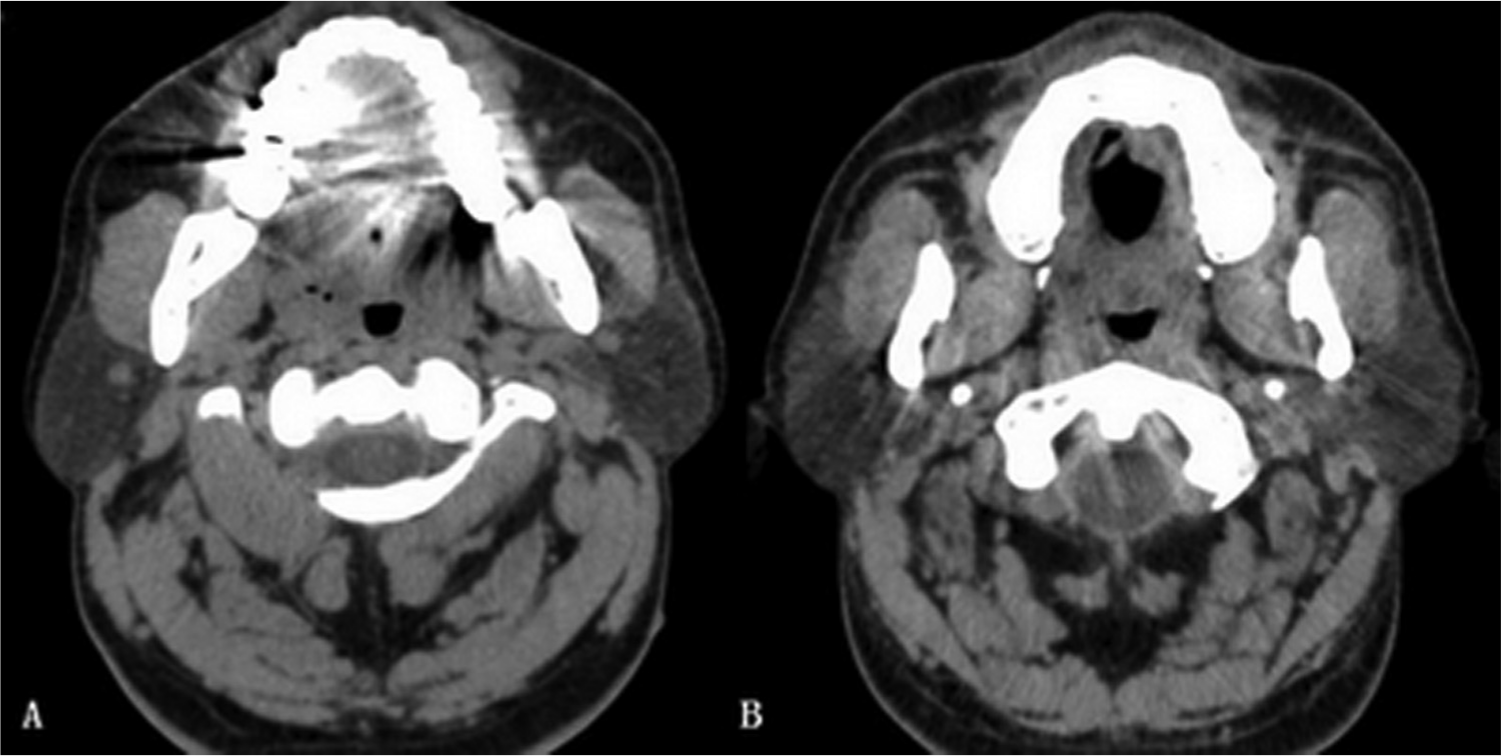
Computed tomography images in a patient who did not have a successful outcome after surgery. (A) Preoperative minimal cross-sectional area of the velopharynx. (B) Postoperative minimal cross-sectional area of the velopharynx, showing no obvious change.
Linear regression analysis including preoperative BMI and all the preoperative anatomical parameters identified only preoperative VmCSA as a significant predictor of change in VmCSA (P = .009). The coefficient of this parameter was −1.675 (SE 0.606) and the R2 of this model was 0.184 (adjusted R2 0.160, SE of the estimate 69.3). Linear regression analysis including postoperative BMI and all the postoperative anatomical parameters found that only postoperative VmCSA was independently associated with postoperative AHI (P < .001). The coefficient of this parameter was −0.222 (SE 0.053) and the R2 of this model was 0.341 (adjusted R2 0.321, SE of the estimate 13.9).
Discussion
This study compared pre- and postoperative 3D-CT and PSG findings to evaluate the outcomes of velopharyngeal surgery in 36 patients with tonsil grade 0-2 on the Brodsky scale. 7 The success rates of velopharyngeal surgery were calculated in subgroups of patients according to postoperative AHI, as proposed by Kezirian et al. 12 Although the success rates for subgroups with low postoperative AHI were relatively low (41.7% for AHI <15, 22.2% for AHI <10, and 5.6% for AHI <5), the higher success rate of 52.8% (19/36 patients) according to the classical definition of surgical success suggests that some patients with small tonsils can benefit considerably from velopharyngeal surgery.
Significant changes in the anatomical parameters evaluated on 3D-CT indicate that upper airway anatomy was significantly changed by the surgery. Previous reports suggested that treatment success was mainly a result of changes in upper airway anatomy.13,14 Our data show significant differences in the changes in several anatomical parameters between responders and nonresponders ( Table 3 ), confirming that changes in upper airway anatomy are closely related to the success of surgical treatment. Linear regression analysis of the relationships between anatomical changes and treatment response further found that a larger increase in VmCSA was significantly associated with a larger decrease in AHI. Although the coefficient for this relationship was not very high (−0.2), the changes in VmCSA of −50.0% to 265.8% in our patients could correspond to changes in AHI of 10.0% to −53.2%. Such a wide range of change in AHI might have great clinical significance in terms of treatment outcomes. Therefore, it can be concluded that an adequate increase in VmCSA is critical for a good surgical outcome in patients with small tonsils. Langin et al 15 and Li et al 8 used 3D-CT to assess the outcomes of velopharyngeal surgery in unselected OSA patients and reported similar findings. Previous studies reported that mCSA was an important predictor of OSA severity, which may help to explain the association between increased VmCSA and decreased AHI.16,17 This finding is also strongly supported by the proposal by Susarla et al, 18 based on Pouseille’s law, that increasing the cross-sectional area of the airway area (eg, by surgery) decreases airway resistance and can therefore reduce obstructive respiratory events during sleep.
In this study, no significant difference was observed in the change in VmCSA between patients with tonsil grade 2 and patients with tonsil grade 0-1, suggesting that the anatomical changes related to tonsillectomy alone might not necessarily have caused the changes in VmCSA. The changes in VmCSA might also be attributed to other aspects of the surgical procedures performed, such as: (1) advancement of the soft palate by transpalatal advancement pharyngoplasty, which has been proven to increase the dimensions of the velopharyngeal airway of OSA patients 19 ; (2) removal of redundant soft tissues of the velopharynx; and (3) closure of the palatoglossal arch, soft tissues of the tonsillar fossa, and palatopharyngeal arch with interrupted sutures. 9
This study also had 2 other important findings. First, preoperative VmCSA was found to be a predictor of the change in VmCSA after surgery. The coefficient of this relationship (−1.675) indicated that the preoperative VmCSA of 29 mm2 to 112 mm2 in our patients could correspond to decreases in the change in VmCSA of 48.6% to 187.6%, indicating that patients with a smaller preoperative VmCSA are more likely to get an adequate increase in VmCSA and are therefore more suitable candidates for such surgery. This finding could have clinical relevance in patient selection for such surgery. It would be expected that the outcome of a surgical procedure aimed at correcting abnormal anatomy is influenced by the preoperative anatomy. Woodson 20 also proposed that postoperative anatomical outcomes are influenced by preoperative upper airway anatomy. OSA has multiple causes, 21 and the anatomical contributions to OSA may be greater in patients with a narrower upper airway, resulting in a greater degree of improvement after surgery. Second, postoperative VmCSA was significantly associated with postoperative AHI. The coefficient of this relationship (−0.222) indicated that the postoperative VmCSA of 31 mm2 to 236 mm2 in our patients could correspond to decreases in postoperative AHI of 6.9 to 52.4. Such a wide range of change in postoperative AHI might be of great clinical significance. It can be concluded that a larger postoperative VmCSA is associated with a lower postoperative AHI. This result can also be used to conclude that an adequate enlargement of VmCSA is associated with a successful outcome after surgery.
Paradoxically, we noted a significant decrease in the overall mAP of the glossopharynx after surgery ( Table 1 ). Review of the CT images suggests that this may be because the tongue was closer to the posterior pharyngeal wall after surgery in some patients. Some other researchers have also noted this phenomenon after velopharyngeal procedures.22,23 It has been hypothesized that the dramatic decrease in airway resistance after surgery may result in insufficient resistance to sustain pulmonary ventilation in some patients and that the tongue is therefore moved backwards to increase resistance. In this study, this phenomenon was more pronounced in nonresponders than in responders ( Table 3 ), which differed from the findings reported by Shepard et al. 22 Further studies are required to definitively determine the reasons for this phenomenon and the relationships between this phenomenon and treatment outcomes.
Some limitations of this study should be discussed. First, 3D-CT was performed while patients were awake, which may not accurately reflect the state of the upper airway during sleep. However, all scans were performed at the end of expiration to better simulate the hypotonic upper airway during sleep. Second, baseline BMI was significantly higher in responders than in nonresponders. However, as high BMI is commonly recognized to be a predictor of unfavorable surgical outcome, this difference may not be clinically significant. Finally, many physiological factors that contribute to OSA may change after surgery, such as the ventilatory response to carbon dioxide, pharyngeal wall stiffness, airway reflexes, and flow dynamics. 20 These may be confounding factors and may be responsible for the relatively low R2 values in the regression analyses of this study. Wellman et al 24 recently proposed a new method for measuring and modeling some of these physiological parameters, and more research in this area may help to further clarify the mechanisms by which surgical treatment can help patients with OSA.
In summary, the results of this study suggest that some patients with small tonsils can benefit from velopharyngeal surgery. In these patients, an adequate increase in VmCSA is associated with a good treatment response. Patients with a smaller preoperative VmCSA are more likely to get a sufficient increase in their VmCSA for a successful outcome and are therefore more suitable candidates for such surgery.
Author Contributions
Disclosures
Footnotes
Acknowledgements
We thank the study participants and the technologists and physicians at the Sleep Centre of Beijing Tongren Hospital for their help with this study.
Sponsorships or competing interests that may be relevant to content are disclosed at the end of this article.
This article was presented at the 2012 AAO-HNSF Annual Meeting & OTO EXPO; September 9-12, 2012; Washington, DC.