
Abstract
Objective
To ascertain the relationship among vestibular schwannoma (VS) tumor volume, growth, and hearing loss.
Study Design
Retrospective cohort study.
Setting
Single tertiary center.
Subjects and Methods
Adults with observed VS and serviceable hearing at diagnosis were included. The primary outcome was the development of nonserviceable hearing as estimated using the Kaplan-Meier method. Associations of tumor volume with baseline hearing were assessed using Spearman rank correlation coefficients. Associations of volume and growth with the development of nonserviceable hearing over time were assessed using Cox proportional hazards models and summarized with hazard ratios (HRs).
Results
Of 230 patients with VS and serviceable hearing at diagnosis, 213 had serial volumetric tumor data for analysis. Larger tumor volume at diagnosis was associated with increased pure-tone average (PTA) (P < .001) and decreased word recognition score (WRS) (P = .014). Estimated rates of maintaining serviceable hearing at 6 and 10 years following diagnosis were 67% and 49%, respectively. Larger initial tumor volume was associated with development of nonserviceable hearing in a univariable setting (HR for 1-cm3 increase: 1.36, P = .040) but not after adjusting for PTA and WRS. Tumor growth was not significantly associated with time to nonserviceable hearing (HR, 1.57; P = .14), although estimated rates of maintaining serviceable hearing during observation were poorer in the group that experienced growth.
Conclusion
Larger initial VS tumor volume was associated with poorer hearing at baseline. Larger initial tumor volume was also associated with the development of nonserviceable hearing during observation in a univariable setting; however, this association was not statistically significant after adjusting for baseline hearing status.
With the refinement of microsurgical technique and demonstrated safety and efficacy of radiosurgery, the discussion regarding treatment of small- to medium-sized sporadic vestibular schwannoma (VS) often centers on long-term hearing preservation. As we better understand the natural history of VS, most centers have adopted a strategy that involves an initial period of observation for smaller tumors. A recent survey of the North American Skull Base Society found that 91% of respondents reported that their center proceeds with a period of initial observation for VS less than 1.5 cm in linear dimension. 1 Those tumors that demonstrate unequivocal tumor growth on serial magnetic resonance imaging (MRI) studies typically undergo treatment. However, patients with tumors that exhibit no growth are faced with the conundrum of whether “proactive” treatment or delayed treatment will result in the greatest likelihood of maintaining durable, serviceable hearing.
Still, a number of small VS undergo upfront treatment at the time of diagnosis under the principle that treating the lesion—when the tumor is the smallest it will ever be and hearing is the best it will ever be—will provide the best chance of maintaining long-term functional hearing. Many patients and providers naturally assume that both tumor size and tumor growth are associated with greater risk of hearing loss. While several studies support the notion that better hearing at diagnosis portends a lower risk of developing nonserviceable hearing over the interval of observation, 2 relatively little is known about tumor- or patient-related risk factors (such as age, sex, or other symptoms) for the development of progressive hearing loss. Herein, we use a large database of observed, sporadic VS to address 3 central questions in the management of small- to medium-sized VS: (1) what is the relationship between tumor volume and hearing status at diagnosis? (2) Is tumor volume at diagnosis associated with progressive hearing loss? (3) Is volumetric tumor growth associated with progressive hearing loss?
Methods
Following Mayo Clinic Institutional Review Board approval (15-008224), a retrospective review was performed of a subset of patients diagnosed with VS between 2001 and 2015 within a single-institution, prospectively maintained database. A complete description of this cohort, including a description of volumetric measurement methods, can be found in the study by Lees et al. 3 In brief, tumor volume was calculated using a slice-by-slice integral measurement technique using postcontrast T1- and thin-slice heavily T2-weighted sequences. Growth was defined as a 20% or greater increase in volume over the imaging interval. Growth rate was calculated as the percent change in volume from the initial MRI to the MRI demonstrating growth divided by the intervening time interval in years.
Audiologic data, including air conduction and bone conduction pure-tone average (PTA), word recognition score (WRS), and hearing class, were reported according to the American Academy of Otolaryngology–Head and Neck Surgery (AAO-HNS) guidelines. 4 PTA was defined as the average of hearing thresholds in decibel hearing level (dB HL) at 0.5, 1, 2, and 3 kHz, with appropriate substitution of the 2- and 4-kHz average if necessary. 5 Serviceable hearing was defined by ≤50 dB PTA and ≥50% WRS in accordance with AAO-HNS reporting guidelines.
Continuous features were summarized with medians and interquartile ranges (IQRs); categorical features were summarized with frequency counts and percentages. Associations of tumor volume at diagnosis with PTA, WRS, and hearing class at diagnosis were evaluated using Spearman rank correlation coefficients and Wilcoxon rank sum tests. Survival rates of maintaining serviceable hearing were estimated using the Kaplan-Meier method. The duration of follow-up was calculated from the diagnosis date to the first nonserviceable hearing date or the last audiogram date prior to intervention. Associations with time to nonserviceable hearing were evaluated using Cox proportional hazards regression models and summarized with hazard ratios (HRs) and 95% confidence intervals (CIs). Unlike baseline tumor volume and audiometry, whether or not tumor growth occurred during follow-up is not known at diagnosis; rather, the status of this feature can change over time as additional MRI studies are accumulated. As such, tumor growth was evaluated as a time-dependent covariate in the Cox model. The association of growth rate with time to nonserviceable hearing among the subset of patients who experienced growth was evaluated using a Cox model with the duration of follow-up calculated from the date growth was detected. Statistical analyses were performed using SAS version 9.4 (SAS Institute, Cary, North Carolina) and R version 3.2.3 (R Foundation for Statistical Computing, Vienna, Austria). P values <.05 were considered statistically significant.
Results
Overall Patient Cohort
A total of 230 patients had serviceable hearing at diagnosis; of these, 213 (93%) had tumor volume data available for analysis and formed the study cohort. Median age at diagnosis was 58 years (IQR, 49-66) and included 122 (57%) women. Median tumor volume at diagnosis was 0.125 cm3 (IQR, 0.048-0.283 cm3), and 155 (73%) tumors were purely intracanalicular. Baseline audiometric characteristics including AAO-HNS hearing class are summarized in Table 1 . A scattergram plot illustrating baseline PTA and WRS for each patient is shown in Figure 1 .
Tumor Volume and Audiometric Characteristics at Diagnosis.
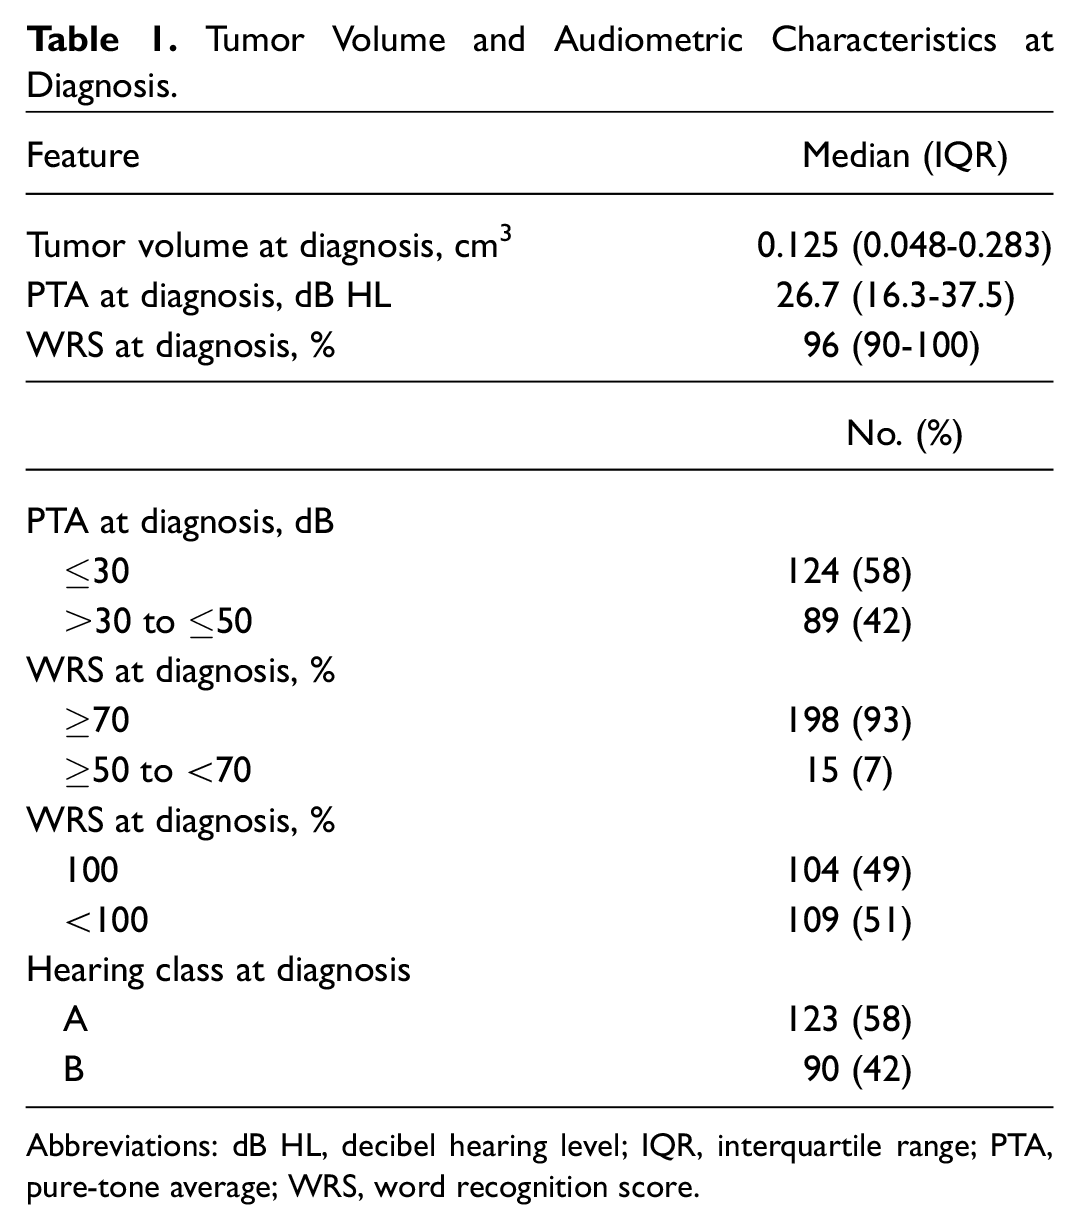
Abbreviations: dB HL, decibel hearing level; IQR, interquartile range; PTA, pure-tone average; WRS, word recognition score.
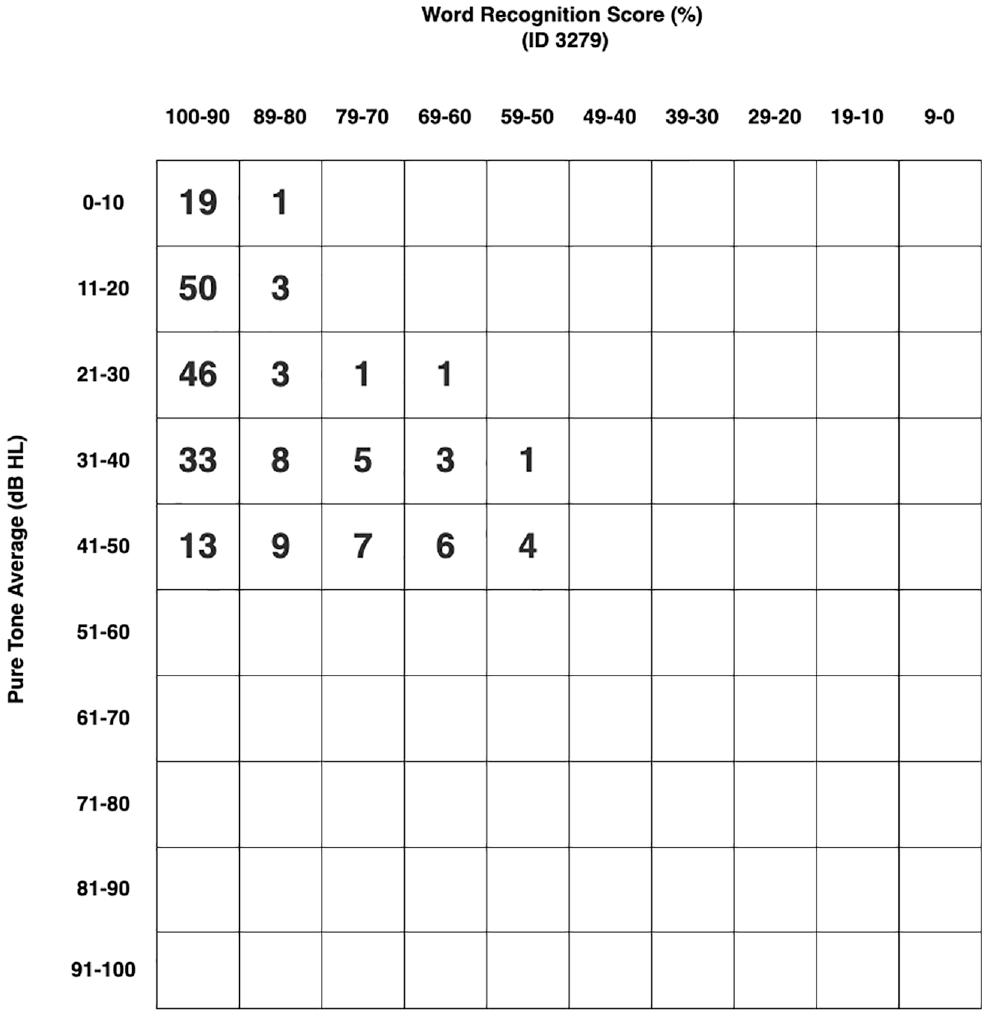
Scattergram plot depicting pure-tone average (PTA) and word recognition score at diagnosis (n = 213).
Correlation of Tumor Volume with Audiometry at Diagnosis
There was a statistically significant positive correlation between tumor volume and PTA at diagnosis (correlation coefficient 0.26; P < .001), indicating that PTA increased as tumor volume increased ( Figure 2 ). There was a statistically significant negative correlation between tumor volume and WRS at diagnosis (correlation coefficient −0.17; P = .014), indicating that WRS decreased as tumor volume increased ( Figure 3 ). Note that only patients with tumors 1.0 cm3 or less (n = 200; 94%) were included in these 2 figures to better illustrate the correlations. Associations of tumor volume with categorized PTA, WRS, and hearing class are summarized in Table 2 .
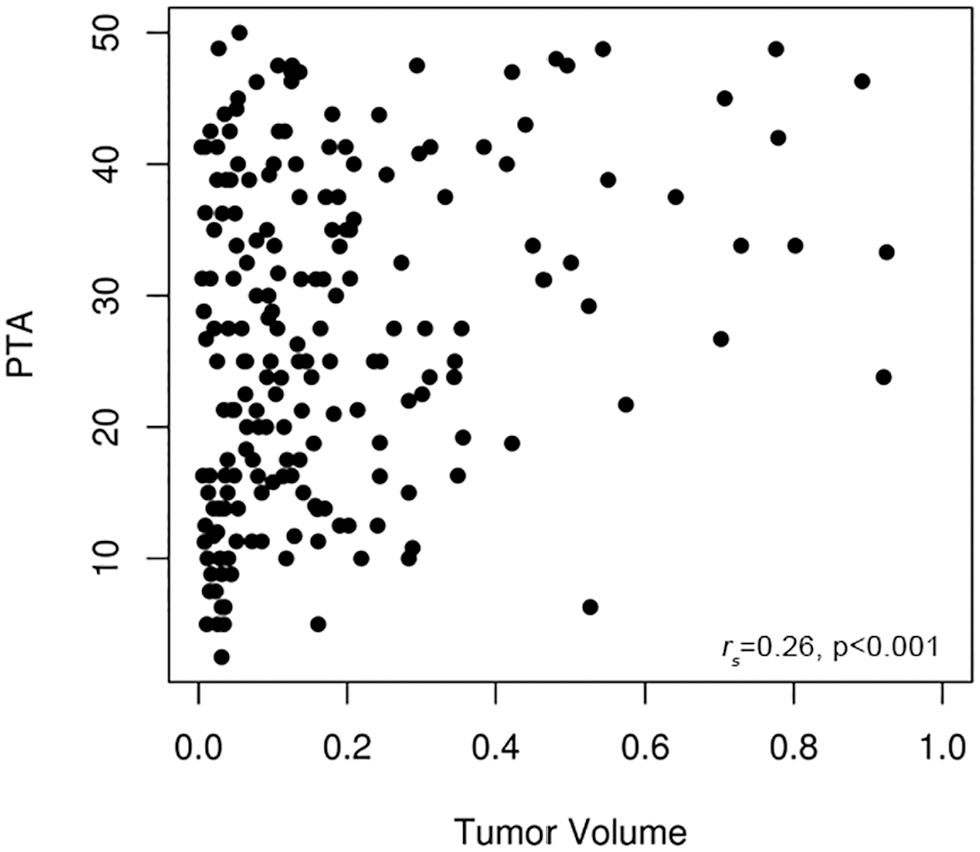
Correlation between pure-tone average (PTA) and tumor volume at diagnosis.
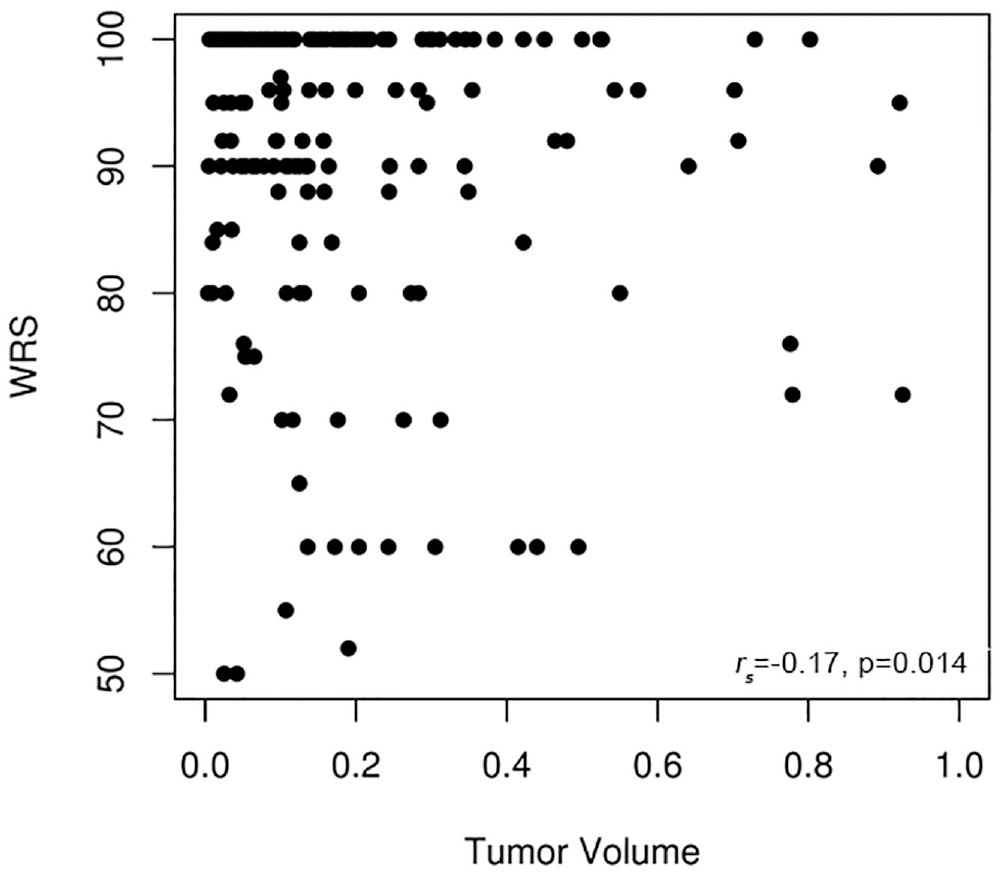
Correlation between word recognition score (WRS) and tumor volume at diagnosis.
Associations of Tumor Volume at Diagnosis with Categorized PTA, WRS, and Hearing Class.
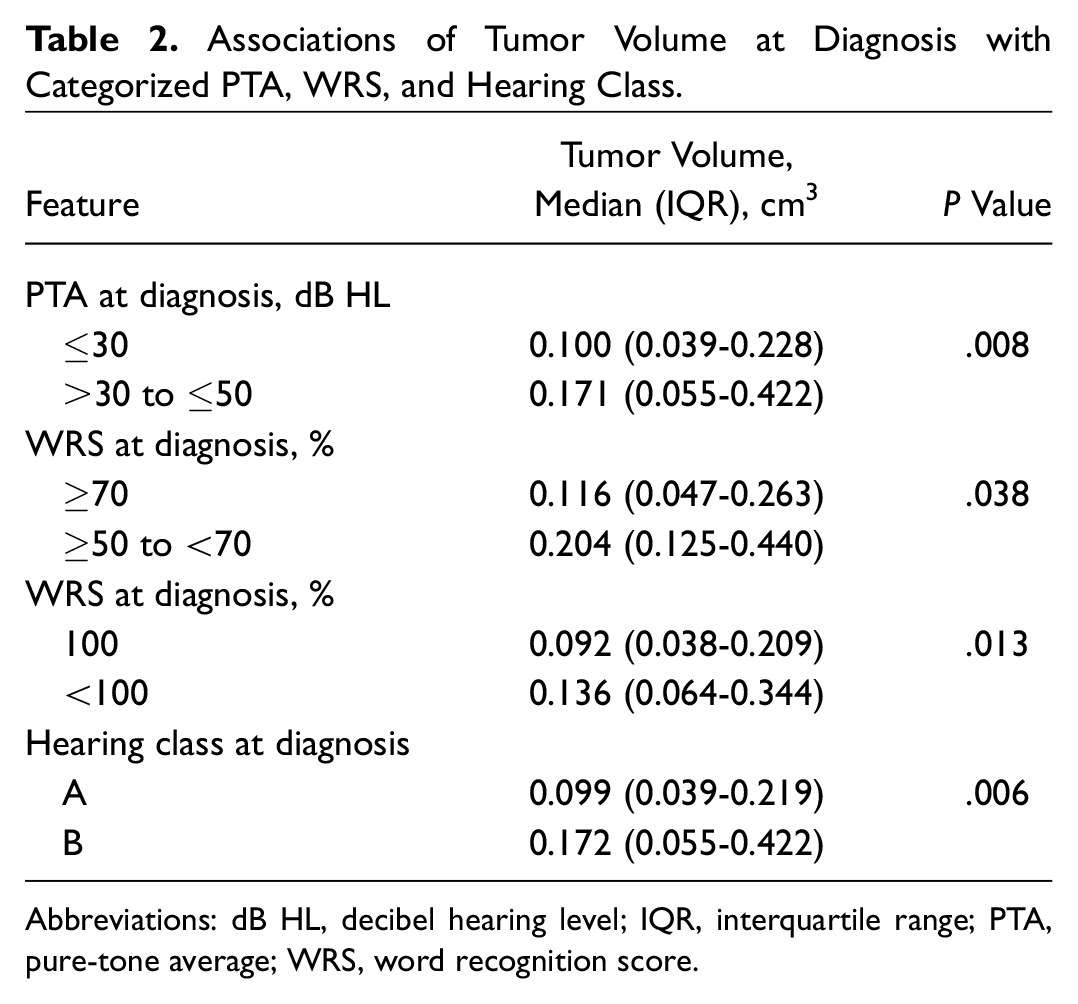
Abbreviations: dB HL, decibel hearing level; IQR, interquartile range; PTA, pure-tone average; WRS, word recognition score.
Association of Tumor Volume at Diagnosis with Progressive Hearing Loss
Among the 213 patients under study, 51 developed nonserviceable hearing at a median of 2.4 years following diagnosis (IQR, 0.9-3.9) (scattergram plots, Figure 4 ). The median duration of hearing follow-up prior to intervention for the 162 patients who continued to have serviceable hearing was 3.0 years (IQR, 1.3-5.3). Rates of maintaining serviceable hearing (95% CI; number still at risk) at 2, 4, 6, 8, and 10 years following diagnosis were 88% (83-93; 133), 74% (68-82; 72), 67% (59-76; 37), 65% (57-75; 21), and 49% (35-68; 8), respectively ( Figure 5 ). The univariable association of tumor volume at diagnosis with time to nonserviceable hearing is summarized in Table 3 . This association was also evaluated after multivariable adjustment for PTA and WRS at diagnosis as these features have previously been shown to be associated with progressive hearing loss.6-9 Although tumor volume at diagnosis was significantly associated with time to nonserviceable hearing in a univariable setting (HR for a 1-cm3 increase of 1.36; 95% CI, 1.02-1.83; P = .040), this association was no longer statistically significant after adjusting for relevant confounders (HR for a 1-cm3 increase of 1.13; 95% CI, 0.80-1.59; P = .49).
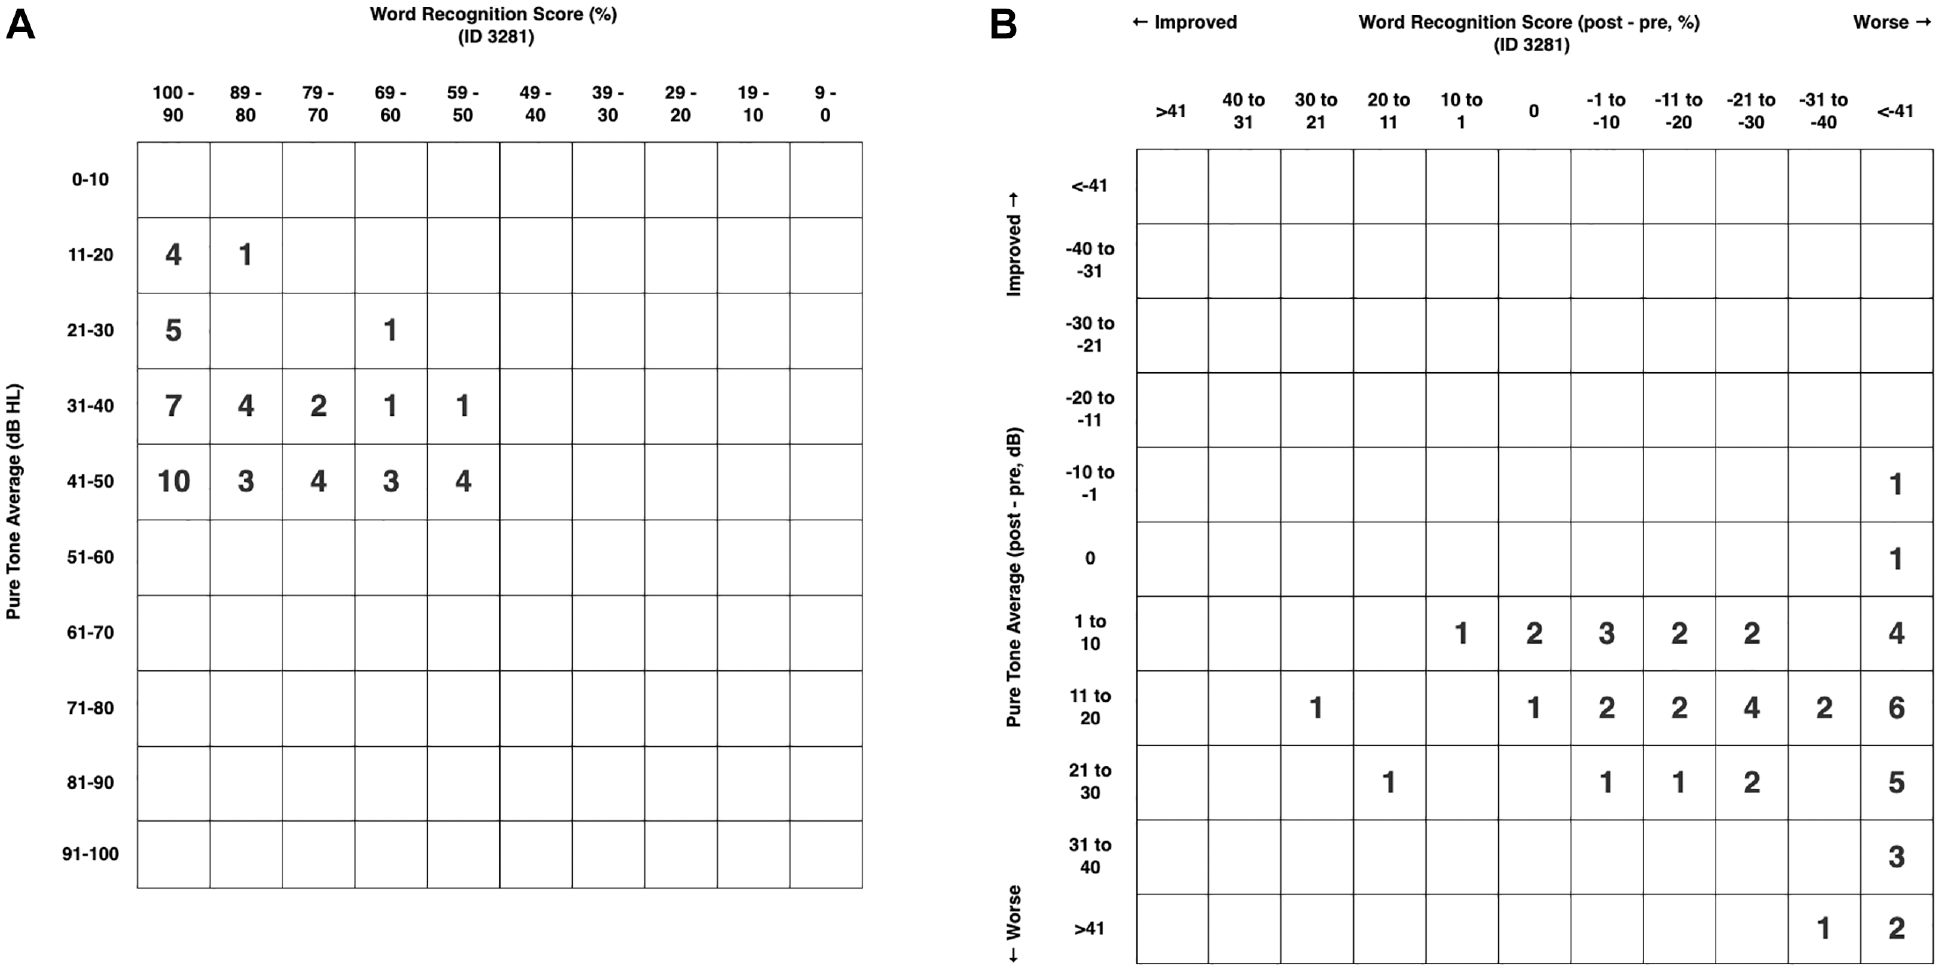
Scattergram plots depicting pure-tone average (PTA) and word recognition score (WRS) at diagnosis for subset that lost serviceable hearing during observation (A) and change in PTA and WRS during observation (B, n = 50). One patient did not have PTA available at the time that nonserviceable hearing was discovered but was American Academy of Otolaryngology–Head and Neck Surgery (AAO-HNS) class D by WRS.
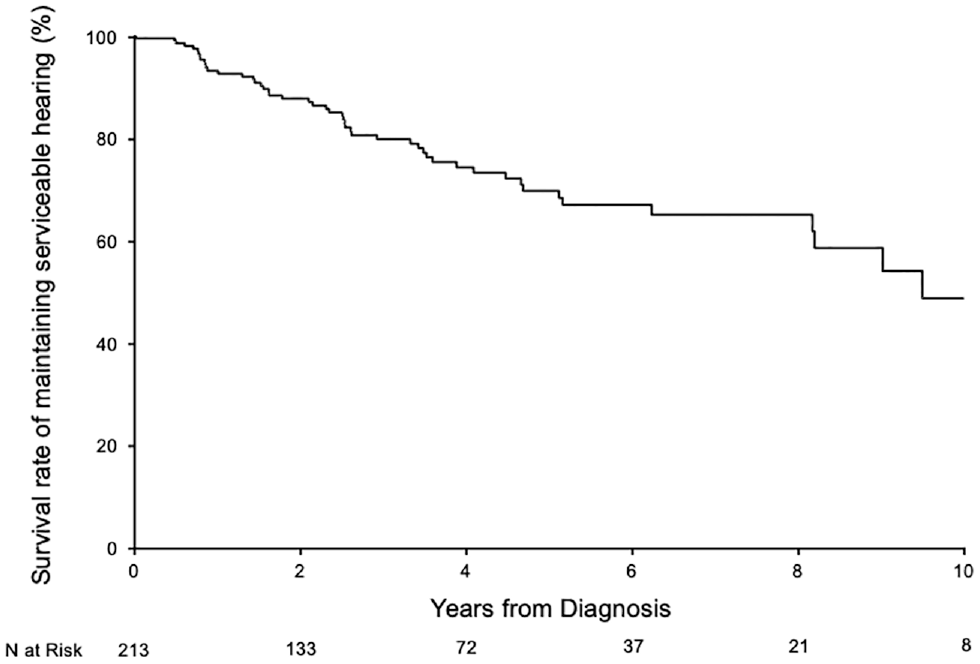
Survival rates of maintaining serviceable hearing during the interval of observation as estimated using the Kaplan-Meier method.
Univariable and Multivariable Associations with Time to Nonserviceable Hearing.
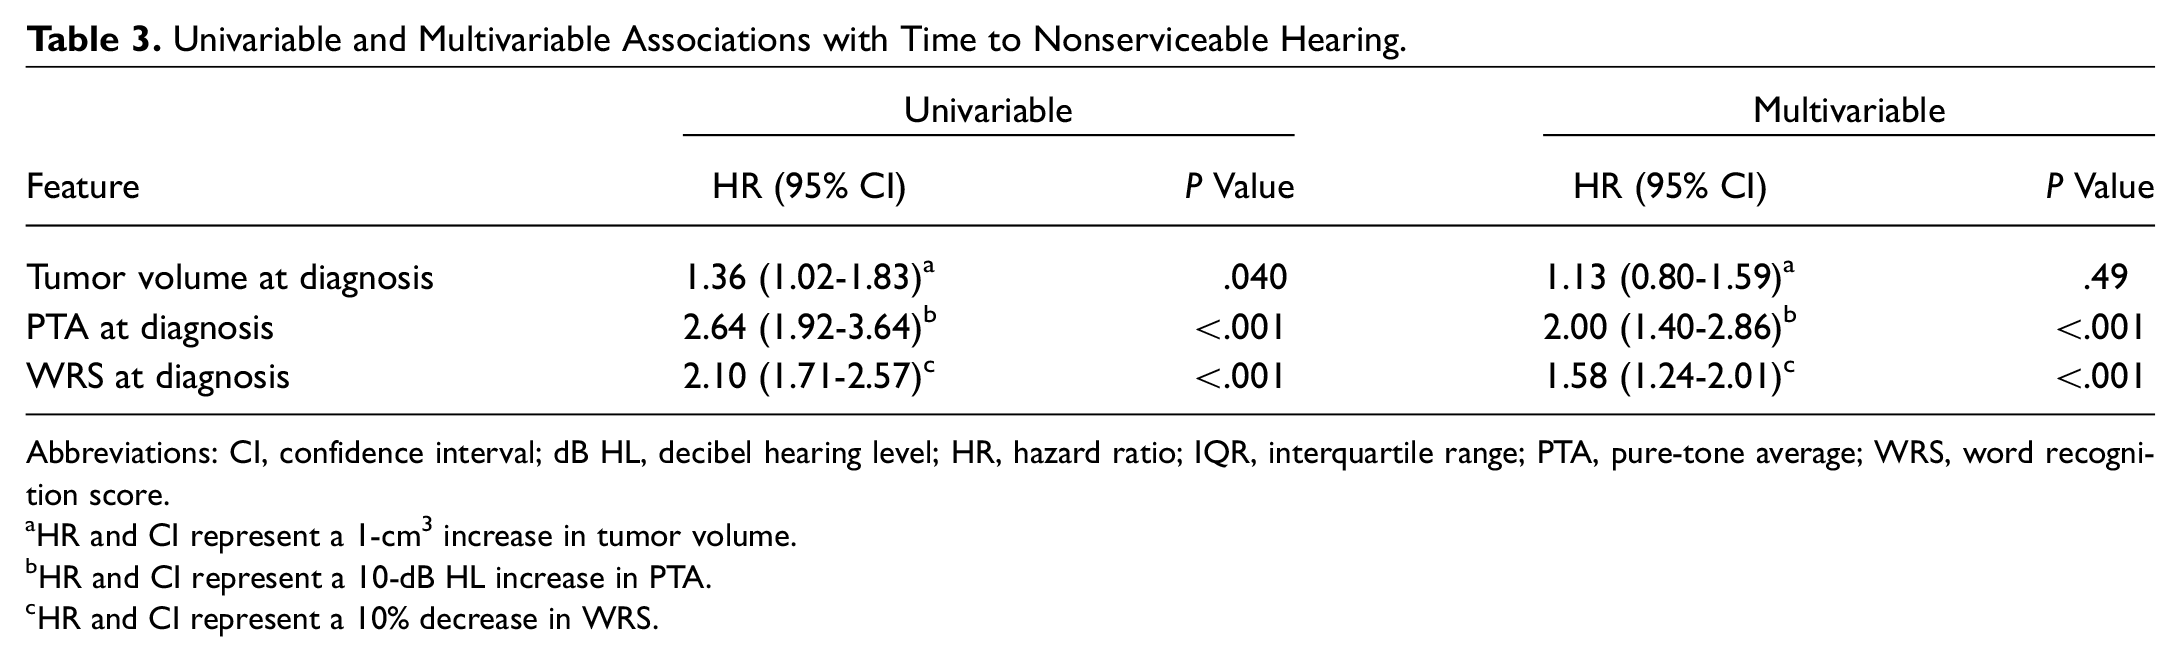
Abbreviations: CI, confidence interval; dB HL, decibel hearing level; HR, hazard ratio; IQR, interquartile range; PTA, pure-tone average; WRS, word recognition score.
HR and CI represent a 1-cm3 increase in tumor volume.
HR and CI represent a 10-dB HL increase in PTA.
HR and CI represent a 10% decrease in WRS.
Association of Tumor Growth during Follow-up with Progressive Hearing Loss
Ninety-nine patients experienced volumetric tumor growth during audiometric follow-up. The HR for the association of tumor growth with time to nonserviceable hearing was 1.57 (95% CI, 0.87-2.83; P = .14). After adjusting for PTA and WRS at diagnosis, the HR was 1.25 (95% CI, 0.67-2.30; P = .48). These results indicate that patients who experienced volumetric tumor growth were not statistically significantly more likely to develop nonserviceable hearing during the interval of observation. Using the Cox model with tumor growth as a time-dependent covariate, the predicted rates of maintaining serviceable hearing at 2, 4, and 6 years following diagnosis were 89%, 78%, and 72%, respectively, for patients who did not experience tumor growth during the interval of observation. For those who did experience growth, the rates at 2, 4, and 6 years following diagnosis were 84%, 68%, and 60%, respectively.
Association of Tumor Growth Rate with Progressive Hearing Loss
For the 99 tumors that demonstrated growth, the median growth rate was a 42.5% increase in volume per year (IQR, 19.0-90.7). In this subset, 23 patients developed nonserviceable hearing at a median of 1.8 years following the date growth was detected. In a univariable setting, the HR for a 10% increase in volume per year with time to nonserviceable hearing was 0.96 (95% CI, 0.89-1.04; P = .28). This association was not evaluated after adjusting for PTA and WRS at diagnosis because there were too few patients who developed nonserviceable hearing in this subset to support multivariable adjustment.
Discussion
The current study attempts to answer 3 central issues regarding the natural history of VS: (1) what is the relationship between tumor volume and hearing status at diagnosis? (2) Is tumor volume at diagnosis associated with progressive hearing loss? (3) Is volumetric tumor growth associated with progressive hearing loss?
With regard to the first question, in this study, tumor volume was associated with increased PTA and decreased WRS at the time of diagnosis. Several studies have examined the association between 2-dimensional tumor size and degree of hearing loss at initial presentation.10-13 A retrospective study of 369 VS cases analyzed audiometric results at the time of diagnosis and found that patients with normal initial hearing had smaller tumors on average (1.44 cm) compared to those presenting with sensorineural hearing loss (1.96 cm). 10 Similarly, Selesnick and Jackler 13 found that smaller VS tumor diameter at diagnosis was associated with better hearing. However, both authors acknowledged that in some cases, relatively good hearing is preserved even in very large tumors.
The current study, using volumetric analysis, corroborates these earlier studies by demonstrating a positive correlation between volume and poorer hearing (increased PTA, decreased WRS). This reflects the belief that audiological deterioration often occurs from compressive effects on relevant neurovascular structures, in addition to increased deposition of tumor proteins and inflammatory mediators within the inner ear.14,15
Fifty-one patients developed nonserviceable hearing at a median of 2.4 years following diagnosis, with rates of maintaining serviceable hearing at 6 and 10 years following diagnosis of 67% and 49%, respectively. These findings parallel those demonstrated in other large studies. Stangerup et al 16 reported that 55% of subjects maintained serviceable hearing after a mean of 4.7 years of follow-up in a study of 455 patients with VS who had AAO-HNS class A or B hearing at diagnosis. In another large study of 982 observed VS cases with hearing classified as either AAO-HNS A or B, or Gardner-Robertson I or II, hearing was preserved in 54% of patients at 2 to 4 years of follow-up. 17 Other studies describe similar rates of serviceable hearing, ranging from 50% to 54% at approximately 5 years following diagnosis.7,18
In our study, multivariable analysis demonstrated that greater PTA and lower WRS at diagnosis were significantly associated with decreased time to nonserviceable hearing. Specifically, every 10-dB increase in PTA at diagnosis imparted a 2-fold increased risk of developing nonserviceable hearing (P < .001). Similarly, for every 10% decrease in initial WRS, the likelihood of developing nonserviceable hearing increased 1.6-fold (P < .001). These data serve as a subset of a prior multicenter study of 466 patients with conservatively managed VS, in which Hunter et al 8 reported similar magnitudes of association between these audiometric measures and the risk of developing nonserviceable hearing. There is abundant existing literature concluding that audiometric measures at diagnosis are a significant predictor of hearing preservation.6,7,9 A large Danish study by Stangerup et al 2 demonstrated that the primary predictive factor of hearing loss was initial speech discrimination. A more recent article from the same group found that of patients with 100% speech discrimination at diagnosis, 69% maintained good hearing after more than 10 years of observation, compared to only 38% of patients with even a small discrimination loss at diagnosis. 16 A data set of solely intracanalicular VS similarly found that better initial hearing portended better long-term hearing preservation. This “early loss” effect, where deterioration of hearing happens early and is often followed by relatively stable hearing, is important in management decisions and patient counseling. If a patient has been monitored for several years and maintained good hearing, the risk of developing nonserviceable hearing is likely quite small. 19
With regard to the second question on the relationship between tumor volume and progressive hearing loss, larger tumor volume at time of diagnosis was also associated with an increased risk of hearing loss, with every 1-cm3 increase in volume associated with an HR of 1.36 (P = .040). This finding logically follows the strong association between larger tumor volume and worse audiometric measures at diagnosis, paired with existing literature that largely supports the association between initial audiometric performance and risk of progressive hearing loss. To our knowledge, this study is the first to quantify the association between VS volume and risk of progressive hearing loss. Several studies have examined the effect of 2-dimensional tumor size at diagnosis on hearing outcomes, although conclusions have varied. Some studies, including surgical series, have found a significant association between initial tumor size and postoperative or follow-up audiometric measures including PTA and speech discrimination.20-23 Other studies demonstrated no statistically significant association.8,24,25 On the other hand, a literature review by Sughrue et al 17 found that patients with larger tumors were actually more likely to maintain hearing. We postulate that this discrepancy is a reflection of the variability in methods of measuring 2-dimensional tumor size. Varughese et al 26 compared volume estimates based on a single maximum diameter, 3 orthogonal diameters, and the maximal slice area with the actual segmented tumor volume and found that maximum diameter offered the least reliable measurement of tumor size.
While maximum axial tumor diameter remains the most commonly reported marker of VS size, the use of 3-dimensional segmentation provides a more precise measure. Two-dimensional measurements are highly susceptible to interobserver error.27-29 Moreover, volumetric analysis has been shown to demonstrate earlier identification of tumor growth than linear measurements as it captures changes in multiple dimensions.30,31 Maximum linear diameter measurements are less accurate for tumors that are not perfectly spherical and also do not take into consideration the intracanalicular portion of the tumor.
Finally, this study addresses the third question regarding the relationship of tumor growth (and growth rate) with the development of nonserviceable hearing. Over the course of follow-up, 99 patients in our study experienced volumetric tumor growth, with a median growth rate of 42.5% per year (IQR, 19.0-90.7). Of note, there is significant heterogeneity in growth rates reported in the literature, ranging from 12% to 20%, which likely reflects inconsistent measurement techniques and a lack of a consensus definition of volumetric tumor growth.32-40 Furthermore, at the extremes of tumor size, nearly every measurement technique becomes limited as does clinical applicability. For example, growth of a 2-mm VS to 3 mm in linear dimension represents a 50% increase in linear dimension and an over 300% change in volume but is clinically not meaningful in most cases.
A review of the literature is not conclusive on the effect of tumor growth and, more specifically, the rate of tumor growth on preservation of serviceable hearing. Massick et al 41 demonstrated that the presence of tumor growth was associated with a deterioration in PTA and speech discrimination and, furthermore, that tumor volume had a greater effect on these audiometric measures when initial auditory function was worse. Conversely, a prospective longitudinal study of 72 conservatively managed unilateral VS cases found that hearing deterioration based on PTA and speech discrimination scores occurred irrespective of tumor growth. 42 Several other studies have corroborated this latter finding.43-45 One study even demonstrated hearing deterioration in patients whose tumors spontaneously regressed in size. 46 Regarding the impact of tumor growth rate, a small study of 31 observed VS cases reported a significant correlation between the annual growth rate (mm/year) and the rate of hearing loss (dB/year) based on PTA measurements. 47
Ultimately, the association between tumor growth and hearing loss in observed VS deserves careful interpretation. We have encountered instances where patients do not return for their regularly scheduled MRI scan because they did not experience a subjective change in hearing—a decision driven by the assumption that progression of hearing loss correlates with growth. Conversely, patients often have difficulty reconciling progressive hearing loss in the absence of radiographic tumor progression. We always emphasize to our patients that symptoms alone cannot be used as a reliable indicator for tumor growth during observation, and regularly scheduled MRI studies are critical.
There are several strengths and limitations to our study. This study represents one of the largest reports to date investigating volumetric measurements and hearing outcomes in untreated sporadic VS. All analyses employed rigorous statistical methodology appropriate for an outcome that is time dependent. Volumetric tumor analysis and definitions of growth (for either linear or volumetric measurement strategies) remain controversial in our field. Another limitation is the relatively small sample size of the subset of patients who experienced tumor growth that was used for associations involving tumor growth rate.
Conclusion
Larger initial VS tumor volume is associated with poorer hearing at baseline and an increased risk of developing nonserviceable hearing during observation by univariable analysis; however, this association was no longer statistically significant when adjusting for baseline hearing status. The relationship between tumor growth and the development of nonserviceable hearing remains unclear. This study, in conjunction with available literature focused on hearing outcomes following microsurgery and radiosurgery, may aid in counseling patients regarding the expected progression of hearing loss based on tumor factors during an observational approach.
Author Contributions
Disclosures
Footnotes
No sponsorships or competing interests have been disclosed for this article.
This article was presented at the AAO-HNSF 2019 Annual Meeting & OTO Experience; September 15-18, 2019; New Orleans, Louisiana.