
Abstract
Objective
To report health utilization patterns and outcomes of medical and surgical management in patients with chronic suppurative otitis media (CSOM).
Study Design
Retrospective cohort.
Setting
Academic otology clinic.
Methods
This study included 175 patients with CSOM with a first clinic visit at our institution between March 2011 and November 2016. All patients displayed a diagnosis of CSOM by International Classification of Diseases code, had at least 1 episode of active CSOM (defined as perforation with otorrhea), and had a documented history of chronic ear infections. The mean age was 49.5 ± 1.5 years, 53% were female, and mean follow-up time was 3.5 ± 0.3 years.
Results
Patients had an average of 9.5 ± 0.5 otology visits, 4.7 ± 0.4 prescriptions, and 1.7 ± 0.1 surgeries, with estimated per patient cost ranging from $3927 to $20,776. Under medical management, 69% of patients displayed recurrence of disease, with a median time to recurrence of 4 months. For tympanoplasty and tympanomastoidectomy, median time to recurrence was similar at 5 and 7 years, respectively (P = .73). At the most recent visit, the prevalence of all patients with CSOM displaying moderate or worse sensorineural hearing loss (SNHL) was 41%.
Conclusions
CSOM represents a major public health issue with high health care utilization and associated costs. Surgery is superior to medical therapy for achieving short- to medium-term inactive disease. Patients with CSOM display a high SNHL burden.
Keywords
Chronic suppurative otitis media (CSOM) is characterized by a chronically infected middle ear with tympanic membrane (TM) perforation and otorrhea. CSOM affects 330 million individuals globally and results in 2 million lost disability-adjusted life years (DALYs).1,2 CSOM remains one of the leading causes of pediatric permanent hearing loss in developing countries.2,3
CSOM also affects the developed world; however, a paucity of data exists regarding costs and long-term outcomes in the United States. These data would be useful to understand the scope of CSOM in the United States and whether current treatments are effective. CSOM epidemiological studies have been conducted in high-risk US subpopulations, including Native Americans and Alaskan Eskimos, with prevalence rates of up to 10%.2-5 However, assessing CSOM-related costs requires epidemiological and health utilization data for patients with CSOM. For the US general population, these data are available for otitis media6-9 but not CSOM specifically.
Multiple clinical trials report high success rates for topical fluoroquinolones in CSOM.10-15 Unfortunately, these studies display short follow-up times of less than 1 month, limiting evaluation of infection recurrence.10,11 Surgical outcomes data display longer follow-up with high efficacy rates several years postoperatively.16-31 However, these studies report success rates at set time points without information on time to recurrence. Several studies have also indicated a high prevalence of sensorineural hearing loss (SNHL) in patients with CSOM,32-36 suggesting that current management may not prevent long-term hearing loss. Further data are needed to understand hearing loss–associated morbidity in CSOM.
Given current gaps in the literature, this study documents CSOM-related health utilization and costs at a US academic otology clinic, reports long-term medical and surgical outcomes, and documents the prevalence of SNHL by severity in CSOM. These data help elucidate the impact of CSOM in the United States and identify areas of management requiring improvement.
Materials and Methods
Retrospective medical record review was approved by the Stanford University Institutional Review Board (Protocol 56466). Patients with an International Classification of Diseases (ICD) diagnosis of CSOM and first clinic visit from March 2011 to November 2016 were sequentially reviewed. Patients included in this study displayed an ICD code for chronic suppurative otitis media (H66.1, H66.2, or H66.3) and had at least 1 active CSOM episode at our center (defined as TM perforation with otorrhea). Patients with the following were excluded: primary cholesteatoma, primary otitis externa, radiation to the ear field, lack of current CSOM at presentation, or loss to follow-up. We defined loss to follow-up as lack of return to the clinic, despite a recommendation to, following initial presentation.
Health utilization data included number of otology visits, prescriptions, and surgeries on unique dates. Prior surgery was defined as tympanoplasty or tympanomastoidectomy for noncholesteatomatous disease. Patients with primary cholesteatoma were excluded from our study. Based on these factors, CSOM-related costs were estimated for multiple insurance types. Medicare costs were estimated using the Physician Fee Schedule maintained by the Centers for Medicare & Medicaid Services (CMS), which records national and county prices by Current Procedural Terminology (CPT) code and includes professional fees. 37 CMS costs for ear surgery anesthesia (CPT 00120) were calculated as the sum of base units (5) and time units (15 minutes per unit) multiplied by CMS locality-adjusted conversion factors. 38 The following anesthesia durations were assumed: tympanoplasty (2.5 hours), tympanomastoidectomy (4 hours), canal wall-down procedure (additional 0.5 hours), and ossicular chain reconstruction (additional 0.5 hours). Medication costs were based on the January 2021 Medicaid federal upper limits (FULs) provided by CMS. 39 Private insurance costs were calculated as the average contracted reimbursement rate for 4 large private insurers at our institution.
A cost range per patient was calculated based on certain assumptions. For the lower boundary, we assumed each new and return otology patient visit was billed as a medical encounter of moderate (CPT 99204) and low (CPT 99213) complexity, respectively; each otology visit included binocular microscopy without cerumen removal (CPT 92504), and a computed tomography (CT) temporal bone without contrast (CPT 70480) preceded tympanoplasty and tympanomastoidectomy. For the higher boundary, we assumed (1) each otology visit included binocular microscopy (CPT 99213) and 25% of visits included cerumen removal (CPT 69210), (2) each new otology visit is referred from a primary care visit of moderate complexity (CPT 99204), and (3) each tympanoplasty or tympanomastoidectomy at an outside institution included 2 preoperative visits of low complexity (CPT 99213) and a CT temporal bone without contrast (CPT 70480).
For patients undergoing medical management, a Kaplan-Meier curve was plotted for time to recurrence. For patients undergoing surgery with follow-up of at least 6 months, a Kaplan-Meier curve was plotted for postoperative time to recurrence. Recurrence was defined as TM perforation with otorrhea. For patients with bilateral disease, the time to recurrence was recorded separately for each ear. Multivariable logistic regression was performed to determine if the following factors were associated with recurrence: age at presentation, sex, race, bilateral disease, ICD diagnosis of type 2 diabetes, prior surgery, and follow-up time.
Audiometric data were recorded for all patients with pre- and posttreatment audiograms, excluding individuals with alternative hearing loss etiologies (eg, noise-induced or medication-induced hearing loss). Results were reported according to the Hearing and Equilibrium Committee of the American Academy of Otolaryngology–Head and Neck Surgery (AAO-HNS) guidelines. 40 Unaided word recognition scores (WRSs) were obtained at varying thresholds depending on patient hearing levels. Air conduction and bone conduction pure-tone averages (PTAs) were used to categorize conductive hearing loss (CHL) and SNHL severity, respectively, according to World Health Organization (WHO) guidelines. 41
Statistical comparisons were performed in R version 4.0.0 (R Foundation for Statistical Computing). A 2-sided Student t test was performed to compare continuous variables, and Pearson χ2 or Fisher exact test was performed for comparisons of categorical variables. Survival curves were compared using the log-rank test. Values for continuous variables were reported as mean and standard error of the mean (SEM), while values for categorical variables were reported as counts and percentages. A P value of .05 was set as the threshold for significance.
Results
Patients
In total, 697 patients with an ICD diagnosis of CSOM were reviewed. Most patients were excluded due to a lack of presenting CSOM diagnosis on medical record review, loss to follow-up, or other criteria ( Figure 1 ). Our final cohort included 175 patients with demographics summarized in Table 1 . The average age was 49.5 ± 1.5 years, and a plurality of patients were female (53%), were of white race/ethnicity (42%), and had unilateral CSOM (69%).
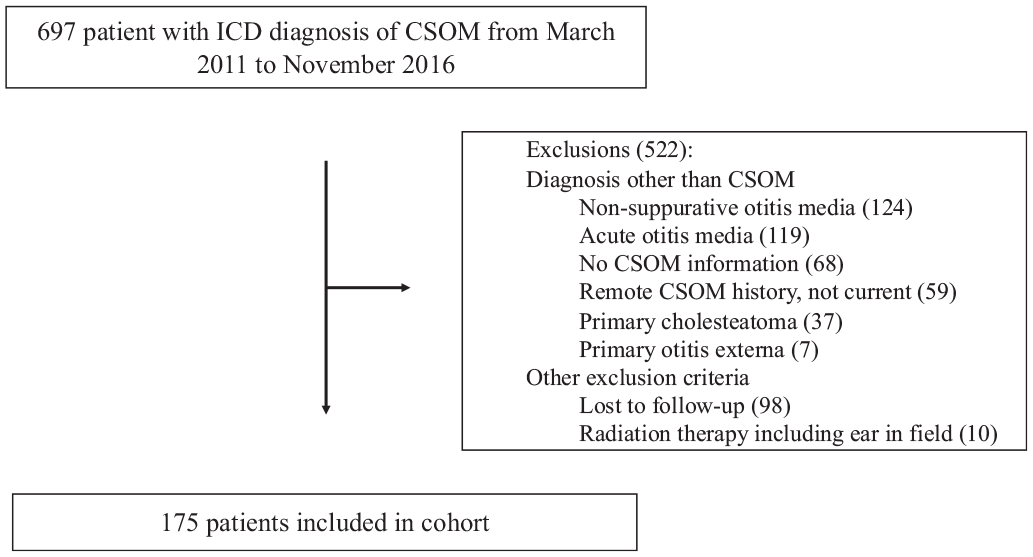
Patient selection process. Patients with an International Classification of Diseases (ICD) diagnosis of chronic suppurative otitis media (CSOM) were reviewed. After excluding patients with non-CSOM diagnoses, loss to follow-up, or meeting other exclusion criteria, 175 patients were included in our cohort.
Patient Demographics and Characteristics.
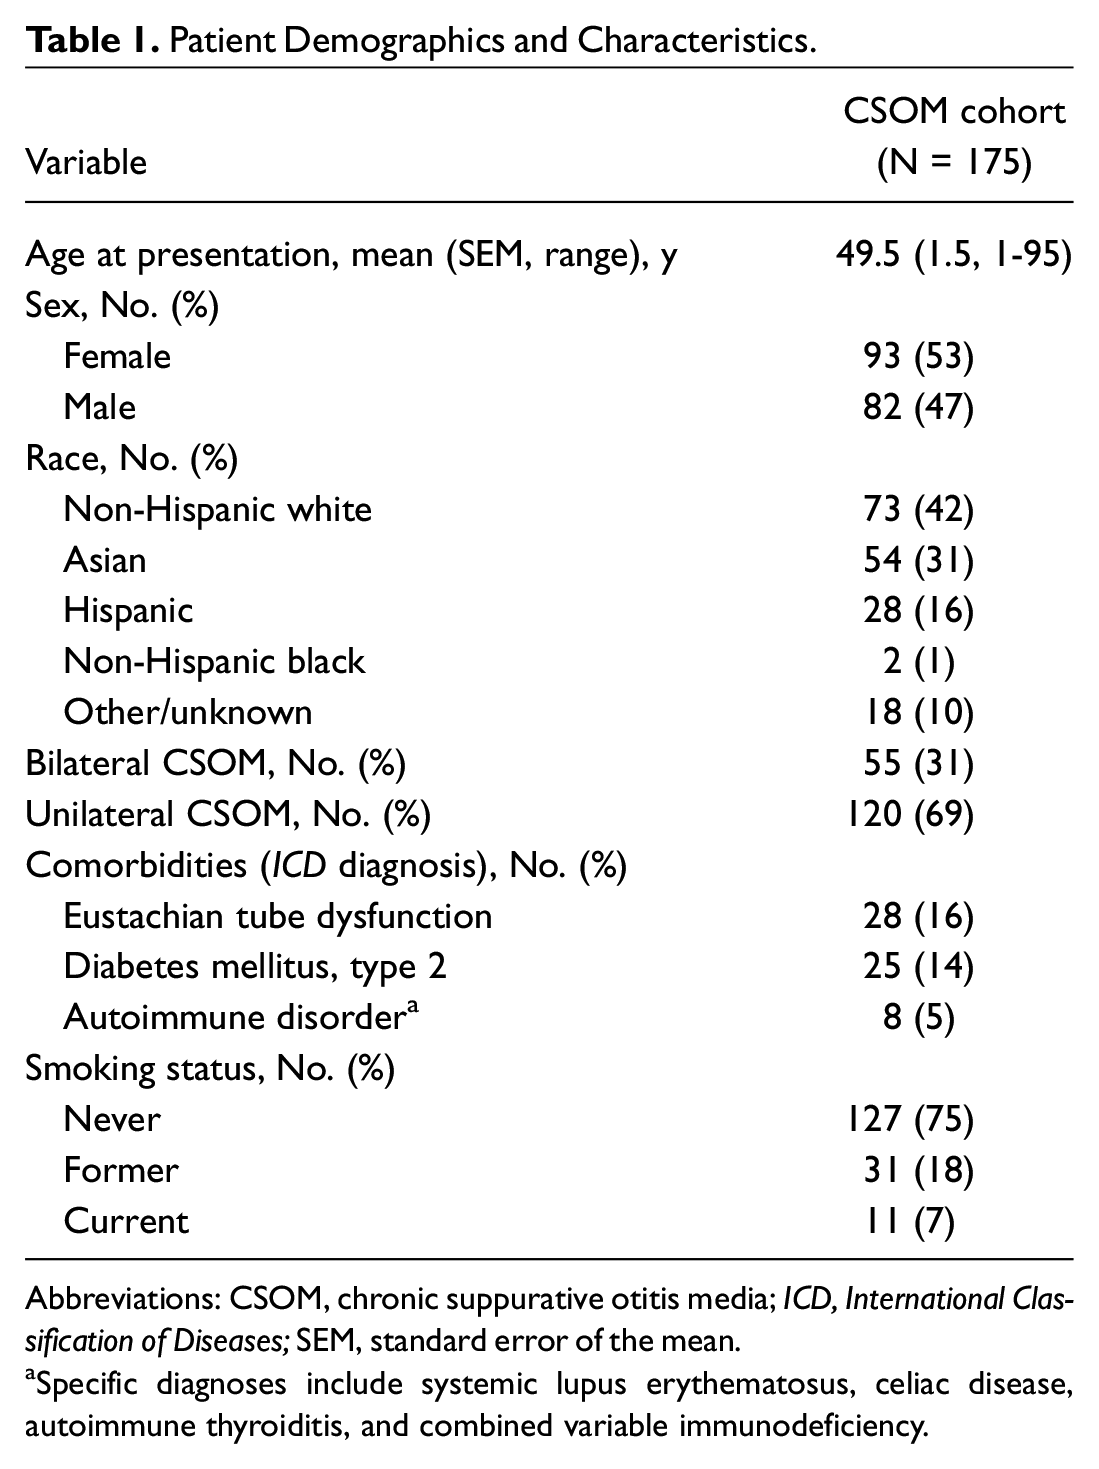
Abbreviations: CSOM, chronic suppurative otitis media; ICD, International Classification of Diseases; SEM, standard error of the mean.
Specific diagnoses include systemic lupus erythematosus, celiac disease, autoimmune thyroiditis, and combined variable immunodeficiency.
Health Utilization
Health utilization outcomes are summarized in Table 2 . Patients displayed a mean follow-up time of 3.5 ± 0.3 years and 9.5 ± 0.5 otology visits, with 35% of patients having more than 10 visits. Patients displayed an average of 2.1 ± 0.1 unique medications and 4.7 ± 0.4 prescriptions. Of note, most patients at our center are managed surgically upon presentation due to previously failing medical or surgical therapy at outside institutions. In a subset of 65 patients who underwent initial medical management ( Figure 2A ), each patient had an average of 2.6 ± 0.2 unique medications and 6.9 ± 1.0 prescriptions. Regarding surgical utilization, 43% had prior CSOM surgery at initial presentation. At the most recent visit, 83% of patients had received tympanoplasty or tympanomastoidectomy. Average per patient cost in US dollars (USD) estimated using CMS national reimbursement rates, CMS rates in our institution’s county, and private payer rates at our institution ranged from 3927 to 4411, 4704 to 5296, and 19,172 to 20,776 USD, respectively. Costs per CPT code and insurance type are displayed in Table 3 .
Health Utilization.
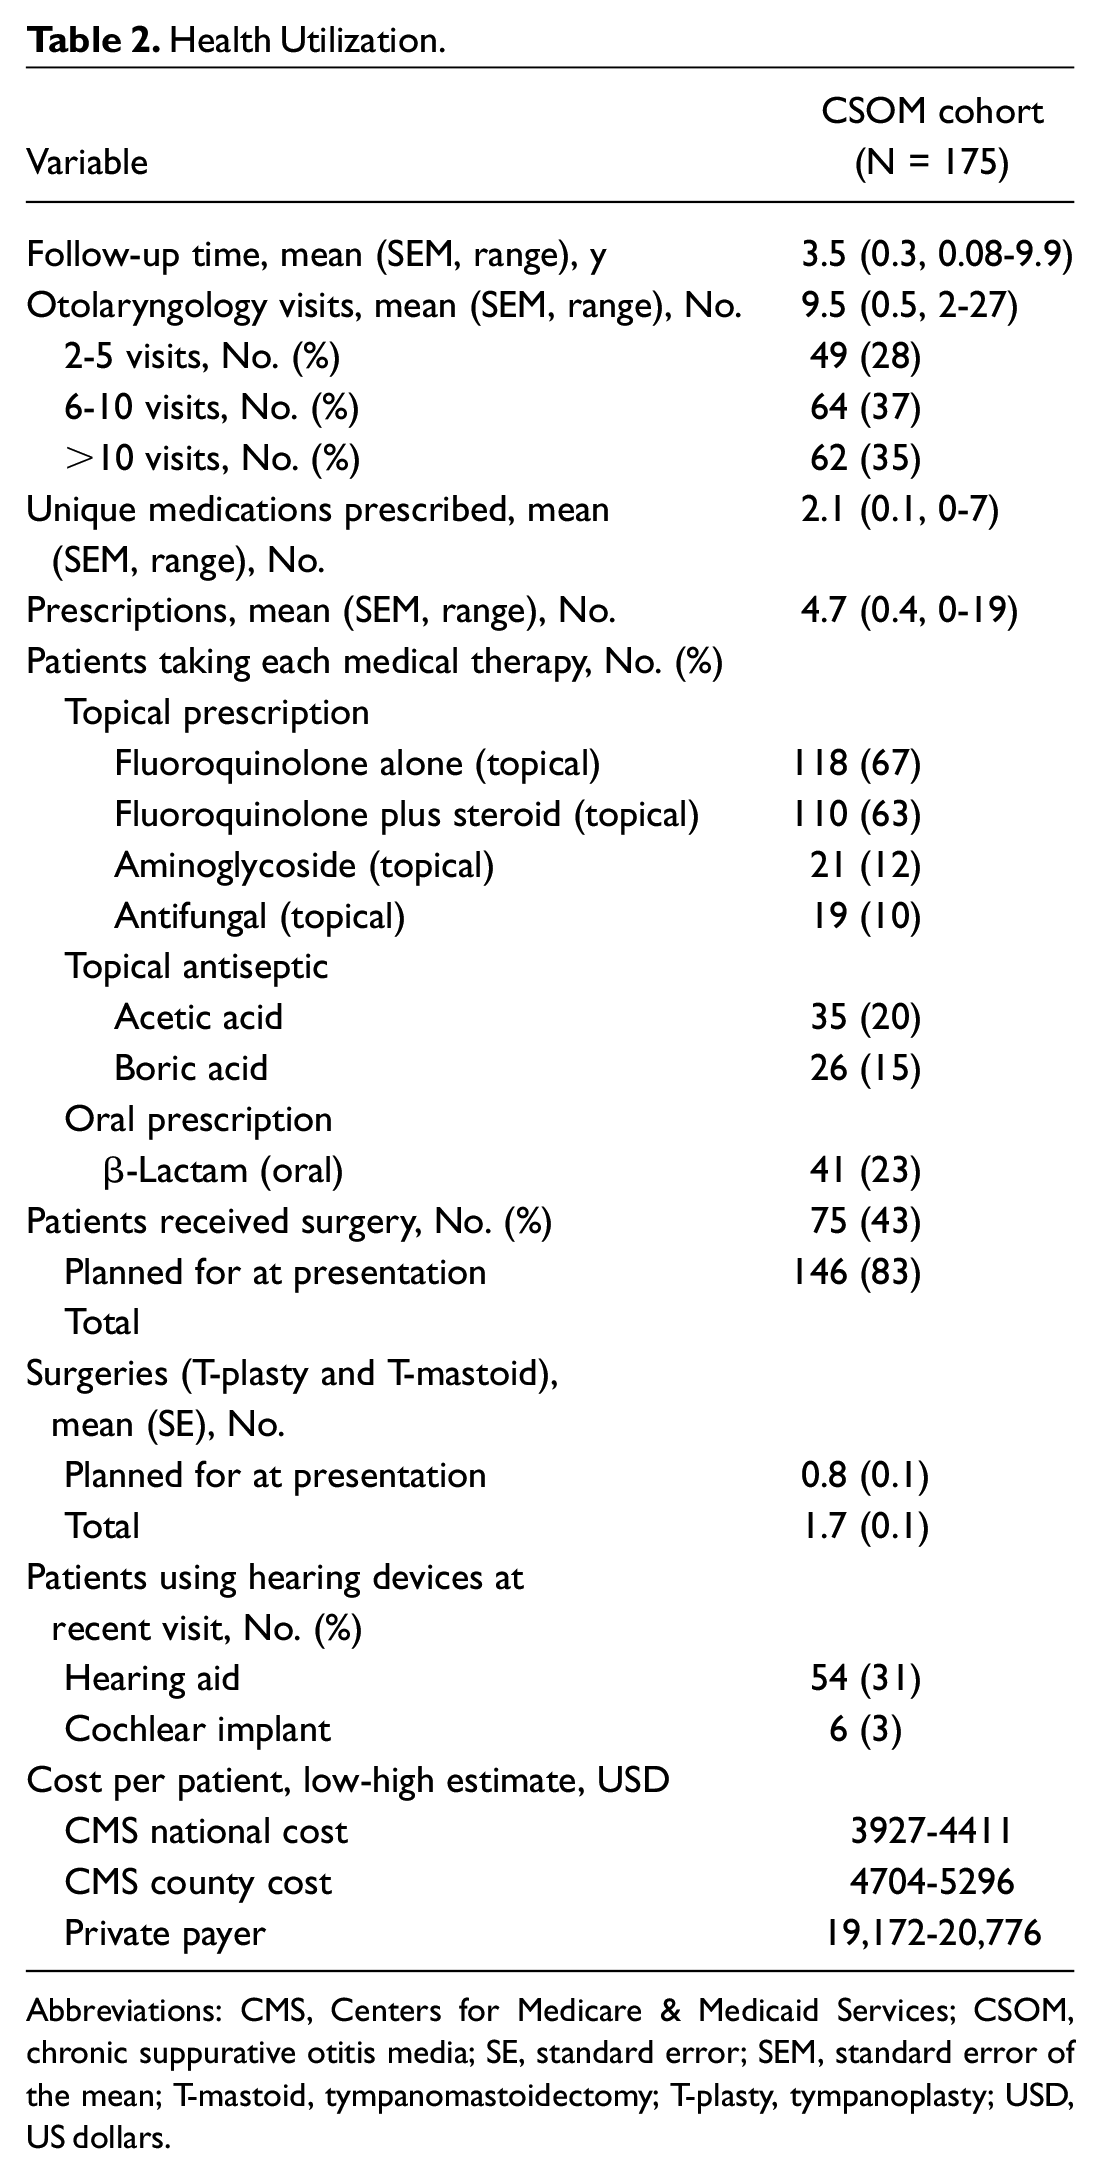
Abbreviations: CMS, Centers for Medicare & Medicaid Services; CSOM, chronic suppurative otitis media; SE, standard error; SEM, standard error of the mean; T-mastoid, tympanomastoidectomy; T-plasty, tympanoplasty; USD, US dollars.
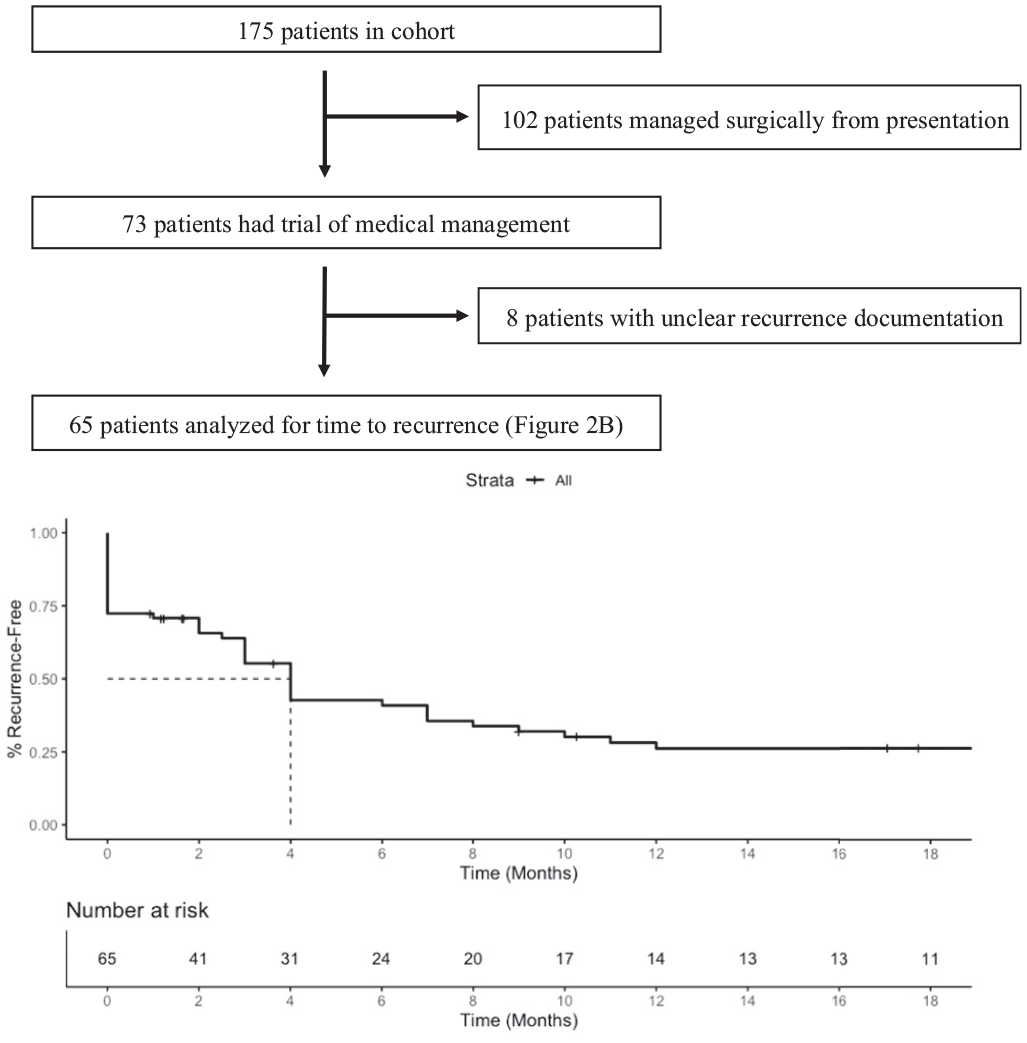
Medical management outcomes. (A) Patients who underwent surgical management from presentation or with unclear documentation were excluded. (B) The Kaplan-Meier plot representing the proportion of patients who were recurrence free over time is displayed.
Costs per CPT Code and Insurance Type in USD.
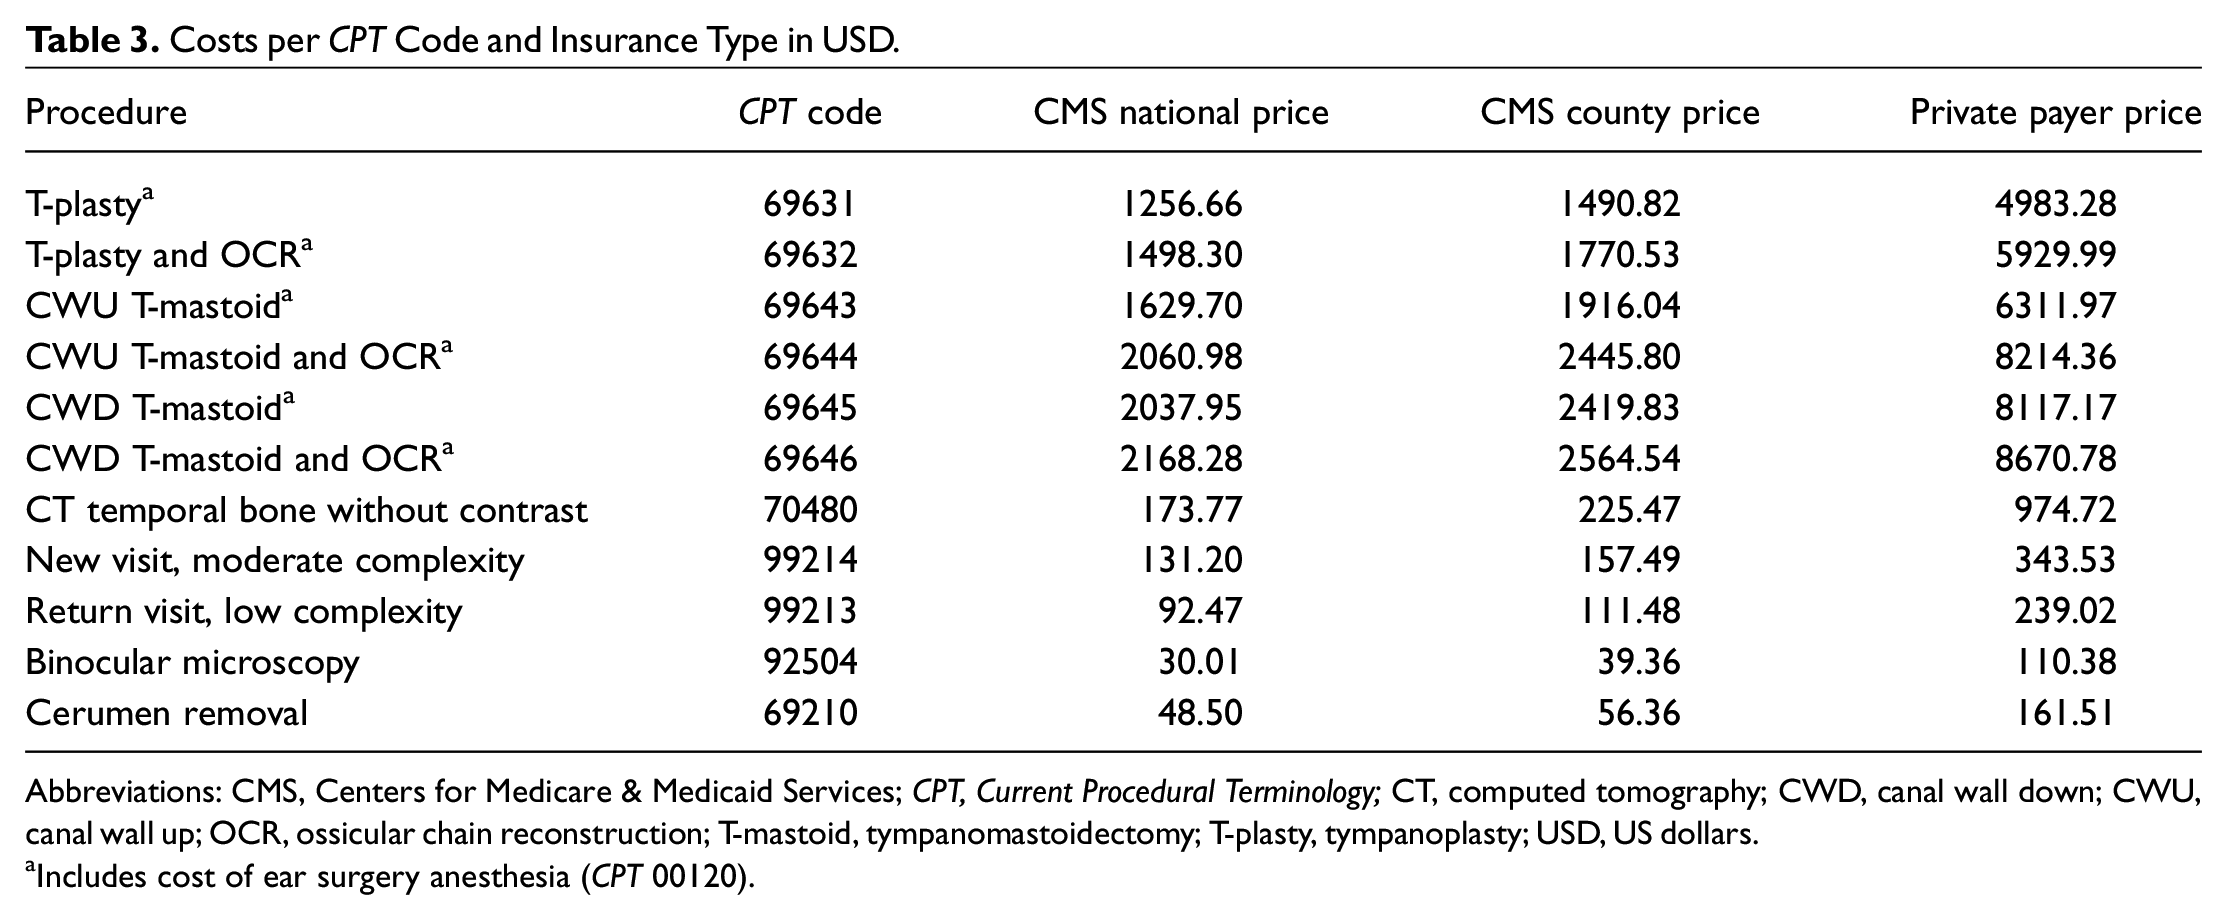
Abbreviations: CMS, Centers for Medicare & Medicaid Services; CPT, Current Procedural Terminology; CT, computed tomography; CWD, canal wall down; CWU, canal wall up; OCR, ossicular chain reconstruction; T-mastoid, tympanomastoidectomy; T-plasty, tympanoplasty; USD, US dollars.
Includes cost of ear surgery anesthesia (CPT 00120).
Medical Management Outcomes
In our cohort, 65 patients underwent initial medical therapy ( Figure 2A ). In this group, 45 patients (69%) had persistent active infection or converted to temporary inactivity followed by recurrence of active infection. Time to recurrence is displayed for all patients undergoing initial medical management ( Figure 2B ). The median time to recurrence was 4 months (95% CI, 3-8 months), with 41% and 27% of patients remaining recurrence free by 6 months and 1 year after initial treatment, respectively.
For patients undergoing medical treatment, otorrhea- and surgery-free status at the most recent visit was analyzed in the subset of 40 patients without prior CSOM surgery. Of these 40 patients, 33 had follow-up of at least 6 months and had the following status at their most recent visit: 18 (55%) required surgery, 5 (15%) had ongoing otorrhea, and 10 (30%) were otorrhea free. Of 24 patients with follow-up of at least 2 years, 15 (63%) required surgery, 4 (17%) had ongoing otorrhea, and 5 (21%) were otorrhea free at the most recent visit. Of 15 patients with follow-up of at least 5 years, 12 (80%) required surgery, 1 (7%) had ongoing otorrhea, and 2 (13%) were otorrhea free at the most recent visit.
On multivariable logistic regression, a positive smoking history (odds ratio [OR], 27.0; 95% CI, 3-745; P = .01) and longer follow-up time (OR, 1.03; 95% CI, 1.01-1.06; P = .02) were significantly associated with recurrence under medical management. Other factors, including age, sex, bilateral disease, comorbid diabetes, and prior surgery, were not associated with recurrence.
Surgical Management Outcomes
In our cohort, 146 patients underwent surgical management. Outcomes were reported for a subset of 86 patients with minimum postoperative follow-up of 6 months. Revision surgery was performed for 32 patients (36%) who received prior surgery at outside institutions. In the tympanoplasty group, 36 patients (78%) were recurrence free at the end of follow-up, compared to 13 patients (68%) undergoing tympanomastoidectomy (P = .38). The median time to recurrence was statistically similar between the 2 surgeries (tympanoplasty: 5 years, tympanomastoidectomy: 7 years, P = .73; Figure 3 ). At 3 years, the recurrence-free rate was 81% and 75% for tympanoplasty and tympanomastoidectomy, respectively.
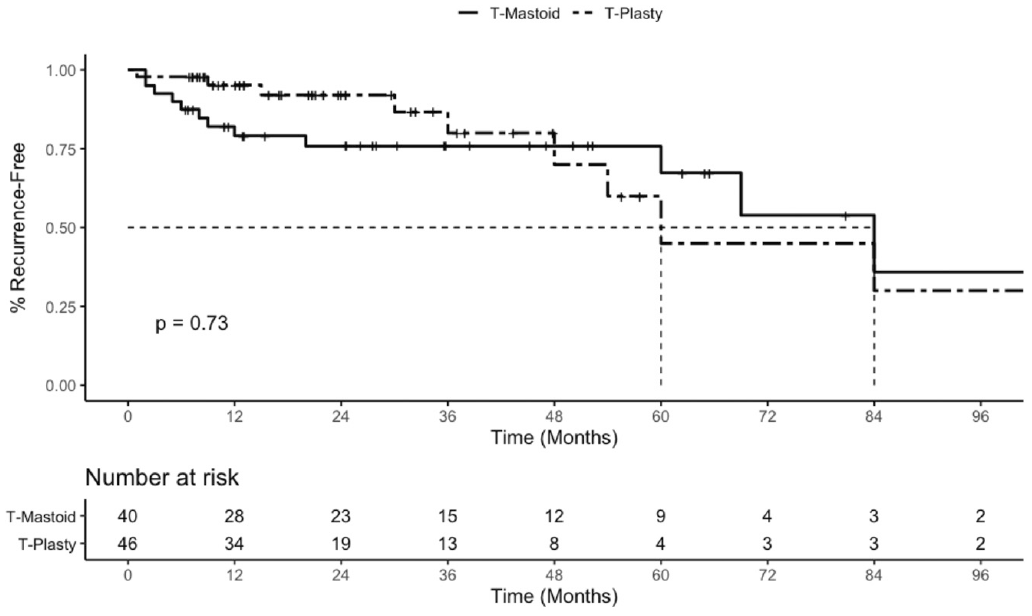
Surgical management outcomes. The Kaplan-Meier plot representing the proportion of patients who were recurrence free over time is displayed for tympanoplasty (T-plasty, dashed line) and tympanomastoidectomy (T-mastoid, solid line). Minimum follow-up time: 6 months.
On multivariable logistic regression, longer follow-up time (OR, 1.04; 95% CI, 1.02-1.07; P < .01) was significantly associated with recurrence under surgical management. Other factors, including age, sex, smoking history, bilateral disease, comorbid diabetes, surgical procedure and revision surgery, were not associated with recurrence under surgical therapy.
Hearing Loss Burden
On their most recent visit, patients with CSOM displayed an average air conduction PTA of 45.1 dB and bone conduction PTA of 26.5 dB, representing a moderate mixed hearing loss. Of all cohort patients, 61% displayed SNHL at their most recent visit, with 41% of all patients displaying moderate or severe to profound SNHL. Overall, 31% and 3% of patients currently use hearing aids and cochlear implants, respectively.
Air conduction PTA and WRSs are displayed for 64 patients with available pre- and posttreatment audiometric data ( Table 4 and Table 5 ). Although the mean air conduction PTA did not change compared to initial audiogram (preoperative: 50.2 ± 2.6, postoperative: 45.1 ± 2.9, P = .19), 64% of patients displayed an improvement in air conduction PTA, and 63% of patients displayed the same or improved WRSs. Mean bone conduction PTA also did not change compared to initial audiogram (preoperative: 24.4 ± 2.1, postoperative: 26.5 ± 2.6, P = .53), with 86% of patients displaying less than 10-dB elevation in bone conduction compared to initial audiogram.
Pretreatment Hearing Results in Patients With CSOM.
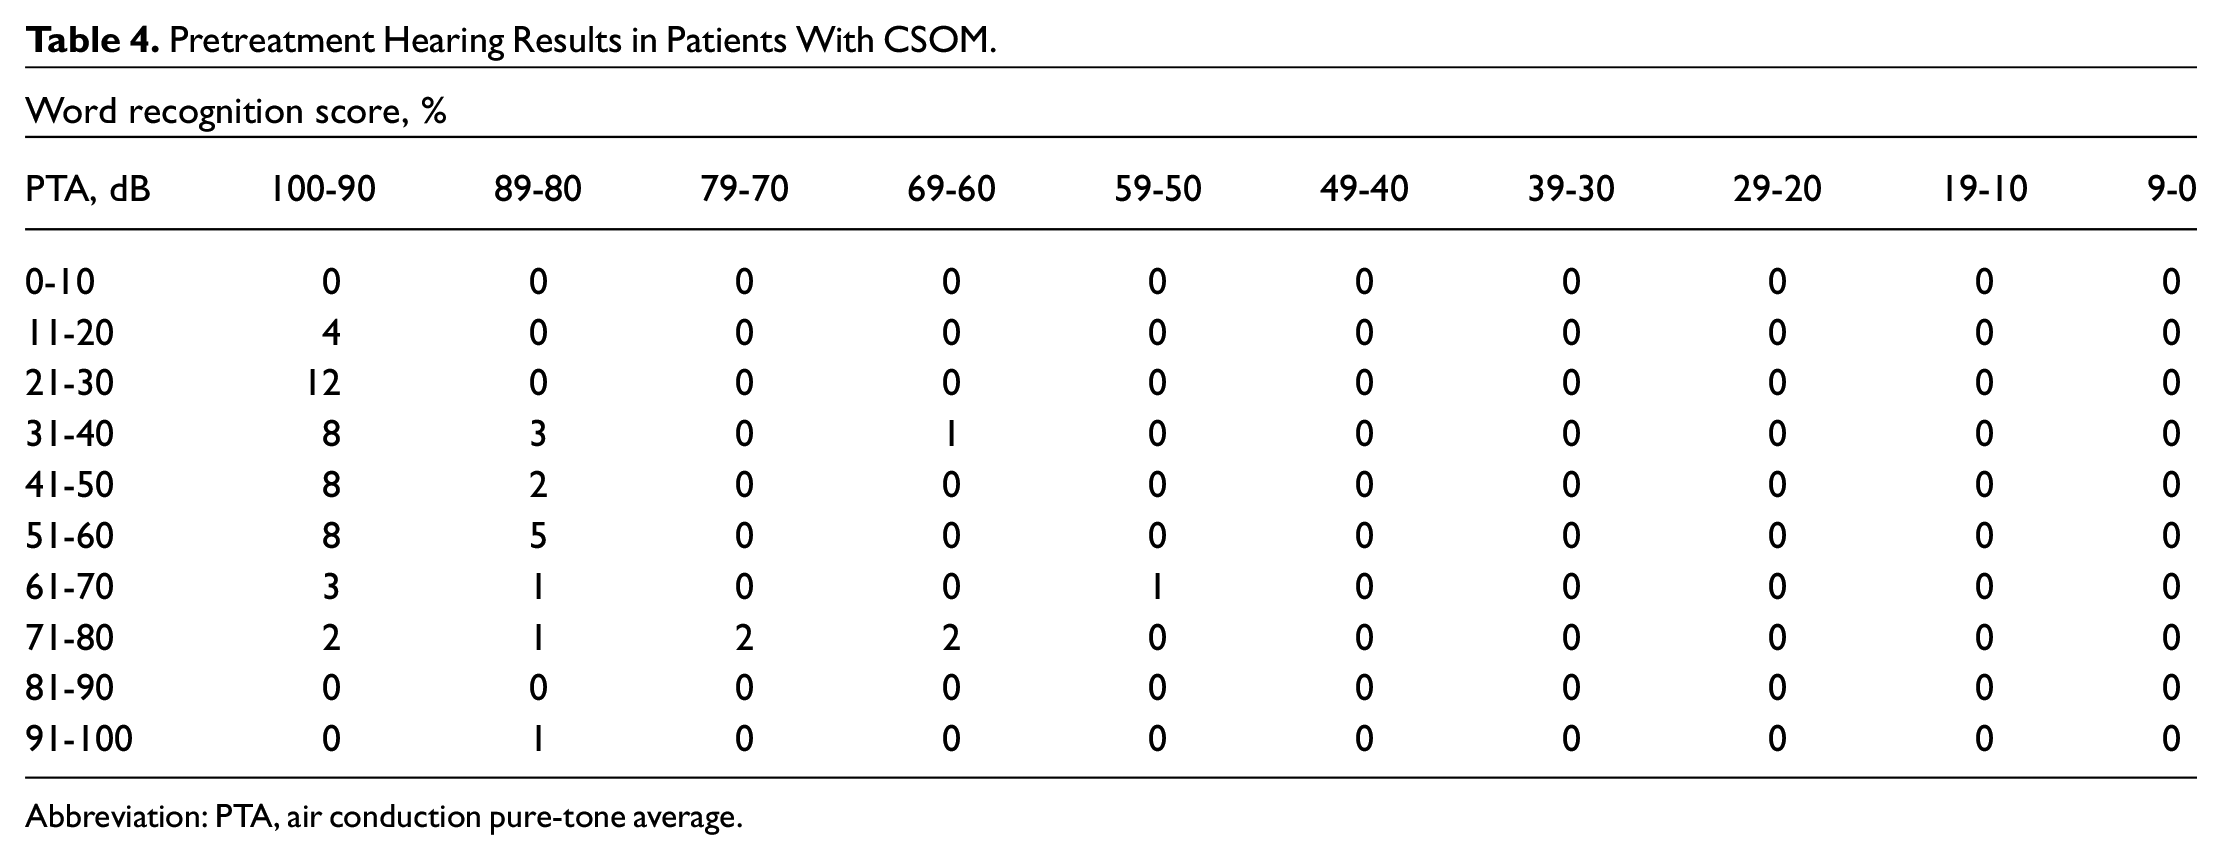
Abbreviation: PTA, air conduction pure-tone average.
Posttreatment Change in Hearing Levels.
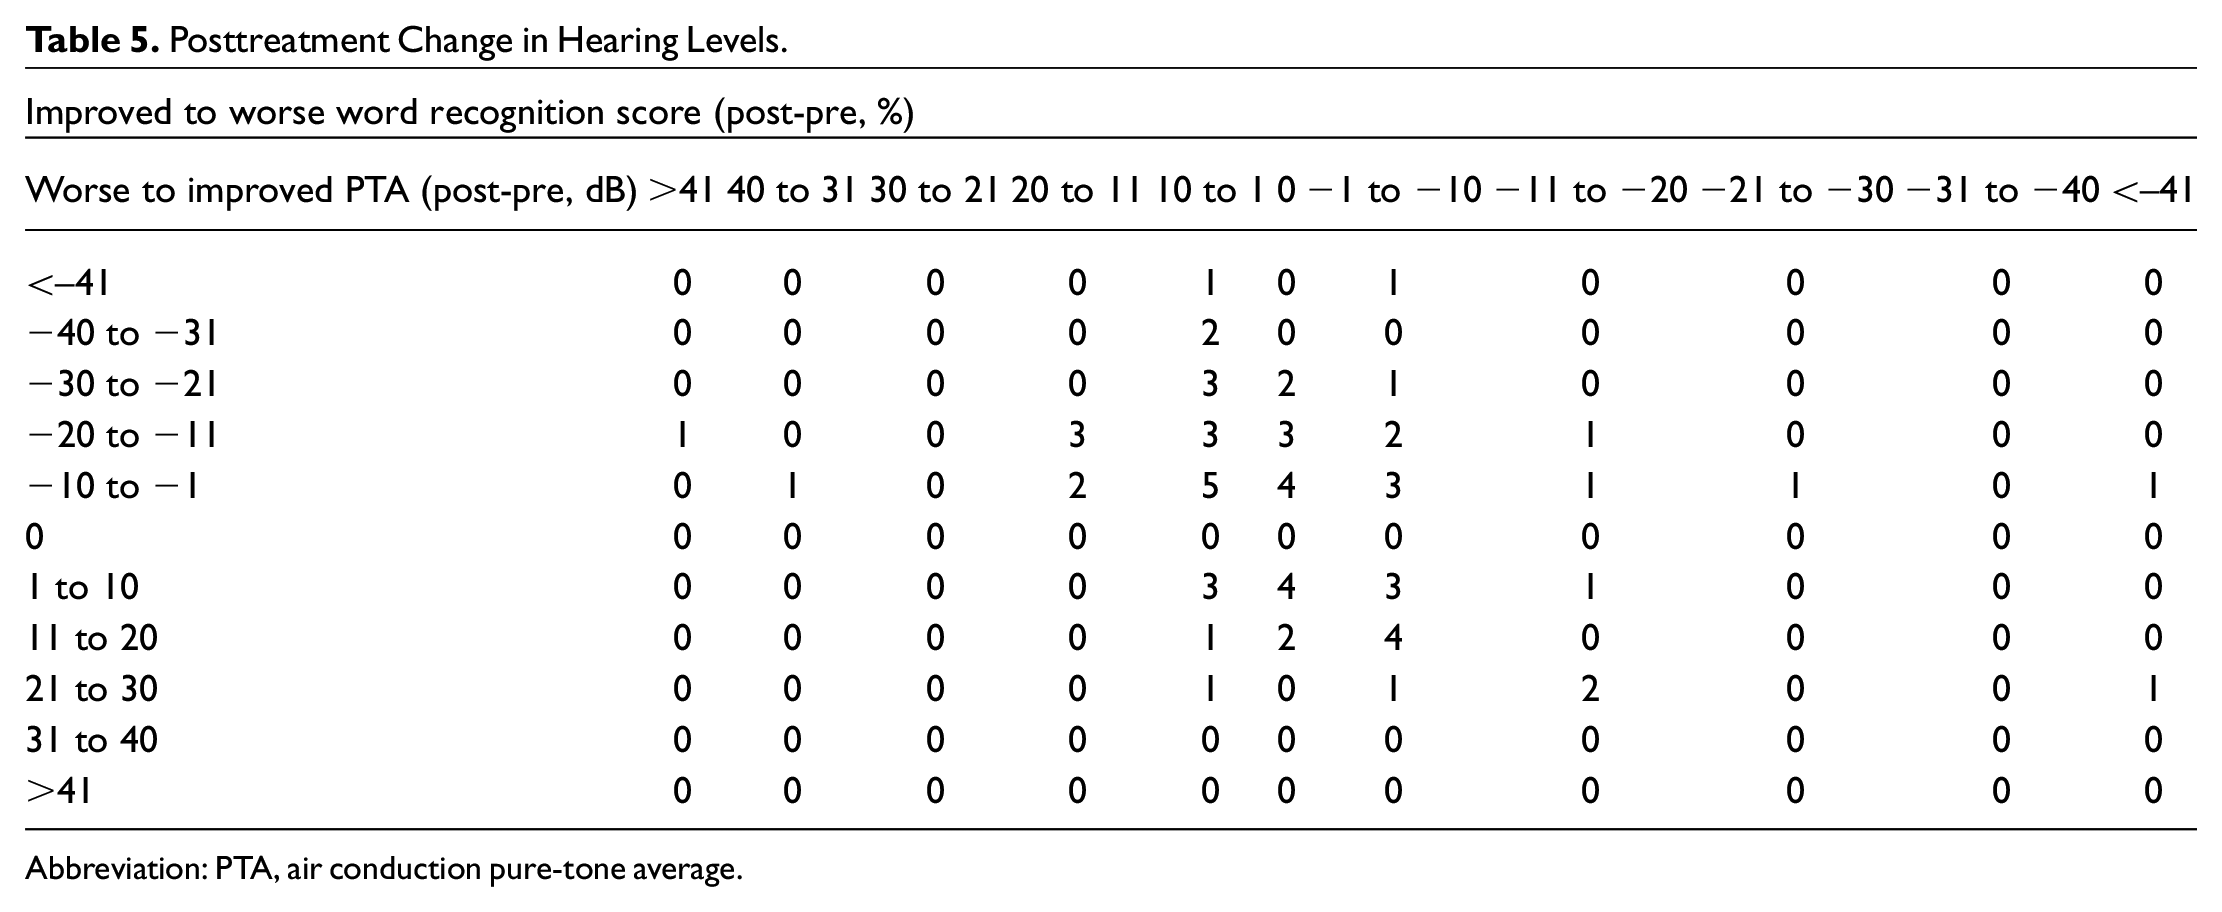
Abbreviation: PTA, air conduction pure-tone average.
Discussion
In this study, we analyzed health utilization patterns and medical and surgical outcomes in an academic otology center to understand the economic impact of CSOM and effectiveness of current treatments.
We demonstrate that patients with CSOM have high health care utilization and costs. Patients require an average of 10 otology visits, 5 prescriptions, and 2 surgeries, with costs ranging up to 20,776 USD per patient. Given a mean follow-up of 3.5 years, annualized costs range from 5478 to 5936 USD per patient. Extrapolating these costs across the US population gives a clearer picture of CSOM’s financial burden. CSOM prevalence in the United States is not available; assuming a 0.6% prevalence based on the low range of prevalence observed in other developed countries such as the United Kingdom, 2 CSOM annual population costs would total 2.1 to 11.4 billion USD. These costs are likely underestimated, as our estimates lack several sources of cost. These include medications purchased over the counter or applied during visits (eg, topical antiseptics or antibiotics); surgery-related supplies (eg, prostheses), operating room booking charges, and inpatient admission; and hearing loss–related expenses from hearing aids and cochlear implants. Moreover, nearly half of patients with CSOM at our tertiary center already received surgery at presentation and likely underwent extensive treatment elsewhere. Outside costs were estimated at the high boundary of our cost data, but these estimates did not include costs of medications and all outpatient visits related to CSOM at outside institutions (including visits to primary care physicians and community otolaryngologists), as these data were unavailable. Future studies should comprehensively document costs throughout the health care system and combine these costs with epidemiological data to estimate total CSOM costs.
Regarding medical management, only 31% of patients remained recurrence free on their most recent follow-up. In contrast, clinical trials of topical fluoroquinolones reported success rates up to 93%,10-15 likely due to short follow-up times (usually less than 1 month).10,11 Given a median of 4 months to recurrence in our study, most relapses would be missed in these trials. However, it remains possible that infection may clear after several episodes of recurrence. To address this possibility, we analyzed CSOM status at the most recent visit for surgery-naive patients undergoing medical management. Of those with minimum follow-up of 6 months, 2 years, and 5 years, 30%, 21%, and 13%, respectively, were otorrhea and surgery free at the most recent visit. Although drawn from small numbers of patients, these results suggest that most patients do not reach disease resolution on medical therapy alone. Moreover, patients who were otorrhea free at the most recent visit had episodes of otorrhea at earlier visits and may develop recurrent otorrhea at future visits, suggesting even poorer results. Topical fluoroquinolones effectively convert active disease to inactive but, by mechanism, do not address persister cells, which are the key drivers of CSOM recurrence.42-44 However, these findings are limited by possible selection bias, as patients at a tertiary center likely represent the more severe spectrum of disease. We aimed to account for this by not setting a minimum follow-up time for medical outcomes and analyzing if prior surgery influenced outcomes. We also compared surgical outcomes with previous reports and found consistent findings at similar lengths of follow-up. Conversely, our study may underestimate the recurrence rate, as we defined recurrence as a tympanic perforation with otorrhea. We recognize that some reports include dry perforations and other conditions of the TM, such as myringitis requiring treatment, as potential recurrence. Pending further validation, we recommend minimum follow-up of 1 year for medically treated patients with CSOM, given the potential for short-term relapse. Similarly, studies reporting CSOM medical outcomes should include appropriate follow-up time to capture recurrence.
Compared to medical therapy, surgical management results in higher rates of CSOM resolution and recurrence-free time. The overall recurrence-free rate was 78% and 68% for tympanoplasty and tympanomastoidectomy, respectively, consistent with previous reports ( Table 6 ).16-31 The recurrence-free rate was similar between the 2 procedures, consistent with previous literature. Our study accounts for differing follow-up times via a Kaplan-Meier analysis, showing similar median time of recurrence between tympanoplasty (5 years) and tympanomastoidectomy (7 years, P = .73). Our recurrence rates are comparable to the literature at up to 3 years of follow-up. Beyond that time point, lower success rates may relate to longer follow-up and a high percentage of revision surgeries, which were excluded or not reported in most studies. However, few patients in our cohort displayed follow-up greater than 5 years, limiting interpretation of the median time to recurrence. Furthermore, this retrospective study cannot account for factors influencing the decision to pursue tympanoplasty or tympanomastoidectomy. Prior studies question the need for mastoidectomy in addition to tympanoplasty for short-term outcomes.28,30,31,45 At our institution, this decision is a multifactorial individualized choice made by each surgeon for each patient, which takes into account factors such as disease burden. Pending validation, these data suggest that surgery should play an earlier role in CSOM management for the following reasons: surgery leads to longer recurrence-free time compared to medical therapy, patients are at increased risk of permanent hearing loss with increased duration of otorrhea,32-36 and most patients with CSOM eventually require surgical management. Nevertheless, long-term surgical recurrence-free rates remain low, underscoring the need for novel therapies.
Comparison of Surgical Outcomes.
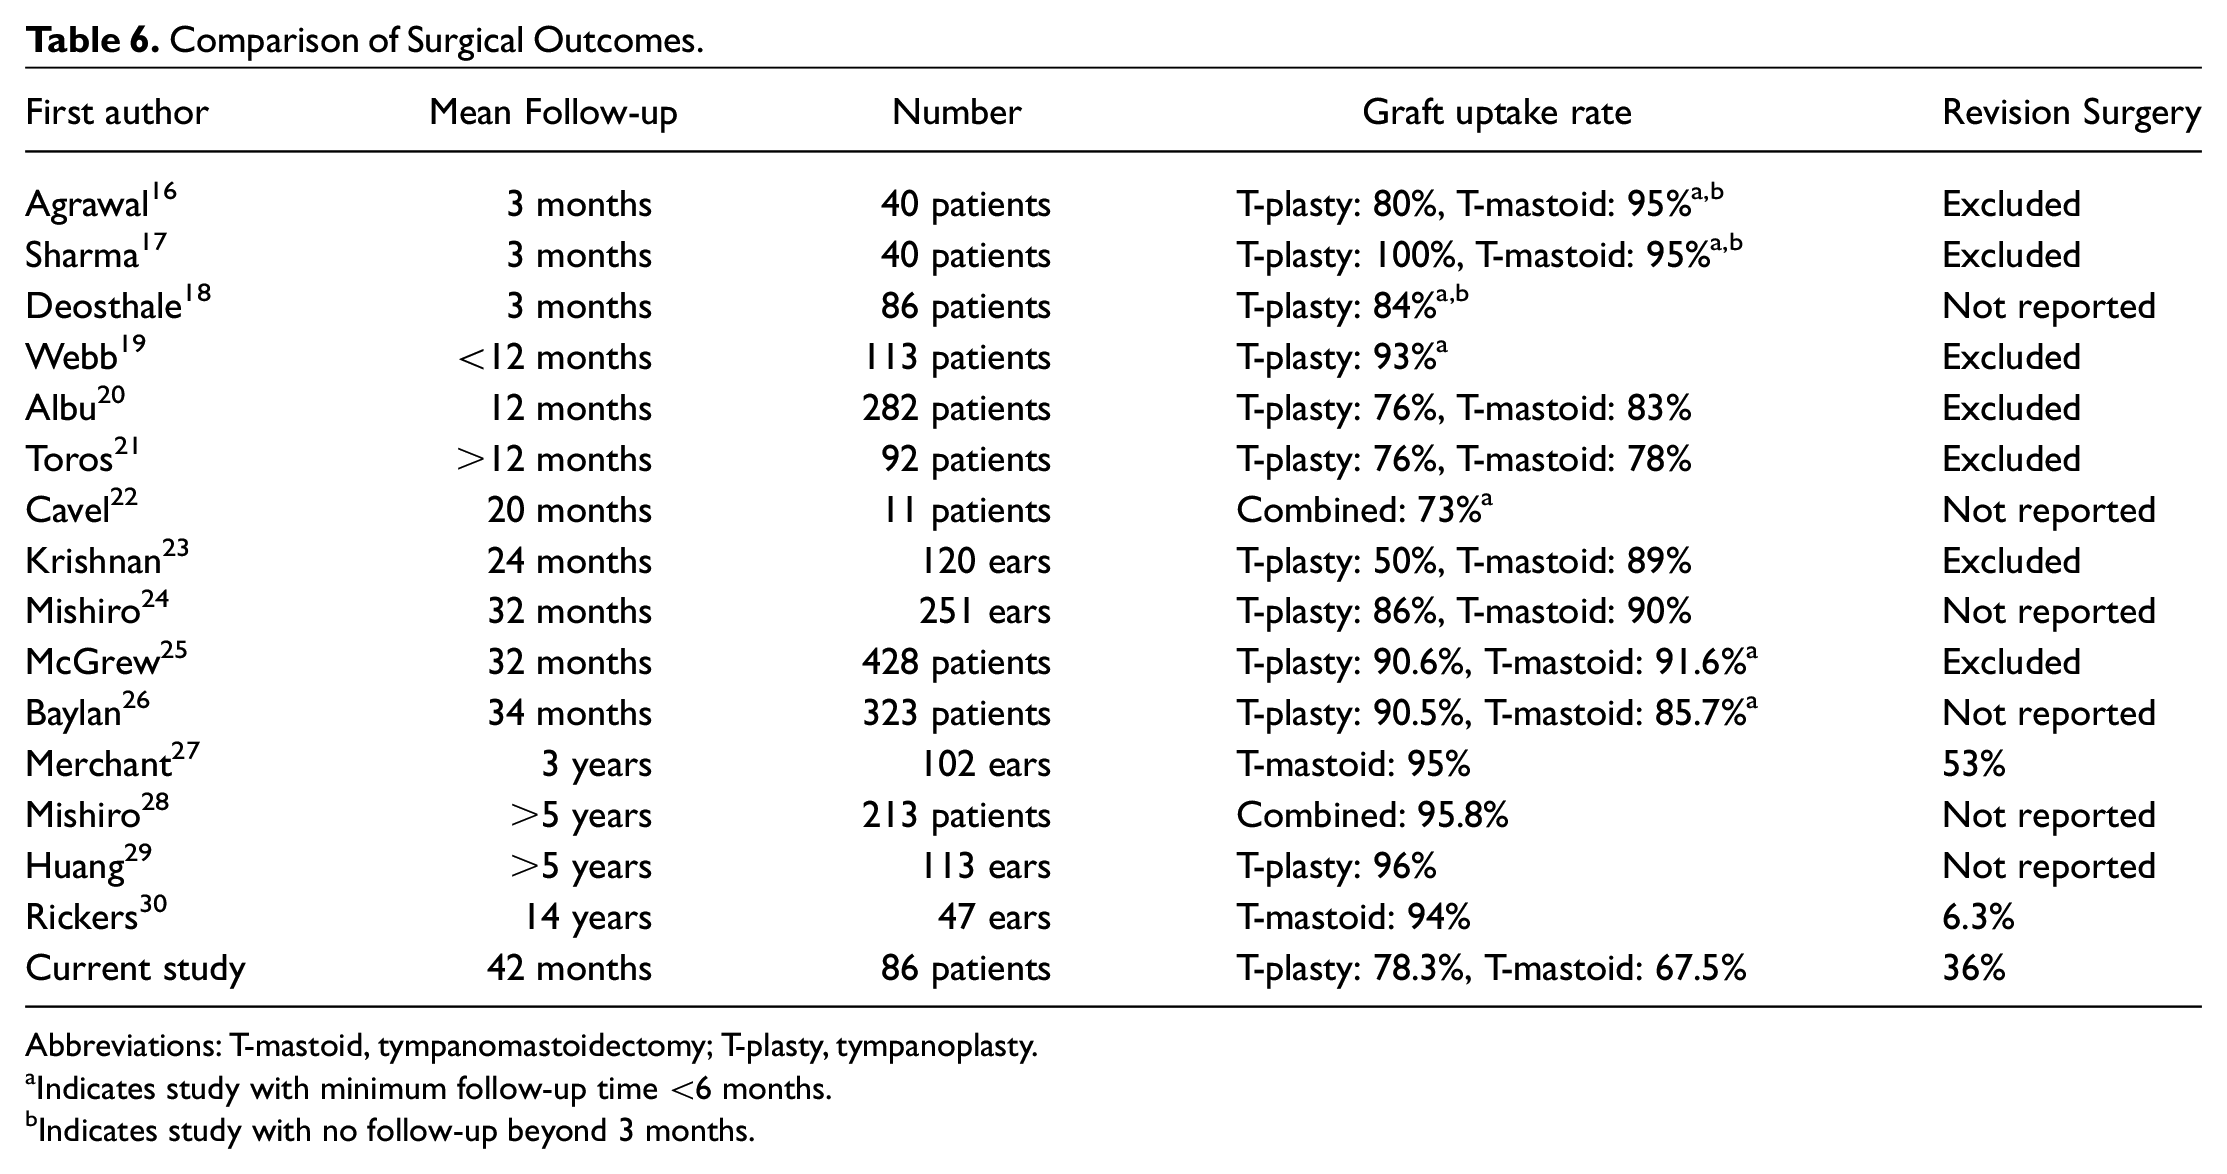
Abbreviations: T-mastoid, tympanomastoidectomy; T-plasty, tympanoplasty.
Indicates study with minimum follow-up time <6 months.
Indicates study with no follow-up beyond 3 months.
Last, audiometric data underscore the high hearing loss burden in CSOM. Regarding CHL, surgery did not improve mean air conduction PTA, in contrast to previous studies.20,21,31 The large percentage of revision surgery in our cohort may contribute to these discordant results and reflect severe underlying disease. Alternatively, most patients displayed improvement in air conduction PTA, suggesting that the mean change in PTA may be affected by a minority of patients who worsened. Importantly, 61% of our cohort displayed SNHL, consistent with previous studies underscoring the high burden of SNHL in CSOM.32,33 We cannot rule out contributions of presbycusis and CSOM treatment itself on SNHL. However, pre- and posttreatment bone conduction PTAs were similar for most patients (<10-dB elevation for 86% of patients), suggesting that CSOM treatment does not cause SNHL. Similarly, 41% of our cohort displayed moderate or severe to profound SNHL, which is unlikely to be explained by presbycusis alone. Hearing loss of this severity is associated with numerous poor outcomes, including cognitive deficits and hospitalizations.46-49 Further studies should evaluate if any interventions can ameliorate this deficit.
This study is limited by several factors. Most patients at our tertiary center were managed surgically at presentation due to previously failed medical therapy. Therefore, medical outcomes were reported in a small subset of patients. Larger studies of patients undergoing medical management are needed to understand how many trials of medical therapy should be attempted before proceeding to surgery. Population cost estimates were also limited by lack of epidemiological data and utilization metrics at outside institutions.
Conclusion
CSOM constitutes a major US public health issue with high health care utilization and costs. Surgical management increases resolution rates and delays recurrence compared to medical therapy but still results in a sizable number of late recurrences. These data suggest that, while surgery should play an earlier role in CSOM management, novel therapies are needed to reduce CSOM-related disease recurrence.
Footnotes
Author Contributions
Disclosures
Study Approval
Stanford University Institutional Review Board- Protocol 56466