
Abstract
During the COVID-19 pandemic, the utility of portable audiometry became more apparent as elective procedures were deferred in an effort to limit exposure to health care providers. Herein, we retrospectively evaluated mobile-based audiometry in the emergency department and outpatient otology and audiology clinics. Air conduction thresholds with mobile audiometry were within 5 dB in 66% of tests (95% CI, 62.8%-69.09%) and within 10 dB in 84% of tests (95% CI, 81.4%-86.2%) as compared with conventional audiometry. No significant differences were noted between mobile-based and conventional audiometry at any frequencies, except 8 kHz (P < .05). The sensitivity and specificity for screening for hearing loss were 94.3% (95% CI, 91.9%-96.83%) and 92.3% (95% CI, 90.1%-94.4%), respectively. While automated threshold audiometry does not replace conventional audiometry, mobile audiometry is a promising screening tool when conventional audiometry is not available.
The conventional audiogram is the gold standard for the diagnosis of hearing loss, but access is limited by geographic, economic, and logistic constraints. 1 Mobile audiometry may be a useful adjunct when access to a standard audiogram is limited. 2 Several applications of mobile audiometry have been scientifically validated and found to be reliable for identifying hearing loss.3,4 Prior studies have validated the use of mobile audiometry as a screening tool for otologic emergencies, such as sudden sensorineural hearing loss.5,6 Mobile audiometry is purported to increase access to hearing services by improving testing capacity and efficiency. 7
The global COVID-19 pandemic led to widespread changes in the practice patterns of otolaryngologists, who reduced their capacity for outpatient care.8,9 When conventional audiometry is not available, an alternative can be a portable system, such as mobile-based audiometry, to rapidly screen patients with hearing loss. Herein, we evaluate the implementation of this device in the emergency department (ED) and outpatient clinic during the COVID-19 pandemic.
Methods
In this retrospective cohort study, we evaluated the implementation of mobile audiometry from March to June 2020 in patients with potential hearing loss. The protocol received approval from the Mass General Brigham Institutional Review Board (2020P002903). Self-administered mobile-based audiometry included a tablet (iPad; Apple Inc) equipped with an audiometry application (Shoebox Ltd) that performs hearing thresholds testing with a modified Hughson-Westlake protocol, 10 providing the option for air (standard software) or bone (professional software) conduction. If a patient had hearing loss (>25 dB) at any frequency, a conventional audiometry was done. Air conduction thresholds (ACTs) for 0.25, 0.5, 1, 2, 4, and 8 kHz were compared between mobile and conventional audiometry. Paired t tests were used to calculate the difference between mean ACT for each frequency in mobile and conventional audiometry. An alpha level of 0.05 was used to determine statistical significance.
Results
A total of 172 adults (mean age, 46 years) who presented to the ED and outpatient otology clinics with subjective hearing loss underwent mobile audiometry between March and June 2020. An overall 340 mobile audiograms were completed, and 247 (72%) noted normal hearing with pure tone average levels <25 dB. In the following days, 72 patients (42%) underwent a conventional audiogram in a sound-treated booth.
The most common diagnoses were tinnitus (31.7%), followed by sudden hearing loss (24%) and eustachian tube dysfunction (12.3%). Four patients (2.3%) reported a history of COVID-19. Comparison of the threshold values obtained from all patients by each frequency for the mobile and conventional audiometry ( Table 1 ) showed no differences in mean ACT >10 dB for all the frequencies tested except 8 kHz (P < .05). The mean pure tone average difference between the mobile and formal audiogram was 1.72 dB (P > .007).
Mean Difference in Air Conduction Thresholds at Each Frequency and Pure Tone Average From All Patients in Mobile vs Conventional Audiometry (N = 166).
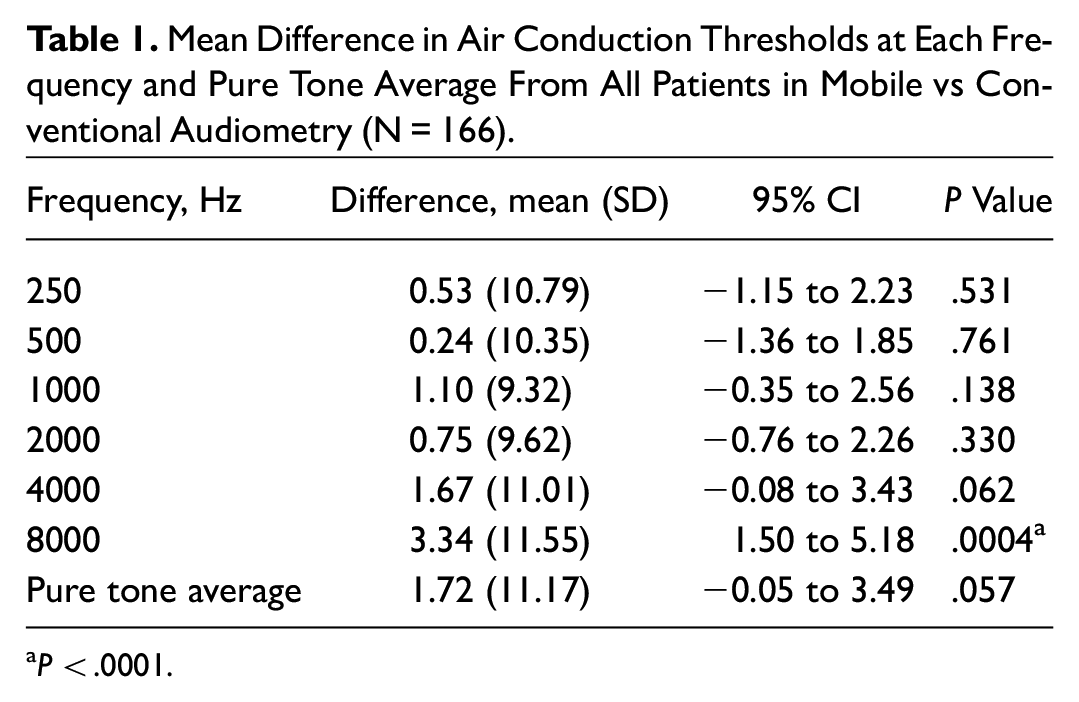
P < .0001.
In a subgroup analysis, patients without conductive hearing loss demonstrated no differences for all frequencies tested (P > .05). Mobile audiograms were within 5 dB of those determined by conventional audiometry for 66% thresholds (95% CI, 62.8%-69.09%) and 10 dB for 84% (95% CI, 81.4%-86.2%). Bland-Altman plots were developed for each frequency tested, showing no proportional bias present ( Figure 1 ). Mobile audiometry provided a sensitivity of 94.3% (95% CI, 91.9%-96.83%) and a specificity of 92.3% (95% CI, 90.1%-94.4%; Table 2 ) for diagnosing hearing loss.
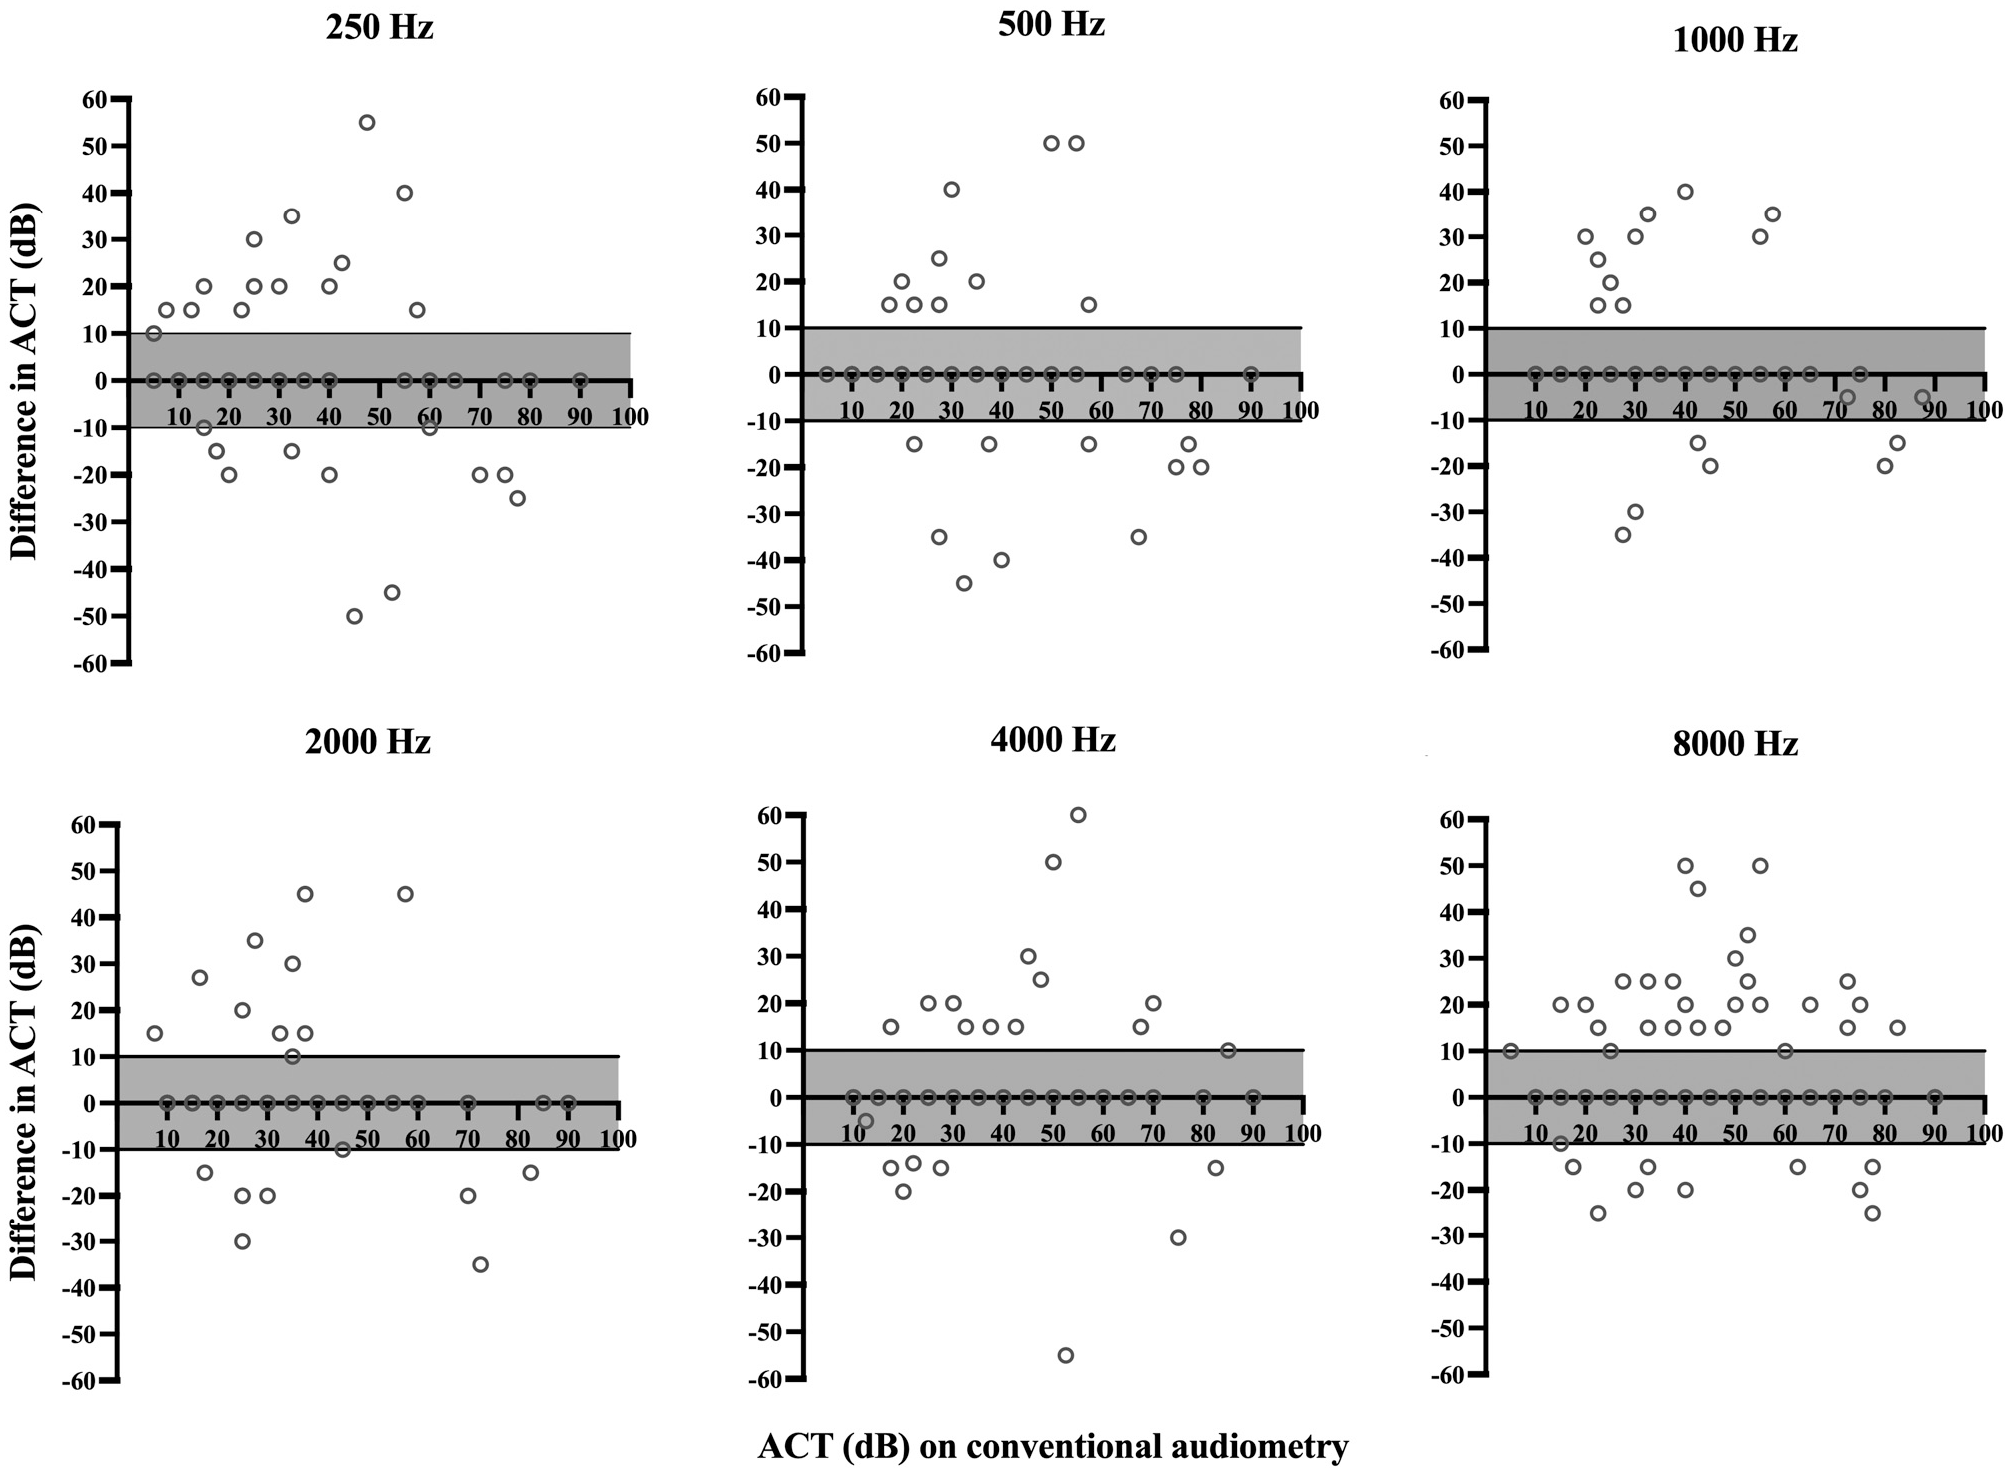
Difference in ACT between mobile and conventional audiometry as compared with conventional audiometry ACTs for (A-F) 250, 500, 1000, 2000, 4000, and 8000 Hz. ACT, air conduction threshold.
Accuracy of Mobile Audiometry in Screening for Hearing Loss (>25 dB HL) by Comparing Each Hearing Threshold Tested With Conventional Audiometry. a
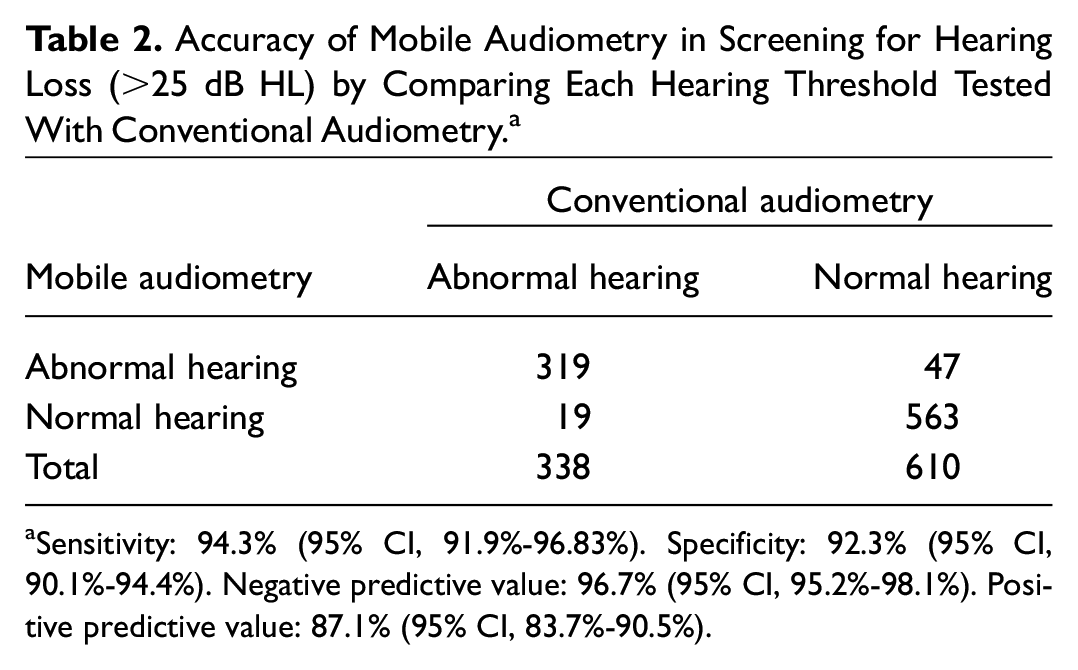
Sensitivity: 94.3% (95% CI, 91.9%-96.83%). Specificity: 92.3% (95% CI, 90.1%-94.4%). Negative predictive value: 96.7% (95% CI, 95.2%-98.1%). Positive predictive value: 87.1% (95% CI, 83.7%-90.5%).
Discussion
Mobile audiometry has a clear role in the management of otologic emergencies. During the initial outbreak of the COVID-19 pandemic, use of mobile audiometry in our institution led to efficient and appropriate triage of patients with hearing loss. This screening strategy helped decrease the need for unnecessary exposure of health care workers during the pandemic. There was no significant difference for any frequency in the range from 250 to 8000 Hz between mobile and conventional audiometry in patients with nonconductive forms of hearing loss. As the mobile audiometer used in this study had the standard software for testing air conduction, patients with suspected conductive hearing loss were assessed with a tuning fork test and appropriate bone masking technology.
Prior studies have noted that portable audiometry typically has the greatest accuracy in the midfrequency range (500-6000 Hz), with greater variability noted at the 2 extremes (250 and 8000 Hz). 11 Similarly, in our study we found greater variability of thresholds in the highest frequency (8000 Hz). This difference could be explained by background noise and higher testing variability in diverse noisy environments (eg, ED and outpatient clinic).12,13 Active noise reduction strategies could be implemented with circumaural muffs and insert headphones to limit the inadvertent effects of noise, particularly when testing at high-frequency thresholds. 14
The accuracy of mobile audiometry is variable, with prior studies demonstrating a sensitivity of 88.9% to 93.3% and a specificity of 81.5% to 94.5% for diagnosing hearing loss.15,16 The findings from this study suggest that mobile audiometry is an accurate hearing screening test with similar sensitivity (94.3%) and specificity (92.3%). The main limitations are the highly heterogenous population, the retrospective nature of the study, and the user error–related variability. Although attempts were made to administer the test in a quiet environment, background noise and the type of hearing loss may have influenced performance.
Conclusions
Mobile audiometry is useful in the hospital setting as it allows for rapid screening of hearing loss. It can correctly estimate pure tone thresholds at most frequencies tested as compared with the conventional audiogram. Future prospective studies are needed to further validate mobile audiometry devices in the ED and outpatient clinic settings.
Footnotes
Author Note
Alejandro Garcia, Divya A. Chari, Konstantina M. Stankovic, Daniel J. Lee, Elliott D. Kozin is now affiliated to Department of Otolaryngology, Harvard Medical School, Boston, Massachusetts, USA.