
Abstract
Objective
To perform a systematic review of proposed sinus computed tomography (CT) scoring systems and determine their association with patient-reported outcome measures (PROMs).
Data Sources
PubMed, CINAHL, Scopus, and Cochrane Library.
Review Methods
A systematic search was conducted following the PRISMA guidelines (Preferred Reporting Items for Systematic Reviews and Meta-analyses) for studies describing CT scores and PROMs in patients with chronic rhinosinusitis.
Results
A total of 144 studies were included. Out of 20,741 patients, 53.6% were male and 55.5% had nasal polyposis. A meta-analysis of correlations revealed a moderate correlation between Lund-McKay (LM) and the 22-item Sinonasal Outcome Test (SNOT-22; r = 0.434, P < .001) and a weaker correlation between LM and the 20-item Sinonasal Outcome Test (SNOT-20; r = 0.257, P = .039). Meta-regression also revealed a weak association between LM and SNOT-20 (n = 25 studies) but no significant associations between Zinreich score and SNOT-22 or LM scores and PROMs, including SNOT-22 (n = 94 studies), Rhinosinusitis Disability Index (n = 25), nasal obstruction visual analog scale (n = 15), Chronic Sinusitis Survey (n = 12), Total Nasal Symptom Score (n = 4), Total Symptom Score (n = 3), and 12-Item Short Form Health Survey (n = 3).
Conclusion
There is essentially little association between radiologic grade and PROMs. CT grading systems with improved clinical utility are needed.
Keywords
Chronic rhinosinusitis (CRS) presents with symptoms of olfactory dysfunction, rhinorrhea, nasal obstruction, and facial pain. 1 Diagnosis also requires objective evidence of disease, typically with a nasal endoscopic examination or radiologic imaging showing inflammation. Computed tomography (CT) of the sinuses is usually the preferred modality. Besides diagnosis, CT is useful for monitoring disease and treatment response. There are multiple CT scoring methods available, such as radiographic grading scales, maximum mucosal thickness, 3-dimensional volumetric analysis, minimum cross-sectional area, and percentage opacification. The most widely used method for radiographic grading of CRS is the Lund-Mackay (LM) score, which has demonstrated high interobserver reliability. 2
Meanwhile, subjective patient-reported outcome measures (PROMs) help to contextualize the functional impact of disease and the outcome of treatment on symptoms and quality of life. PROMs are any instruments that measure outcomes reported directly by patients without interpretation or influence by an external source or clinician. Common PROMs include the 22-item Sinonasal Outcome Test (SNOT-22), visual analog scale of specific symptoms, Rhinosinusitis Disability Index, Chronic Sinusitis Survey, Nasal Obstruction Symptom Evaluation, and others.3-7
With increasing emphasis on patient-centered clinical decision making and personalized medicine, it is important to understand how well PROMs correlate to objective measures of disease. However, the association of CT scores to PROMs has not been well elucidated in the literature, nor have any pooled data been reported for LM or other CT scoring systems. Therefore, the purpose of this study is to systematically compile data on all sinonasal CT scoring systems that have been used in the literature and to examine their associations to PROMs.
Materials and Methods
Information Sources and Search Strategy
The study was performed according to the PRISMA statement (Preferred Reporting Items for Systematic Reviews and Meta-analyses). A comprehensive search was performed in 4 databases: PubMed (US National Library of Medicine, National Institutes of Health), Scopus (Elsevier), Cochrane Library (Wiley), and CINAHL (EBSCO). The search strategies used a combination of subject headings (eg, MeSH in PubMed) and keywords for the following concepts and/or keywords: Lund-Mackay, computed tomography, patient-reported outcome measures. The PubMed search strategy was modified for the other 3 databases, replacing MeSH terms with appropriate subject headings, when available, and maintaining similar keywords. The search strategies for each database are detailed in Supplement 1 (available online).
The databases were searched from inception through September 22, 2021. Only studies describing sinus CT scores and PROMs in patients with CRS were included. Nonhuman studies, case reports, nonjournal publications (editorials, commentaries, etc), and review articles were excluded. Last, articles with previously reported cohorts from other studies were included once, with the most detailed data included.
Study Selection
References were exported into the review management software (Covidence; Veritas Health Innovation) for study selection. Two reviewers (T.C. and S.C.) independently screened all titles and abstracts. When a disagreement occurred, the relevant articles were discussed between the reviewers until consensus was reached. Following the same process, 2 reviewers (T.C. and S.C.) independently screened full-text articles, with conflicts resolved by way of discussion. Articles were critically appraised to assess level of evidence per the criteria of the Oxford Center for Evidence-Based Medicine.
Quality and Risk of Bias Assessment
Risk of bias was assessed according to the Cochrane Handbook for Systematic Reviews of Interventions (version 6.2). 8 The ROBINS-I tool (Risk of Bias in Nonrandomised Studies) was used for nonrandomized studies. 9 Three authors (T.C., S.C., G.Y.) performed a pilot assessment on 3 studies to check for consistency of assessment and then performed independent risk assessments on the remaining studies. All disagreements were resolved once all authors came to a consensus. Risk of bias items for nonrandomized trials included bias due to confounding, selection of participants into the study, classification of interventions, deviation from intended outcomes, missing data, measurement of outcomes, and selection of reported results. Risk of bias items for randomized trials included random sequence generation, allocation concealment, blinding of participants and personnel, blinding of outcomes assessment, incomplete outcome data, selective reporting, and other bias. The risk of bias for each aspect was graded as low, unclear, or high.
Data Collection Process and Data Items
Data extracted from studies included author, publication year, country where study was conducted, patient demographics (ie, age and sex), and comorbidities. Various outcome data that were extracted included radiographic grade and PROMs.
Statistical Analysis and Synthesis of Results
To determine associations between radiographic grade and PROMs, meta-regression (also known as meta-analysis regression) was performed with R software version 4.1 via stratified summary estimates with standard errors from each study. Meta-regression is a meta-analysis technique that relates statistical heterogeneity among study effect sizes to variables available in the studies by use of regression-based techniques. 10 For each meta-regression analysis, we calculated R2 (between-study variance explained by the covariates) and residual I2 (the proportion of between-study variation explained by heterogeneity vs sampling variation). A meta-analysis of correlation coefficients was also performed with MedCalc version 19.6 (MedCalc Software Ltd). P < .05 indicated a statistically significant difference for all statistical tests. Finally, the Egger test was performed for further assessment of risk of publication bias. 11 Potential publication bias was evaluated by visual inspection of the funnel plot. In a funnel plot, the treatment effect is plotted on the horizontal axis and the standard error on the vertical axis. The vertical line represents the summary estimate derived from fixed effect meta-analysis. Two diagonal lines represent pseudo 95% confidence limits (effect ± 1.96 SE) around the summary effect for each standard error on the vertical axis. These show the expected distribution of studies in the absence of heterogeneity or selection bias. In the absence of heterogeneity, 95% of the studies should lie within the funnel defined by these diagonal lines. Publication bias results in asymmetry of the funnel plot. Analyses were carried out by T.C., S.S.J., and S.A.N. All statistical analyses were conducted under supervision of our department’s biostatistician (S.A.N.).
Results
Search Results
Of 1963 initially identified articles, 1132 underwent title and abstract screening. This process eliminated 746 articles, leaving 386 for full-text review. A total of 144 studies were included for final analysis ( Figure 1 ). Meta-analysis was performed when at least 3 studies reported the same pair of radiographic grade and PROM.
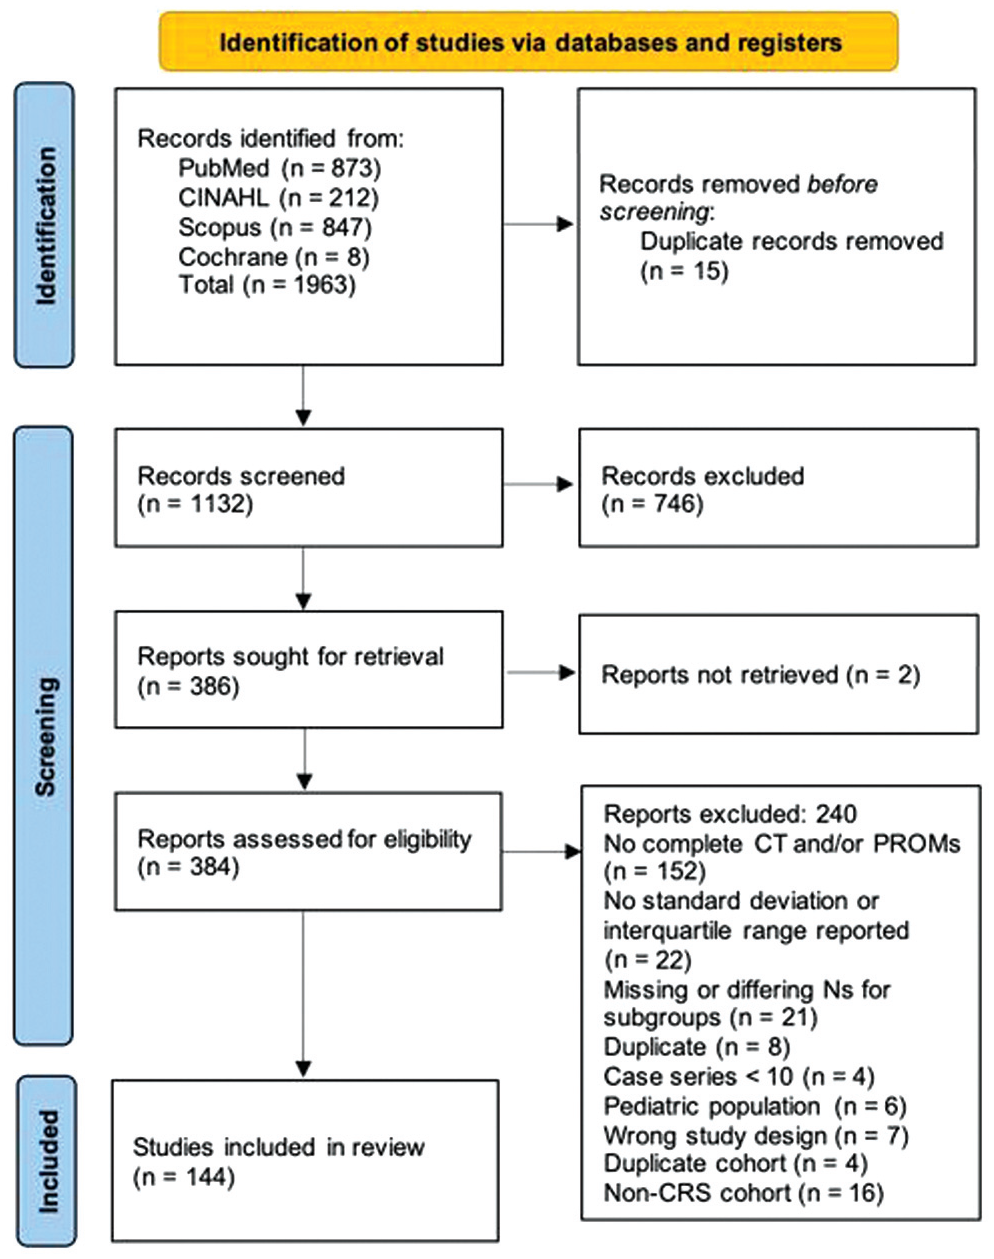
PRISMA diagram. CRS, chronic rhinosinusitis; CT, computed tomography; PROM, patient-reported outcome measure.
Overall Study Characteristics
Supplement 2 (available online) provides an overview of all studies included for meta-analysis. Each study’s level of evidence was assessed according to the 2011 criteria of the Oxford Center for Evidence-Based Medicine. 12 Critical appraisal of studies indicated an acceptably low risk of bias for the majority of studies (Supplement 3). Potential sources of bias were most pronounced in selective reporting in the randomized studies. The majority of nonrandomized studies were considered low risk, with greater potential for bias in participant selection and due to missing data. A funnel plot with Egger test (0.009250, P = .0977) demonstrated that most studies were within the funnel with little asymmetry, suggesting little publication bias (Supplement 4).
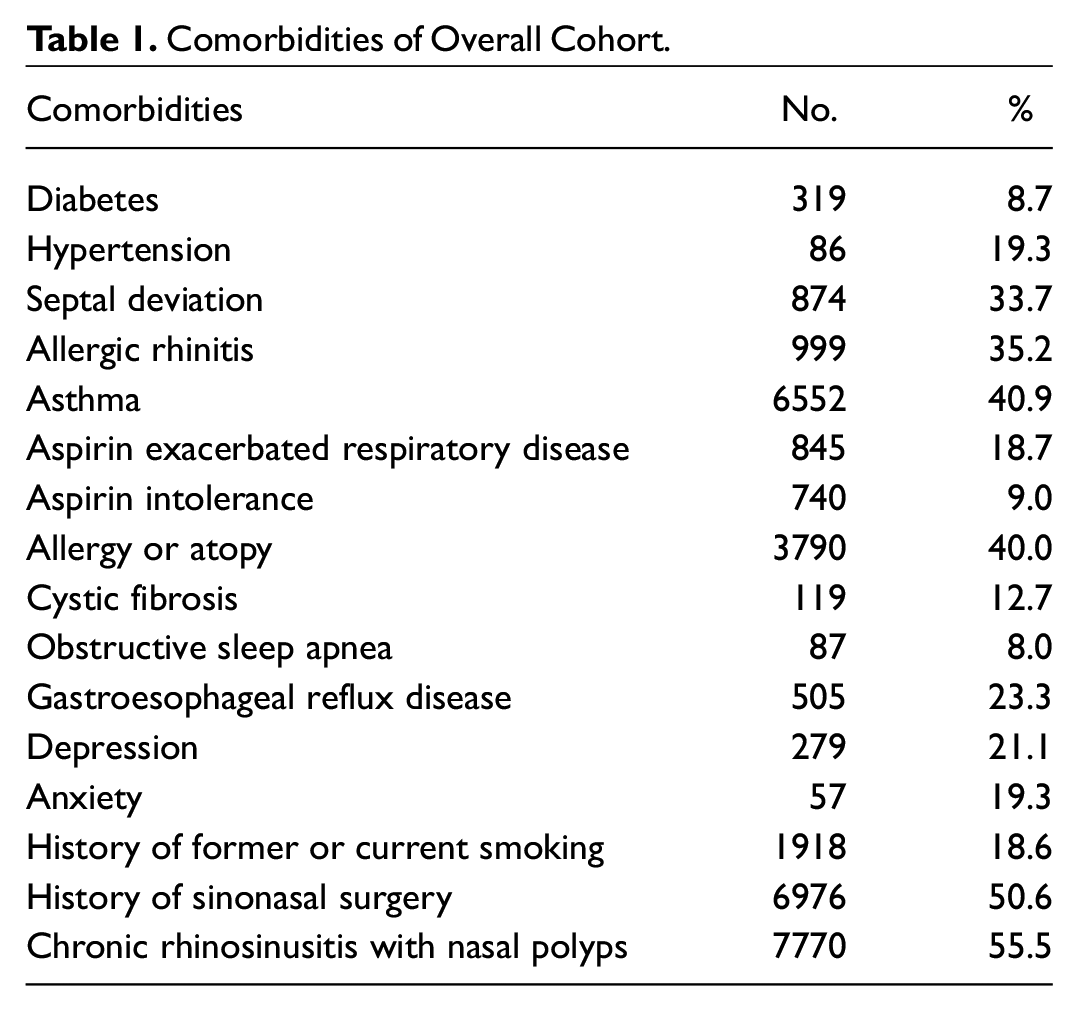
The 144 articles consisted of 20,741 patients with a sinus CT score and a PROM. The pooled mean age was 47.4 years (SD, 3.6) and 53.6% were male. Comorbidities as reported by the original studies are listed in Table 1 .
Comorbidities of Overall Cohort.
Association Between CT Scores and PROMs
Meta-analysis of correlation coefficients revealed a moderate correlation between LM scores and SNOT-22 (r = 0.434, P < .001, n = 12 studies) and a weak correlation between LM scores and the 20-item Sinonasal Outcome Test (SNOT-20; r = 0.257, P < .001, n = 5 studies).
Meta-regression utilizing r, R2, and residual I2 was performed for the following CT scores and PROMs: LM and SNOT-22, LM and SNOT-20, LM and Total Nasal Symptom Score, LM and Total Symptom Score, LM and Rhinosinusitis Disability Index, LM and Chronic Sinus Survey, LM and Nasal Obstruction Symptom Evaluation, LM and visual analog scale, LM and 12-Item Short Form Health Survey, and Zinreich and SNOT-22 ( Table 2 ). None of the CT scores were significantly associated with PROMs except LM and SNOT-20 (P = .040, n = 25 studies).
Meta-regression Analysis.
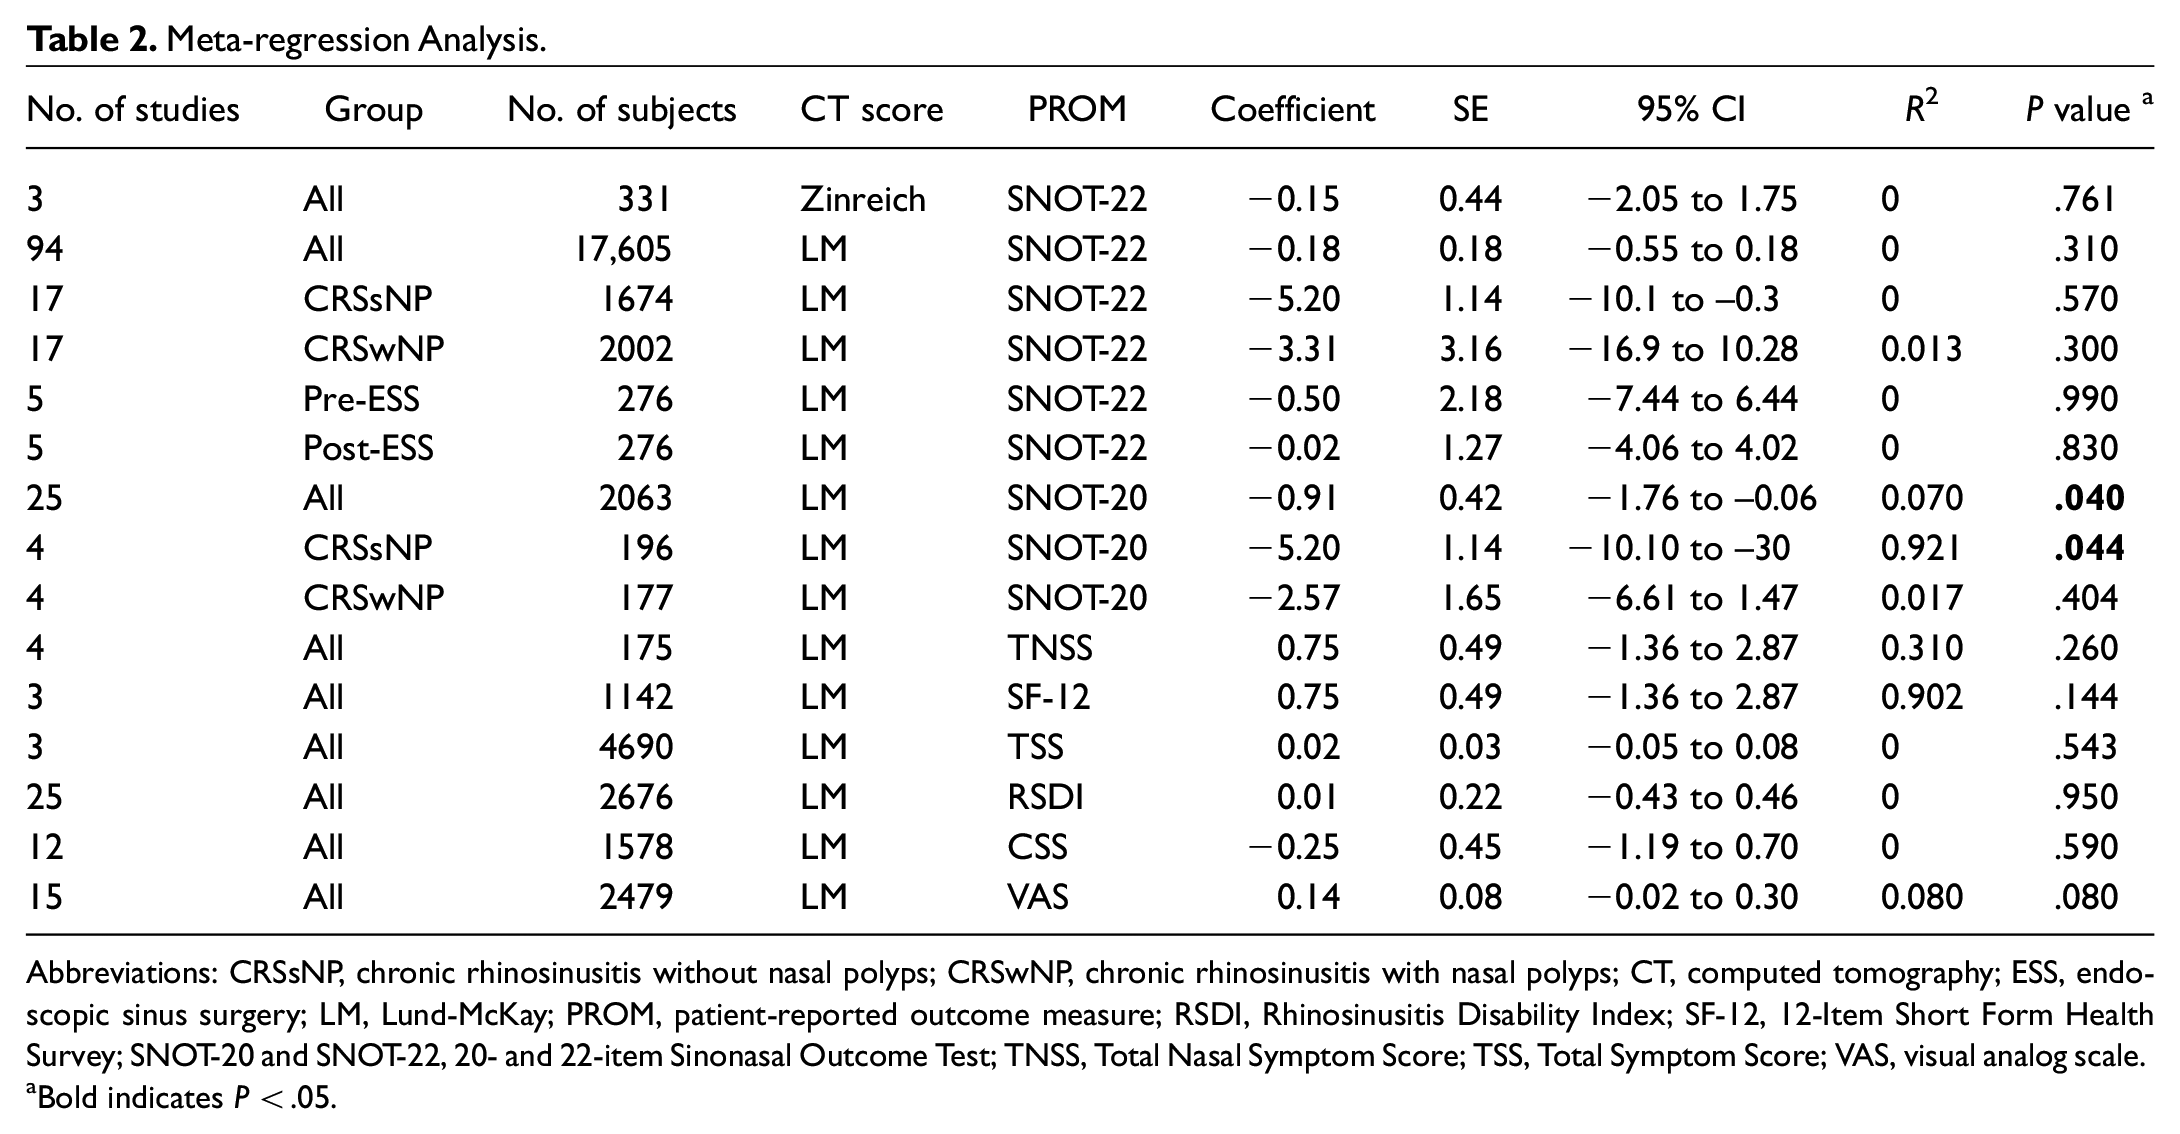
Abbreviations: CRSsNP, chronic rhinosinusitis without nasal polyps; CRSwNP, chronic rhinosinusitis with nasal polyps; CT, computed tomography; ESS, endoscopic sinus surgery; LM, Lund-McKay; PROM, patient-reported outcome measure; RSDI, Rhinosinusitis Disability Index; SF-12, 12-Item Short Form Health Survey; SNOT-20 and SNOT-22, 20- and 22-item Sinonasal Outcome Test; TNSS, Total Nasal Symptom Score; TSS, Total Symptom Score; VAS, visual analog scale.
Bold indicates P < .05.
Endoscopic Sinus Surgery: Before vs After and the Mean Difference
Five studies reported LM and SNOT-22 scores before and after endoscopic sinus surgery (ESS). There was no significant association on meta-regression between LM and SNOT-22 before or after ESS or in mean difference between pre- and post-ESS ( Table 2 ).
CRS With and Without Nasal Polyps
Meta-regression was performed for scores that could be stratified between CRS without nasal polyps (CRSsNP) and CRS with nasal polyps (CRSwNP; Figure 2 ). LM and SNOT-20 were significantly associated (P = .044) in CRSsNP but not CRSwNP (n = 4 studies). No significant association was found in either cohort for LM and SNOT-22 (n = 16 studies).
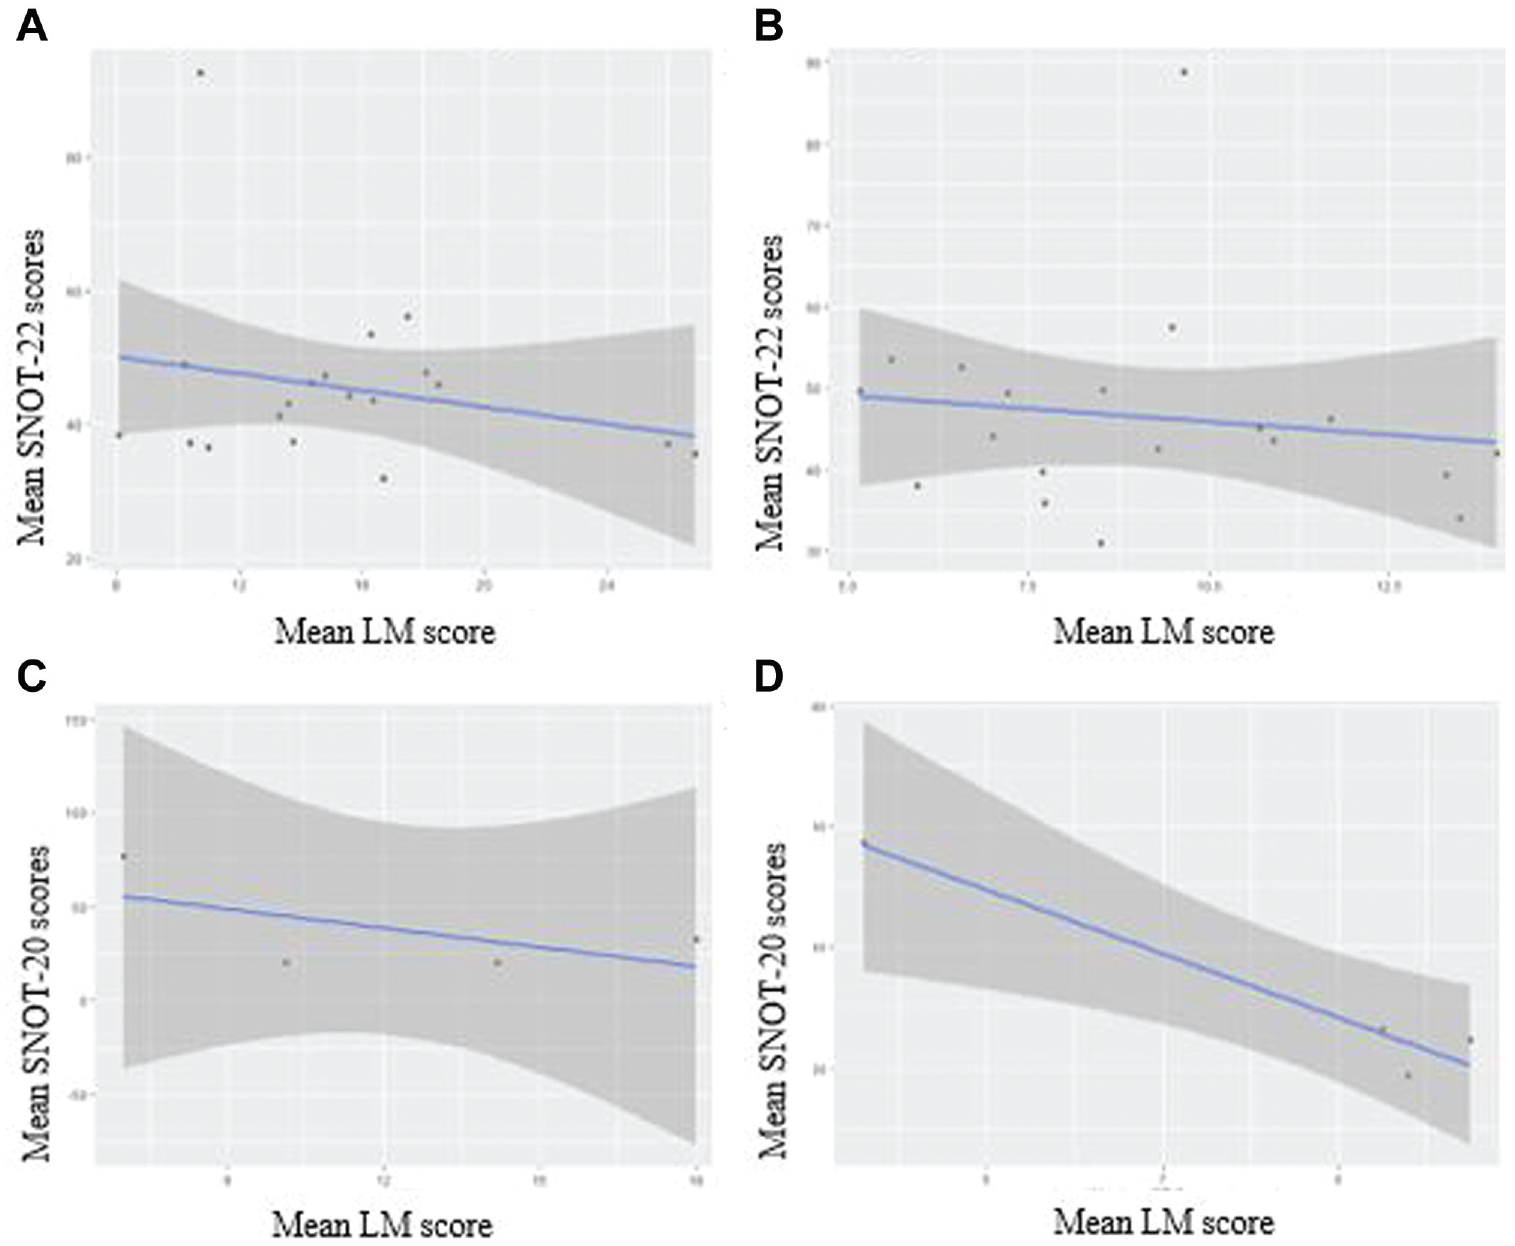
Scatterplots: LM vs SNOT-22 and LM vs SNOT-20 in (A, C) CRSwNP and (B, D) CRSsNP. CRSsNP, chronic rhinosinusitis without nasal polyps; CRSwNP, chronic rhinosinusitis with nasal polyps; LM, Lund-Mackay; SNOT-20 and SNOT-22, 20- and 22-item Sinonasal Outcome Test.
Discussion
Our study attempts to quantify and assess across multiple studies the utility of various sinus CT scoring systems in predicting PROMs. However, due to the heterogeneous nature of the data, only two sinus CT scoring methods were eligible for meta-regression: LM and Zinreich. Most regressions between these sinus CT scores and various PROMs were not significant. With meta-analysis of correlations, there were significant findings between LM and SNOT-22 and SNOT-20: LM and SNOT-22 had a moderate correlation (r = 0.43, P < .001) while LM and SNOT-20 had a weak correlation (r = 0.26, P < .001). Given that SNOT-20 lacks 2 important symptoms commonly found in sinonasal disease—nasal obstruction and loss of smell and taste—the weaker correlation was expected. 3 An even weaker significant association was found in this study between LM and SNOT-20 when analyzed with meta-regression. Interestingly, results of the meta-regression and meta-analysis of correlations did not agree for LM and SNOT-22. This may be due to the smaller number of studies in the meta-analysis of correlations as compared with the much larger number in the meta-regression. A simple regression model attempts to use the value of one variable, x, to predict the value of another variable, y. A meta-regression uses similar logic but is applied to aggregate data of entire studies instead of individual-level data. Meta-regression considers the heterogeneity among studies and the effect of covariates, while meta-analysis of correlations does not. This would indicate that the results of the meta-regression are more compelling.
Sinus CT scoring and PROMs were further analyzed by surgical intervention. It is interesting to note that a separate regression analysis between LM and SNOT-22 was not significant prior to or after ESS. These results seem to counter the moderate correlation that we found between LM and SNOT-22 in the meta-analysis of correlations but to confirm the lack of association on meta-regression. Note that only 5 studies were in the group undergoing ESS. The association between change in LM score and change in SNOT-22 after ESS was not significant.
When results were stratified by polyp status, our study shows that LM is very strongly correlated (r = 0.96, P < .04) with SNOT-20 in CRSsNP but not CRSwNP. Our results suggest that SNOT-20 does adequately address the disease burden in CRSsNP but not in CRSwNP. Because SNOT-20 does not address nasal obstruction or olfactory impairment, it is not surprising to see that LM correlates with SNOT-20 more in CRSsNP than in CRSwNP. Multiple studies have noted that nasal obstruction and olfactory impairment are significantly more associated with CRSwNP than CRSsNP.13-15 Our results suggest that in a specific subset of the CRS patient population without nasal polyps, LM scoring may be a reasonable method to predict PROMs, specifically SNOT-20. This supports the current belief that there are differences in radiologic opacification and clinical presentation between CRSwNP and CRSsNP.16-20
The most widely utilized CT score has been the LM score since its inception in 1993. The LM score grades the frontal, maxillary, anterior ethmoid, posterior ethmoid, and sphenoid sinuses as well as the ostiomeatal complex on a scale of 0, 1, or 2 on each side (0, no opacification; 1, 50% opacification; 2, 100% opacification). Prior to widespread use of the LM score, staging systems had been published in the literature as proposed by Kennedy, Levine and May, Friedman et al, Gliklich and Metson (Harvard system), Jorgensen, Newman et al, and Gaskins (Supplement 5, available online).21-28 The LM score has been favored due to ease of use and high level of inter- and intraobserver agreement. 2 The Zinreich modification of the LM score was created in 2004, which divides the level of inflammation into intervals of 25% and is therefore scored on a scale of 0 to 5 at the same locations as the LM score. 29 Only the scoring for the ostiomeatal complex is kept on a scale of 0 to 2. Other radiologic scoring methods that have been used in the literature include maximum mucosal thickness, 3-dimensional volumetric analysis, minimum cross-sectional area, and percentage opacification.30-34
Multiple studies in the literature have suggested that radiologic scores do not correlate with patient symptom scores.35-41 Other studies have found the opposite or found correlation with specific symptoms.22,42-45 Our study supports that there is generally no correlation and is quite compelling with such a large sample size. Our results have several possible implications. It may suggest that degree of opacification does not predict severity of symptoms; thus, other factors may play a greater role in symptom severity. 45 Another possibility is that the current radiologic quantifications of sinus disease do not provide enough stratification. In terms of the LM score, there is a wide range of disease that is represented by a score of 1 (ie, any opacification from 1% to 99%). An attempt to address this discrepancy was the Zinreich modification of the LM score. However, our study did not find any association of Zinreich modification with symptom scores, though the number of studies reporting Zinreich scores are significantly less. Newer methods of quantification with continuous measures have emerged, such as the aforementioned maximum mucosal thickness, 3-dimensional volumetric analysis, minimum cross-sectional area, and percentage opacification, but more data are needed to determine the association between these measures and various PROMs.
There are a few important limitations to note. The number of studies eligible for meta-analysis for some specific pairings of staging system and PROM was small, reducing the power of our results. Although many studies included CT scores and PROMs, the actual sample size ended up being smaller than expected due to heterogenous pairings of the 2 scores. Normally, meta-regressions utilize at least 10 data points, but in our study, the sample sizes ranged from 3 to 101 studies. However, the statistical method still yields important insight into the relationship between CT scoring systems and PROMs. Another potential limitation was the heterogeneity among patients in the meta-analysis. Although a subgroup analysis was performed for CRSsNP vs CRSwNP in this study, a lack of data precluded stratification of results by other conditions, such as aspirin-exacerbated respiratory disease or allergic fungal rhinosinusitis.
Conclusion
There is largely very little association between radiologic grading and PROMs. Though more data are needed to evaluate the continuous quantifications of radiologic disease, CT scoring systems with improved clinical utility are needed.
Supplemental Material
sj-docx-1-oto-10.1177_01945998221114078 – Supplemental material for Association of Sinonasal Computed Tomography Scores to Patient-Reported Outcome Measures: A Systematic Review and Meta-analysis
Supplemental material, sj-docx-1-oto-10.1177_01945998221114078 for Association of Sinonasal Computed Tomography Scores to Patient-Reported Outcome Measures: A Systematic Review and Meta-analysis by Tiffany Chen, Shreya Chidarala, Gabrielle Young, Seth S. Jeong, Shaun A. Nguyen, Thomas S. Edwards and Rodney J. Schlosser in Otolaryngology–Head and Neck Surgery
Footnotes
Author Contributions
Disclosures
Supplemental Material
Additional supporting information is available in the online version of the article.
References
Supplementary Material
Please find the following supplemental material available below.
For Open Access articles published under a Creative Commons License, all supplemental material carries the same license as the article it is associated with.
For non-Open Access articles published, all supplemental material carries a non-exclusive license, and permission requests for re-use of supplemental material or any part of supplemental material shall be sent directly to the copyright owner as specified in the copyright notice associated with the article.