






Abstract
Market-based demand response (DR) has emerged as an important emergency mechanism to cope with extreme weather shocks as well as the growing penetration of variable renewable energy (VRE). However, the value of DR remains unclear, which undermines efforts to design effective flexibility markets and ensure system reliability. To support China’s resilient power system decarbonization, this study quantifies the welfare impacts of DR under extreme weather, and explores how pricing and VRE penetration influence its optimal deployment. Key findings are summarized as follows: (1) Although extreme weather threatens power supply-demand balance, DR reduces average power shortages from 6.16% to 5.20% under different weather scenarios. (2) An optimal DR mechanism yields positive net welfare gains. On average, each province experiences a welfare increase of approximately 40.49 billion yuan, equivalent to 0.10% of provincial GDP. (3) Compensation prices in current pilots are approximately twice the theoretical optimum. Such pricing distortions result in GDP losses of 0.51% to 4.91% across different pilots. (4) The benefits of DR rise modestly with power system decarbonization. On average, total welfare increases by approximately 0.01%, that is, 12.58 billion yuan, for each 1% increase in VRE penetration.
Highlights
Impacts of extreme weather on power systems are estimated
The welfare effects of demand response against extreme weather are evaluated
Optimal demand response can raise welfare by 0.10% of average provincial GDP
Current pilot pricing distortion causes welfare losses of 0.51% to 4.91%
Higher renewable penetration increases the value of demand response
1. Introduction
The Sustainable Development Goal 7 (SDG 7) aims to ensure the access to reliable and modern energy services. However, the increasing frequency and intensity of extreme weather events in recent years have posed serious challenges to the power system reliability. The Texas power crisis in 2021 and China’s mandatory power cut in Sichuan in 2022 highlight the vulnerability of power systems under extreme weather shocks and associated economic and welfare losses (Gruber et al. 2022; Perera et al. 2020; Zhou 2022). Even under the 1.5°C temperature target, the frequency and intensity of once-every-five-year extreme heatwaves are projected to exceed historical levels – occurring 8.6 times more often and 2.0°C hotter (Masson-Delmotte et al. 2021). Different types of extreme weather can threaten power system reliability from various dimensions. On the one hand, air temperature influences both electricity demand and the efficiency of power generation, leading to potential supply-demand mismatch during extreme weather (Auffhammer et al. 2017). On the other hand, as the penetration of variable renewable energy (VRE) rises, other weather factors such as cloud cover, wind speed, and precipitation exacerbate supply variability and unpredictability, therefore increase the power shortage risk (Liu et al. 2023). As climate change intensifies in the future, its impacts on power systems are expected to increase (Zuo et al. 2024). Relevant studies have assessed how historical and future extreme weather may threaten power system reliability (Golub et al. 2022; Liang et al. 2025). However, evaluations on how market-based mechanisms can be used to address these challenges remain limited. Thus, this study incorporates demand response (DR) as a key flexibility mechanism into a traditional power system optimization framework and quantifies its welfare benefits under extreme weather conditions. In doing so, it provides a new analytical perspective and potential solutions for addressing the growing threats of weather shocks.
As variable renewable energy penetration continues to rise, fossil fueled generation is progressively displaced in many power systems (Wang, Li, et al. 2020). Therefore, a growing literature highlights the importance of DR as a flexibility resource (IEA 2023; Wang et al. 2023). However, as the largest electricity consumer around the world, China has only launched DR pilots in seventeen out of its thirty-four provinces (see Appendix A), and it still relies on administrative rationing measures rather than market-based mechanisms. Meanwhile, although some studies have investigated DR benefits on avoided capacity investment and consumer welfare (Astier and Léautier 2021; Dahlke and Prorok 2019; Nouicer et al. 2023), there remains a lack of a unified framework to evaluate flexibility resources and assess theoretically optimal mechanisms. Accordingly, this study integrates both the supply and demand sides to evaluate the overall welfare improvements resulting from DR. A broader approach facilitates a more comprehensive assessment of its benefits and provides a stronger basis for refining market designs.
Given the complicated impact mechanisms through which weather factors affect power systems and the evolving electricity market in China, it is challenging to evaluate the welfare-enhancing effects of DR under extreme weather scenarios. On the one hand, welfare analysis relies heavily on the consumer valuation on electricity reliability parameters, namely the Value of Lost Load (VOLL), and high-resolution data on generation and consumption. However, the scarcity of survey and research data limits the accuracy of welfare analysis. On the other hand, the mechanisms through which weather factors influence conventional generation technologies, renewable energy sources, and electricity demand are highly complex and interdependent. Therefore, it is essential to develop a representative and integrated framework to quantify the social value of demand-side market design. To inform flexibility market design in the context of increasingly frequent climate-related shocks, this study assesses the potential benefits of DR under various extreme weather scenarios, which is aimed at answering the following three questions:
How can the potential impacts of multiple extreme weather shocks on power systems be comprehensively evaluated?
To what extent can a DR mechanism mitigate the reliability impacts of extreme weather on power systems and improve the overall welfare?
What are the key factors influencing the value of DR?
Compared to the existing literature, the central contributions of this study are twofold. First, we develop an integrated framework that jointly accounts for the physical operating constraints of the power system and the power market. Using this framework, we quantify reliability outcomes and social welfare impacts under multiple extreme weather shocks. Second, this paper incorporates a market-based DR mechanism into a social welfare maximization model, quantifies its value under extreme-weather scenarios, and identifies the key determinants of DR value.
The remainder of this paper is organized as follows. Section 2 reviews the relevant literature on the impacts of extreme weather on power systems and the market design of demand-side mechanisms. Section 3 describes the methodology as well as the data sources. Section 4 presents the main results, and Section 5 summarizes the conclusions and proposes policy implications.
2. Literature Review
Enhancing the power system’s resilience in response to the challenges of extreme weather and decarbonization has become a critical issue. Accordingly, this study is related to two streams of literature. The first examines the impacts of extreme weather on power system reliability, which has received growing attention as outage risks have intensified in recent years. The second focuses on the design of DR markets, whose importance has increased in parallel with the rising demand for flexibility resources with power system decarbonization.
2.1. Impact of Extreme Weather on Power Systems
Extreme weather affects power systems along multiple dimensions, including system reliability, generation efficiency, and electricity consumption. The existing literature has primarily used empirical analyses and engineering-based modeling to conduct ex post assessments or ex ante evaluations of weather shocks. On the generation side, temperature has been found to significantly affect the generation efficiency of various technologies (Linnerud et al. 2011; Tang et al. 2025; Zhang et al. 2021). On the demand side, existing studies have examined the effects of temperature on electricity consumption or peak load (Auffhammer et al. 2017; Wenz et al. 2017). From a system-level perspective, existing research has further examined the impacts of weather shocks on key power system reliability indicators, including outage probability (Golub et al. 2022; Perera et al. 2020), outage duration (Do et al. 2023; Liang et al. 2025), and supply–demand mismatch (Liu et al. 2023; Yuan et al. 2025). In addition, some literature has evaluated the welfare impacts of weather shocks (Atalla et al. 2017; Byers et al. 2020; Gruber et al. 2022). However, most existing studies primarily focus on micro-level analyses or the economic costs associated with specific shock events. Consequently, there remains relatively limited attention to broader societal welfare outcomes and to market-based mechanisms for managing weather-related risks (Sanstad et al. 2020). Addressing these gaps is particularly important for the future deployment and operation of power systems with high shares of weather-dependent VRE. Motivated by this limitation, we incorporate DR as a key demand-side flexibility resource to quantify the value of market-based mechanisms in enhancing system resilience to extreme weather.
2.2. The Market Design and Evaluation of Demand-side Flexibility
As renewable energy penetration continues to rise, the proportion of non-dispatchable generation resources grows, making demand-side flexibility increasingly important (Fadhuile et al. 2025; Schittekatte et al. 2024; Wang et al. 2015). Generally, DR can be classified into price-based and incentive-based mechanisms (Paterakis et al. 2017). Price-based DR uses price as control signals to affect consumer consumption behavior, whereas incentive-based DR offers financial compensation for load reductions and provides short-term flexibility during peak periods (Wang, Chen, et al. 2020). While prior studies have examined how demand response affects net load, market prices, or investment decisions (Astier and Léautier 2021; Dahlke and Prorok 2019; Nouicer et al. 2023), they have paid less attention to its full social welfare implications, especially the welfare gains from avoiding shortage risks and improving system wide efficiency under extreme conditions. To address this gap, our analysis integrates both the generation side and the demand side within a unified framework to evaluate the overall welfare improvements attributable to DR. A broader approach facilitates a more comprehensive assessment of its benefits and provides a stronger basis for refining market designs.
3. Methodology
3.1. Welfare Maximization Model
To quantify the welfare effects of DR under extreme weather scenarios, this study develops an electricity system operational optimization model integrated with an economic welfare analysis framework. It introduces the DR mechanism by capturing its effects on both producer surplus and consumer surplus. The model aims to maximize the total welfare across various extreme weather scenarios. Within this framework, the decision-maker must balance the impacts of DR mechanism on the welfare of both supply and demand sides to determine the optimal compensation level. The model considers a series of physical constraints to depict the characteristics of the power system operation. Methodologically, the supply-side modeling builds upon the power system dispatch model (He et al. 2016) to capture the key physical constraints and institutional features of power system operations in China. Our demand-side modeling and welfare analysis extend the approaches of Gowrisankaran et al. (2016) and Elliott (2022) to represent the key characteristics of market-based DR. Building on these frameworks, this study further incorporates a more complete and realistic demand response mechanism. A comparison with existing modeling approaches is provided in Appendix B.
3.1.1. Electricity Demand
At each hourly time step, electricity demand of consumers can be expressed as a function of weather-dependent demand, electricity price, and demand elasticity, as shown in equation (1):

where
On the demand side, electricity consumers can participate in the electricity market through DR mechanisms. Consumers sign DR contracts with system operators in advance, which specify the load interruption compensation price and the committed response capacity (Baldick et al. 2006). When exogenous extreme weather shocks lead to insufficient available generation capacity and flexibility in the power system, contracted consumers are obligated to reduce their electricity consumption at the pre-signed contract compensation price
However, due to factors such as the response rate and the response delay, the realizable load curtailment at each time does not necessarily equal the maximum curtailment potential

3.1.2. Electricity Supply
Assume that a local power producer operating generation technology

where
Some generation units are required to provide spinning reserves to ensure system flexibility. At each time step, the generation output

Considering that the flexibility varies across generation technologies, the upper limit of spinning reserves they can provide is constrained by the technology type and the available generation capacity:

where
The total provided spinning reserve should be at least equal to a weighted sum of electricity demand and wind power generation to ensure the power system reliability:

On the supply side, the system operator can import or export electricity through interprovincial transmission lines to maintain supply-demand balance. Here, we model interprovincial power transmission as an endogenous decision variable, since inter-provincial coordination is an important source of system flexibility for most provinces (Zhuo et al. 2022). Endogenizing inter-provincial transmission helps reduce potential bias in estimating the welfare effects of DR. On the one hand, at any given time, the interprovincial transmission power

On the other hand, the annual aggregate interprovincial transmission volume is capped, since medium- and long-term interprovincial trading contracts currently constitute the dominant share of interprovincial electricity transmission in China.

Besides, local generation and net electricity imports must satisfy demand at every time step due to electricity is hard to store:

Finally, the total generation cost consists of generation costs and transmission costs. Generation costs include fuel costs, carbon emission costs, and operation and maintenance costs:

3.1.3. Total Welfare
In this model, the total welfare consists of consumer surplus and producer surplus. Specifically, consumer surplus comprises the following four components: the utility derived from electricity consumption, welfare loss caused by DR-induced reduction in electricity consumption, DR compensation, and economic losses resulting from electricity shortages. These components are expressed as follows:

where VOLL represents the economic cost per unit of electricity interruption. The consumer welfare loss caused by voluntary load reduction (as shown in Figure 1) is denoted by

The producer surplus mainly consists of three components: electricity sales revenue, variable costs of generation and imports, and DR compensation costs. Assuming the supply side faces a given market price

The objective of local system operator is to maximize total welfare:

Obviously, a higher level of load reduction leads to greater consumer welfare loss; however, it also reduces welfare losses caused by power outages. Therefore, equations (11) and (13) indicate the existence of an optimal compensation price level. On one hand, if the compensation price is too low, the power system resilience to extreme weather shocks is insufficient. On the other hand, if the compensation price is too high, it will result in additional losses to consumer welfare.
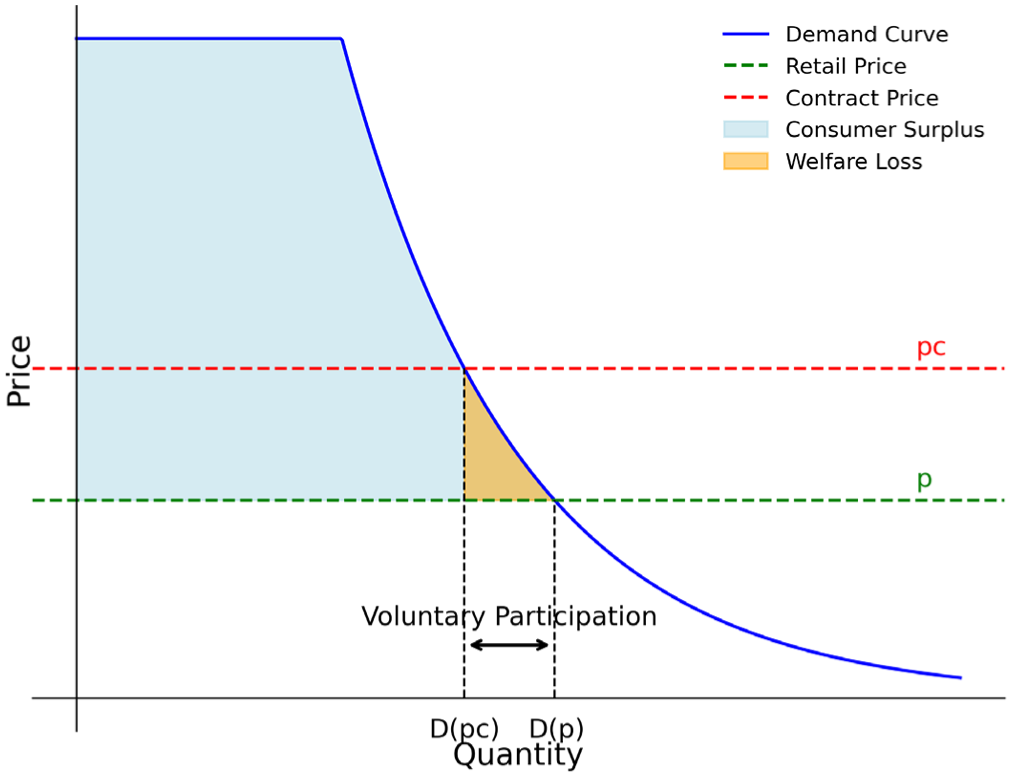
Voluntary participation in demand curtailment and welfare loss under DR.
3.2. Scenario Design and Parameter Estimation
3.2.1. Extreme Weather Scenarios Considering Both Generation and Demand Sides
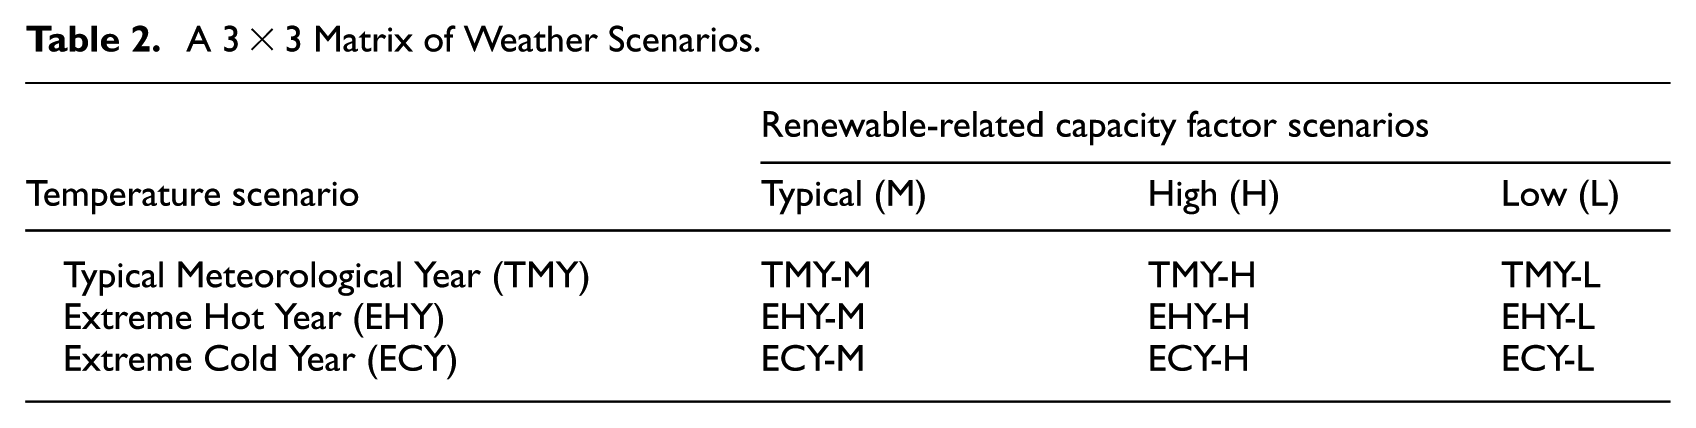
Considering that meteorological factors affect both electricity demand and power generation, we classify weather scenarios into two groups: three temperature scenarios and three meteorological scenarios related to renewable generation. The temperature scenarios are used to construct hourly counterfactual electricity demand and the efficiency of conventional generation, whereas the renewable-related scenarios affect the availability of renewable generation resources.
3.2.1.1. Electricity Demand Based on Temperature Scenarios
Given the significant impact of temperature on electricity demand, this study employs the Finkelstein-Schafer (FS) statistical method (Nik 2016) to generate three temperature scenarios – Typical Meteorological Year (TMY), Extreme Hot Year (EHY), and Extreme Cold Year (ECY) – based on sixty-nine years (1956–2024) of hourly temperature data. As extreme weather events are becoming increasingly frequent and power systems are becoming more weather sensitive with rising renewable penetration (Masson-Delmotte et al. 2021; Perera et al. 2020), this study first constructs pessimistic scenarios based on the hourly distributional characteristics of historical data to capture the impact of extreme weather on power system operating margins. As a robustness check, we also construct scenarios using monthly data and report the corresponding results in Appendix C. Here we illustrate the approach by constructing different temperature scenarios at an hourly resolution. Hourly air temperatures corresponding to the historical median at each time point are selected to form the TMY temperature profile. The EHY and ECY scenarios are generated similarly by identifying, for each hour, the historical temperature values that deviate most from the overall distribution at that time point. Building on these temperature profiles, we estimate the demand–temperature relationship using the econometric approach described in Section 3.2.2 and then map the TMY, EHY, and ECY temperature scenarios into the corresponding counterfactual hourly demand trajectories.
It is important to note that our econometric model is estimated using data from a single year. Therefore, the counterfactual demand scenarios should be interpreted as representing how demand in a given year would change under alternative temperature scenarios, rather than as simulations of demand in different historical or future years.
3.2.1.2. Electricity Generation Considering Meteorological Factors
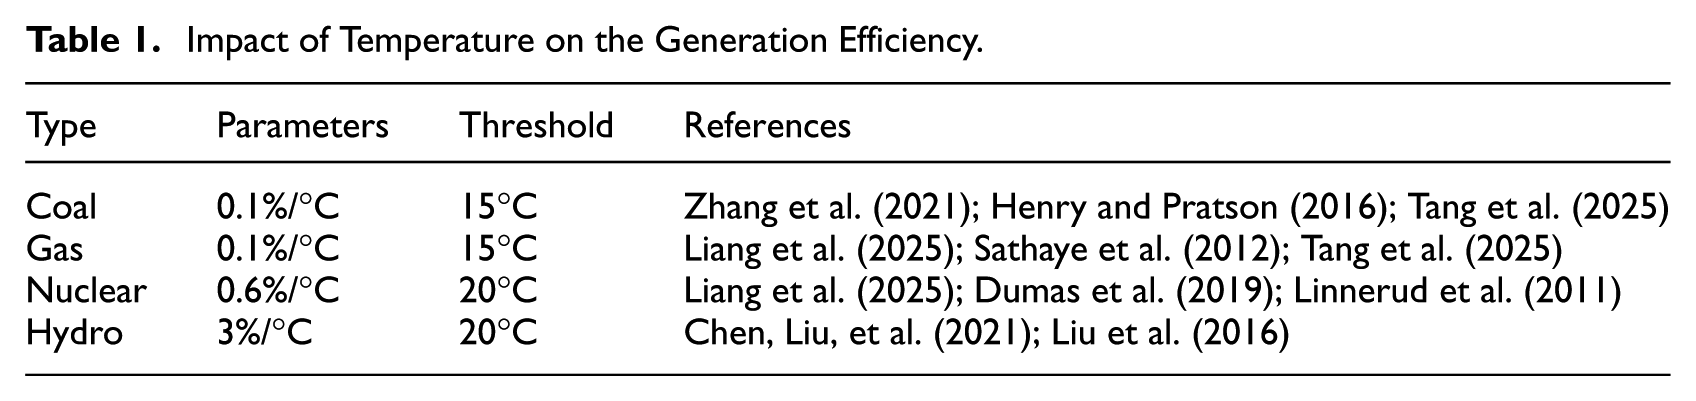
Existing studies show that when ambient temperature exceeds certain thresholds, the generation efficiency of conventional sources such as coal, gas, hydro, and nuclear power is significantly affected (see Table 1). In contrast, VRE like wind and solar power exhibit greater sensitivity to other weather conditions. Factors such as cloud cover, precipitation, and solar irradiance influence their capacity factors through complex physical and engineering processes.
Impact of Temperature on the Generation Efficiency.
Therefore, to highlight the impact of various weather factors on the VRE generation, this study adopts historical capacity factor profiles developed by Pfenninger and Staffell (2023) to construct three renewable-related capacity factor scenarios: Typical (M), High (H), and Low (L). A 3 × 3 scenario matrix is formed by combining these capacity factor scenarios with the established temperature scenarios (see Table 2), providing a comprehensive basis for the welfare analysis.
A 3 × 3 Matrix of Weather Scenarios.
3.2.2. Temperature Impact on Electricity Demand
Temperature is a key weather variable influencing electricity demand. The response of electricity load to temperature varies across different temperature ranges. It is widely recognized that the relationship between temperature and peak load follows a U-shaped curve. Previous studies have employed nonlinear econometric models to assess the relationship between temperature and peak load across various temporal resolutions, including hourly, daily, and monthly levels.
Considering that electricity consumption may also be influenced by other weather factors such as humidity and precipitation, this study includes these variables as controls in the estimation model to reduce estimation bias. Additionally, month, weekday, and provincial dummy variables are incorporated into the model.
Finally, following existing studies, this paper establishes a nonlinear econometric regression model of peak electricity load in response to daily maximum temperature (Bartos et al. 2016; Chen, Yan, et al. 2021).

Here, the dependent variable
3.3. Data Sources
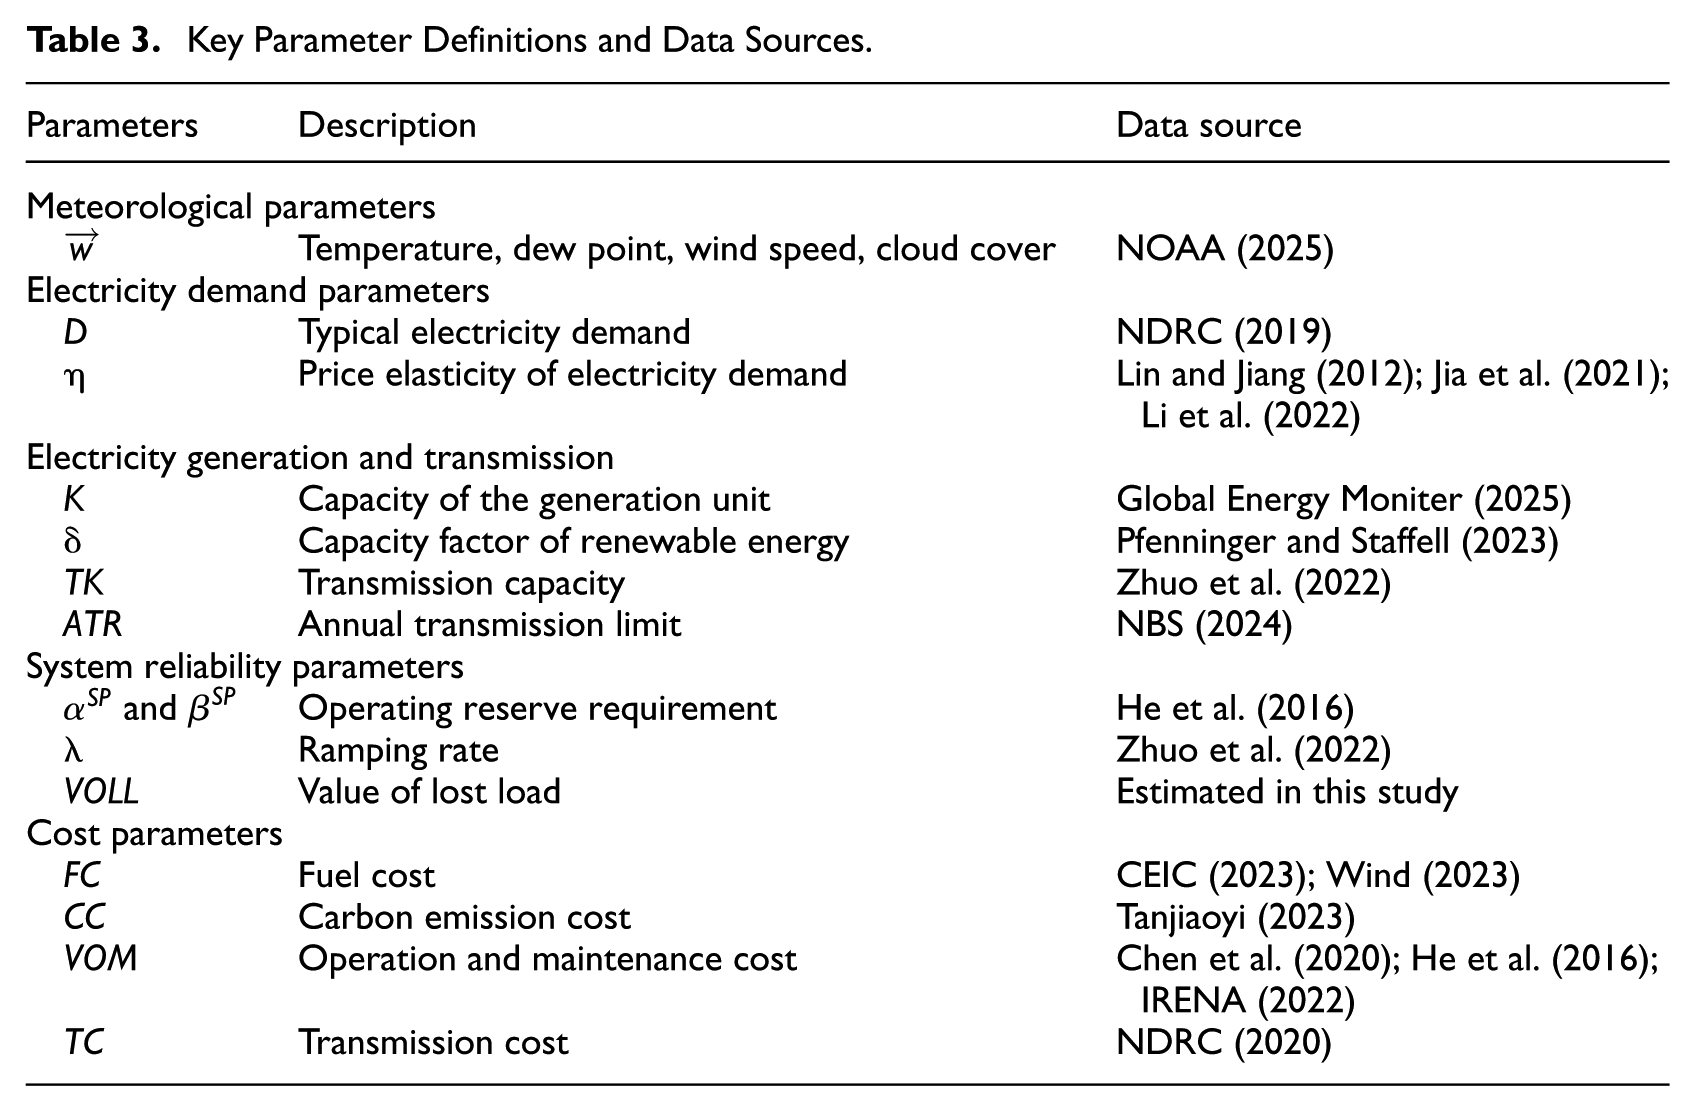
Model implementation relies on a range of parameters and datasets. The estimation strategy and sources for parameters used in scenario design have been partly described in Section 3.2. The remaining data sources and processing procedures are summarized in Table 3.
Key Parameter Definitions and Data Sources.
Daily peak load data and load profile released by the NDRC (2019) are employed in the regression analysis to examine the impact of temperature on electricity demand. Because the original series is presented as a line chart, we digitize the figure and extract the underlying series using the GetData data-extraction software. Building on the methods of Abhyankar et al. (2022), our disaggregation approach accounts for the impact of temperature on peak load during the dimension reduction step, thereby providing a more complete strategy for constructing hourly demand profiles. This relationship is quantified using the nonlinear econometric model described in Section 3.2 and provides the key parameters for scenario simulations. Using the three temperature scenarios (TMY, EHY, and ECY), we then construct counterfactual daily peak-demand series. These daily peak-demand curves are subsequently downscaled to an hourly resolution by applying the typical intraday load shape for working days and public holidays. As a result, we obtain a set of counterfactual hourly demand by combining the sixty-nine-year temperature data with the single-year load profile reported by NDRC (2019). Constructing all counterfactual scenarios around the same baseline load profile ensures cross-scenario comparability for the DR evaluation.
Power plant data are drawn from Global Energy Moniter (2025), which records installed capacity, geographic coordinates, commissioning year, and other characteristics for various generation technologies. These data are aggregated to the provincial power grid level for optimization analysis. Interprovincial transmission line capacities and utilization rates are compiled and calibrated based on existing statistical sources (NBS 2024). The correspondence between provincial and regional power grids is shown in Table 4. For each province, we calibrate capacity factors by matching the capacity-factor profiles from Pfenninger and Staffell (2023) to observed historical generation by technology from NBS (2024). System reserve requirements are specified following the “3+5” rule (3 percent of expected wind generation + 5 percent of demand) commonly adopted in power-system modeling (He et al. 2016). Besides, given the lack of well-established estimates of VOLL for China, we adopt a commonly used proxy and approximate VOLL as the ratio of provincial GDP to electricity consumption, that is
Abbreviations of Regional Power Grids and Provincial Grids.
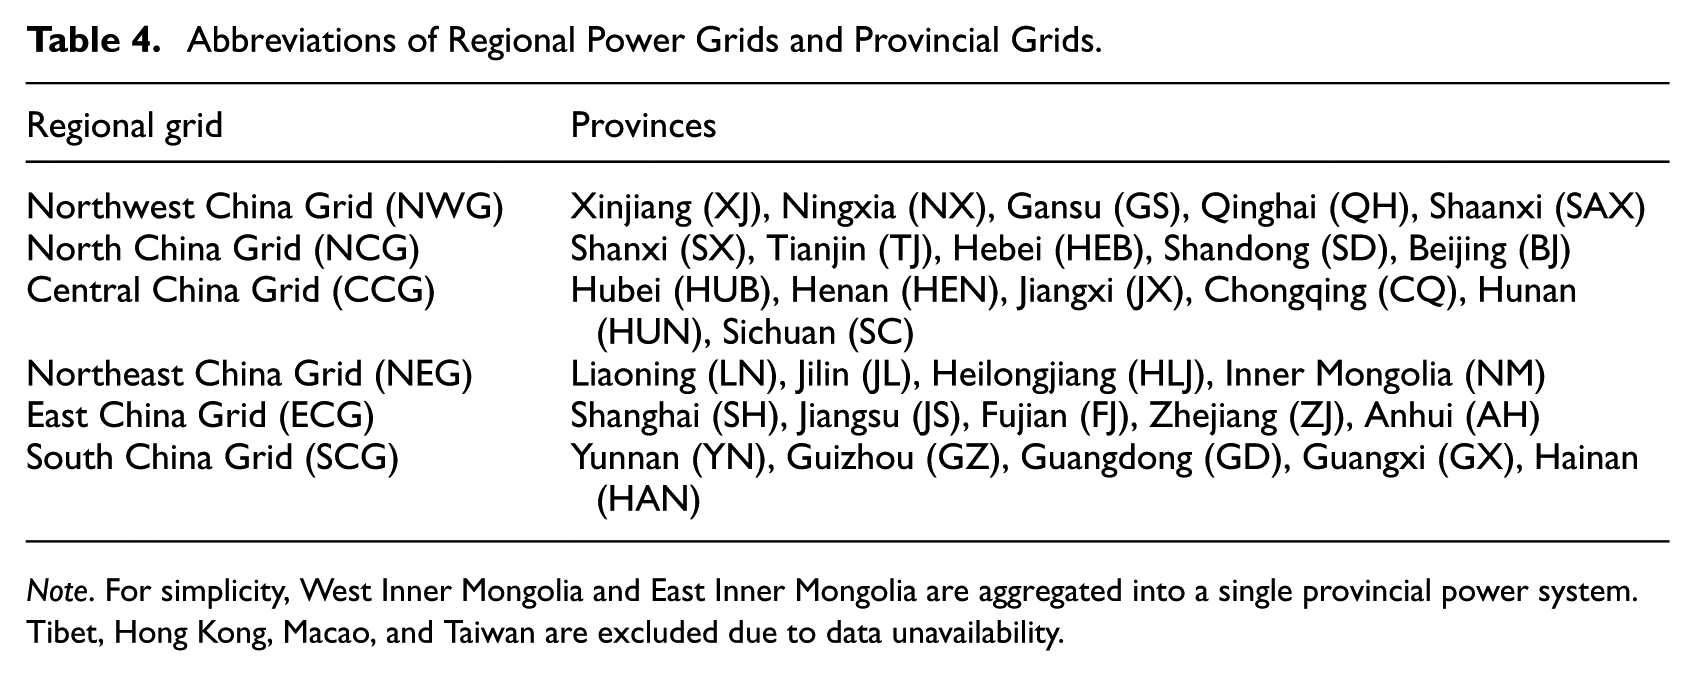
Note. For simplicity, West Inner Mongolia and East Inner Mongolia are aggregated into a single provincial power system. Tibet, Hong Kong, Macao, and Taiwan are excluded due to data unavailability.
4. Results and Discussion
4.1. The Impact of Extreme Weather on the Power System
To support the welfare analysis of DR mitigating electricity shortages under extreme weather, this study first assesses system reliability across different scenarios. On the demand side, based on the methodology in Section 3.2, one representative temperature scenario and two boundary temperature scenarios are generated. Corresponding electricity demand curves are then derived from the empirical load-temperature response functions (Figure 2a and b). Annual load fluctuations under the EHY and ECY scenarios are significantly greater than those under the TMY scenario, underscoring the impact of extreme temperatures on the intra-annual power supply-demand balance. Moreover, the average load under the EHY scenario is much higher than that of both the TMY and ECY scenarios. This is mainly attributed to elevated cooling demand during hot summers. In contrast, although winter heating demand rises under the ECY scenario, the notable decrease in summer electricity load reduces the average demand, illustrating the seasonal asymmetry in load response to temperature.
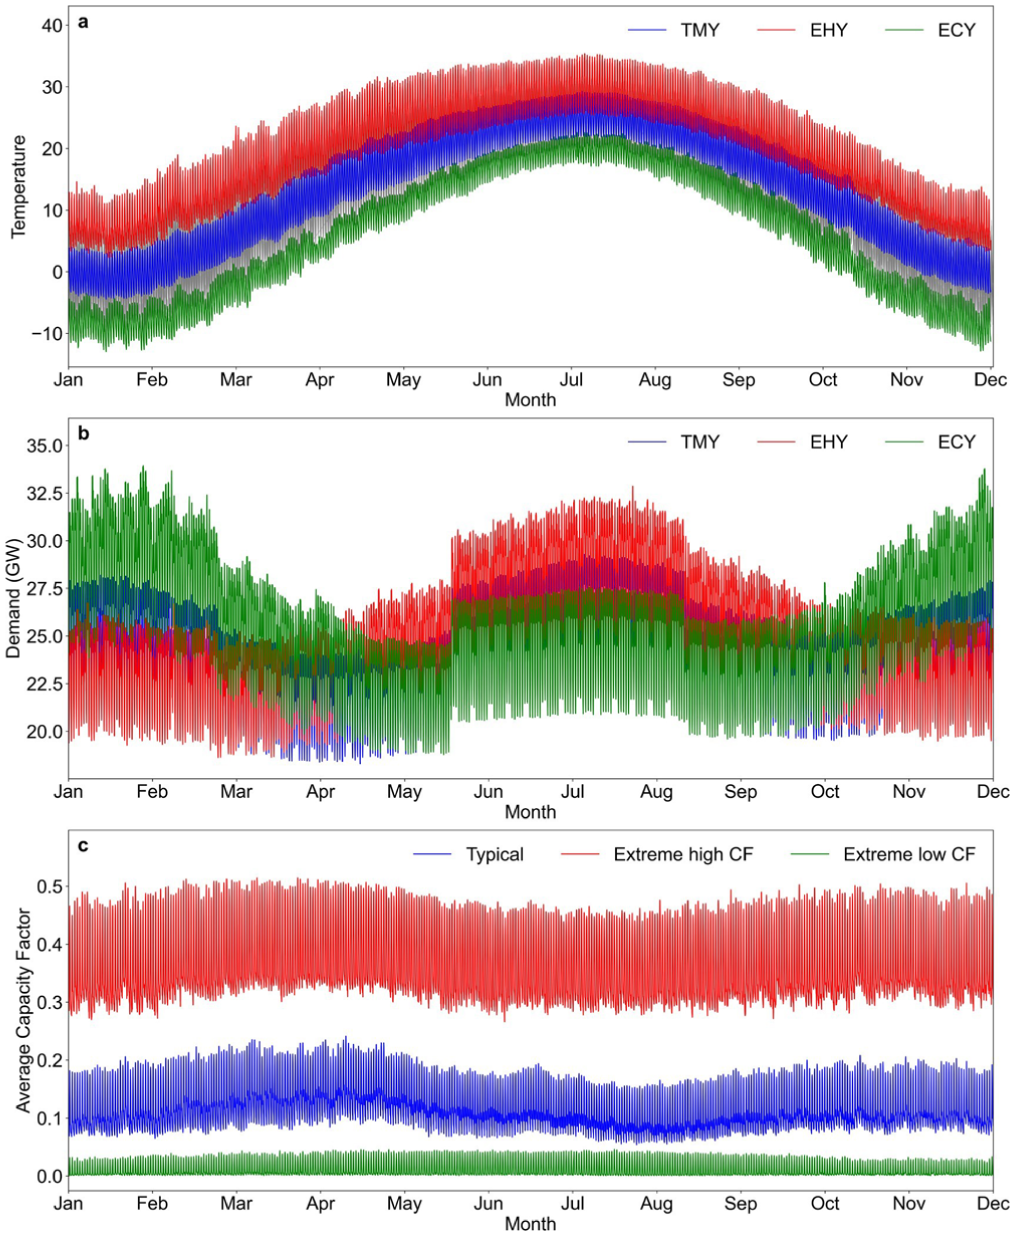
(a–c) Weather scenarios considering various weather factors (national average). (a) Three temperature-based weather scenarios. The gray lines represent historical hourly temperature data from 1956 to 2024 (69 years). (b) Hourly electricity demand curves generated under the three temperature scenarios. (c) Capacity factor scenarios for VRE generation. The figure shows the average capacity factors for wind and solar renewables.
To capture the impacts of weather factors beyond temperature on renewable energy generation, this study constructs three capacity factor scenarios following the methodology described in Section 3.2. As shown in Figure 2c, there is significant interannual variability in wind and solar capacity factors, with substantial differences observed for the same hour across different historical years. The annual average capacity factors for the H, M and L scenarios are 0.37, 0.12, and 0.01, respectively.
Considering the combined impact of various weather factors on both the supply and demand sides, extreme weather poses significant challenges to system reliability. Based on the welfare maximization model developed in Section 3, this study evaluates the reliability impacts under different weather scenarios without DR. Figure 3 illustrates the boxplot distribution of system reliability across provincial power systems under various weather scenarios. Among the extreme weather scenarios, the ECY-L scenario leads to the greatest decline in system reliability, with a median reliability of only 77.63%. The EHY-L scenario follows at approximately 81.15%, leaving over 18% of demand unmet. Within each temperature scenario, variations in renewable capacity factors significantly affect reliability. Moreover, even with renewable capacity factors fixed at historical averages (M scenario), extreme temperatures still substantially reduce system reliability. These results highlight the importance of considering multiple weather factors in power system assessments. We further examine transmission congestion to characterize network related operational bottlenecks in the absence of DR. Without DR, the hourly inter-provincial transmission power bound (equation (7)) becomes binding (i.e., exhibits a non-zero shadow price) in 1.59 out of 8,760 hours (0.02%), averaged across provinces and scenarios. This indicates that congestion is concentrated in a small number of critical hours when power balance becomes challenging, highlighting the importance of additional short-term operational flexibility. Finally, we benchmark the weather-related welfare losses from model simulation against an observed event, the 2022 Sichuan drought and heatwave induced power deficits. For Sichuan Province, the welfare loss under drought–heatwave conditions (EHY-L), relative to the common condition (TMY-M), is estimated at approximately 15.07 billion yuan after scaling to the eleven-day curtailment period. This estimate is comparable to the existing estimate of 12.3 billion yuan in production losses reported by (Li et al. 2025).
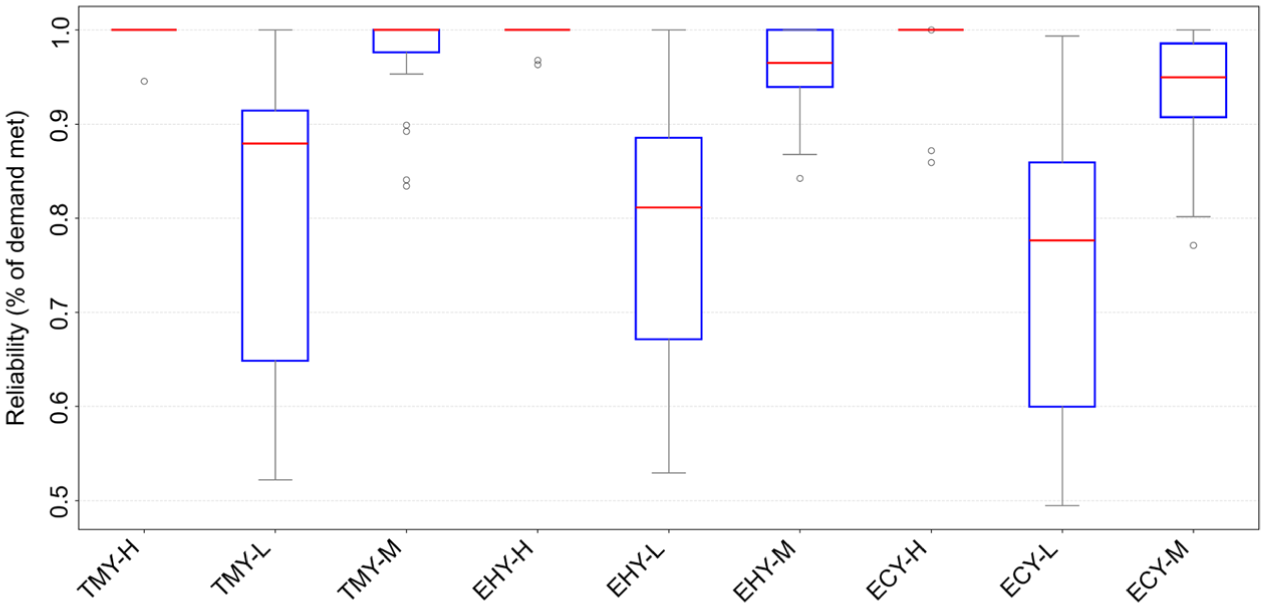
Power system reliability under different weather scenarios.
The sensitivity of power systems to extreme weather varies across different provinces. Figure 4 shows reliability levels under various weather scenarios across provinces. Regionally, the North China Grid (NCG) faces greater reliability challenges under extreme weather, primarily due to a higher share of temperature-sensitive sectors such as services and residential loads. This also highlights the region’s limited capacity to mitigate extreme weather impacts through interprovincial transmission, underscoring the need to enhance the use of flexibility resources.
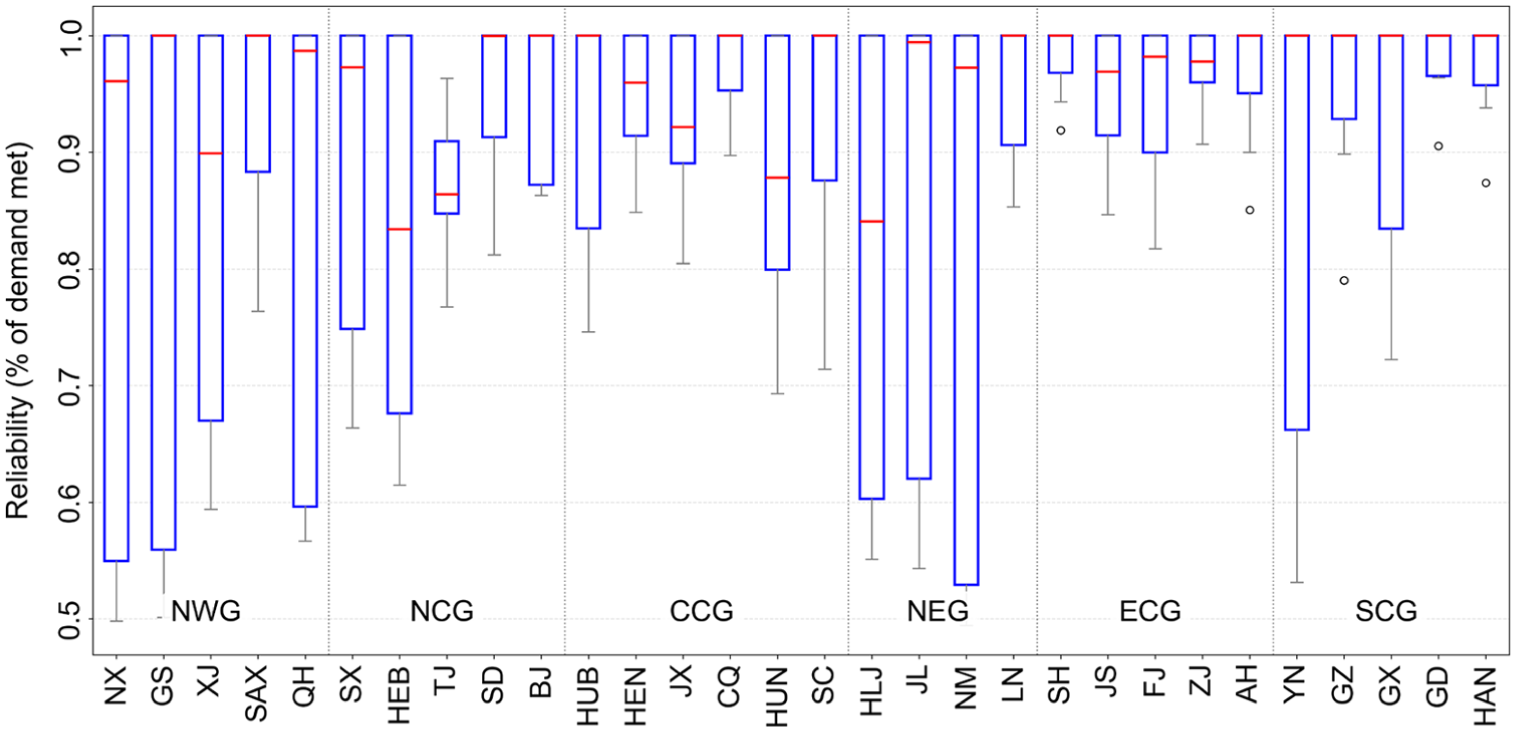
System reliability under various weather scenarios across provinces.
4.2. Welfare Improvement Effects of DR Under Extreme Weather
As an emergency measure against extreme weather, market-based DR can provide abundant flexibility resources for the power system, effectively reducing the risk of electricity shortages. This section quantifies the impact of DR on system reliability and welfare under extreme weather scenarios. Figure 5 presents boxplots of the distribution of welfare impacts across provinces under various extreme weather scenarios. The median unmet demand drops from 1 percent without DR to zero, effectively eliminating electricity shortages in most scenarios. The average unmet demand also decreases significantly from 6.16% to 5.20%. Meanwhile, DR causes only a slight rise in system operating costs, with median variable costs increasing from 165.47 to 172.87 yuan/MWh and average costs from 175.80 to 180.71 yuan/MWh. These results highlight DR’s key role in enhancing power reliability during extreme weather and offer strong support for policymakers.
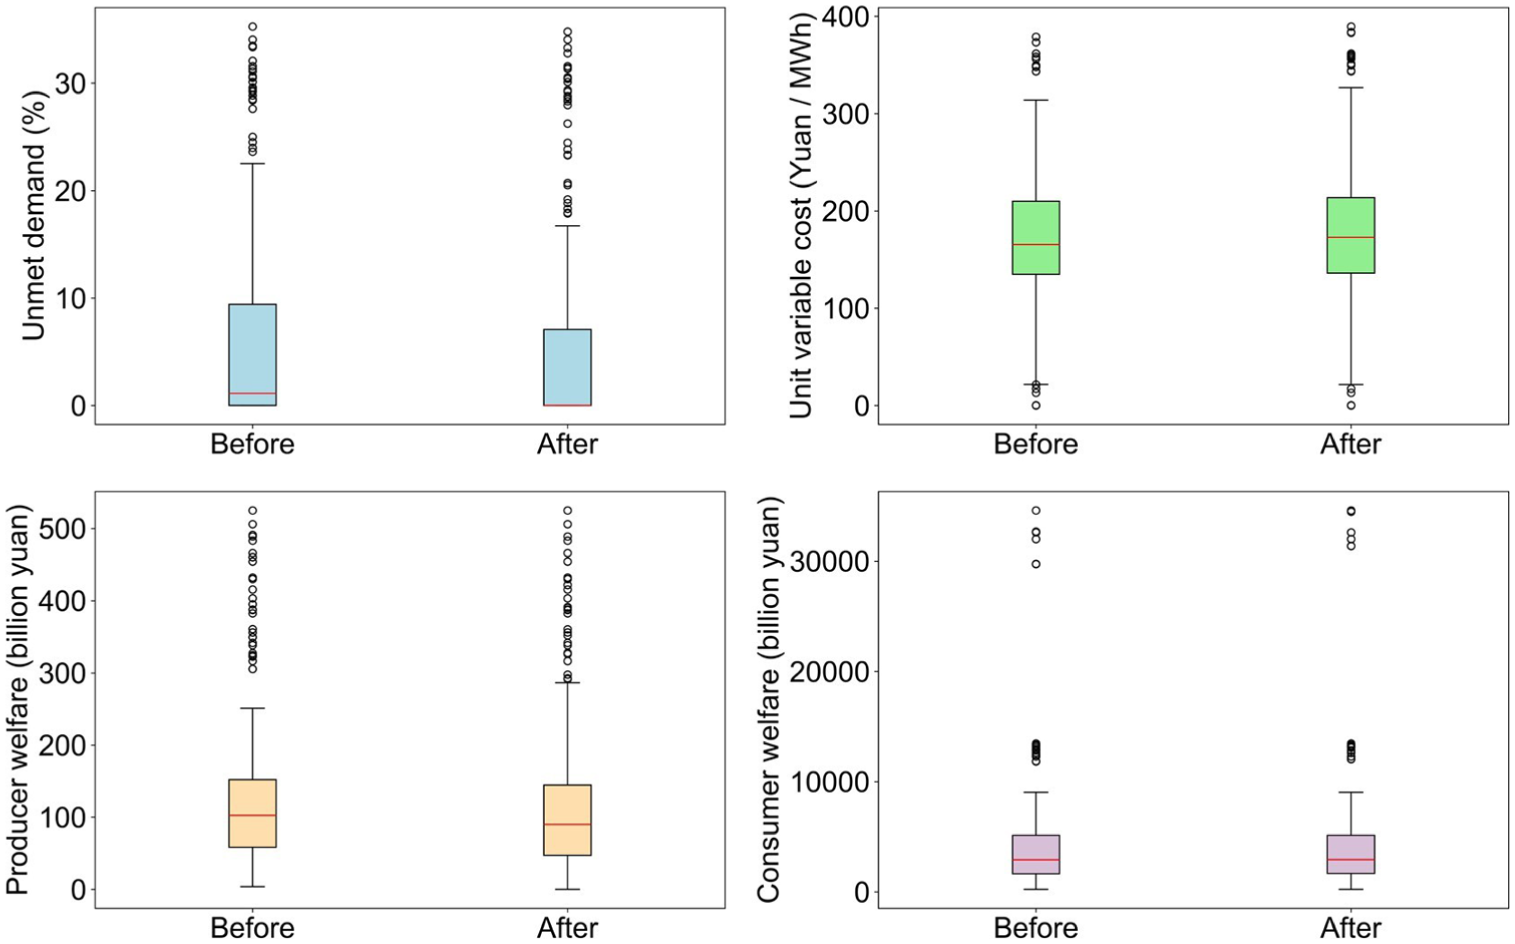
Impact of DR on reliability and welfare.
Changes in operating costs and reliability affect producer and consumer welfare. On the supply side, rising variable costs and reduced demand lead to a decline in producer surplus. On the demand side, although the median consumer welfare shows little change, average consumer welfare increases significantly by over 50 billion yuan considering the impact of extreme conditions. Consumer welfare gains from DR exhibit a skewed distribution, with substantial benefits occurring mainly under extreme scenarios. Considering both supply and demand effects, DR clearly improves total welfare. The average welfare increase per province reaches 40.49 billion yuan, approximately 0.10% of provincial GDP. Although extreme weather events do not last throughout the year in reality, the benefits of DR remain substantial even over shorter time horizons. For example, during the eleven-day electricity shortage caused by the 2022 heatwave in Sichuan, an optimally priced demand response mechanism would reduce welfare losses by 1.95 billion yuan. To ensure policy sustainability and equity, cost allocation mechanisms should be designed to balance the burden between supply and demand sides, thereby enhancing overall welfare.
4.3. Key Factors Influencing the Welfare Effects of DR
4.3.1. DR Compensation Pricing
The core of improving the DR mechanism design lies in identifying the key factors that influence its welfare effects. Among these, achieving a reasonable compensation price is crucial to achieve welfare maximization. Results from the welfare maximization model reveal significant provincial variation in optimal DR compensation prices (see Figure 6). Considering the impact of extreme weather, Beijing (BJ) has the highest compensation price at 3,175 yuan/MWh, over three times the local electricity price. In contrast, major electricity exporting provinces such as Ningxia (NX), Inner Mongolia (NM), and Qinghai (QH), which have abundant local generation, have compensation prices below 500 yuan/MWh, close to their electricity prices.
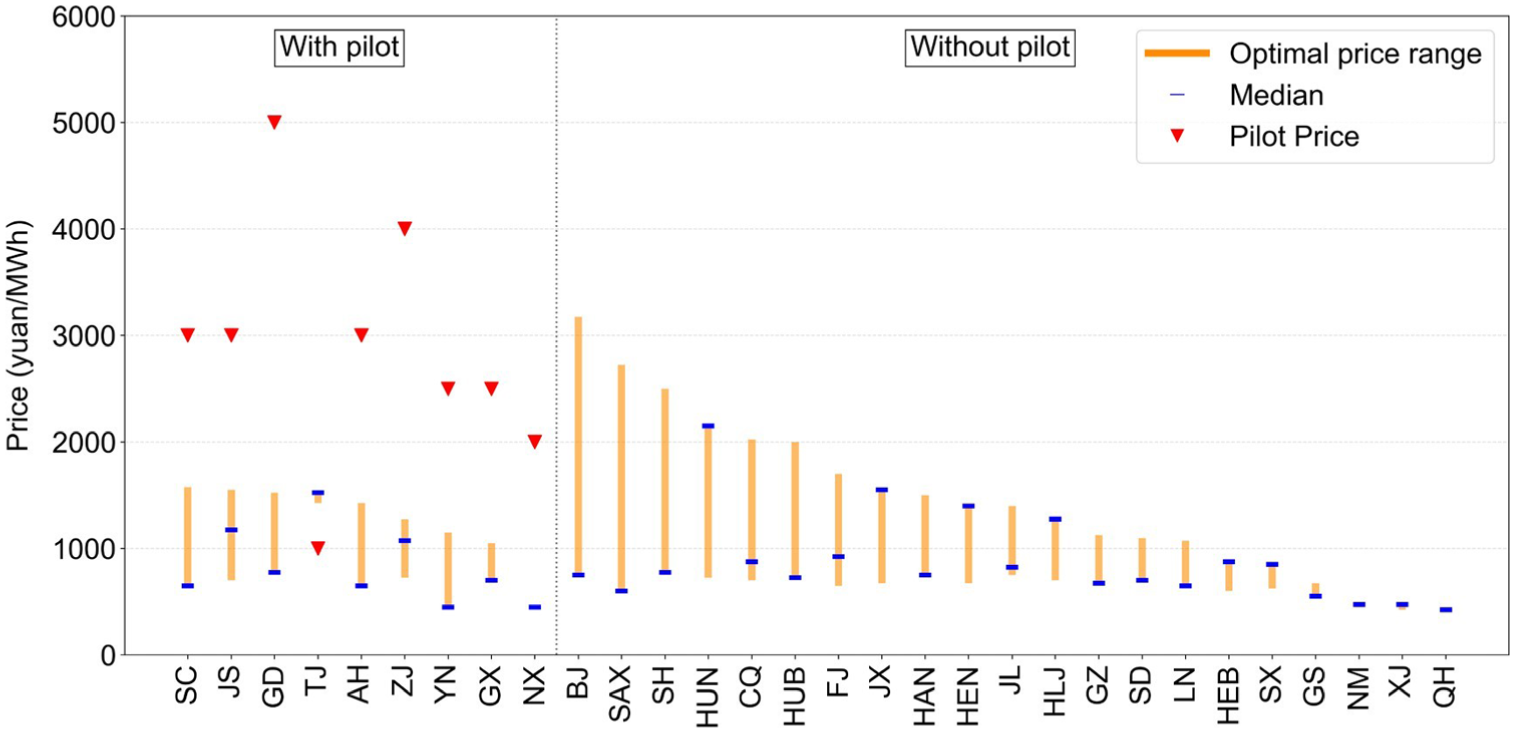
Range of optimal DR compensation prices and current pilot prices.
Three main factors drive up the optimal DR compensation price in some provinces. First, developed regions such as Beijing and Shanghai have higher economic value per unit of electricity, raising the VOLL and equilibrium compensation prices. Second, provinces with a high share of renewable energy, like Hubei and Chongqing, are more sensitive to extreme weather and thus require greater flexibility. Third, local generation capacity, interprovincial transmission, and other flexibility resources also influence DR pricing.
Figure 6 further shows that current pilot provinces generally set compensation prices above the theoretical optimal values. Only nine pilot provinces have established explicit compensation prices, ranging from 1,000 to 5,000 yuan/MWh, which is approximately twice the theoretical optimal range of 425 to 3,175 yuan/MWh. This deviation reflects transaction costs resulting from imperfect market mechanisms. Currently, limited participant scope, low willingness to participate, and poor response capacity compel the government to offer higher compensation to ensure reliability. To address these pricing distortions, it is essential to expand DR coverage, optimize market pricing mechanisms, and enhance participation incentives.
Theoretically, optimal market-based DR pricing should balance the risk of electricity supply shortages against welfare losses from load reductions. While excessively high compensation prices mitigate shortage risks, they may lead to additional welfare losses from unnecessary load curtailment. Conversely, low compensation prices can undermine the system’s resilience to extreme weather, increasing shortage risks and overall welfare losses. Therefore, the relationship between compensation price and social welfare exhibits an inverted U-shape (see Figure 7).
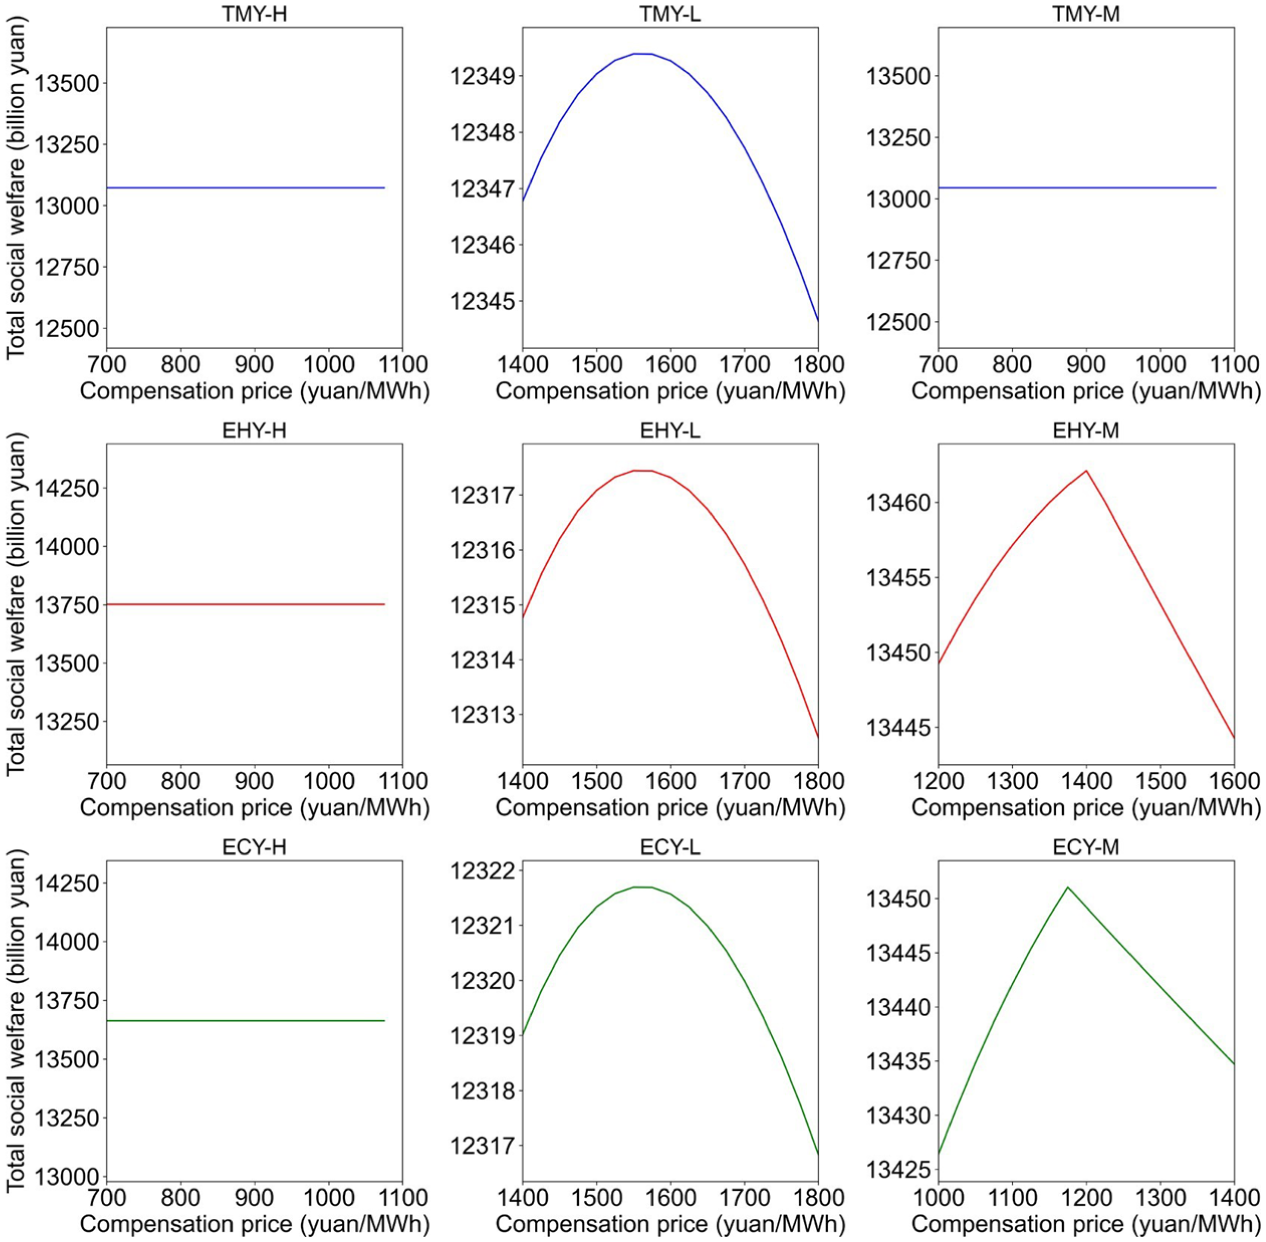
Relationship between welfare and DR compensation pricing.
Given the current average pilot compensation price of approximately 3,000 yuan/MWh, Jiangsu Province serves as an example to illustrate potential welfare losses from price distortions. The model estimates Jiangsu’s optimal upper compensation price at 1,550 yuan/MWh. Besides, the inverted U-shaped curve suggests that for every 10% increase above this optimal price, Jiangsu experiences a total welfare loss between 0.02% and 0.09% across different extreme weather scenarios. Under current pilot pricing, Jiangsu may face GDP losses ranging from 0.23% to 1.03% due to DR price distortions. Extrapolating to all pilot provinces, the estimated GDP loss ranges from 0.51% to 4.91%. Although extreme weather events do not last for an entire year in reality, a high compensation price during such periods can still generate substantial welfare losses over the DR implementation.
4.3.2. Renewable Energy Penetration
DR policy design needs to align with the power system’s long-term decarbonization goals. Considering that the continuous increase in VRE penetration will increase the system’s sensitivity to weather factors, it is necessary to evaluate its impact on the long-term value of DR. This study uses data on new installed capacity and demand growth from each province’s 14th Five-Year energy plan, applying linear extrapolation to project the power system structure over the next decade and evaluate DR’s long-term welfare effects. Figure 8 presents the welfare effects of DR across provinces under varying weather scenarios and penetration levels, indicating that in most provinces these effects increase markedly as VRE penetration rates rise. On average, a 1% increase in VRE penetration is associated with an estimated 0.01% increase in total welfare, equivalent to approximately 12.58 billion yuan, indicating a positive but modest welfare elasticity with respect to VRE integration. Provinces with steeper slopes in the scatter plot exhibit greater sensitivity of DR’s welfare effect to VRE changes.
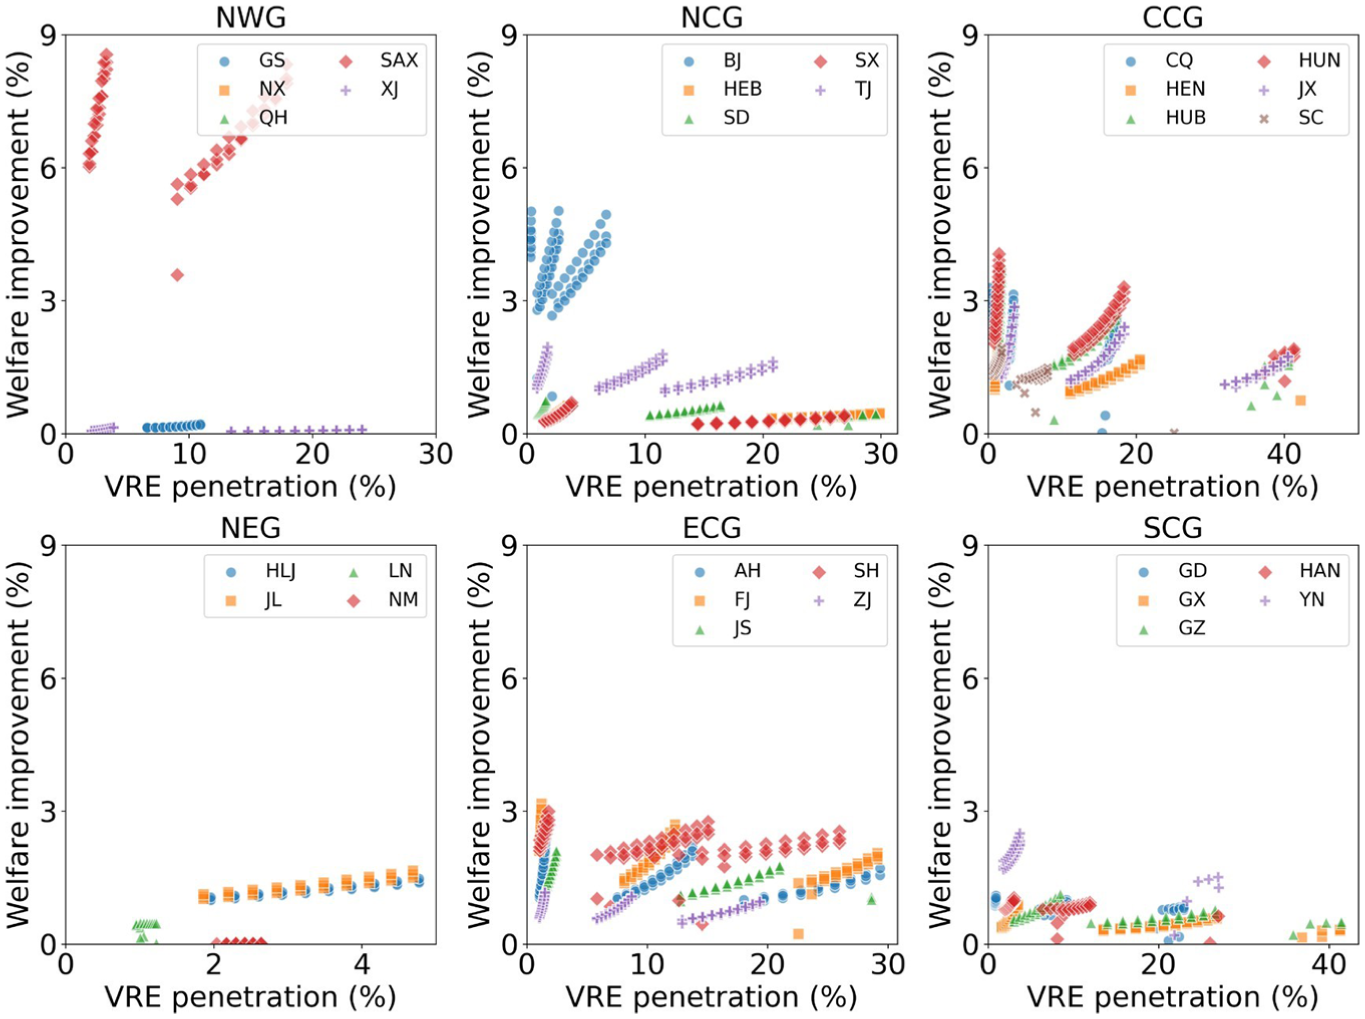
Welfare improvement effect of DR with increasing VRE penetration.
Moreover, at the same penetration level, the welfare improvement effect of DR varies significantly among provinces. This indicates that other characteristics of power systems, such as flexible generation resources and interprovincial transmission capacity, have a notable influence on the value of DR. Therefore, policymakers need to comprehensively consider local resource endowments when designing DR programs.
5. Conclusions and Policy Implications
5.1. Conclusions
With climate change and the rising penetration of renewable energy, demand-side flexibility has become essential for maintaining power system reliability under extreme weather shocks. To improve electricity market design for such conditions, this paper develops a welfare maximization model and defines nine weather scenarios to assess the value of DR. It evaluates DR’s welfare impacts and effects on system reliability, estimates the theoretical optimal DR compensation price, and examines welfare distortions in pilot provinces. In the context of long-term decarbonization, the analysis highlights compensation pricing and VRE penetration as key factors in designing an effective DR mechanism. The main conclusions are as follows:
First, extreme weather shocks impact both the supply and demand sides of the power system, significantly reducing overall reliability. Scenario analysis shows that extreme temperatures combined with low renewable capacity factors have the most severe effects. In the combined ECY-L scenario, median system reliability falls to 77.63%. Regionally, the North China Grid (NCG), which includes Beijing, Tianjin, and Shandong, is particularly vulnerable to such shocks.
Second, DR can effectively reduce the negative impacts of extreme weather. Across all provinces and scenarios, average unmet demand declines from 6.16% to 5.20%. While a modest increase in unit costs and reduced demand slightly lower producer welfare, the substantial improvement in electricity accessibility greatly increases consumer welfare, resulting in a net positive effect on total welfare.
Third, the welfare effect of DR is sensitive to pricing. The relationship between compensation price and total welfare follows an inverted U-shape. In current pilot provinces, compensation prices are roughly twice the theoretical optimum, creating welfare distortions that may cause GDP losses of approximately 0.51% to 4.91%.
Finally, higher VRE penetration increases the system’s sensitivity to weather, thereby enhancing the social value of DR. On average, a 1% rise in VRE penetration leads to about a 0.01% increase in total welfare. However, the magnitude of this effect varies across provinces due to differences in generation mix and flexibility resources. These results highlight the need for policymakers to expand DR coverage, refine market designs, and leverage synergies between DR and other flexibility options.
Although this study systematically evaluates the impacts of DR on reliability and welfare under extreme weather, several issues are expected to be addressed in the future studies. First, optimal mechanism design and welfare analysis rely on high-precision parameters such as hourly electricity demand and VOLL. However, the required high resolution data are not readily available, and estimating time varying parameters, including year specific load profiles and evolving consumption behavior, is beyond the scope of this paper. As a result, our analysis cannot fully replicate every detail of real-world conditions or capture how long-run parameter changes affect DR mechanism. Future work that combines finer spatiotemporal consumption data with time varying parameters informed by field surveys would improve the accuracy of welfare measurement. Second, the mechanisms through which different flexibility resources influence energy use are complex. Given the scope of this study, we do not explicitly model the interactions among multiple flexibility options. In particular, how DR interacts with other sources of flexibility, such as energy storage and interprovincial transmission, as well as with system operations under congestion management, remain to be explored in future work.
5.2. Policy Implications
Based on the conclusions above, this paper proposes the following three policy implications to promote DR market design for extreme weather resilience:
First, since market-based DR effectively enhances power system reliability, it is necessary to further expand both the scope and participant base of DR programs. Coverage should gradually extend from the current pilot provinces to a nationwide scale, while participation should broaden beyond limited industrial sectors to include service and residential users. This expansion will support meeting the national target of achieving 3 to 5 percent maximum DR capacity.
Second, the market mechanism design for demand response requires further improvement and better coordination. For compensation pricing, it is essential to accurately capture the willingness to pay among different demand-side entities, develop rigorous pricing models, and implement effective pricing strategies. Additionally, policies like peak pricing and time-of-use tariffs should be integrated with DR programs to ensure stable and adequate funding. Due to the inherent uncertainties in DR implementation, such as unpredictable load fluctuations, it is essential to establish a balancing fund to manage revenues and expenditures collectively with regular financial settlements.
Finally, it is crucial to coordinate DR with other flexibility resources to address challenges posed by extreme weather and increasing VRE penetration. This study shows that provincial power system structures, such as flexible generation capacity and interprovincial transmission, play a key role in system resilience. Therefore, designing market mechanisms that integrate coordinated policies across generation, transmission, demand, and storage is essential to maximize benefits.
Footnotes
Appendices
Acknowledgements
The authors would also like to extend special thanks to the editor and the anonymous reviewers for their constructive comments and suggestions, which improved the quality of this article.

Author Contributions
Boyan Zhang: Conceptualization, Methodology, Writing – original draft
Renhao Wang: Software, Visualization
Mingwei Yu: Methodology
Jiayi Tang: Software, Data curation
Hao Chen: Conceptualization, Writing – Review & Editing
Zhang-Ming Chen: Writing – Review & Editing
Funding
The authors disclosed receipt of the following financial support for the research, authorship, and/or publication of this article: This work is supported by the Fundamental and Interdisciplinary Disciplines Breakthrough Plan of the Ministry of Education of China (JYB2025XDXM905), the National Natural Science Foundation of China [grant number 72274198, 72274206, L2524084] and the Outstanding Innovative Talents Cultivation Funded Programs 2025 of Renmin University of China.
Declaration of Conflicting Interests
The authors declared no potential conflicts of interest with respect to the research, authorship, and/or publication of this article.