






Abstract
We conducted this systematic review to classify the evidence-base status for high-probability request sequence (HPRS) as a strategy to improve students’ behavioral outcomes in general and special education settings across the K-12 continuum. Specifically, the purpose of this review was to determine whether HPRS could be classified as an evidence-based practice according to Council for Exceptional Children’s Standards for Evidence-Based Practices in Special Education employing a modified, weighted coding scheme specifying methodologically sound studies as meeting 80% or more of components across quality indicators (QIs). Two of the 22 included studies met all QIs, and 16 studies met or exceeded our 80% weighted criterion. Based on this body of evidence, we classified HPRS in K-12 school settings as potentially evidence based. We offer a discussion of educational implications, limitations, and future directions.
Educators can support students who engage in challenging behavior and/or low levels of compliance through the successful implementation of efficacious classroom management and instruction designed to promote students’ academic, behavior, and social success. Historically, classroom management and instructional strategies have focused on reactive, contingency-based behavior interventions (Cooper, Heron, & Heward, 2007). Although punishment procedures (e.g., response cost, time-out) may decrease undesired behavior in the short term, they are reactive in the sense that the teacher must wait for a challenge to occur before intervening. Furthermore, the procedures typically do not focus on building students’ skills to include more desirable behaviors (Lee, 2005; Umbreit, Ferro, Liaupsin, & Lane, 2007). In recent years, schools have emphasized proactive and preventive strategies to elicit desired behaviors and prevent challenging behaviors before they occur. For example, proactive strategies grounded in three-tiered prevention logic emphasize responding to students who engage in challenging behavior to prevent or reduce the future probability of the behavior (e.g., Positive Behavior Interventions and Supports, PBIS; Horner & Sugai, 2015; Comprehensive, Integrated, Three-tiered, Ci3T; Lane, Oakes, & Menzies, 2014).
One method to support students who engage in challenging behavior, such as students with and at-risk for emotional or behavioral disorders (EBDs), is targeting the antecedent conditions that precede challenging behaviors, such as noncompliance (Umbreit et al., 2007). Antecedent-based interventions developed as a component of applied behavior analysis (ABA) with the emergence of motivating operations and functional behavior assessments (Cooper et al., 2007). Antecedent-based interventions use stimuli occurring before student responding to promote desired behaviors and/or prevent problem behaviors from occurring. Antecedent-based interventions are effective for a range of students, including students who engage in challenging behavior, through the implementation of strategies that elicit desired behavior and make problem behavior less likely. Examples of such strategies include active supervision, precorrection, and high-probability request sequence (HPRS; Lane, Menzies, Ennis, & Oakes, 2015).
HPRS is one antecedent-based intervention with empirical support. In this intervention, a student is asked to complete a series of requests with which the individual has a high probability (high-p) of complying, followed by a request with a lower probability (low-p) of compliance, to create momentum for student success (Mace et al., 1988). HPRS can be embedded throughout tiered systems to support students with and without disabilities, although it is particularly well suited for students who engage in challenging behaviors associated with being noncompliant (Losinski, Sanders, Katsiyannis, & Wiseman, 2017). Much of the applied research on HPRS has focused on increasing student compliance and appropriate behaviors. However, HPRS has applicability for K-12 school-age students in areas beyond compliance, including low-p behaviors associated with academic, social–emotional, and communication domains (Killu, 1999). HPRS is an empirically supported practice that is also theoretically grounded in the construct of behavior momentum.
Theoretically Grounded in Behavior Momentum
Behavior momentum was first posited by Nevin, Mandell, and Atak (1983). Behavioral momentum is an analogy to the ideas of physical momentum, which asserts bodies in motion stay in motion, to describe one’s rate of responding and resistance to change following an alteration in reinforcement conditions. Like a rolling snowball accumulating mass and velocity, human behavior can have similar momentum associated with reinforcement of task completion to build momentum toward completion of subsequent tasks.
Behavior momentum serves as the theoretical basis for behavior momentum, interspersal, and HPRS. Behavior momentum technique consist of structuring a set of tasks, so that responses requiring less effort occur first and subsequent task demands increase in intensity (Burns et al., 2009). For example, multistep problems that increase in difficulty with each additional step are presented to students in sequential order (e.g., one-step problem, two-step problem). Having the momentum for success prior to the more difficult problems is theorized to increase the likelihood the student will put forth the effort needed to complete subsequent and more challenging problems. Interspersal technique consists of altering assignments by placing additional tasks that are brief and/or easier within sets of targeted tasks at varying ratios (Meadows & Skinner, 2005). For example, a math worksheet of 15 multiplication facts designed to build the student’s fluency (target problems; e.g., multiplications of 7s and 8s) might be altered to include multiplication math facts previously mastered and used for building success (interspersed problems; e.g., 2s, 5s, and 10s). These interspersed problems would be presented after every four or five target problems to increase the reinforcement density (e.g., feelings of success, task completion) of the worksheet. Finally, HPRS involves the delivery of three to five easy tasks with a known history of high-level learner compliance (i.e., the high-p requests) in quick succession immediately followed by the delivery of the target task with a known history of low-level learner compliance (the low-p request). For example, the teacher might ask students to write their name on their paper (high-p), circle the first problem they want to complete (high-p), star the last problem they want to complete (high-p), and begin the first problem (low-p). HPRS and interspersal technique are similar because they both increase the density of reinforcement; however, HPRS usually results in a richer schedule of reinforcement (Lee, Stansbery, Kubina, & Wannarka, 2005).
The objective of HPRS is to deliver successive known tasks that are typically performed correctly, and immediately follow their completion with reinforcement. The high-p requests should be (a) responses in which the student has a demonstrated history of compliance, (b) immediately followed by praise, (c) delivered in quick succession, (d) delivered immediately prior to the difficult tasks, and (e) take no more than a few seconds to complete (Storey & Homer, 1988). This results in the student experiencing contingencies associated with both positive (e.g., praise and success) and negative (e.g., task completion) reinforcement prior to the delivery of a task associated with failure, difficulty, and/or lower levels of reinforcement.
Previous Research and Lessons Learned
It is imperative school staff understand and know which interventions have a strong empirical base before implementation. Lee (2005) conducted a meta-analysis to synthesize the effects of high-p requests on low-p behaviors in applied settings, including schools. In total, 28 articles published between 1987 and 2001 were analyzed at the participant level. The majority of individuals were diagnosed with severe intellectual disabilities and ranged in age from birth to older than 20 years. Results indicated HPRS was effective in increasing compliance as demonstrated by percentage of nonoverlapping data parametric (PND) of 77.37 (SD = 28.51) across studies. Although comprehensive in examining HPRS’s effect for individuals with intellectual disabilities, the focus of the review was not to evaluate the methodological quality of included studies (Horner et al., 2005).
Losinski et al. (2017) recently conducted a meta-analysis examining interventions to increase compliance in school settings, including HPRS, behavior-specific praise, and errorless compliance training, among others. The authors applied quality indicators (QIs) for single-case research designs (SCRDs) posited in the Council for Exceptional Children’s (CEC; 2014) Standards for Evidence-Based Practices in Special Education (hereby referred to as Standards for EBPs) and calculated between-case standardized mean difference (BC-SMD) effect sizes and PND. In the six studies evaluating HPRS, PND averaged 89.65% and BC-SMD for the four studies meeting technical requirements averaged 2.47, indicating a large effect. Losinski and colleagues found HPRS to be a potentially evidence-based practice (EBP) for supporting students’ noncompliant behavior. Although rigorous, this review focused specifically on studies evaluating the effects of compliance or noncompliance as the dependent variable.
Finally, the meta-analysis from Cowan, Abel, and Candel (2017) focused specifically on the effectiveness of antecedent interventions grounded in behavior momentum to increase the compliance of learners with autism spectrum disorder (ASD) across settings (e.g., residence, community, school). In total, 16 articles published between 1995 and 2015 were analyzed by calculating effect sizes via omnibus improvement rate differences (IRDs). Methodological standards from CEC’s Standards for EBPs were also applied. Naturally occurring settings included home, school, and classroom but not hospital, clinic, or laboratory. Participants ranged in age from 3 to 13 years. Cowan et al. meta-analyzed studies utilizing either HPRS or task interspersal and found an overall mean omnibus IRD for the four studies that met CEC’s methodological standards to be 0.80 (95% confidence interval [CI] = [0.74, 0.87]). This rigorous review broadly examined behavior momentum and two of its three associated interventions for students with ASD. Although the authors examined methodological rigor and effect, their research questions did not address whether these strategies could be classified as an EBP.
Establishing an Evidence Base for HPRS in Traditional School Settings
In 2014, CEC released the Standards for EBPs outlining criteria for evaluating methodological rigor of empirical studies, as well as guidelines for classifying the evidence base of a given practice for specific populations and settings. Currently, HPRS is a widely used strategy with literature reviews supporting its effectiveness as demonstrated for students with a variety of disabilities and behavior support needs. We conducted this review to (a) examine the descriptive characteristics of all studies examining HPRS across K-12 students in traditional school settings; (b) report the degree to which these HPRS studies met the QIs reflective of methodologically rigorous research; (c) determine whether HPRS is an EBP, as defined by CEC’s Standards for EBPs and using a modified weighted coding criterion; and (d) explore the effect sizes of methodologically sound HPRS studies using within-case (log response ratio, LRR; Pustejovsky, 2017) and BC-SMD (Hedges, Pustejovsky, & Shadish, 2012, 2013) approaches. To date, HPRS has been evaluated to examine its effect or methodological rigor for specific populations (e.g., students with ASD) or outcomes (e.g., noncompliance). As such, we conducted an exhaustive search to examine HPRS, a low-intensity strategy, as broadly applied across traditional K-12 students and settings (Lane et al., 2015).
Method
Article Selection Procedures
Article procurement included electronic, ancestral, and hand searches of the literature, initially conducted in summer 2016 and again at the end of 2017. Each step of the systematic search was implemented independently by two or more authors. The electronic search included six databases: Academic Search Complete, Psychology and Behavioral Sciences Collection, Education Abstracts (H.W. Wilson), Educational Resources Information Center (ERIC), ProQuest Research Library, PsycARTICLES, and PsycINFO. The following search string was used to identify potential records: all(high probability request sequence) OR all(high-probability request sequence) OR all(high prob* request) OR all(high-prob* request) OR all(high p request sequence) OR all(high-p request sequence) OR all(request sequence) OR all(command sequence) OR all(interspersed request) OR all(behav* momentum). Although interspersal request and behavior momentum were not the focus of our study, we included these terms in our search because these strategies have been used interchangeably in the literature. Primary and secondary coders read the 644 article titles and abstracts to determine whether they met inclusion criteria (description to follow). A consensus model was used to settle disagreements of records at each step of the systematic search, and the article was read in full and discussed until agreement was achieved.
Second, in an iterative process, ancestral and hand searches were conducted to procure additional studies. Primary and secondary coders conducted independent ancestral searches of all included studies, as well as previous reviews related to HPRS (Banda, Neisworth, & Lee, 2003; Cowan et al., 2017; Killu, 1999; Lee, 2005; Losinski et al., 2017). Similarly, two coders conducted hand searches of all journals featuring two or more identified articles beginning in 1987 (year of earliest published included study) to December 2017: Education and Treatment of Children, Journal of Applied Behavior Analysis, Journal of Behavioral Education, Preventing School Failure, Psychology in Schools, and Research and Practice for Persons with Severe Disabilities. Across electronic, ancestral, and hand searches, 21 studies met inclusion criteria. For number of articles identified, assessed for eligibility, and ultimately included at each step of the search—as well as interrater agreement (IRA)—see Figure 1 (Moher, Liberati, Tetzlaff, Altman, & The PRISMA Group, 2009).

Preferred reporting items for systematic reviews and meta-analyses flow diagram.
Inclusion Criteria
Studies were examined and included if they met the following inclusion criteria. First, the independent variable was HPRS, which we defined as an intervention in which three to five high-p requests are presented and immediately followed by a low-p request. Although similar to high-p requests, behavior momentum technique (e.g., Burns et al., 2009; Vostal & Lee, 2011) and interspersal technique (e.g., Meadows & Skinner, 2005) were excluded because these interventions do not follow the same instructional procedures as HPRS. Second, the dependent variables included one or more student-level outcomes focusing on academic, behavior, and/or social domains. Third, participants were school-age students across the K-12 continuum. Early childhood–age and preschool-age students were excluded because school-based demands differ from those in K-12 settings. Fourth, the study occurred in a K-12 traditional school setting, including general, special education, and inclusive classroom settings. Daycare centers, residential treatment centers, home settings, and clinics were excluded given the unique needs of students served. Fifth, studies needed to employ an experimental design, including single-case (e.g., withdrawal, alternating treatment design; Ledford & Gast, 2018) and group-comparison (e.g., randomized experiments, nonrandomized quasi-experiments, regression discontinuity designs; CEC, 2014) designs. Finally, articles were published in peer-review journals in English. Book chapters and dissertations were omitted as they may not have been evaluated through the peer-review process.
Coding Procedures
Descriptive coding
To map the literature and provide a descriptive context of included studies, two authors coded descriptive characteristics related to participants, settings, and studies. At the participant and setting levels, we coded (a) school/classroom context, (b) subject/activity, (c) gender, (d) student label (i.e., disability category/diagnosis, at-risk status, referral), (e) age/grade, and (f) intervention agent. At the study level, we coded (a) high-p and low-p identification, (b) high-p behaviors, (c) low-p targeted behaviors, (d) treatment integrity, (e) design, (f) dependent variable, and (g) social validity. IRA was 98.37%.
Quality indicators coding
To appraise the methodological quality of include studies, we used a coding protocol developed by Lane, Common, Royer, and Muller (2014). As no group-comparison design studies were included in this review, we focused on the 22 components specific to SCRD across all eight QIs described in Standards for EBPs. This included context and settings, participants, intervention agent, description of practice, implementation fidelity, internal validity, outcome measures/dependent variables, and data analysis. Three authors were trained to reliability of coding procedures with a criterion of 85% or higher across three consecutive articles not included in this review and coded by a senior scholar. Average IRA across training articles and coders were as followers (a) 87.88 (SD = 2.63), (b) 95.45 (SD = 0.00), and (c) 93.80 (SD = 5.38).
All included articles were coded in full by two authors independently. Disagreements were resolved through a consensus process. Each component within every indicator was given a score of one (met), zero (not met), or not applicable (NA). We reported the degree to which each QI was met using a weighted coding scheme in which each component constituting an indicator could contribute partially. Specifically, the number of components met within each indicator was summed and divided by the total number of components possible within each indicator. This weighted coding scheme has been utilized across a range of previous systematic reviews (Ennis, Royer, Lane, & Griffith, 2017; Royer, Lane, Cantwell, & Messenger, 2017). IRA percentages were calculated by dividing the number of QI component agreements by the number of component agreements plus disagreements multiplied by 100. IRA across studies averaged 94.57% (SD = 5.09; range = 80.95–100).
Methodological QIs
We coded QIs according the guidelines provided by CEC (2014) and Cook et al. (2015) with the following clarifications and exceptions (see ci3t.org for coding sheet).
1.0 Context and setting
This included one component: 1.1 Context/Setting. This component was considered met if at least one setting/context feature (e.g., region, type of school/classroom) was described (Lane, Common et al., 2014).
2.0 Participants
This included two components. To meet 2.1 Participant description, at least one demographic element (e.g., age, gender) needed to be reported (Lane, Common et al., 2014). To meet 2.2 Participant disability/at-risk status, studies needed to describe participants’ disability or risk status and method for determining status (e.g., standardized assessment, interdisciplinary team; Lane, Common et al., 2014). We clarified this component for studies eliciting teacher nomination (e.g., based on concerns) as insufficient unless additional details enabling replication were provided (Lane, Common et al., 2014). This component was considered nonapplicable for studies not including participants with disability/at-risk status.
3.0 Intervention agent
This included two components. To meet 3.1 Role description, studies needed to describe intervention agent role (e.g., researcher, teacher) and preferably background variables, although the latter was not required. To meet 3.2 Training description, studies needed to specify detailed information on how intervention agent(s) received training and how trainers checked for understanding (e.g., trained to criterion, role-play).
4.0 Description of practice
This included two components. To meet 4.1 Intervention procedure, studies needed to provide detailed description of intervention procedures and intervention agent’s actions. For 4.2, Materials description, investigators needed to include description of materials needed (e.g., pools of high-p and/or low-p requests) to implement the independent variable (IV).
5.0 Implementation fidelity
This included three components. To meet 5.1 Implementation fidelity assessed/reported, studies needed to assess and report implementation fidelity related to adherence using direct, reliable measures. To meet 5.2 Dosage or exposure assessed/reported, studies needed to assess and report implementation fidelity related to dosage or exposure to treatment. In general, this was considered met if duration of intervention sessions (e.g., 10 min) and how long the intervention was in place (e.g., length of time, reported graphically) were reported (Lane, Common et al., 2014). To meet 5.3 Assessed across relevant elements/throughout study, studies needed to (a) assess and report implementation fidelity regularly and throughout the intervention and (b) specify when, where, and for whom fidelity was assessed and report fidelity. This was considered present if any mention of assessing implementation fidelity occurred across participants, settings, intervention agents, or intervention conditions. We did not require fidelity measurements for each condition/phase if an aggregate measure across different time points was provided (Lane, Common et al., 2014). If neither adherence (5.1) nor dosage (5.2) was assessed, 5.3 was not applicable.
6.0 Internal validity
This included nine components, of which six pertained to SCRD. To meet 6.1 Independent variable systematically manipulated, the researcher was required to control and systematically manipulate the IV (CEC, 2014) and measure treatment fidelity of intervention (Lane, Common et al., 2014). This prerequisite was established given lack of implementation fidelity data raises questions about the accuracy of implementation and exposes the experimental design to possible threats to internal validity (Lane, Kalberg, & Shepcaro, 2009). To meet 6.2 Baseline description, studies needed to describe baseline conditions, such as who did what to whom and under what conditions (Lane, Common et al., 2014). To meet 6.3 No or limited access to IV during baseline, studies needed to explicitly state baseline conditions did not have exposure to intervention (measurement of this was preferred). To meet 6.5 Three demonstrations of experimental effect, design must allow for the possibility of three demonstrations or replications of an experimental effect at three different time points. To meet 6.6 Baseline: Minimum three data points & established pattern, single case designs with a baseline phase needed to include at least three data points unless justified by study author. This component was not applicable to SCRDs not requiring baseline (e.g., alternating treatment designs) although if a baseline was included, this component was assessed. Finally, to meet 6.7 Controls for threats to internal validity, a commonly accepted SCRD (Ledford & Gast, 2018) with procedural integrity was required (Lane, Common et al., 2014).
7.0 Outcome measures/dependent variables
This included six components, of which five pertained to SCRD. To meet 7.1 Socially important, the social significance of the goals, social appropriateness of the procedures, and/or social importance of the effects needed to be discussed (e.g., introduction or discussion) and/or be explicitly measured and reported (e.g., interview, survey) with stakeholders (Lane, Common et al., 2014). To meet 7.2 Description of dependent variable (DV) measures, studies needed to clearly define and describe each DV and use a valid measurement system specified with enough detail to support replication. To meet 7.3 Reports effects on the intervention on all measures, studies needed to report the effects of the intervention on all findings across outcome measures. To meet 7.4 Measured repeatedly (minimum three data points per phase), investigators needed to include at least three data points per phase. To meet this component, studies needed to measure the outcome measures with appropriate frequency and timing (e.g., minimum of three data points per phase [e.g., withdrawal, multiple baseline, changing criterion design]; at least four repetitions of alternating sequence [e.g., alternating treatment design]). Finally, for 7.5 Adequate interobserver agreement (IOA), investigators needed to provide evidence of adequate IOA by meeting minimal standards across participants and dependent variables (i.e., IOA ⩾ 80%, Kappa ⩾ 60%; CEC, 2014). This component was considered met for aggregated data if the study stated IOA occurred across participants/conditions and if averages met specified levels and any reported range did not fall below 60% IOA (Lane, Common et al., 2014).
8.0 Data analysis
This included three components, of which only one pertained to SCRD. To meet 8.2 Graph clearly represents outcome data, the study needed to provide a single-case line graph clearly presenting all outcomes, across all study phases for each unit of analysis (CEC, 2014).
Evaluation Procedures for Determining Evidence- Based Status
We applied CEC’s (2014) Standards for EBPs to determine the extent to which HPRS in traditional school settings across the K-12 continuum qualified as an EBP. Specifically, we employed a modified 80% weighted QI criterion (Lane et al., 2009) and defined methodologically sound as studies meeting 80% or more of all eight QIs (Common, Lane, Pustejovsky, Johnson, & Johl, 2017; Ennis et al., 2017; Royer et al., 2017) rather than CEC’s (2014) absolute QI criterion. A weighted criterion emphasizes methodological rigor existing on a continuum (e.g., no rigor, some rigor, high rigor) rather than as binary (no rigor, has rigor); this allows for the inclusion of high quality studies not meeting all components across all QIs in the evidence-based decision-making process, but were methodologically rigorous and of high quality (Ennis et al., 2017; Lane et al., 2009).
Methodologically sound studies were evaluated as establishing either positive effects, neutral or mixed effects, or negative effects. To have positive effects, a study must have a minimum of three cases, of which 75% must demonstrate a functional relation between the IV and therapeutic changes in the DV with no evidence of counter-therapeutic effects (e.g., increase in level or trend when a decrease was expected) with the remaining being neutral or mixed (i.e., no counter-therapeutic trends). A study was classified as negative effects, if 75% of cases demonstrated a functional relation between IV and unfavorable changes in DV (e.g., decrease in level or trend when an increase was expected; harmful effects). A study was classified as mixed/neutral effects if the study neither qualified for a classification of positive or negative effectives. The presence of a functional relation was evaluated independently by two authors by examining data within and across phases for changes in level (e.g., low, moderate, or high), trend (e.g., increasing, decreasing, or flat), and stability (stable, variable; Ledford & Gast, 2018); IRA of study effect classifications was 75%, with discrepancies reconciled through consensus model.
CEC (2014) classified practices using the following categories: (a) evidence based, (b) potentially evidence based, (c) mixed effects, (d) insufficient evidence, or (d) negative effects. For a practice to be considered evidence based, based on SCRD (no group-comparison studies were identified in this review), it must be supported by five single-case studies with positive effects and 20 or more individual participants across studies. No studies can have negative effects, and the ratio of positive to neutral/mixed effects must be 3:1 or greater (CEC, 2014). To be considered potentially evidence based, two to four single-case studies with positive effects are required. No studies can have negative effects, and the ratio of positive to neutral/mixed effects must be 2:1 or greater. See CEC’s (2014) Standards for EBPs for mixed evidence negative effects and insufficient evidence classification requirements.
Data Extraction and Analysis
Data extraction procedures
Published graphs were digitized using data extraction software WebPlotDigitizer (Version 3.12; Rohatgi, 2017), which provides highly reliable extracted data that are nearly identical to original data (Shadish et al., 2009). Coordinates of each data point were recreated digitally, exported, and saved into a spreadsheet for analysis by one author and made reliable to original graphs by a second author prior to analysis.
Effect size analysis
In addition to determining study effect according to the Standards for EBPs for this systematic review, we attempted to calculate two effect sizes for methodologically sound studies: LRR (Pustejovsky, 2017) and BC-SMD (Hedges et al., 2012, 2013) To be useful for meta-analytic purposes, effect sizes should be in a metric that can be validly compared across studies (Borenstein, Hedges, Higgins, & Rothstein, 2009; Pustejovsky, 2017). To date, these metrics have primarily been conceptualized for demonstration designs (Hedges et al., 2012, 2013; Pustejovsky, 2017; Zimmerman et al., 2018), which are SCRD that answer questions related to whether an IV is effective for changing the DV of interest (e.g., A-B-A-B, multiple baseline, changing criterion; Ledford & Gast, 2018). As such, comparison designs (e.g., alternating treatment), which are SCRDs that answer questions related to which IV is more effective/efficient for changing the DV of interest (e.g., alternating treatment, parallel treatments), were dropped from these analyses.
Between-case effect size
Hedges BC-SMD metrics (2012, 2013) are comparable with standardized mean differences from between-group experimental designs (e.g., Cohen’s d) and can be calculated for (a) single-case studies employing withdrawal/reversal (ABK) or multiple baseline designs and (b) studies containing three or more participants/cases. This method models single-case data with a hierarchical linear model, which considers the nested structure of SCRD data, a primary concern of most within-case effect sizes (Valentine, Tanner-Smith, Pustejovsky, & Lau, 2016). We employed Shadish, Zelinsky, Vevea, and Kratochwill (2016), which organized previously reported SCRD effect sizes into quartiles (lower, median, and upper), to interpret BC-SMD estimates: small = 0.37 to 0.97, medium = 0.98 to 1.86, and large ⩾ 1.87.
Within-case effect size
LRR effect sizes are metrics that conceptualize proportionate change for an individual case across two adjacent conditions (e.g., A1-B1, A2-B2). LRR is well suited for demonstration designs with outcomes measured through systematic direct observation of behavior (e.g., interval recording). Zero percent or near zero responding within a condition is not expected (Pustejovsky, 2018b). As such, contrasts with either near zero responding and/or from alternating treatment and parallel treatment designs did not meet the technical requirements for LRR. We calculated LRR using an online single-case effect size calculator (Pustejovsky, 2017), as defined by Pustejovsky (2018b):

For interpretation, we calculated the percent change formula (Pustejovsky, 2018b) in Excel using the following formula:
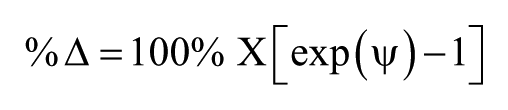
Due to the breadth of outcome variables and behavior measurement metrics (e.g., latency, duration, frequency), dependent variables were not recoded to reflect consistent therapeutic direction (e.g., downward, negative) and are reported by LRR estimate. For A-B contrasts with multiple comparisons (e.g., ABK), we followed recommendations to estimate LRR for each pair of adjacent phases, then we combined those estimates by averaging into a single summary effect size (Pustejovsky, 2018b). We dropped A-B contrasts not meeting technical requirements from analysis. Percentage change was calculated and is an intuitive way to interpret magnitude of effect from baseline to treatment level and represents directional percentage change between conditions (Pustejovsky, 2018b).
Results
In total, 22 studies met inclusion criteria across 21 articles (see Table 1). Lee, Belfiore, Scheeler, Hua, and Smith (2004) included two experiments, both of which met inclusion criteria. Lee et al. (2006) included two experiments, one of which met inclusion criteria.
Descriptive Results of Included Articles: Participant and Setting.
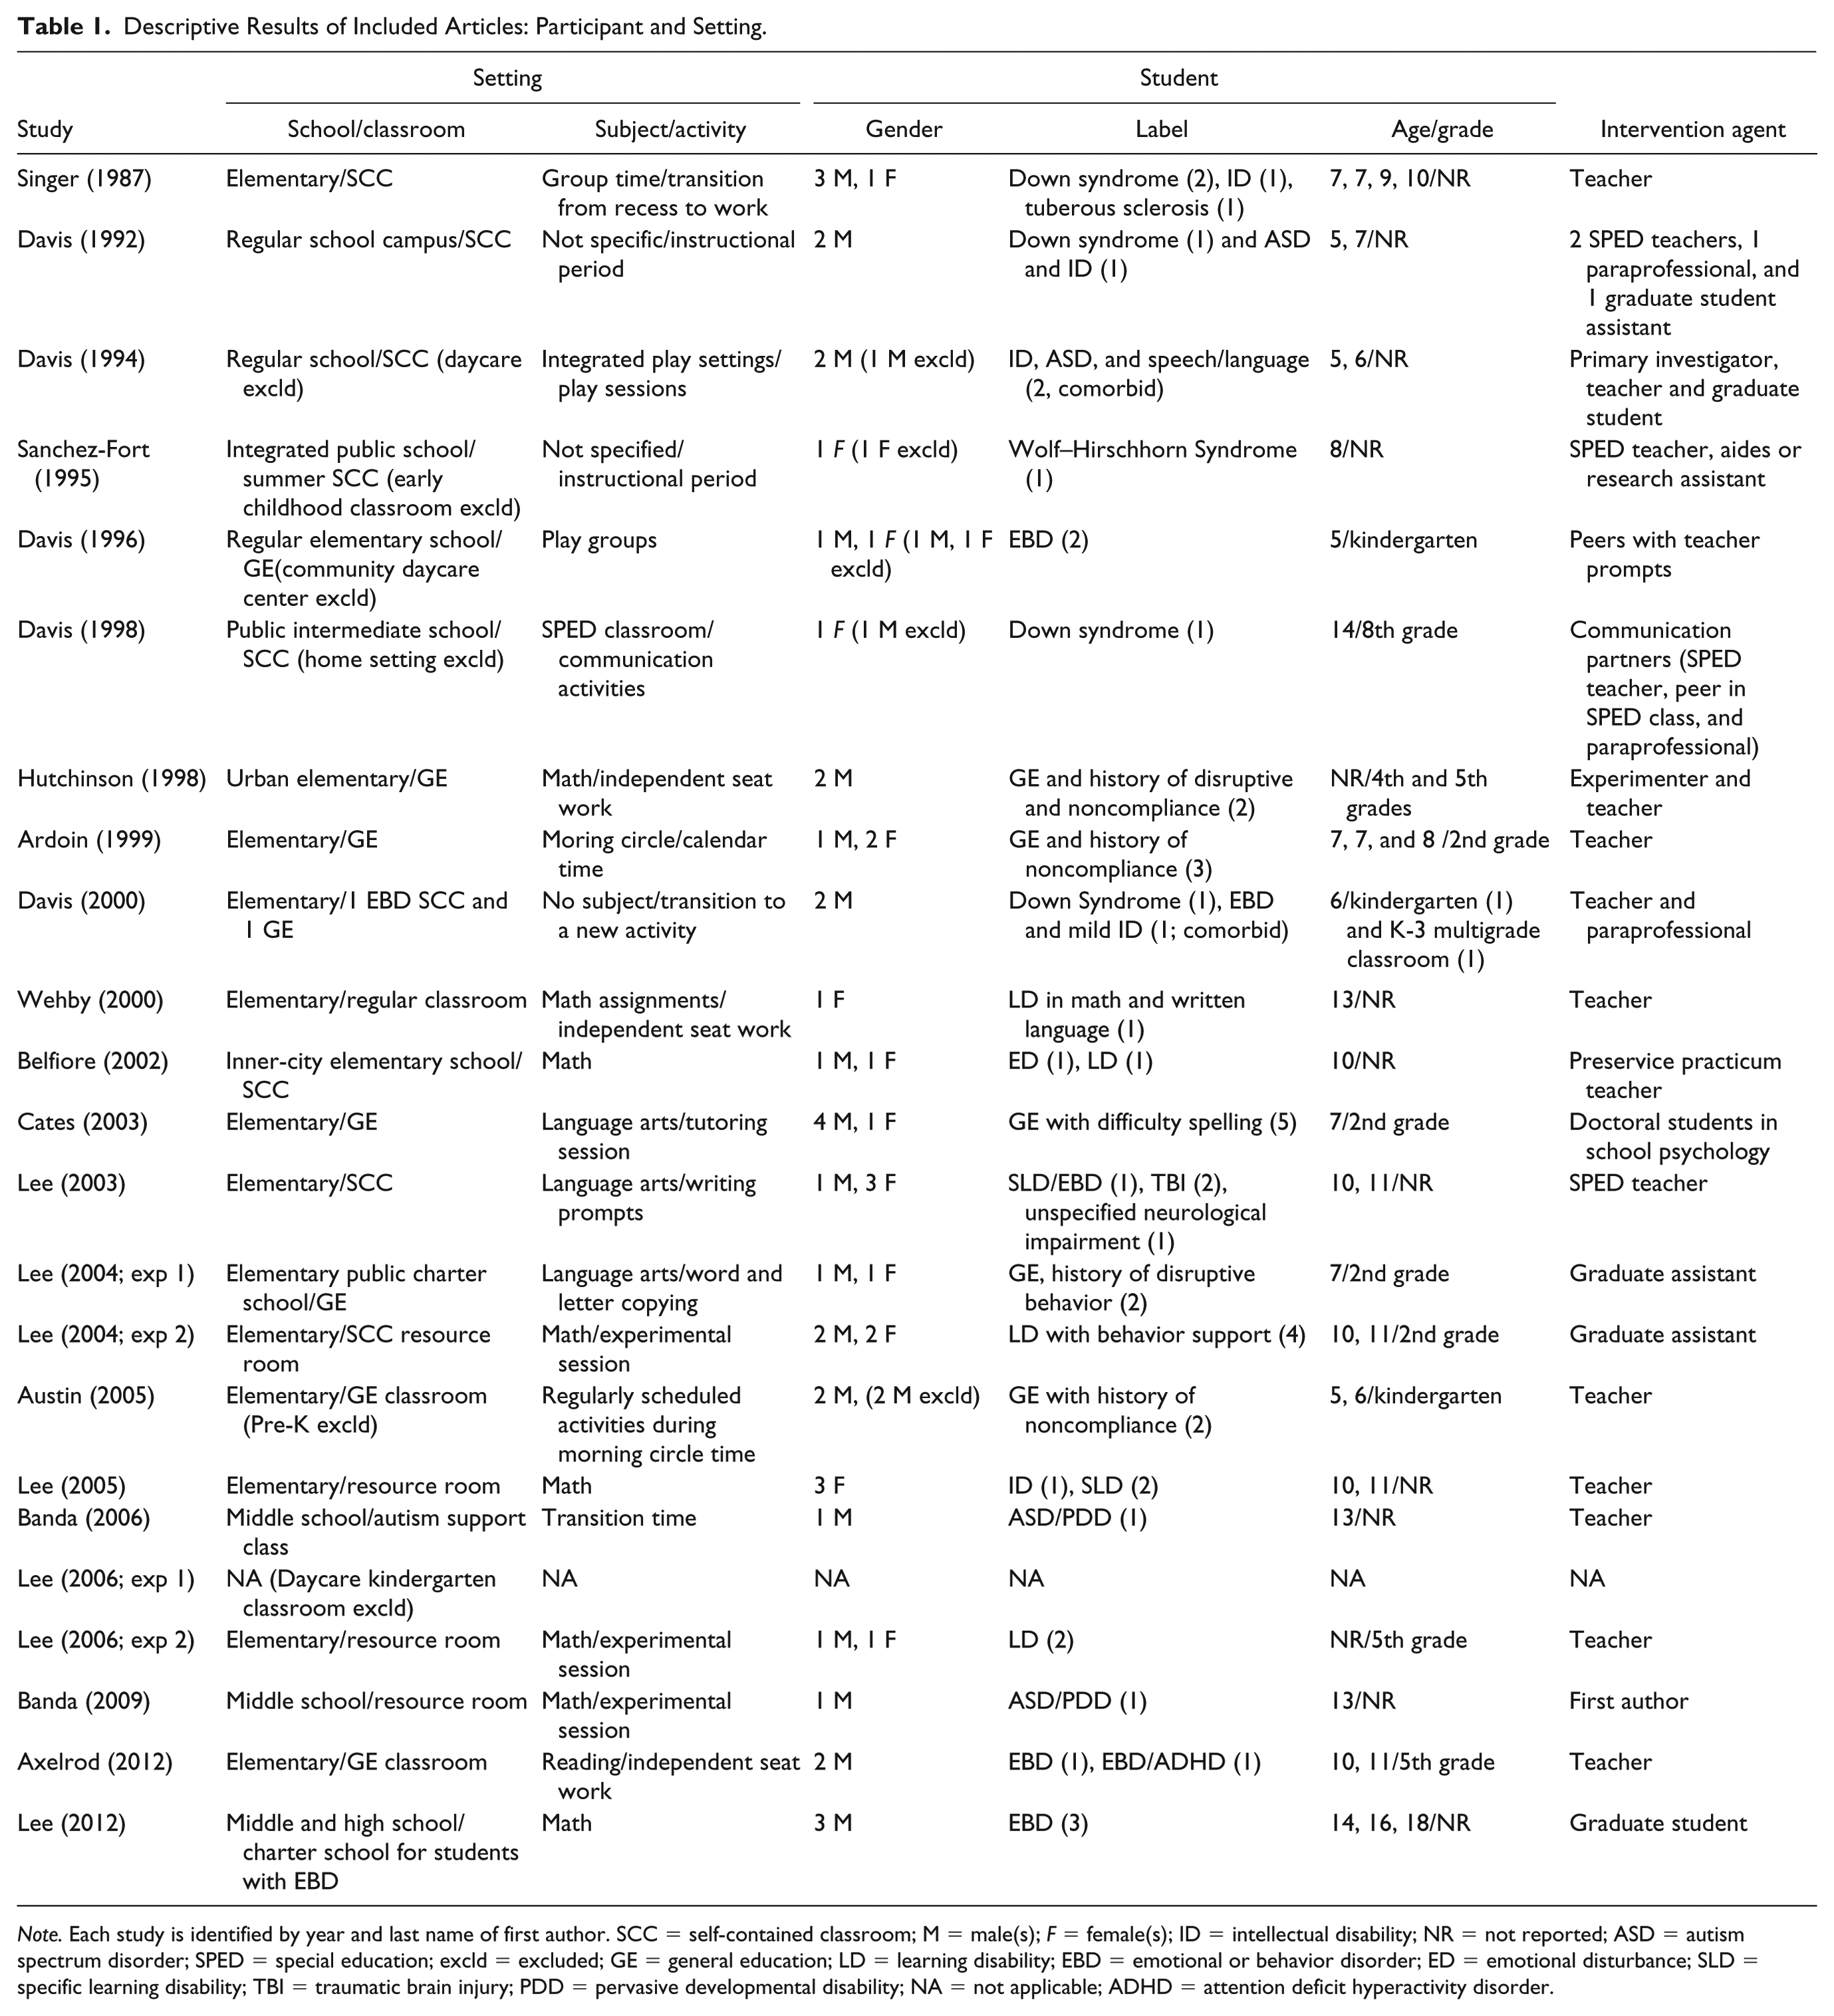
Note. Each study is identified by year and last name of first author. SCC = self-contained classroom; M = male(s); F = female(s); ID = intellectual disability; NR = not reported; ASD = autism spectrum disorder; SPED = special education; excld = excluded; GE = general education; LD = learning disability; EBD = emotional or behavior disorder; ED = emotional disturbance; SLD = specific learning disability; TBI = traumatic brain injury; PDD = pervasive developmental disability; NA = not applicable; ADHD = attention deficit hyperactivity disorder.
Descriptive Characteristics of Included Studies
A total of 51 students were included in this review. In total, 32 were males, with ages ranging between 5 and 18 years. Participants included students with and without disabilities across a range of settings including general education/inclusive classrooms, self-contained classrooms, and resource rooms. Ten students (19.61%) were identified as having an EBD (e.g., emotional disturbance), and an additional 13 students (25.49%) were identified with a history of challenging behavior (e.g., behavior plan in place, history of disruption). Subjects/activities targeted for use of HPRS included mathematics, transitioning to new activities, language arts, and classroom routines, among others. See Table 1 for descriptive results of included articles.
Methodological QIs
Results of the methodological quality appraisal (CEC, 2014) for HPRS are summarized below. We provide additional information reported in Table 1 (participants and settings) and Table 2 (study), as well as Figure 2 (visual representation across QI/components).
Descriptive Study Results.
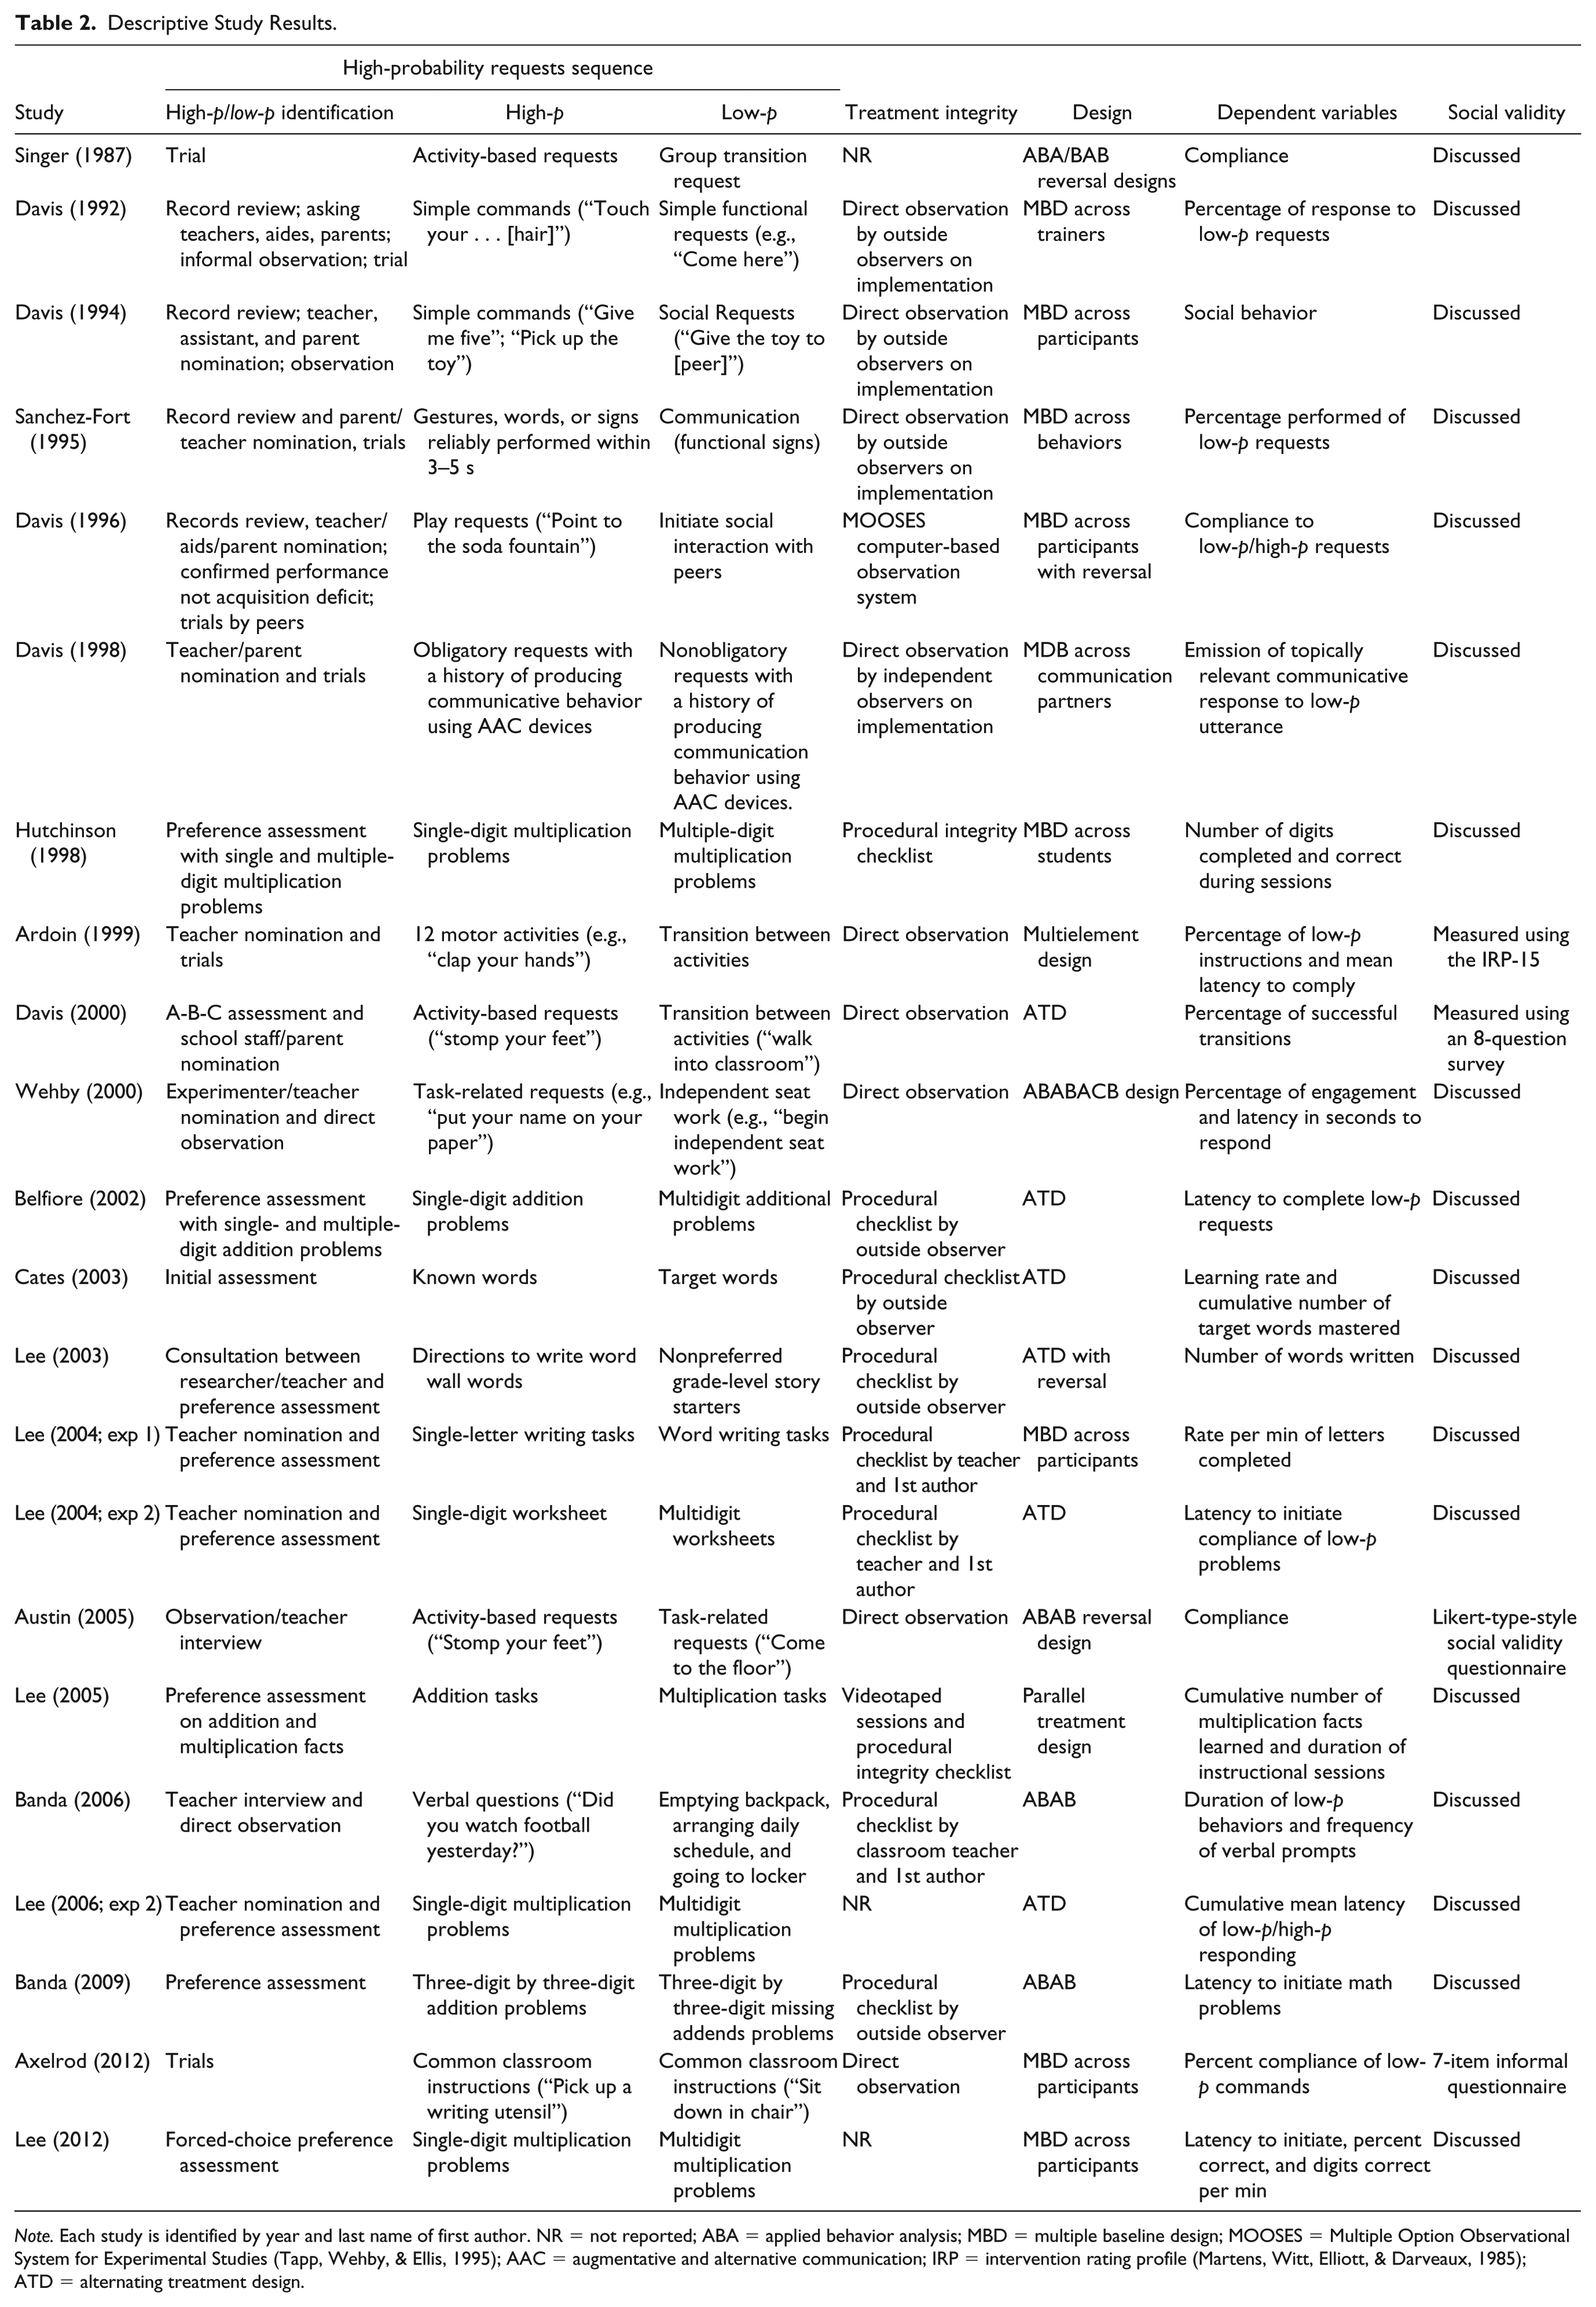
Note. Each study is identified by year and last name of first author. NR = not reported; ABA = applied behavior analysis; MBD = multiple baseline design; MOOSES = Multiple Option Observational System for Experimental Studies (Tapp, Wehby, & Ellis, 1995); AAC = augmentative and alternative communication; IRP = intervention rating profile (Martens, Witt, Elliott, & Darveaux, 1985); ATD = alternating treatment design.

Scatter box plot of quality idicators (Council for Exceptional Children, 2014) of included single-case design articles
1.0 Context and setting
All 22 studies met 1.0 Context and setting (100%). This included 1.1 Context/Setting description.
2.0 Participants
Nine studies met 2.0 Participants (40.91%). All studies met 2.1 Participant description (100%) and nine met 2.2 Participant disability/at-risk status (40.90%).
3.0 Intervention agent
A total of 10 studies met 3.0 Intervention agent (45.45%). Twenty studies met 3.1 Role description (90.90%) and 10 studies met 3.2 Training description (45.45%). Table 1 provides a detailed summary of reported intervention agents delivery of HPRS (e.g., educator, researcher). Example intervention training strategies included verbal instruction, role-playing, training to checklist of procedures, and procedures to identify and discriminate between high-p and low-p requests.
4.0 Description of practice
All 22 studies met 4.0 Description of practice (100%). This included 4.1 Intervention procedure description and 4.2 Materials description (100%).
5.0 Implementation fidelity
A total of 17 studies met 5.0 Implementation fidelity (72.72%). Nineteen studies met 5.1 Implementation fidelity assessed/reported (86.36%), 19 studies met 5.2 Dosage or exposure assessed/reported (86.36%), and 18 studies met 5.3 Assessed across relevant elements/throughout study (81.82%).
6.0 Internal validity
A total of 15 studies met 6.0 Internal validity (68.18%). Nineteen studies met 6.1 Independent variable systematically manipulated (86.36%), 22 studies met 6.2 Baseline description (100%), 21 studies met 6.3 No or limited access to IV during baseline (95.45%), 17 studies met 6.5 Three demonstrations of experimental effect (77.27%), 17 studies met 6.6 Baseline: minimum three data points and established pattern (77.27%; three employed a SCRD not requiring baseline [13.64%]), and 18 studies met 6.7 Controls for threats to internal validity (81.82%).
7.0 Outcome measures/dependent variables
A total of 16 studies met 7.0 Outcome measures/dependent variables (72.73%). All studies met 7.1 Socially important (100%), all studies met 7.2 Description of DV measures (100%), 21 studies met 7.3 Reports effects on the intervention on all measures (95.45%), 17 studies met 7.4 Measured repeatedly (minimum three data points per phase; 77.27%), and all studies met 7.5 Adequate interobserver agreement (100%).
8.0 Data analysis
A total of 20 studies met 8.0 Data analysis (90.90%). This included the component 8.2 Graph clearly represents outcome data (90.90%). Of the two studies not meeting 8.2, Lee, Belfiore, Scheeler, Hua, and Smith (2004) included a bar graph of the dependent variable and Lee, Lylo, Vostal, and Hua (2012) included a line graph for one of three dependent variables.
Classifying the Evidence Base
Using an absolute coding scheme (i.e., requiring that all components of a QI be met), the number of QIs met studies ranged from 2 to 8 (mode = 7; SD = 1.68) across studies. Two studies (9.09%) met all eight QIs across components (Davis, Brady, Hamilton, McEvoy, & Williams, 1994; Sanchez-Fort, Brady, & Davis, 1995). When using a weighted coding scheme (i.e., requiring ⩾80% components met), the number of QIs met ranged from 4.97 to 8 (M = 6.97; SD = 0.91). A total of 16 studies met our modified 80% criterion for methodological soundness (see Figure 2); of which, four studies included three or more participants and were categorized as either having positive (Cates et al., 2003; Lee et al., 2004; Lee & Laspe, 2003) or mixed/neutral (Lee et al., 2005) effects. With no studies demonstrating negative results and greater than 1:2 ratio of methodologically sound studies with three or more participants demonstrating positive effects (n = 13), HPRS in K-12 settings met CEC (2014) standards for a potentially evidence-based practice for increasing students’ low-p behaviors.
Effect Sizes
Between-case effect sizes
Of the 16 methodologically sound studies, no studies met the technical requirements for BC-SMD effect sizes. Three studies employed an alternating treatment design and one study employed a parallel treatments design. The remaining 12 studies had fewer than three cases.
Within-case effect sizes
Nine participants across six methodologically sound studies met the technical requirements for LRR effect sizes. The two most common reasons for case exclusion at the study level were employing a comparison treatment design and graphing a cumulative record. The two most common reasons for participant exclusion were (a) fewer than three data points within a condition to be contrasted and (b) zero or near zero responding within a condition. See Table 3 for more information.
Evaluation of Evidence Base and Eligibility to Calculate Effect Sizes.
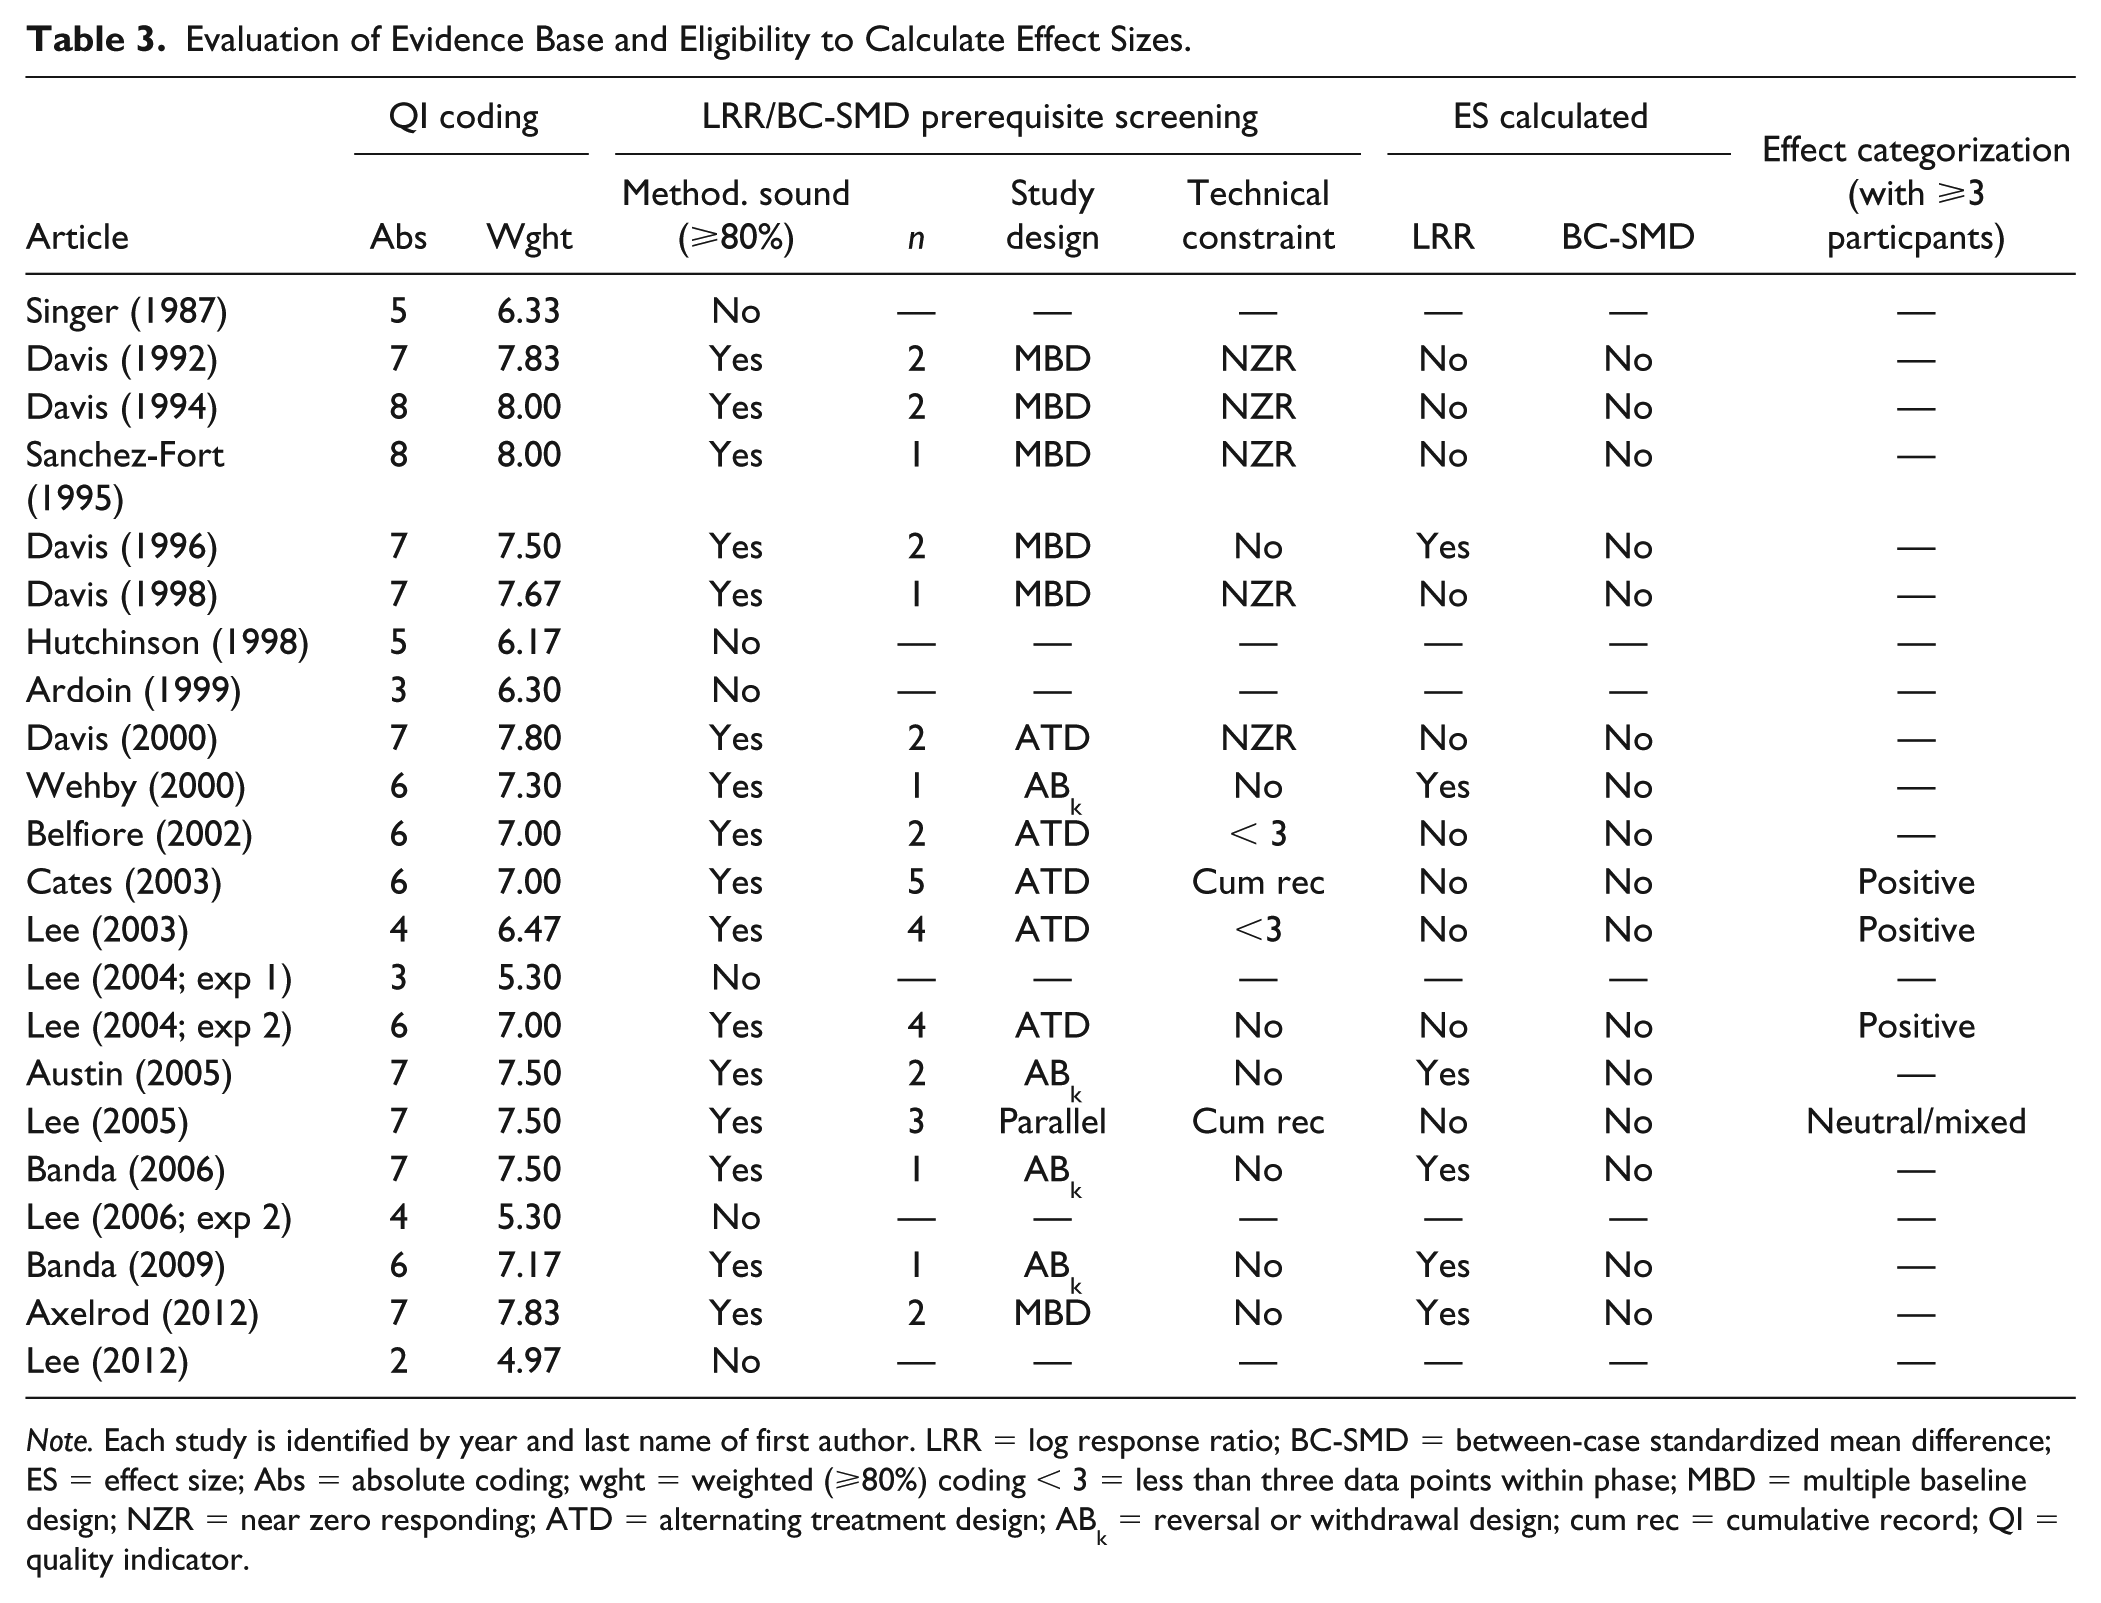
Note. Each study is identified by year and last name of first author. LRR = log response ratio; BC-SMD = between-case standardized mean difference; ES = effect size; Abs = absolute coding; wght = weighted (⩾80%) coding < 3 = less than three data points within phase; MBD = multiple baseline design; NZR = near zero responding; ATD = alternating treatment design; ABk = reversal or withdrawal design; cum rec = cumulative record; QI = quality indicator.
Four studies had a therapeutic direction associated with increasing students’ behavior (e.g., targeted for accretion). Davis and Reichle (1996) contrasted the effects of business as usual (baseline) and HPRS with high-p effects that varied (variance) to high-p requests that were consistent (invariance). Across two participants, high-p effects with varied variance demonstrated higher percentages of compliance to low-p requests (LRR = 1.45 and 1.48 or increases averaging >300.00%). Two studies examined the effects of HPRS increasing students’ compliance with low-p requests (Austin & Agar, 2005; Axelrod & Zank, 2012); across four participants, LRR estimates averaged 0.85 (SD = 0.29 or increases averaging 141.65%). Finally, one study (Wehby & Hollahan, 2000) targeted increasing students engagement; for one participant, LRR estimates suggest a 1.12 magnitude effect or increases in engagement by 204.96% between baseline and intervention. Conversely, two studies had a therapeutic direction associated with decreasing students’ behaviors (e.g., targeted for reduction). Banda and Kubina (2006) examined the number of prompts and duration to complete three low-p activities; for one participant, LRR was estimated at −0.51 (or −39.65% decreases) for number of prompts and −0.24 (or −21.34% decreases) for duration to complete low-p requests. Finally, Banda and Kubina (2009) examined the latency to initiate low-p requests; for one participant, LRR was estimated at −1.10 (or −66.71%). See Table 4 for more information.
Within-Case (Log Response Ratio) Effect Sizes for Methodologically Studies Meeting Methodological and Technical Requirements.
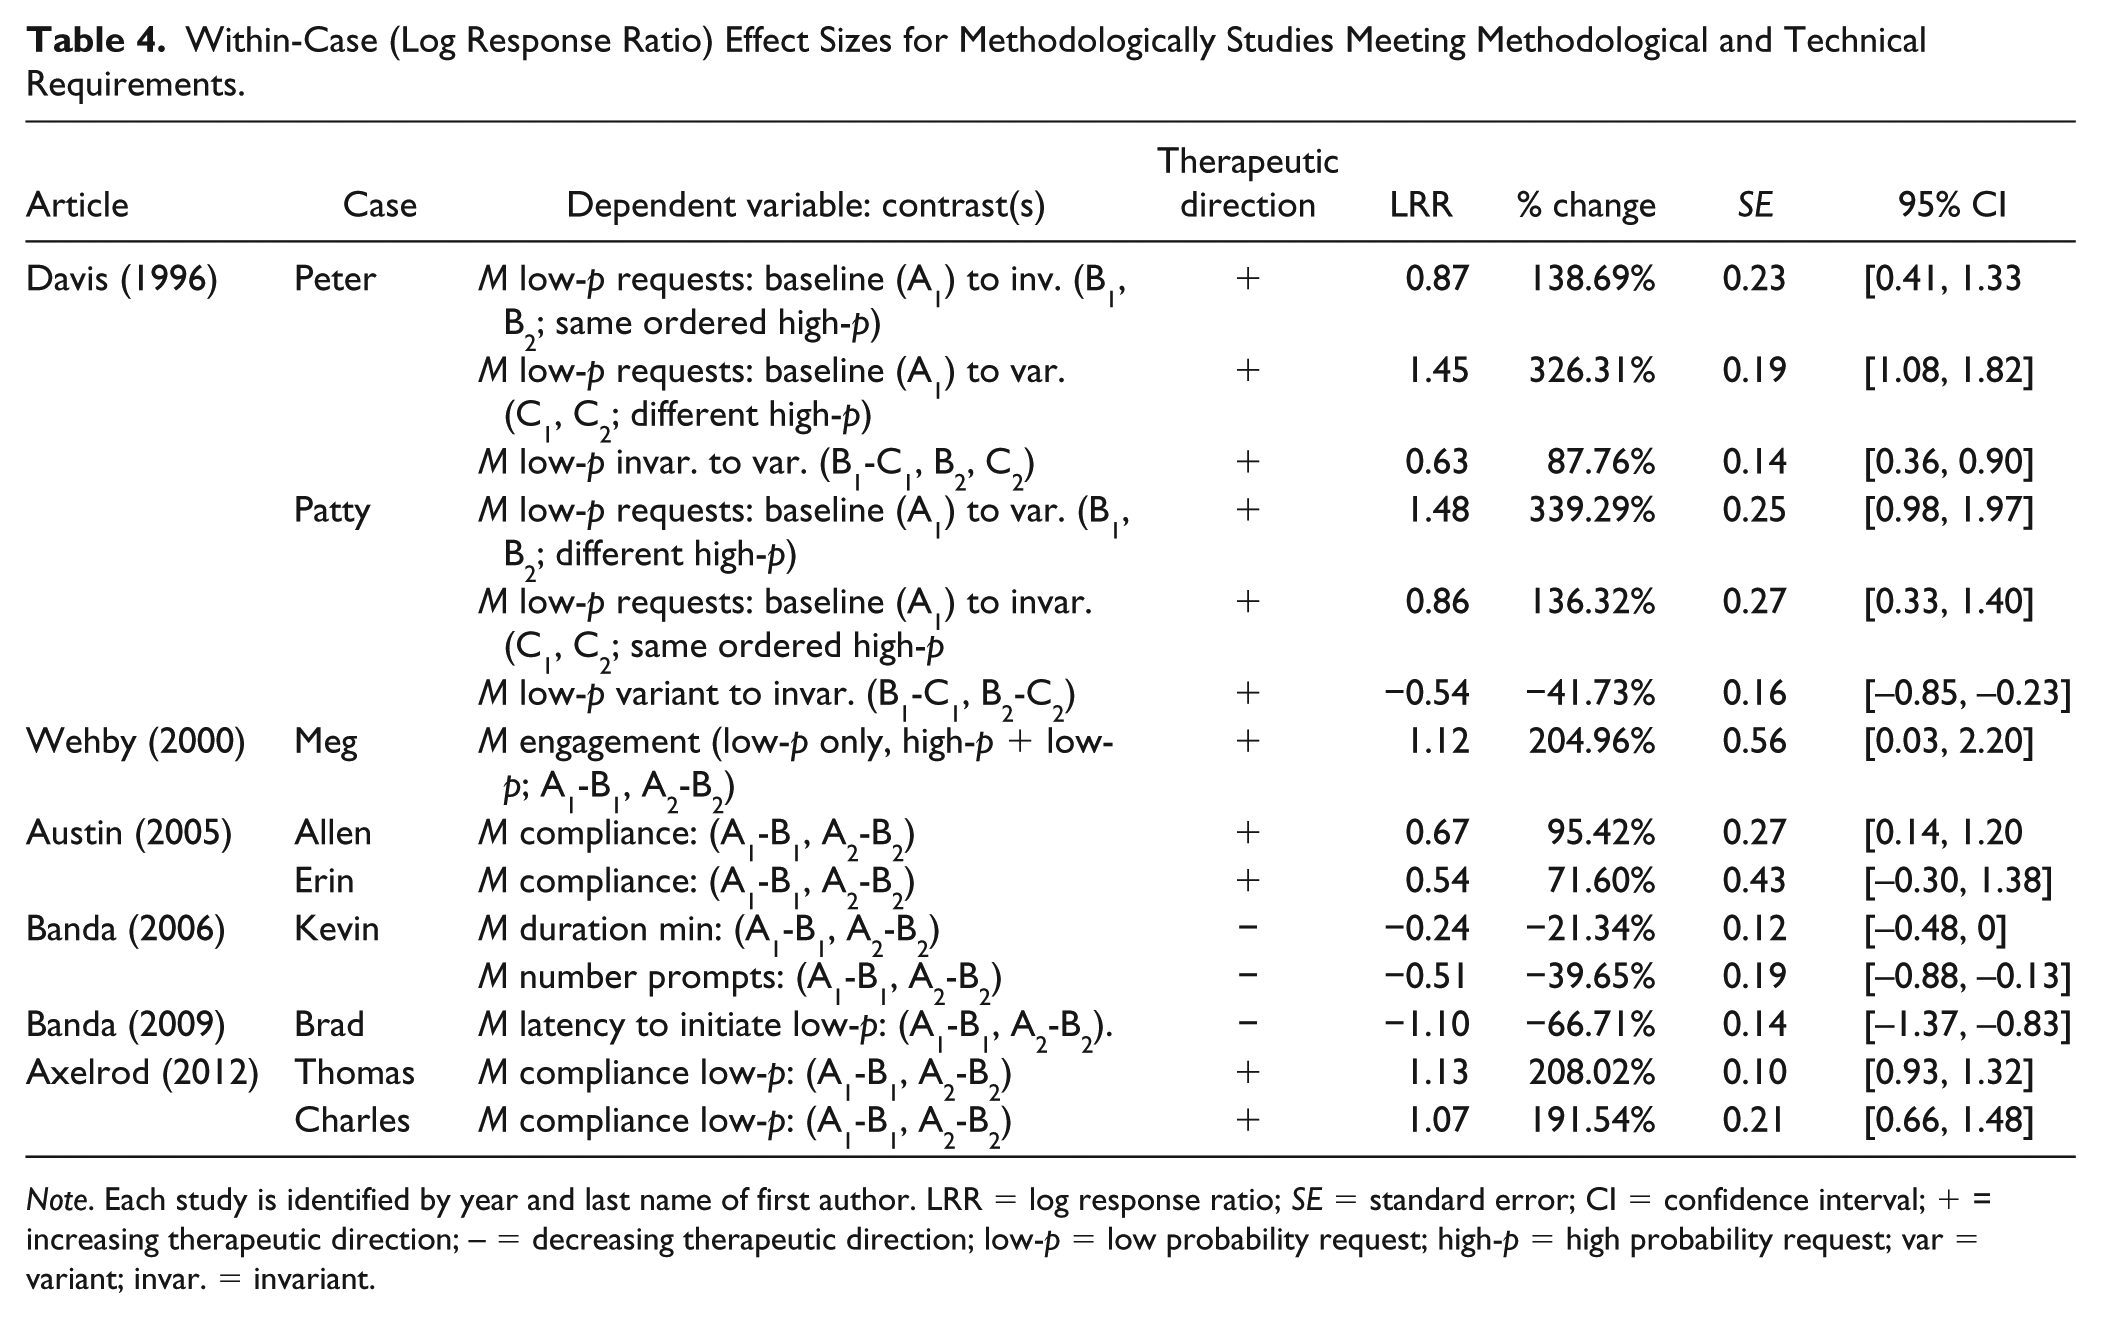
Note. Each study is identified by year and last name of first author. LRR = log response ratio; SE = standard error; CI = confidence interval; + = increasing therapeutic direction; – = decreasing therapeutic direction; low-p = low probability request; high-p = high probability request; var = variant; invar. = invariant.
Discussion
This systematic review of HPRS for use across traditional K-12 school settings used the CEC’s (2014) Standards for EBPs. We identified 22 studies that (a) evaluated the effects of HPRS, (b) evaluated student-level outcome data, (c) took place in a K-12 traditional school settings, (d) used an experimental single-case or group-comparison research design, and (e) were published in peer-reviewed journals. Two studies met all QIs outlined by CEC, but neither study included three or more cases. A total of 16 studies met a weighted criterion (i.e., 80% of the eight QIs; Lane et al., 2009), suggesting adequate methodological rigor to be deemed methodologically sound (Common et al., 2017; Royer, Lane, Dunlap, & Ennis, 2016). Of these articles, three studies established a functional relation across three or more cases, with a minimum of 75% of participants displaying therapeutic results (Cates et al., 2003; Lee et al., 2004; Lee & Laspe, 2003). Cates et al. (2003) increased students’ spelling mastery of target words mastered (low-p), although in this comparison design, both drill and practice and interspersal conditions were more efficient at reducing time to learn words in comparison to HPRS. Lee and Laspe (2003) increased students’ number of words written (low-p) through delivery of directions to write words on a word wall (high-p). Lee et al. (2004) decreased students latency to initiate compliance of multidigit worksheets (low-p) following single-digit worksheets (high-p). Thus, HPRS meets requirements of Standards for EBPs for a potential EBP when a weighted criterion was used (Lane et al., 2009). Across these studies, nine students (69.23%) were identified as having academic difficulties (with and without disabilities; e.g., emotional disturbance [n =1; 7.69%]; see Table 1), and four students (30.77%) were classified as having learning disabilities with behavior supports in place. Existing research does not yet support HPRS as a potential EBP for any specific population of learners or outcome area.
Although the classification of HPRS as a potential EBP is an important finding, we note there would have been insufficient evidence to classify HPRS if CEC’s (2014) absolute coding was used. These findings are similar to other reviews examining low-intensity strategies targeting student engagement (Ennis et al., 2017; Royer et al., 2017; Royer et al., 2016). For example, precorrection (Ennis et al., 2017) and teacher-delivered behavior-specific praise (Royer et al., 2016) have been determined to be EBPs using a weighted coding criterion but not with an absolute weighted coding scheme. Instructional choice was determined to have insufficient evidence to classify the evidence base utilizing a weighted coding criterion despite 12 studies (46.15% of all included studies) meeting the weighted coding criterion. Only two studies were eligible for study effect classification due to limited sample sizes (Royer et al., 2017). Across the low-intensity body of literature, and the SCRD literature broadly, there is a need to increase participant sample sizes while maintaining rigorous methodologies (Common et al., 2017).
In addition to classifying the evidence base of HPRS, we also sought to determine the magnitude of effect of methodologically sound studies. However, only six of these studies (37.50%) met methodological and technical requirements for LRR or BC-SMD (set a priori). For BC-SMD, no study met the technical requirements for BC-SMD. With LRR, 10 studies were excluded due to technical requirements: six because of design limitations (e.g., comparison designs) and four due to near zero responding within a condition. Other between-case and within-case effect sizes (e.g., within-case SMD) were not subsequently considered due to similar technical constraints (Zimmerman et al., 2018). Furthermore, overlap measures (e.g., PND) were not considered, as these numerical indices are not effect sizes and do not provide an equitable basis for comparing multiple SCRDs that vary on one or more of the following procedures: design type, number of data points within a condition, length of observation sessions, and type of recording system (Pustejovsky, 2018a; Zimmerman et al., 2018). As such, we were unable to adequately answer research questions related to this objective but were able to illustrate current conceptual and technical constraints associated with LRR and BC-SMD—two promising single-case effect size metrics.
Implications for Educators
This review found HPRS to be a potential EBP to support students’ responses (low-p requests) across a range of traditional school and various academic, behavior, and social outcomes. HPRS was also found to be adaptable in targeting students’ multiple needs across diverse domains. For example, all the methodologically sound studies with three or more participants supporting HPRS as a potential EBP examined academic outcomes. Cates et al. (2003) employed HPRS to support students’ acquisition of target words, Lee et al. (2004) employed HPRS to improve students’ rate of completing single-letter writing tasks, and finally Lee et al. (2005) supported students’ acquisition of multiplication math facts. In addition to these methodologically sound studies with three or more participants, methodologically sound studies with fewer than three participants supported students’ compliance to teacher directions (Austin & Agar, 2005), transitioning across activities (e.g., Davis, Reichle, & Southard, 2000), responding to social requests (Davis et al., 1994), and communication behaviors (Sanchez-Fort et al., 1995).
Implications for Researchers
Given the dearth of methodologically sound studies that included students with EBD, future research is needed to replicate methodologically sound HPRS studies for specific population of learners and particular outcome areas. Across this body of literature, only two QIs (1.0. Context and setting, 4.0. Description of a practice) and only eight of the 22 QI components within the Standards for EBPs were addressed by all studies. Across this review, there were areas where methodology and reporting could have been strengthened. For example, 2.2 Participant disability/at-risk status and QI 3.2 Intervention agent training were the least frequently addressed components. When studies reported participating students were identified by teacher nomination, it is important to operationalize the nomination process to ensure the study can be replicated with precision in future research and generalized to authentic classroom settings as part of regular classroom practices (Sreckovic, Common, Knowles, & Lane, 2014). Similarly, describing intervention-agent training, as well as how the criterion for interventionist training was achieved (e.g., check for understanding, role-play demonstration), is important to confirm all intervention agents are adequately trained to implement the intervention with fidelity (Ennis et al., 2017).
Moderate variability was noted in the extent to which researchers protected against threats to internal validity (e.g., lack of treatment integrity reporting, experimental designs without three demonstrations of experimental effect). This may be due in part to studies emphasizing the theoretical mechanisms of behavior momentum (e.g., reinforcement density) as utilized in behavior change procedures (e.g., HPRS), more so than the efficacy of HPRS (e.g., Lee et al., 2006; Lee et al., 2004). For example, Lee et al. (2004) explored the principle of reinforcement as an additive effect on rate of responding to low-p tasks. HPRS plus a token economy was found to be more successful in decreasing students’ latency to respond to academic task demands in comparison to HPRS without tokens. Next, Lee et al. (2006) explored the utility of measuring time from the end of a low-p task to the initiation of a subsequent high-p tasks as opposed to the more traditional methods of evaluating HPRS using frequency of compliance of latency to initiate low-p requests. They found latency from high-p to low-p tasks was shorter than the latency from low-p to subsequent high-p tasks. These studies illustrate how not all included studies in this review can be considered traditional efficacy studies only examining the cause and effect relation between HPRS and student outcomes, but also explore the theory of behavior momentum in applied settings and evaluate the utility of various measurement systems
Limitations and Future Directions
We encourage readers to consider the following limitations and future directions for inquiry when interpreting findings from this review. First, two studies met all QIs outlined by CEC, but neither study included three or more cases. Therefore, had absolute coding been used, insufficient evidence to classify HPRS as a potential EBP would have been found. Second, our synthesis of studies may be limited in scope due to the omission of theses and dissertations, which may have included studies that reported null outcomes and/or included methodological decisions that may have prevented them from achieving publication (i.e., file drawer problem; Rosenthal, 1979). Consistent with recent reviews evaluating the evidence base of other low-intensity strategies (e.g., Ennis et al., 2017), this decision was guided by the notion that although such work is often high quality, it has not been thoroughly vetted using a peer-review process outside of the university setting. It is possible this choice could have introduced systematic bias representing the methodological rigor of included studies (Cook & Therrien, 2017). Future reviews should include book chapters, theses, and dissertations.
Third, IRA across visual analysis of methodologically sound studies with three or more cases was low (75%). Across four studies, there was agreement for three studies. Cates et al. (2003) conducted a comparison research design, with HPRS demonstrated as being less efficient. Across coders, one rated this as positive and another as mixed (as it was neither more efficient nor counter-therapeutic). Through a consensus model, it was agreed this represented positive effect because HPRS lead to positive gains in cumulative learning and cumulative learning rate although its data path was lower in trajectory in comparison with the data paths of alternating treatments. In future practice, visual analysis coders would benefit from reliability training to criterion, similar to procedures implemented before QI coding.
Fourth, of the 16 studies identified as being methodologically sound utilizing an 80% or higher criterion, only six studies (38%) met the technical requirements of LRR and no studies met the BC-SMD requirements effect sizes. Across these six studies, LRR estimates were calculated for nine participants, or around 25% of participants represented in methodologically sound studies. To date, no single metric for SCRD has been universally adopted by the field of special education in terms of robustness and versatility to support the full range of SCRD (Pustejovsky & Ferron, 2017). Most systematic reviews and meta-analyses examining HPRS to date have quantitatively synthesized outcomes utilizing PND, a nonoverlap parametric rather than single-case effect size. Ledford and Gast (2018) recommended nonoverlap parametric, such as PND, should be used with caution as an effect size and thus were not calculated in this study. Future methodological research is necessary to establish effect sizes that are both technically acceptable and flexible enough to be used across a range of research designs, sample sizes, and measurement systems (Common et al., 2017).
Fifth, the majority of studies occurred in elementary and middle school with few studies implemented in high schools. We recommend further research at the secondary level to evaluate the efficacy on antecedent strategies, such as HPRS, in high schools. Finally, although the majority of intervention agents across studies were classroom teachers, it is still unknown to what extent classroom teachers can implement HPRS with minimal to no support. In this review, less than half of all studies described intervention agent training and to what extent training was achieved. Furthermore, researchers contributed significantly to the identification and generation of high-p and low-p requests, many of whom assessed the preference or probability students complied with each request. Future research should document the (a) ease in which educators can identify such requests with minimal support and (b) importance of documenting the probability of high-p and low-p tasks.
Summary
Our goal was to classify the evidence base of HPRS across the K-12 continuum following recommendations set forth by CEC’s (2014) Standards for EBPs utilizing a modified criterion to identify methodologically sound studies (Lane et al., 2009). Of the 22 included studies, two studies met all eight QIs and 16 studies met or exceeded 80% or more of the QIs following a weighted coding scheme. Both visual analysis, and when available, within-case LRR effect sizes demonstrated therapeutic shifts to either (a) increase students’ compliance to complete low-p requests, number of words written, and engagement or (b) decrease students’ latency to begin low-p requests, latency to complete low-p requests, and number of prompts. Examination of this body of evidence found HPRS in K-12 school settings to be a potential EBP, improving academic engagement behaviors (e.g., completing low-p academic requests) for students with academic and/or behavior difficulties. Across the 22 included studies, HPRS was implemented across a range of traditional school settings to support students’ academic, behavior, and social needs. Professionals can consider HPRS as a viable intervention to support student success in school.
Footnotes
Declaration of Conflicting Interests
The author(s) declared no potential conflicts of interest with respect to the research, authorship, and/or publication of this article.
Funding
The author(s) received no financial support for the research, authorship, and/or publication of this article.